 Mohammad Royvaran1
 Onur Avci
- 1McNamara-Salvia Inc. Consulting Engineers, Boston, MA, United States
- 2Civil, Construction and Environmental Engineering, Iowa State University, Ames, IA, United States
- 3Department of Civil Engineering, University of Kentucky, Lexington, KY, United States
The effect of partition walls and non-structural elements on the dynamic response of floors is still not well understood, and there is a need for vibration testing of floors at various stages of construction. The best way to shed some light on the effect of non-structural components is to test additional floors (preferably the same floor) before and after the installation of non-structural elements and compare the dynamic properties. For that purpose, the authors conducted vibration testing on a building floor under construction at various stages of fit-out to quantify the effects of various non-structural elements on the vibration response. An elevated floor of a steel-framed building in the Southeastern United States was tested: the first test was performed for the bare slab conditions with minimal non-structural elements, while the second test was conducted after the installation of non-structural components and in the presence of various construction materials spread over the test floor. The modal tests were conducted by applying measured dynamic forces using an electrodynamic shaker while accelerations were measured at critical locations on the slab. The measurements were post-processed to determine the frequency response functions, which provided general information on the dynamic response. The selection of the test points and excitation functions were primarily to extract maximum data regarding the performance of non-structural elements rather than as part of a standard vibration serviceability assessment of the floor structure. The modal tests were repeated after the installation of non-structural components, electrical and mechanical ductwork, to determine their effect on the vibration characteristics of the floor. The resulting frequency response functions were compared for each condition, and finite element models were created to represent each test condition. As a result, the installation of non-structural components was observed to influence the dynamic response of the floor. Combined with the other test data in the literature, the results of the experimental testing presented in this paper might lead to more effective modeling techniques and provide guidance as to their inclusion into analytical models.
1 Introduction
As the modern and slender architectural designs have resulted in lightly damped structures, the civil structural systems have become more vulnerable to vibrations (Celik et al., 2016; Catbas et al., 2017; Do et al., 2018; Muhammad et al., 2018). While floor vibrations serviceability has gained more attention for elevated building floors over the decades (Živanović et al., 2007; Racic et al., 2009; Díaz and Reynolds, 2010a; Díaz and Reynolds, 2010b; Díaz et al., 2012; Racic et al., 2013; Muhammad and Reynolds, 2019), there are still important aspects that need to be further researched both analytically and experimentally (Barrett et al., 2006; Avci, 2015; Shahabpoor et al., 2017; Younis et al., 2017). A typical example of these aspects is the presence and effect of partition walls or non-structural components on the floor vibration response. Even though there are a number of experimental and analytical studies on the topic (Pernica, 1987; Novak, 1993; Smith and Vance, 1996; Willford et al., 2005), it has been debated that valid and practical modeling techniques have not yet been developed for non-structural partitions (Petrovic and Pavic, 2011). On another note, as a result of extensive analytical and experimental studies, it is being discussed by experts in the field that existing design guidance could be improved in an attempt to enhance the floor vibrations serviceability assessments (Muhammad and Reynolds, 2019). As such, there is an agreement that additional studies would always add to the existing know-how and pave the way for the inclusion of more specific guidance on non-structural components on existing serviceability guidelines.
The related work on non-structural components include the work by Miskovic et al. (2009), who performed an experimental and numerical study on the modal properties of two structurally identical floor systems (one above the other in a multi-story structure) and they found that the floors had different dynamic characteristics since each floor had a different layout of partitions. It was also reported that the FE models without partitions underestimated the measured natural frequencies by about 25%, depending on the floor level. In the FE models, when the full-height non-structural elements and partitions were modeled as vertical springs, the correlation between the FE model and experimentally measured values was reported to improve significantly.
Devin et al. (2015) and Devin et al. (2016) investigated the stiffening effects of non-structural partitions and cladding on the vibration response of floor systems. Experimental and analytical work was conducted on two nominally identical floors before and after the installation of internal partitions and external cladding panels. Even though the dynamic properties of both floors were very similar prior to non-structural attachments, it was found that the natural frequencies increased by 30% after the installation of non-structural elements. In addition, the stiffness of both floors increased at various levels depending on the layout of partitions on and below each level. The effect of partitions was reflected by vertical elastic spring elements on the FE models, and it was reported that based on the specific type of cladding and partitions considered, the vertical stiffness provided by the cladding was almost twice the vertical stiffness provided by the partitions.
The partition walls are not in place in the early stages of the construction as their installation always follows the erection of structural elements. The dynamic condition of a floor system before and after the installation of non-structural components would be better understood if experiments were performed in various construction stages of the same floor system. For pre- and post-installation of non-structural components, the authors tested an elevated steel-framed floor system in the Southeastern United States to determine the effect of non-structural components on the vibration response of the floor. While the initial test was conducted with the presence of minimal non-structural elements (bare slab conditions), the follow-up tests were performed after the installation of drywalls, partitions, and electrical and mechanical ductwork. Experimental modal analysis (EMA) was conducted with the same protocols for both conditions and identical accelerometer locations using an electrodynamic shaker for dynamic excitations. Frequency response functions (FRFs) were then compared for both conditions focusing on the effect of non-structural components rather than focusing on items that are common concerns for typical floor vibration serviceability evaluations. In addition to experimental comparisons, finite element models for both conditions were generated, studied, and compared to determine the differences in both testing conditions.
While published work on the effects of non-structural components on the dynamic properties of the floors is not plenty, combined with the other test data in the literature, the results of the study presented in this paper might lead to more effective modeling techniques and provide guidance as to their inclusion into analytical models.
2 The Test Building
This paper is focused on evaluating the effect of partition walls and other non-structural elements on the vibration response of steel-framed floors. To achieve this objective, a floor of a building was tested during various stages of construction. The photo, elevation, and three-dimensional view of the tested building are shown in Figure 1. The FRFs were measured for each scenario; FE models were created and updated to represent both pre- and post-installation of non-structural components. The experimental work includes experimental modal testing with an electrodynamic shaker and walking excitations.
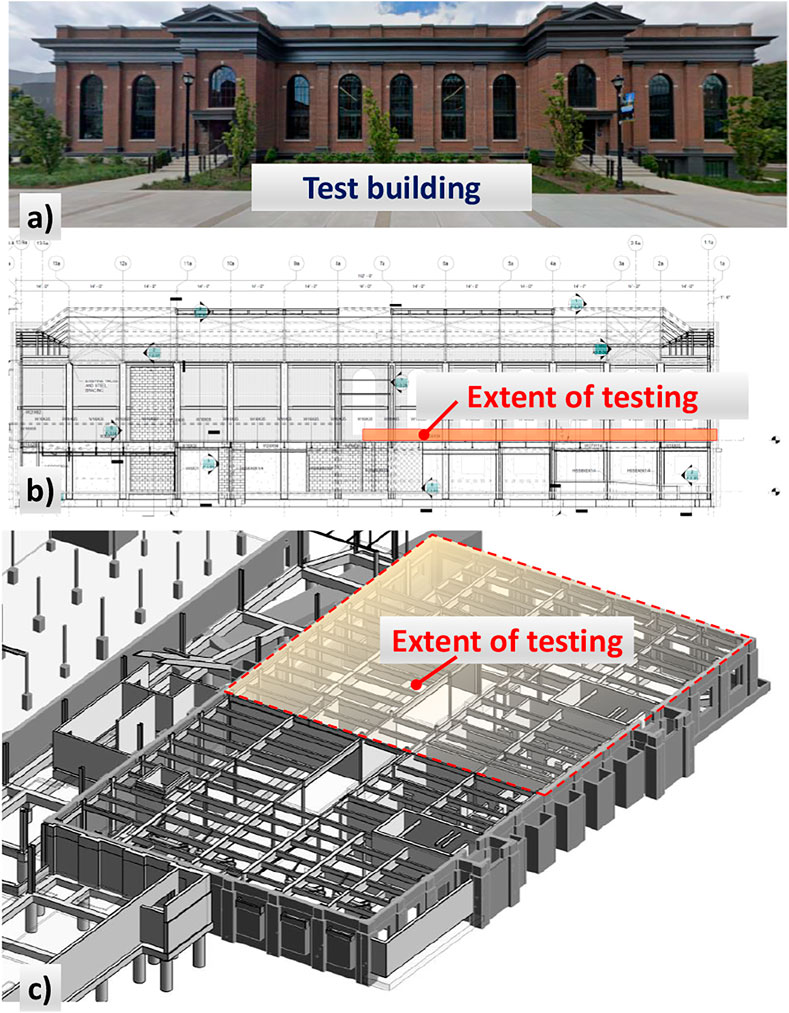
FIGURE 1. The test building and extent of testing.
While the tested floor is an elevated floor, as shown in Figure 2A, Figure 2B shows the architectural plan view for the level showing the extent of the tested area directly below the testing level. Figure 2B also shows the major drywall and concrete masonry unit partitions to be installed under the tested area. The partial structural plan of the tested floor is shown in Figure 2A. The test level houses exercise areas and has minimal partitions and other non-structural elements on it. The total composite slab thickness is 165 mm (6.5 in.) with a 51-mm (2-in.) steel deck for this level. After shaker tests, walking excitations tests were performed on the structure.
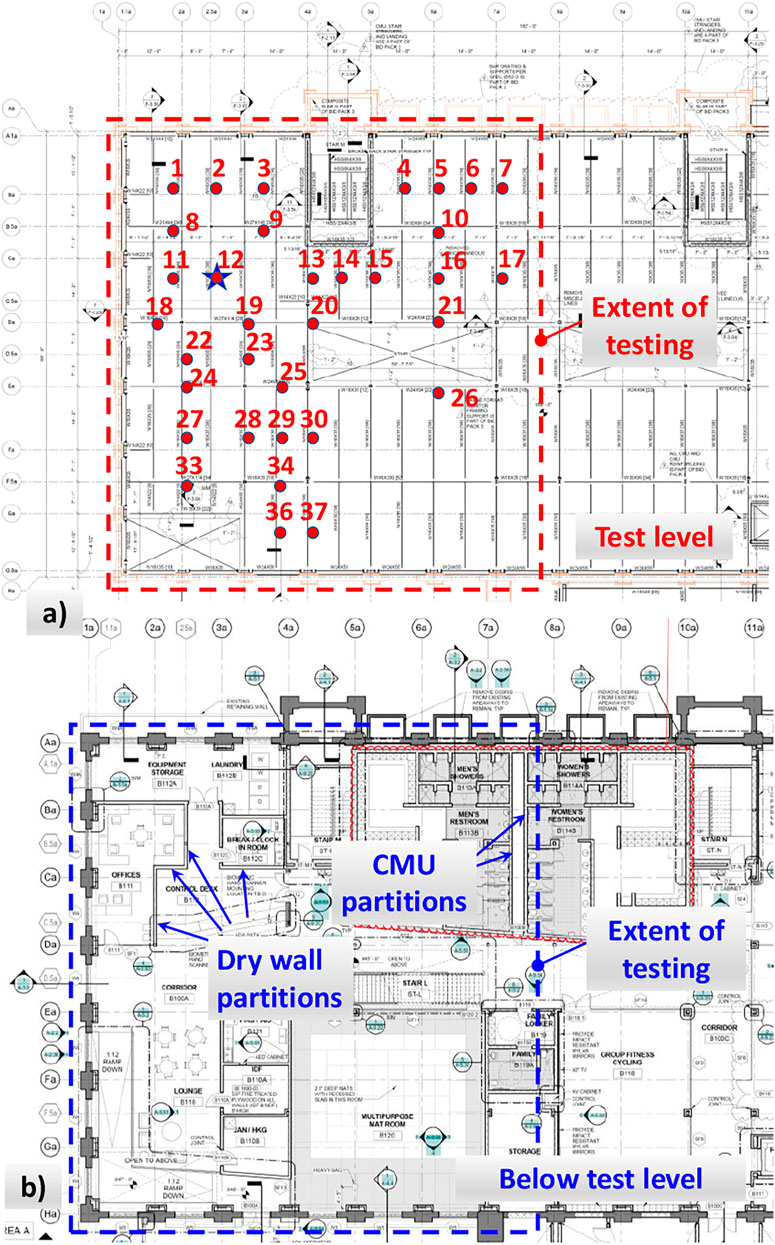
FIGURE 2. Extent of testing on the (A) test level and (B) below test level.
3 Dynamic Testing of the Floor Before the Installation of Drywalls, Partitions, and Electrical/Mechanical Ductwork (bare Slab Conditions)
The “pre-installation” condition was tested dynamically with a shaker in an attempt to characterize the dynamic properties of the test level. For this round of tests, the floor is in a mostly bare slab condition, as shown in Figure 3. This is because practically no suspended mass, electrical, mechanical, architectural components or drywall/partitions were connected to the floor from below, and there were minimal construction materials present on the tested area during the tests (for the next round of tests performed a few months later, there were various non-structural elements installed from below and above the test floor, and various construction materials/equipment were present on the test floor).

FIGURE 3. Bare slab conditions: (A) view from below; (B) view at the test level.
The dynamic properties of the floor were determined by EMA. For dynamic excitations, a shaker placed on a force plate was used. The force plate enabled measuring the force applied on the floor by the shaker. As a result, dynamic properties were determined for each mode. The type of the electrodynamics shaker was Model 400 (APS Dynamics Electro-Seis), as shown in Figure 4A. Burst chirp excitation was applied through the shaker, simply a sinusoidal function with almost constant amplitude but continuously varying frequency values between 5 and 20 Hz at Location 12 (shaker location for all stages of tests), as shown in Figure 2A. The vertical accelerations at the shaker point and additional 36 key locations were measured using PCB Model 393C accelerometers. Accelerometers were bolted to aluminum plates with a three-point bearing to guarantee no rattling (Figure 4B).
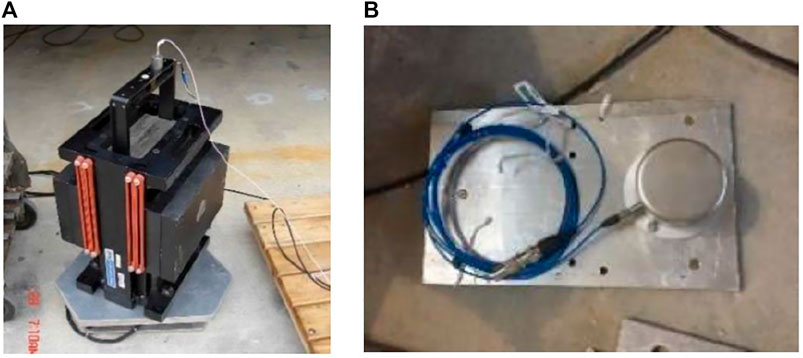
FIGURE 4. (A) Electrodynamics shaker. (B) Accelerometer.
Acceleration data were collected at a 2,048-Hz sampling frequency. OROS 35 digital signal analyzer was used for the analysis. The force amplitude was selected to cause peak accelerations almost equal to those expected (about 0.5%g). As an indicator of the quality of the FRFs, that was approximated by
The input and output signals are assumed not to contain any noise in an ideal test. In the absence of any noise in the acceleration signal, the coherence value is 1.0 in theory, leaving the FRF as the ratio of the system output,
While the actual data will always contain noise or uncorrelated content in input and output, in the vicinity of resonant frequencies, the noise in the acceleration response becomes significant. Therefore, achieving an accurate FRF is almost always a challenge. Multiple input and output datasets are averaged for the formation of FRFs, corresponding correlation functions are generated, and they have translated into power spectral densities (PSDs). The magnitudes of the FRS are then computed by using PSDs.
The FRFs are also introduced as the ratio of “cross-spectrum of excitation and response”,
On another note, the ratio of the auto-spectrum of the response
here,
In this format, for
Commercial signal analyzers predominantly display
where,
Meanwhile, for velocity measurements, the following function is called Mobility:
Even though the phase information is the same for
Lying between 0 and 1,
For the EMA of the bare floor conditions, the floor surface is almost free of any objects, and practically no suspended mass was present, and minimal construction-related objects were present on the floor during the tests. The armature weight was 26 kg (57.4 lb) for the electrodynamics shaker used in the vibration testing. One accelerometer was located on the armature to record acceleration generated by the shaker (Figure 4A), while the second accelerometer was kept on the floor right next to the shaker (Figure 4B). Three roving accelerometers were used to cover the extent of the testing area with multiple tests, changing the location of the roving accelerometers after each set of data collection. The data collection points on the floor are shown in Figure 2A, where the shaker location was Location 12 on the same figure. The driving point FRF magnitude at this point is shown in Figure 5. The FRF indicates a responsive natural frequency at 12.45 Hz, which places the floor into the “high-frequency floor” category.
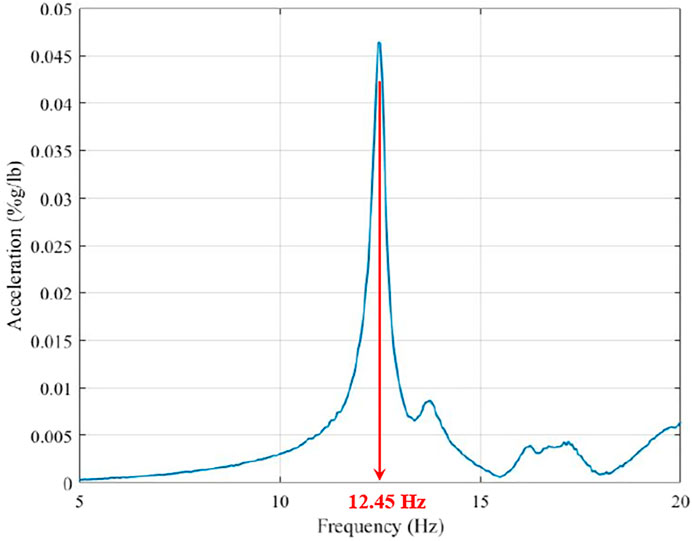
FIGURE 5. Driving point FRF magnitude measured for the bare slab configuration (Location 12).
Walking tests were conducted, and floor accelerations were recorded at Location 12 while one person walked along a walking path. The walker attempted to match a metronome set at specific step frequencies in steps/min. Tests were repeated to account for intra- and inter-subject variability of walking forces. A member of the experiment team walked across the bay during several (at least three) tests, and another team member walked during subsequent tests. Acceleration time-history measurement durations were 20 s; therefore, the narrowband spectrum frequency resolution was 0.05 Hz. The one-third octave spectrum was obtained for each test by bandwidth conversion from the narrowband spectrum as described in Vér and Beranek (2005). For the bandwidth conversion, each narrowband spectral acceleration is converted to a narrowband spectral velocity. This is done by simply dividing the spectral acceleration value by its center frequency. Then, the velocity in each one-third octave band equals the square root of the sum of the squares of narrowband spectral velocities in the band. Figure 6 shows the acceleration waveform, narrowband acceleration spectrum, and one-third octave velocity spectrum, for example walking test. As expected, the waveform shows no resonant build-up, and the maximum spectral peaks are near the natural frequency. The summary of walking tests for bare slab configuration is shown in Table 1.
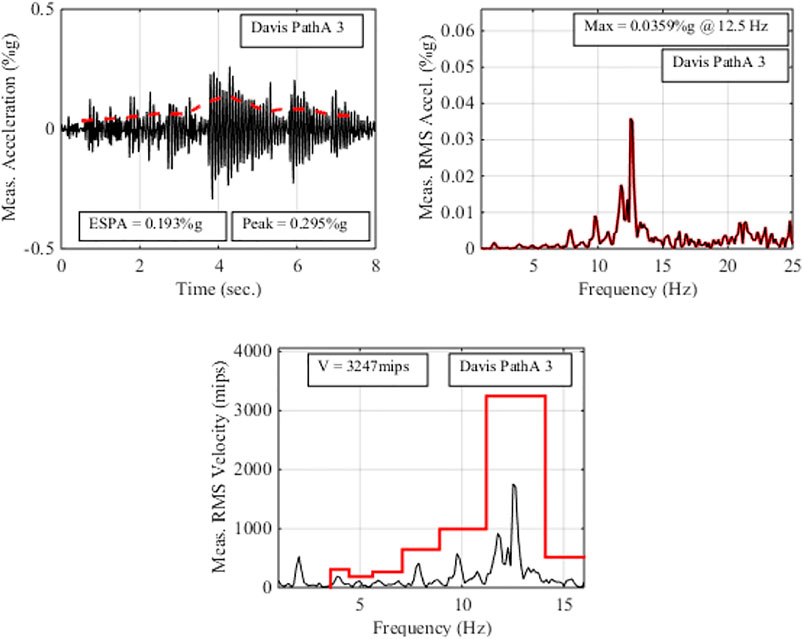
FIGURE 6. Example walking test results—bare slab configuration.

TABLE 1. Summary of walking tests—bare slab configuration.
3.1 FE Modeling Using SAP2000
An FE model of the floor was developed and created in SAP 2000. The composite slab was modeled using orthotropic shells with stiffnesses computed using the dynamic modulus of elasticity of concrete. Beams and girders were modeled using transformed sections in the plane of the shells, as shown in Figure 7. Modeling assumptions are as described in Chapter 7 of the AISC Design Guide 11 (Murray et al., 2016). Natural modes were predicted using typical linear eigenvalue analyses. FRF magnitudes were computed via the “Steady State Analysis” option available in SAP2000. Figure 7 shows the predicted natural mode shapes on the plan view generated by SAP2000.
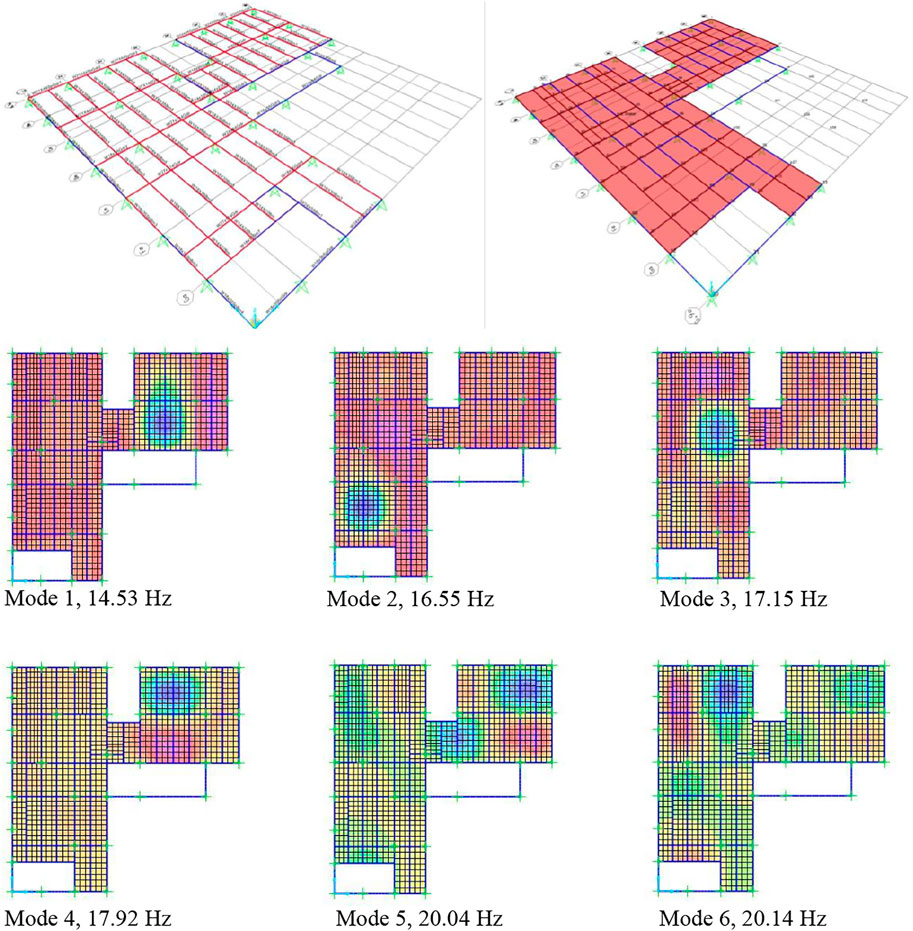
FIGURE 7. The FE model and the predicted mode shapes (bare slab configuration).
Figure 8 shows the driving point FRF comparison (Location 12) between the measured FRF and the FE model FRF. While the measured frequency is 12.45 Hz, the FE model prediction is 17.15 Hz (reflecting the Mode 3 frequency in Figure 7). Based on Figure 8, it is observed that the FE model over-predicts the frequency and the FRF magnitude at Location 12. Therefore, the FE model needs to be updated to have the predicted frequency and the FRF magnitude in agreement with the measured values.
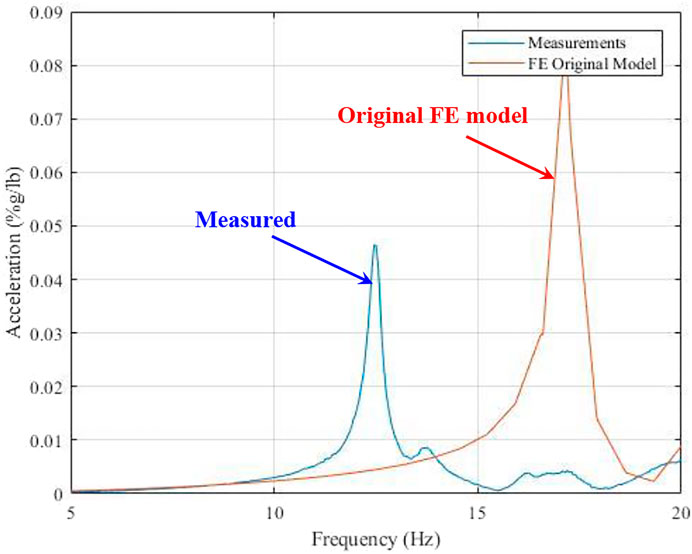
FIGURE 8. Measured and FE model predicted FRF magnitudes at the driving point (Location 12) (bare slab configuration).
In order to overcome the disagreements shown in Figure 8, the authors systematically made some changes and updated the FE model. The model was tuned to get the predictions into better agreement with the measurements. For the FE model updating process used in this study, Figure 9 summarizes the change of FRF magnitudes and governing mode frequencies by changing the modal damping ratio and the structural mass in the FE model. It is shown that by increasing the modal damping ratio in the FE model, the FRF peak drops, as shown in Figure 9A. Meanwhile, the predicted modal frequency gets smaller by increasing the mass, and the peak modal frequency shifts towards the left, as shown in Figure 9B.
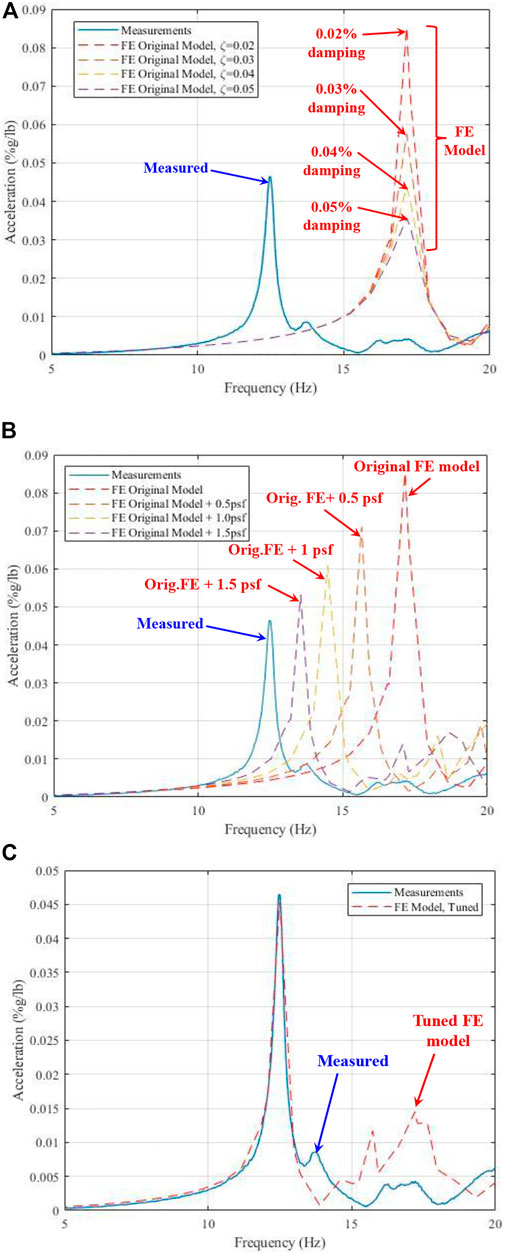
FIGURE 9. Summary of the tuning process for the FE model. (A) Effect of modal damping ratio on the predicted FRF magnitude. (B) Effect of mass on predicted modal frequency. (C) FRF agreement between measurements and tuned FE model.
After observing the trends shown in Figures 9A,B, an acceptable agreement between measurements and FE model is reached by adding 2.2 psf (0.105 kPa) additional mass to all bays, which results in the FRF plots shown in Figure 9C. To get the agreement shown in Figure 9C, the modal damping ratio used in the updated FE model is 0.02, which is two times the damping value suggested by the AISC Design Guide 11 (Murray et al., 2016). Both natural frequency values and the FRF peaks came into an agreement after this update on the FE model, as shown in Figure 9C. At this stage, the FE model has been tuned for the “pre-installation of non-structural components” condition, which means that the same model has become ready to be used for the next round of tests. The modifications were required to be directly applied to this tuned model for the “post-installation of non-structural components” condition.
4 Dynamic Testing of the Floor After the Installation of Drywalls, Partitions, and Electrical/Mechanical Ductwork
For the previous stage of testing (before the installation of non-structural walls, and installation of electrical/mechanical ductwork attached to the bottom of the test floor), vibration tests were performed with almost bare slab conditions with minimal non-structural elements present on the floor (spring of 2017). For the second stage of dynamic testing, non-structural components were attached to the floor from below, and various construction equipment were spread on the test floor (fall of 2017). Vibration tests were repeated using the same protocols of the previous testing stage to characterize the dynamic properties per the changed conditions of the test floor. The previously developed and tuned FE model was updated to reflect the conditions of the second stage of experiments.
At this stage of dynamic testing, there were non-structural walls constructed at the level below (which are attached to the test floor), in addition to suspended mechanical and electrical equipment attached to the bottom of the test floor (Figure 10). During vibration testing of this condition, there were various construction materials located on the test floor, e.g., partition blocks, lifters, scaffolds, scaffold planks, steel pipes, and uninstalled windows (some of these items are presented in Figure 10). This was indeed an excellent opportunity to observe the potential changes in the dynamic behavior of the tested floor and see the effect of heavy and spread-out items on the vibration response. The material types, quantities, and locations were recorded. To consider the impact of these construction materials, the weights are calculated and carefully reflected on the FE model based on the corresponding location of each item (Figure 10).
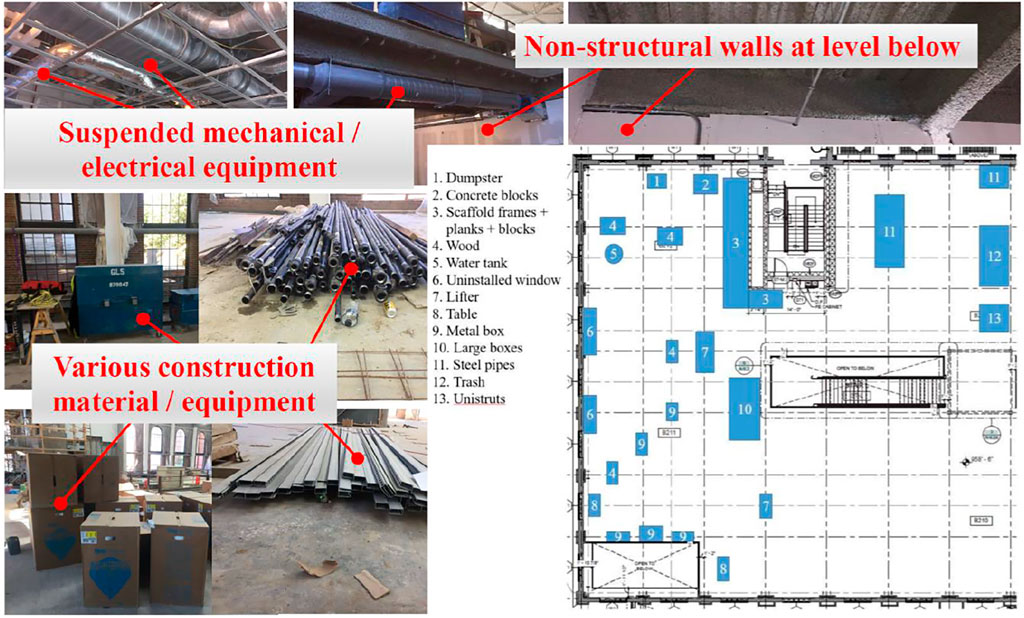
FIGURE 10. Non-structural elements; various construction materials present on the test floor.
The exact accelerometer locations shown in Figure 2A were used again for this round of tests using the same protocols for dynamic testing. Figure 11 shows the measured FRF magnitudes for acceleration and force at Location 12. Compared to the sharp FRF peak at the 12.45 Hz of the “pre-installation” experiment, there is no clear peak for the governing mode for the “post-installation” experiment. Yet, it is observed that there are multiple modes closely spaced between 10 and 15 Hz. Compared to the relatively slim FRF peak of the “pre-installation” conditions at 12.45 Hz, the “post-installation” FRF plot of Figure 11 is wider with an FRF peak spread in a range of frequencies between 12.4 and 13.1 Hz, indicating that the “post-installation” condition has significantly larger damping than the “pre-installation” condition. This makes sense considering the amount of various spread-out materials on the test floor and the suspended mechanical/electrical equipment attached to the test floor from below. While there is not a clear FRF peak for the “post-installation” condition, one possibility is that there is one FRF peak somewhere between the 12.4 to 13.1 Hz range indicated in Figure 11. The other possibility is that there are more than one closely spaced mode in this range. The closely spaced modes can look like a single mode without a clear single peak, like the one observed in the 12.4 to 13.1 Hz range of Figure 11. In this study, the authors did not perform a multi-mode FRF curve fitting to determine if it is one or closely spaced multiple modes within this range of frequencies. Such analysis would have also identified the modal damping ratios for the closely spaced modes in this range.
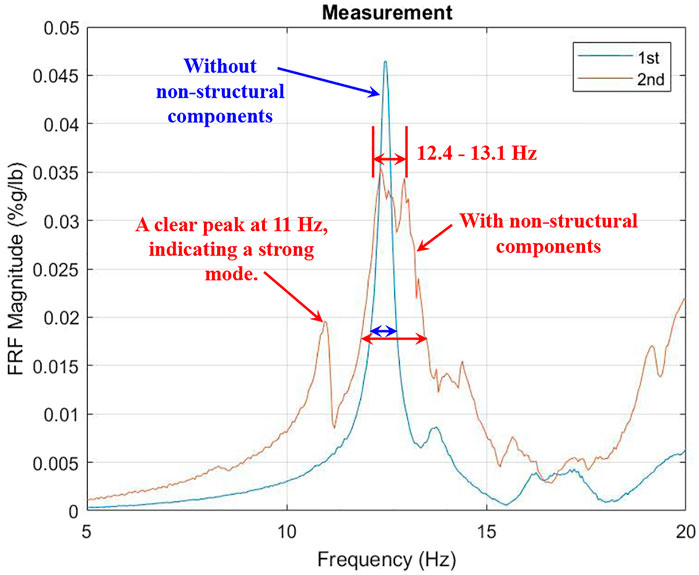
FIGURE 11. Comparison of measured FRFs at Location 12: “pre-installation of non-structural components” vs. “post-installation of non-structural components.”
Another important item observed in the FRF plot of Figure 11 is that after the installation of non-structural elements, there is a clean peak at 11 Hz. This mode was not picked up at Location 12 before the installation of the non-structural components. Since FRF curve fitting was not performed, it is difficult to differentiate the mode shapes, match with the FE model results, and pinpoint the real reason of this mode appearing at 11 Hz.
Assuming that there is only one mode in the specified range of frequencies, then there is no drastic change in the natural frequency of the tested floor for both conditions. The frequency for the “pre-installation” conditions is 12.45 Hz, while the frequency for the “post-installation” conditions is between 12.4 and 13.1 Hz. This observation does not align with the findings of Devin et al. (2015) and Devin et al. (2016), where they observed a 30% increase in the natural frequencies after the installation of non-structural elements. This is probably because of the non-load-bearing wall details used on the structure tested in this paper (Figure 12). Based on the details shown in Figure 12, the non-structural walls below the test floor are not physically connected to the test floor in the vertical direction; therefore, this connection detail does not allow the walls below to interact with the test level above in the vertical direction. As such, the non-structural walls below the test floor do not show any stiffening effect on the upper level; therefore, they do not affect the test floor frequency.
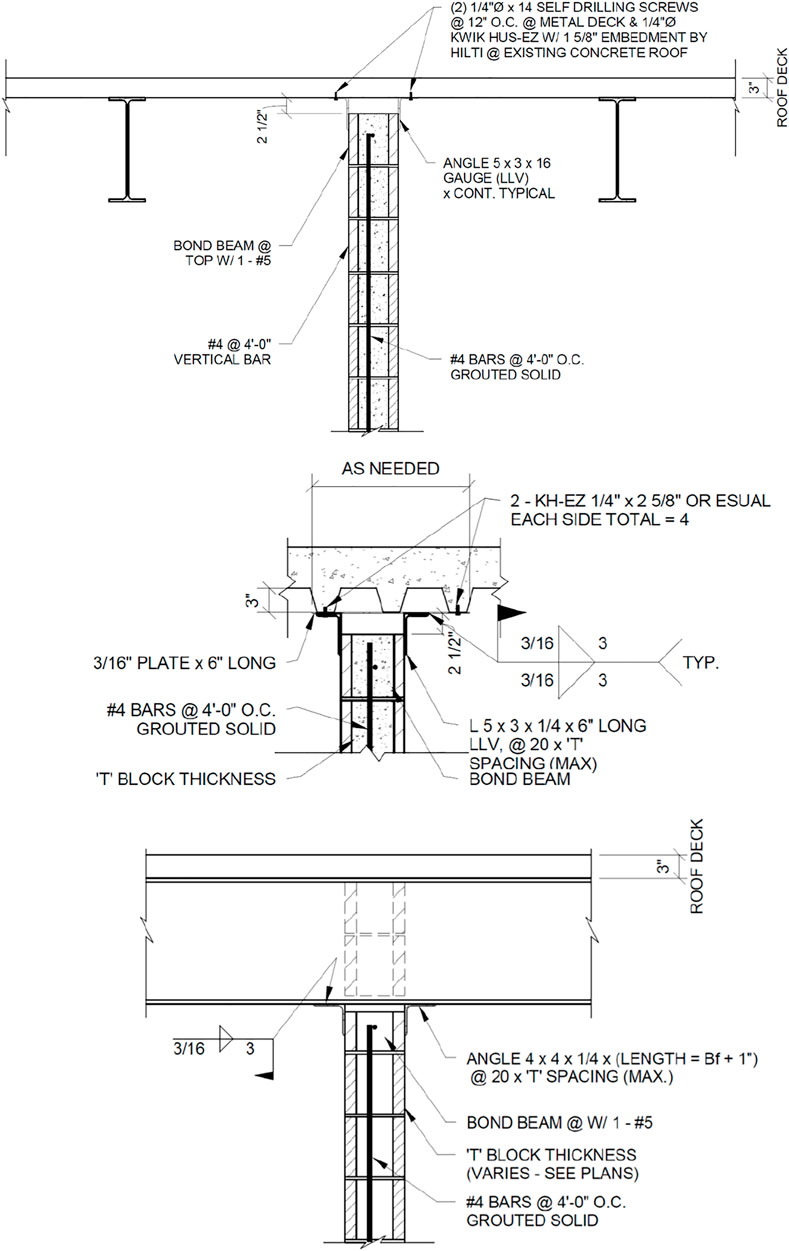
FIGURE 12. Non-load-bearing wall details of the test structure.
4.1 FE Modeling Using SAP2000
The FE model created for the “pre-installation” conditions is updated to reflect the “post-installation” conditions of the test floor. The “post-installation” condition items were summarized in Figure 10, and it includes various construction materials present on the test floor, non-structural walls built at the level below, and the suspended electrical/mechanical ductwork attached to the bottom of the test floor. For that purpose, the updated FE model included additional meshing on the shell elements used for the slab so that the weights of the construction materials are reflected precisely at their actual locations at the time of the testing. Additional meshing enabled equipment masses to be assigned to the corresponding areas on the FE model. The updated FE model also reflects the installation of non-structural components. For partitions, elastic springs with constants of 2.0 (k/in)/ft were used as recommended by AISC-DG11 (Murray et al., 2016). A modal damping ratio of 0.02 was used for proportional stiffness damping. Applying all these modifications to the FE model developed (and fine-tuned) at the previous stage, the FE model has become ready to be compared to the measured FRF of the “post-installation” condition.
Figure 13 shows the comparison between the measured FRF and the FE model FRF after the installation of drywalls, partitions, and electrical/mechanical ductwork. It is observed that there is a disagreement between the measured FRF and the FE model FRF considering the width of the FRF peaks. The natural frequency of the FE model peak is at 12.14 Hz, while the peak of the measured FRF is spread in a range of frequencies between 12.4 and 13.1 Hz (Figure 13).
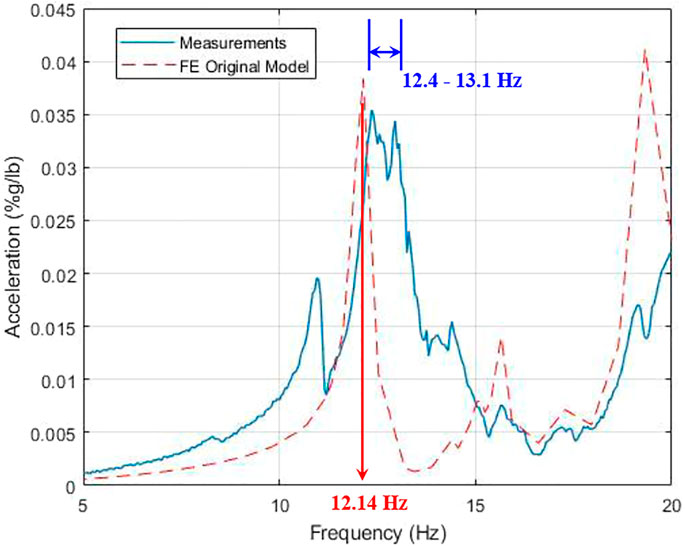
FIGURE 13. Comparison between the measured FRF and the FE model predicted FRF after the installation of non-structural elements.
As another note in Figure 13, there is no clear and sharp peak for the measured FRF, but the damping associated with the measured FRF is higher than the damping associated with the FE model FRF. The measured FRF indicates that there is a considerable increase in damping as a consequence of the installation of drywalls and partitions, electrical/mechanical ductwork, and materials spread over the testing floor (observed in Figure 11); however, this increase in damping was not reflected in the FE model FRF shown in Figure 13. Even though the FE model includes additional weights for the equipment present on the test floor and elastic springs for the partitions, the FE model FRF did not show the amount of damping that was observed on the measured FRF.
Figure 14 shows the comparison of two FE model FRFs for the “pre-installation of non-structural components” and “post-installation of non-structural components.” It is observed that the FRF peak of 12.49 Hz came down to 12.14 Hz for the “post-installation” condition (almost a 3% drop in the frequency value); meanwhile, the amount of damping (the width of the FRF) remained practically the same. This does not reflect the measured damping conditions since it was shown in Figure 11 that the “post-installation” condition has a broader FRF peak than the “pre-installation” condition.
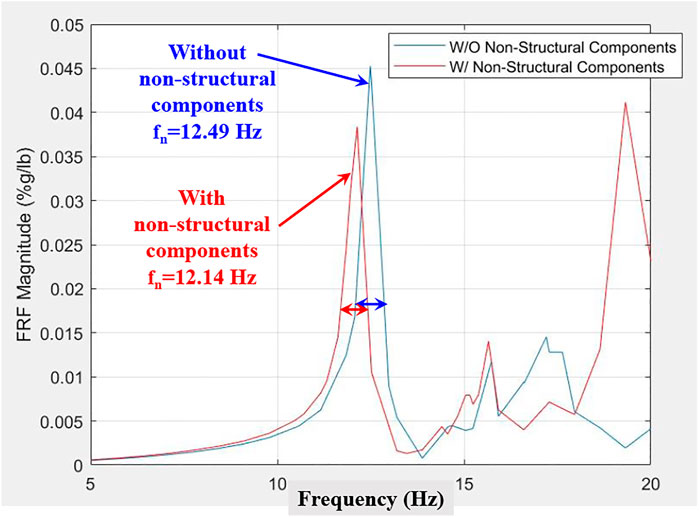
FIGURE 14. Comparison of FE model FRFs: “pre-installation of non-structural components” vs. “post-installation of non-structural components.”
5 Limitations of Testing, Analysis, and Modeling
The authors find it pertinent to discuss the limitations of the testing, analysis, and modeling exercises presented in this study. It is observed in Figure 11 that after the installation of non-structural elements, the measured FRF shows a clean peak at 11 Hz. This means there is an evident mode at this frequency. This mode is activated and appeared in the FRF plot at the Location 12 only after the non-structural element installations. It is difficult to assess the changes observed in the FRFs after component installations because it is not possible to be sure that it is related to the mass or stiffness change, especially because FRF curve fitting was not performed to differentiate the mode shapes and match with the FE model results.
Moreover, when the non-structural components are attached, the FRF of Figure 11 could be showing two closely spaced modes between 12.4 and 13.1 Hz (instead of one peak). Therefore, it is not possible to claim that there is a clear increase in damping for a single mode, or the wider peak belongs to closely spaced modes in this frequency range. It is important to note that when the two closely spaced modes are present, they could look like a single mode without a clear single peak. Closely spaced modes could appear when local stiffnesses are introduced to the floor (just like the non-structural components of this study); therefore, the effect observed between 12.4 and 13.1 Hz (Figure 13) could be related to this. The authors could not perform a multi-mode FRF curve fitting to see whether one mode or multiple modes exist in this range of frequencies. Such analysis would have also identified the modal damping ratios for the closely spaced modes in this range. The authors did not calculate the modal participation factors to see the contributions of higher modes to the overall response.
6 Summary and Conclusion
In this paper, the effect of partition walls and non-structural elements on the vibration response of floors are studied experimentally and analytically. Dynamic tests were conducted on an elevated floor of a steel-framed building located in the Southeastern United States before and after the installation of non-structural components. In order to determine their effects on vibration response, the first round of tests was conducted for the bare slab conditions with minimal non-structural elements, while the second round of tests were performed after the installation of non-structural components: electrical and mechanical ductwork (with a variety of construction-related items present on the floor during dynamic testing). The recorded data were post-processed to determine the FRFs for both conditions and compare them to observe the changes introduced by the installation of elements. Meanwhile, finite element models were created to represent each installation condition and compare the predicted FRFs to the measured FRFs. There are some limitations of the methods used in this study and therefore it is not possible to clearly pinpoint the effect of the nonstructural elements on the dynamic parameters of the floor; however, it can be stated that the stiffening effects of non-structural partitions were not clearly realized on the natural frequency of the test floor. Keeping these limitations in mind, according to the authors, the results of this study are not consistent with the previous experience of the authors and existing findings in the literature where a 25–30% increase in the natural frequencies was expected because of the installation of non-structural elements. This might be because the non-structural walls built below the test level are designed in a way not to interact with the upper level vertically with a physical connection. The upper-level slab is free to deflect in the gravity direction, and it does not transfer any load to the non-structural wall below; therefore, there is no vertical stiffness contribution of the non-bearing wall to the floor above. The results in the existing literature could very well be reflecting a different condition where there is a physical connection of the tested floor to the non-structural component below. With such vertical stiffness contribution, a 25–30% increase in the natural frequencies does make sense. It is important to note that the way the non-structural components are connected to the floor above is a major difference-maker. Such connection types should be known in advance so that more realistic assumptions can be made about their contribution to the dynamic behavior of floors.
On another note, even though the partition walls were modeled as linear springs in the model with assigned damping values, the effect of damping was not observed in the FRFs generated by the FE model. As a future study, the modeling of damping needs to be researched in FE modeling software to investigate and reflect the damping values observed on the measured FRFs. A multi-mode FRF curve fitting methodology would differentiate the modes and lead to a more reliable FE model updating.
Data Availability Statement
The raw data supporting the conclusion of this article will be made available by the authors, without undue reservation.
Author Contributions
MR: Investigation, data collection, testing, analysis, writing, and reviewing. OA: Funding acquisition, project administration, supervision, writing, reviewing, and editing. BD: Funding acquisition, project administration, supervision, investigation, data collection, testing, writing, reviewing, and editing.
Funding
The financial support for this research was provided by Qatar National Research Fund, QNRF (a member of Qatar Foundation), via the National Priorities Research Program (NPRP), Project Number: NPRP 8-836-2-353. The statements made herein are solely the responsibility of the authors.
Conflict of Interest
Author MR was employed by the company McNamara Salvia Inc. Consulting Engineers.
The remaining authors declare that the research was conducted in the absence of any commercial or financial relationships that could be construed as a potential conflict of interest.
Publisher’s Note
All claims expressed in this article are solely those of the authors and do not necessarily represent those of their affiliated organizations, or those of the publisher, the editors, and the reviewers. Any product that may be evaluated in this article or claim that may be made by its manufacturer is not guaranteed or endorsed by the publisher.
References
Avci, O. (2005). Effects of Bottom Chord Extensions on the Static and Dynamic Performance of Steel Joist Supported Floors. Virginia Polytechnic Institute and State University.
Avci, O. (2015). Modal Parameter Variations Due to Joist Bottom Chord Extension Installations on Laboratory Footbridges. J. Perform. Constr. Facil. 29. doi:10.1061/(ASCE)CF.1943-5509.0000635
Barrett, A. R., Avci, O., Setareh, M., and Murray, T. M. (2006). Observations from Vibration Testing of In-Situ Structures. Struct. Congr. 2006. doi:10.1061/40889(201)65
Barrett, A. R. (2006). Dynamic Testing of In-Situ Composite Floors and Evaluation of Vibration Serviceability Using the Finite Element Method.
Catbas, F. N., Celik, O., Avci, O., Abdeljaber, O., Gul, M., and Do, N. T. (2017). Sensing and Monitoring for Stadium Structures: A Review of Recent Advances and a Forward Look. Front. Built Environ. 3, 38. doi:10.3389/fbuil.2017.00038
Celik, O., Do, N. T., Abdeljaber, O., Gul, M., Avci, O., and Catbas, F. N. (2016). Recent Issues on Stadium Monitoring and Serviceability: A Review. Conf. Proc. Soc. Exp. Mech. Ser., 411–416. doi:10.1007/978-3-319-29763-7_41
Davis, B. (2008). Finite Element Modeling for Prediction of Low Frequency Floor Vibrations Due to Walking. Virginia Polytechnic Institute and State University.
Devin, A., Fanning, P. J., and Pavic, A. (2016). Nonstructural Partitions and Floor Vibration Serviceability. J. Archit. Eng. doi:10.1061/(asce)ae.1943-5568.0000171
Devin, A., Fanning, P. J., and Pavic, A. (2015). Modelling Effect of Non-structural Partitions on Floor Modal Properties. Eng. Structures 91, 58–69. doi:10.1016/j.engstruct.2015.02.021
Díaz, I. M., Pereira, E., and Reynolds, P. (2012). Integral Resonant Control Scheme for Cancelling Human-Induced Vibrations in Light-Weight Pedestrian Structures. Struct. Control. Health Monit. 19, 55–69. doi:10.1002/stc.423
Díaz, I. M., and Reynolds, P. (2010). Acceleration Feedback Control of Human-Induced Floor Vibrations. Eng. Structures 32, 163–173. doi:10.1016/j.engstruct.2009.09.003
Díaz, I. M., and Reynolds, P. (2010). On-off Nonlinear Active Control of Floor Vibrations. Mech. Syst. Signal Process. 24, 1711–1726. doi:10.1016/j.ymssp.2010.02.011
Do, N. T., Gul, M., Abdeljaber, O., and Avci, O., Novel Framework for Vibration Serviceability Assessment of Stadium Grandstands Considering Durations of Vibrations, J. Struct. Eng. (United States 144 (2018). doi:10.1061/(ASCE)ST.1943-541X.0001941
Ewins, D. J. (2000). Modal Testing: Theory, Practice and Application. Wiley. doi:10.1016/j.vetmic.2004.12.005
Miskovic, Z., Pavic, A., and Reynolds, P. (2009). Effects of Full-Height Nonstructural Partitions on Modal Properties of Two Nominally Identical Building Floors. Can. J. Civ. Eng. 36, 1121–1132. doi:10.1139/L09-055
Muhammad, Z. O., and Reynolds, P. (2019). Vibration Serviceability of Building Floors: Performance Evaluation of Contemporary Design Guidelines. J. Perform. Constr. Facil. doi:10.1061/(asce)cf.1943-5509.0001280
Muhammad, Z., Reynolds, P., Avci, O., and Hussein, M. (2018). Review of Pedestrian Load Models for Vibration Serviceability Assessment of Floor StructuresReview of Pedestrian Load Models for Vibration Serviceability Assessment of Floor Structures. Vibration 2, 1–24. doi:10.3390/vibration2010001
Murray, T. M., Allen, D. E., Ungar, E. E., and Davis, D. B. (2016). Vibrations of Steel-Framed Structural Systems Due to Human Activity. Second Edition. American Institute of Steel Construction.
Novak, R. A. (1993). The Influence of Lightweight Partitions on the Loss Factor of concrete Floors in Multi-Storey Buildings. Appl. Acoust. doi:10.1016/0003-682X(93)90009-U
Pernica, G. (1987). Effect of Architectural Components on the Dynamic Properties of a Long-Span Floor System. Can. J. Civ. Eng. 14, 461–467. doi:10.1139/l87-070
Petrovic, S., and Pavic, A. (2011). Effects of Non-structural Partitions on Vibration Performance of Floor Structures: A Literature Review. Proc. 8th Int. Conf. Struct. Dyn. EURODYN, 2011.
Racic, V., Brownjohn, J. M. W., and Pavic, A. (2009). Novel Experimental Characterisation of Human-Induced Loading. Conf. Proc. Soc. Exp. Mech. Ser.
Racic, V., Pavic, A., and Brownjohn, J. M. W. (2013). Modern Facilities for Experimental Measurement of Dynamic Loads Induced by Humans: A Literature Review. Shock Vib. doi:10.3233/SAV-2012-072710.1155/2013/975956
Shahabpoor, E., Pavic, A., and Racic, V. (2017). Structural Vibration Serviceability: New Design Framework Featuring Human-Structure Interaction. Eng. Structures 136, 295–311. doi:10.1016/j.engstruct.2017.01.030
Smith, H. A., and Vance, V. L. (1996). Model to Incorporate Architectural Walls in Structural Analyses. J. Struct. Eng. doi:10.1061/(asce)0733-944510.1061/(asce)0733-9445(1996)122:4(431)
Vér, I. L., and Beranek, L. L. (2005). Noise and Vibration Control Engineering: Principles and Applications. Second Edition. doi:10.1002/9780470172568Noise and Vibration Control Engineering
Willford, M., Young, P., and Field, C. (2005). Improved Methodologies for the Prediction of Footfall-Induced Vibration. Build. Nanoscale Res. Beyond. doi:10.1117/12.615417
Younis, A., Avci, O., Hussein, M., Davis, B., and Reynolds, P. (2017). Dynamic Forces Induced by a Single Pedestrian: A Literature Review. Appl. Mech. Rev. 69. doi:10.1115/1.4036327
Keywords: steel framed floors, walking excitations, non-structural components, natural frequency increase, floor vibrations serviceability, Frequency response function, acceleration levels
Citation: Royvaran M, Avci O and Davis B (2021) Effect of Non-Structural Components on the Dynamic Response of Steel-Framed Floors: Tests Before and After Component Installations. Front. Built Environ. 7:725106. doi: 10.3389/fbuil.2021.725106
Received: 14 June 2021; Accepted: 14 October 2021;
Published: 11 November 2021.
Edited by:
Wei Song, University of Alabama, United StatesReviewed by:
Ying Wang, Harbin Institute of Technology, Shenzhen, ChinaDaniel Gomez, Universidad del Valle, Colombia
Copyright © 2021 Royvaran, Avci and Davis. This is an open-access article distributed under the terms of the Creative Commons Attribution License (CC BY). The use, distribution or reproduction in other forums is permitted, provided the original author(s) and the copyright owner(s) are credited and that the original publication in this journal is cited, in accordance with accepted academic practice. No use, distribution or reproduction is permitted which does not comply with these terms.
*Correspondence: Onur Avci, b2F2Y2lAaWFzdGF0ZS5lZHU=