 Kevin Kahn
 Richard M. Mariita
- Crystal IS Inc, an Asahi Kasei Company, Green Island, NY, United States
There is growing evidence that viruses responsible for pandemics, such as Middle East respiratory syndrome and severe acute respiratory syndrome, are mainly spread through aerosols. Recommendations have been introduced to reduce the transmission risks of virulent airborne viral particles by increasing ventilation rates, expressed in air changes per hour (ACHs), effectively improving the dilution of pathogens via mechanical ventilation. However, infrastructural and operational costs associated with upgrades of building heating, ventilation, and air conditioning systems make these solutions expensive. It is well documented that Ultraviolet Subtype C (UVC) disinfection can help lower exposure risks by inactivating viruses and the performance of such solutions can translate into equivalent ventilation. Here, we present the first framework to extract the optimal UVC requirements to improve facility management yet ensuring compliance with ventilation guidelines at lower energy costs. The Kahn–Mariita (KM) model considers the air quality of shared enclosed spaces over time by supplementing the existing mechanical ventilation with localized UVC air treatment and includes variables such as room size, occupancy, existing ventilation, and target equivalent ACH. For example, the model applied to a conference room shows that a UVC chamber with recirculation rates of 160 m3/h increases ventilation from an ACH 3 to 7.9 and reduces the room’s reset time from 46 to <10 min with as little as 1 W. Recirculation rates of 30 m3/h however offer no benefits beyond 200 mW, with an eACH of 3.9 and reset time of 31 min. The first finding is that single-pass disinfection is not an appropriate metric of performance, i.e., low recirculation rates increase single-pass disinfection, and, however, only treats a portion of the space volume within a given time, limiting the overall performance. Conversely, higher recirculation rates decrease single-pass disinfection but treat larger portions of air, potentially multiple times, and are therefore expected to lower the transmission risk faster. The second result is that for fixed amounts of recirculating air flow, increasing UVC power helps with diminishing return, while for a fixed UVC power, increasing the recirculating air flow will always help. This dynamic is particularly important toward optimizing solutions, given the constraints system engineers must work with, and particularly to design for end-user benefits such as increased occupancy, in-dwelling time, or reduction of shared-space reset time.
Introduction
The current COVID-19 crisis has highlighted the lack of readiness to manage pandemics globally and the need for solutions to disinfect the air, which is dominantly responsible for the transmission of pathogens (Zhang et al., 2020a) such as SARS-CoV-2 (Nardell, 2021). As temporary confinements implemented all over the world are slowly being lifted, there is an urgent need to implement safety measures to enable physical proximity between individuals, particularly in shared enclosed spaces such as offices, hospitals, schools, restaurants, and transportation systems (Zhang et al., 2020a). Ultraviolet Subtype C (UVC) radiation, emitted at 200–280 nm with germicidal effect and being able to disrupt nucleic acids (RNA or DNA) (Yin et al., 2013), can be used to disinfect the air, thus managing disease outbreak (Reed, 2010). UVC has exhibited effectiveness against hospital-acquired bacterial infections (Mariita and Randive, 2020), including the promise of lessening contact infections in long-term acute care hospitals (Ethington et al., 2018). In addition, studies carried out during the COVID-19 pandemic have demonstrated that UVC can rapidly inactivate SARS-CoV-2 (Storm et al., 2020) even at high viral titers (Heilingloh et al., 2020). Also, the use of UVC to ensure clean air will save energy by warranting reduced building heating, ventilation, and air conditioning (HVAC) energy demand (Aviv et al., 2021).
With the worldwide accepted findings that the airborne transmission route is the most dominant and highly virulent form of COVID-19 transmission (Zhang et al., 2020a) and with people gathering in closed spaces essentially sharing the same air (Nardell, 2021), we have seen a global trend toward “healthy buildings,” driven by the urgency for automated, documented, and reliable disinfection of air, surfaces, and water in shared enclosed/inside spaces. Typically, air quality is ensured by ventilation and increasing air changes per hour (ACHs), effectively diluting the virus by adding air and accelerating the reduction of airborne pathogen concentration (Memarzadeh and Xu, 2012). Unfortunately, in most cases, it is impractical to increase ACHs because required improvements in the existing HVAC systems are costly if at all possible with principal restrictions around ceiling heights, inability to upgrade the ducts or fan, and noise air flow pressure drop imbalance due to nonoptimal dimensioning that results from retrofit solutions. In addition, with centralized air systems, the risks of cross-contamination, with air being recirculated from one room to another, remain (Horve et al., 2020). In fact, except in hospitals, HVAC systems in closed public spaces are designed for the comfort of occupants, with odor control, removal of carbon dioxide, and humidity and temperature control, and may not have enough capacity for the right ACHs for airborne transmitted disease prevention (Nardell, 2021). It has been demonstrated that improperly applied HVAC systems may contribute to the transmission/spread of airborne diseases (Correia et al., 2020) as also suggested by descriptions from the Diamond Princess Cruise Ship (Zhang et al., 2020b). This has also been indirectly proven using airflow-dynamics models (Chen et al., 2011) and experimental modeling (Li et al., 2005). Additional recent findings suggest that HVAC systems can facilitate SARS-CoV-2 transmission via shared air volumes with locations remote from areas where infected people reside (Horve et al., 2020). Moreover, HVAC contamination has been demonstrated in the Middle East respiratory syndrome (MERS) outbreak, caused by another betacoronavirus (Kim et al., 2016).
Another complication for facility management around increasing ventilation lies with the associated energy consumption in such solutions, as revealed in studies by Aviv et al. (2021), Orme (2001), Awbi (2017), and Chenari et al. (2016). New carbon-zero regulations, energy efficiency scoring, and credits create a strong incentive for managers of these assets to reduce ventilation, the primary source of energy consumption. Indeed, the higher the fresh-air injection rate, the more the heating or cooling required and the more expensive it is if systems are optimized with control to adjust to unpredictable changes in external temperature and humidity. For instance, rotary heat exchangers widely used in new constructions to save energy by capturing heat have raised concerns due to potential transfer of viral loads between the return and supply air flows. Conflicting reports on this account have pushed building managers to bypass them, highlighting the friction between energy efficiency and air quality.
In this study, we present an alternative way of approaching the problem of air quality by using localized UVC for air treatment which is converted into an equivalent ventilation, which we will refer as eACH (sometimes found in the literature as eqACH), (Figure 1). In other words, we look at quantifying the equivalent increase of mechanical ventilation to reach similar air quality within a defined amount of time. This allows reaching ventilation targets without upgrading the existing HVAC system and reversely provides an opportunity to optimize (reduce) the existing ventilation already meeting the recommended ACH by substituting with local UVC solutions. The Kahn–Mariita (KM) model presented here has the potential to rapidly allow buildings to comply with ventilation guidelines such as from the ASHRAE (Schoen, 2020) and WHO (Atkinson et al., 2009), to improve their energy efficiency rating, and provide a simple framework to reopen shared enclosed spaces, increase the time spent in these shared enclosed spaces, and manage occupancy limits, thus accelerating a return to “normal life.” The KM model is not limited specifically to SARS-CoV-2 and thus also offers a solution effective for any type of airborne microbial contaminants, such as the flu, tuberculosis, and SARS-Cov-2 or MERS.
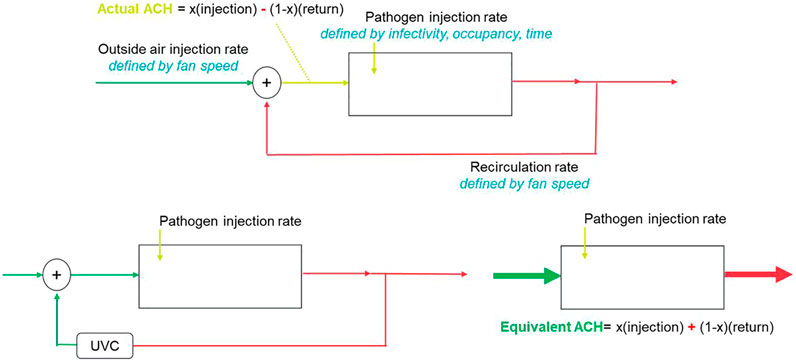
FIGURE 1. Equivalent ACH (eACH) as it relates to fresh-air injection rate.
The uniqueness of the KM model lies in the incorporation of UVC with the existing ventilation. Previous studies from Kane et al. (Kane et al., 2018) and Walker and Ko (Walker and Ko, 2007) have investigated the effect of UVC on airborne pathogen reduction and defined performances of the UVC system independent of the existing ACH. In particular, studies have linked 1) UVC output to occupancy (García de Abajo et al., 2020), which yields a 25 mW/person requirement to increase an equivalent fresh-air injection rate by a factor of 2, and 2) UVC output to volume (Mphaphlele et al., 2015), which suggests 15–20 mW/m3 requirement to reduce risk down to baseline. None of these studies look at the integrated performances with the existing ventilation nor do they allow walking back from a target ACH. Here, we try to provide a strong model to output a room or space eACH rather than a device performance, which allows for better facility management and simplifying the integration of UVC systems for air treatment.
Materials and Methods
The use of the KM model supports HVAC systems designed for closed shared spaces by helping understand the inactivation of viruses while achieving eACH, thus preventing the spread of viruses via HVAC systems as well as poorly ventilated shared enclosed spaces. This is even more important by recalling that some viruses in the betacoronavirus genera such as SARS-CoV-2 are approximately 60–140 nm (0.06–0.14 micron) in diameter (Cascella et al., 2021). These viruses can easily pass through common filtration systems whose pore size is more than 1 micron since HEPA filters are only used in certain spaces such as isolation rooms or intensive care units (ICUs) (Correia et al., 2020). The approach of eACH consists in assigning a quantitative measure, which consists of localized air treatment in poorly ventilated rooms with UVC light to reduce airborne contaminant concentrations, which corresponds to the same air quality microbiologically to that of increased mechanical ventilation. The model and methodology we present allow quantification of optical energy needs to achieve a defined log reduction, in turn allowing compliance with ventilation targets and transmission risk control guidelines.
The KM model shows eACHs by defining air quality level—90% reduction of the steady-state concentration without UVC—and by relating UVC solution to the amount of time saved to reach the same air quality, which utilizes the following steps:
1. Define the steady-state concentrations of a system with the existing ACH and no UVC applied. This refers to a number of infective patients that would enter the space and remain until the steady-state concentration is reached. We are not interested in the time this process takes because it gives us the worst-case scenario. Any amount of time the patient would leave the room prior to that state reached would result in a lower concentration. A transient view shows this concentration is approached relatively quickly, typically within a minute.
2. Consider the infective person leaves the room; then, we factor the speed of the exponential decay in the above concentration due to ventilation. This is solely determined by the ACH, which considers the volume of the room and air speed.
3. Add a UVC source within a recirculating chamber within the room. Here, we model the efficiency of single-pass disinfection through the reactor design (size and materials of UVC reflectivity) and the air flow which defers from the room ventilation and is controlled locally. We compute the new steady-state concentration by adding the UVC on top of the existing ventilation, thus summing the clean air delivery rates (CADRs).
4. Extract the ACH from the difference in steady-state concentration and input this into the decay model. This yields the time to reach the target concentration level.
The KM model’s microbial disinfection efficacy relies on UVC output, recirculation rate, existing ACH, and chamber design to obtain the desired eACH. We find that the two most important factors are the existing ACH and recirculation rate, the first acting as a limiting element and the second as the highest contributor to the increase in equivalent ventilation. UVC output affects the single-pass performance, with its additional relative contribution to eACH regress. The increase in eACH in turn accelerates the time to reach a target concentration, which converges toward a minimum time.
The main problem with airborne pathogens is that in closed, poorly ventilated spaces, the risk of transmission remains high for a long period of time (Klompas et al., 2020). Both calculations and experimental measures show that aerosol droplet concentration is reduced by 63% (Nardell, 2021) for every ACH as demonstrated by van Rijn et al. (2020), Nunayon et al. (2020), and Bazant and Bush (2020). This means that in a typical office room with ACH = 3, it takes >46 min to reach a 90% pathogen concentration reduction. This view assumes no new source of contaminants or ignores the droplets that attach onto surfaces. Indeed, recent studies support the theoretical concepts presented here by showing how reduction in viral concentrations affects the airborne transmission risk (Qian and Zheng, 2018), and the results deviated from the linear relationship as the marginal benefit of incremental disinfection or log reduction value (LRV) is lower than the previous one. The key conclusions here are as follows: 1) there is little added value from aiming to higher concentration reduction values than 90% and 2) because the risk is reduced mostly by relatively low reduction rates, any recirculating system should be designed for higher air flows with a low UVC dose rather than the conventional reactor designs traditionally used in water disinfection which aim at increasing the dose by reducing the flow. Here, the dynamics is the key and recirculation needs to be considered, as well as how quickly the total air volume is treated.
For example, consider a room of 50 m3, with an existing ACH of 3 (meaning it takes 46 min to reduce 90% concentration and bring transmission risk back to baseline) and a recirculating unit where air flows at two different velocities, 200 m3/h and 20 m3/h, respectively, into a 70% UVC reflective chamber with 700 mW of UVC optical output. Simple relationships allow estimation of the fluence rate from these parameters, which have proved to be a good prediction of microbial results. The higher fan power scenario “only” reduces 73% of pathogens in a single pass, while the lower fan power which increases the exposure time to UVC of air leads to >99.9999% reduction (LRV6) per pass. It must be noted that, in real term, to achieve such a high LRV value will require a very well-designed reactor since any deviation from all flows getting the exact same dose will have a large impact on the LRV (conversely, low LRVs are less sensitive to small variations). However, for the entire room to obtain a 90% reduction, there is acceleration from 46 min without UVC to 9 min for the higher fan power and to 35 min for the lower fan power, leading to eACH = 8.5 and eACH = 3.6, respectively. We therefore show that the dose or LRV is no longer the relevant metric for air treatment, as it is in both water and surface disinfection where single pass matters and regulations aim for full reductions of specific pathogens. Instead, the most important factors here are the existing ACH and the recirculation speed for the concentration to be sufficiently reduced to keep the risk close to the baseline. The eACH model captures these dynamics and incorporates variables such as volume of air to be treated, occupancy, reactor design, UVC output and wavelength, and pathogen of interest and only outputs the equivalent ventilation rate and improved time to 90% reduction (other notations used here: D90 or 1 LRV).
Kahn–Mariita Model Dynamics
The airborne transmission risk
Usually, in these applications, increasing the distance between people is the most efficient way to reduce contamination rates. The proximity effect is more pronounced when the ACH is higher because the concentration reduces faster. On the other hand, as a person stays in a closed space, the time-dependent term (second term in Equation 1) becomes the largest factor in the increase in airborne transmission risk. The goal of air disinfection is to bring that risk down converging toward the baseline risk
Concentration Buildup
Kowalski defines the steady-state concentration (Css) as the fraction of the contaminant release rate (RR) and the CADR which is the product of the removal efficiency (RE) and the total air flow (Q) in the recirculating chamber (Kowalski, 2009):
Css = steady-state airborne concentration, cfu/m3
RR = contaminant release rate, cfu/min
CADR = clean air delivery rate, cfm (Kowalski, 2009)
In the past, the CADR has been used to assess the relative performance of filtration systems in recirculating chambers or that of UVC disinfection units (Kowalski, 2009). While it is a good metric to compare devices, the question as to what is the required CADR or chamber performance to meet end-user needs is not accessible simply by looking into a chamber on its own. As we will show, this answer needs to incorporate the existing ventilation, room volume, and occupancy and look at the marginal benefits from adding UVC as it relates to increasing occupancy, residence time, and reducing room’s reset time. The KM model therefore starts with the CADR and links it to the end-user requirements. The advantage of CADR is the ability to measure it with microbial studies of single-pass performances; the risk however is to view this measurement as the final indication of performances.
A transient model allows for the estimation of the airborne concentration in a volume V as a function of time and is defined as follows:
The relationship between ACH and LRV is easily extracted from the decay relationship, showing a concentration reduction per ACH reduction factor (RED) % of 63.21% and an equivalent LRV of 0.43:
In our model, we first assume the initial concentration
Previous studies have estimated the release rate for an infective person to be 99 RNA virus particles per minute, extrapolated from the weighted average of speaking and breathing particle release rate and the ratio of infective RNA–containing virus particles to total released particles (Curtius et al., 2021). Susceptible subjects require a dose of 100–1000 RNA virus copies to be inhaled to cause an infection in 50% of them (Lelieveld et al., 2020). The number of RNA virus particles can be extracted from the volume of the particle in ml and the concentration of RNA virus particles per exhaled particle of approximately
Concentration Decay
The time for 1 LRV (D90) to be reached is given by the decay equation, where
The time to 90% is independent of the room size, but the steady-state concentration is. It is important to consider that the time to D90 is not enough. Indeed, 90% of the steady-state concentration reached with ACH = 2 is approximately the steady-state concentration of ACH = 20; thus, if the goal is 90% reduction of a given steady-state concentration, it becomes a different target concentration ratio for the other ACHs. In this case, the time to reach the Css (ACH = 2) with ACH = 20 is 0, meaning it is already the permanent state reached by reducing the buildup process. This is exemplified by comparing the steady-state concentration at different ACHs, the time required to reach 90% reduction at the different levels, and the D90(Css(ACH = x)) time reduction value (Table 1). The term D90(Css(ACH = x)) refers to the time necessary to reach 90% reduction of viral concentration from that of the initial ACH = x, with increased ventilation. This allows for consideration of varying equivalent ventilation rates, where reduction in the steady-state concentration with increased ACH or eACH effectively reduces the C/C0 ratio and accelerates the path to the target viral particle concentration. This will be particularly important in bridging data collected in microbial tests where standard protocols only activate UVC after the desired microbial concentration is reached, to an application where the UVC is constantly on. The benefits of increasing the ACH become very clear and the model helps quantifying the addition of UVC on the eACH and time reduction.
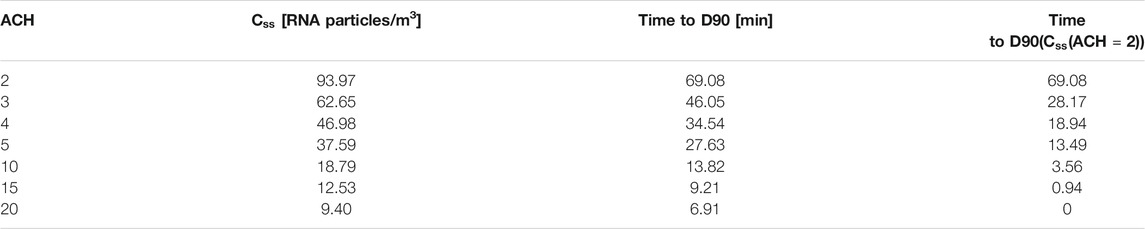
TABLE 1. Steady-state concentration at different ACHs in a 50 m3 room and derived time points to 90% reduction for each level and time to 90% reduction of a reference level—here ACH = 2—with increased ACH.
Ultraviolet Subtype C Chamber: Concentration Buildup
Now, we add a UVC recirculating unit, which will increase the eACH in two processes: it will first lower the buildup concentration reached in the steady-state model and will accelerate the decay time to the original D90 with a lower ratio required. First, we look at the steady-state concentration with UVC recirculation,
The buildup concentration can be understood as the risk for people present in the room and therefore defines the amount of time they can share the space. The decay concentration which we provide in the next and final step allows to plot the room’s reset time for the risk to be minimized for a new person to enter the space once the infective subject has left the room. This sawtooth wave function allows considering risk in a dynamic mode, relevant to the different factors.
Css can be calculated at various ACHs for a given system (Table 2). It is evident from the calculations that the relative usefulness of UVC is higher at existing lower ACHs and thus this understanding provides a framework for compliant buildings with high ventilation rates to reduce the existing ventilation and maximize the use of UVC while reducing energy consumption, a win-win situation.
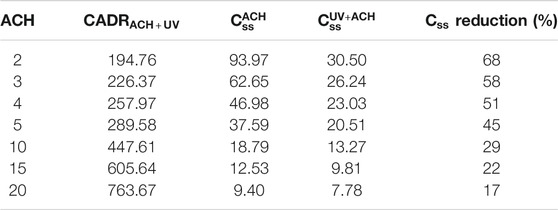
TABLE 2. Calculated
Ultraviolet Subtype C Chamber: Concentration Decay
The final step in the model considered assumes that the steady-state concentration is reached and looks at the decay of the concentration assuming RR = 0 (the infective person leaves the room, for instance).
From the following relationship, we can extract the time required to reach the target concentration (90% of the non-UVC steady-state concentration
As the ratio of the target concentration level to the buildup concentration approaches 1 with higher ACH (remember the increase in ACH—or the eACH—reduces the buildup steady-state concentration), the time approaches 0. This can be well understood by the fact that the baseline risk remains dominant irrespective of the time spent in a space.
Discussion
It is interesting to look at the effect of UVC output and recirculation rate on the eACH. First, let us consider a change in output and all else equal, with the parameters described above and for an existing ACH = 3, which provides the eACH reached with an output ranging from 200 mW to 10 W of useful UVC output. It should be noted that the LRV presented assumes that it follows a linear trend between the dose and every additional LRV, which is not always the case. The model is not focused on the LRV of this problem since it considers the time to reach a single LRV (90% reduction), but it is useful to show that the relative benefits of the UVC dose on the eACH decrease with an increase in dose. There is no noticeable difference in eACH or time reduction beyond 1 W (eACH 7.9 and 9 min to D90) and the best use of energy around 500 mW (eACH 7.2 and 11 min to D90), compared to the 46 min without UVC (Table 3).
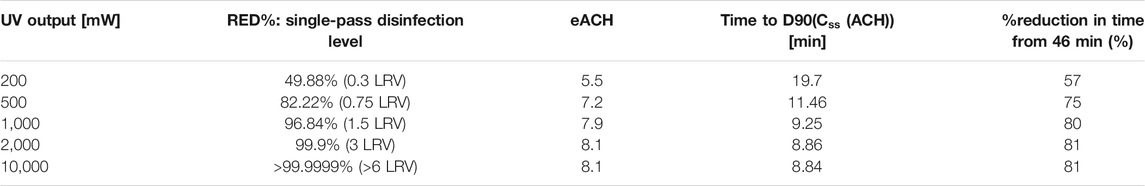
TABLE 3. Effect of UVC on the eACH and time to D90(
It is evident that the principal factor in increasing the ACH is the recirculation rate, that is, if too low no matter how much output, only a fraction of the volume will be treated within the time for 1 LRV to occur “naturally” with the existing ventilation. We show this by comparing two sets of data (Tables 3, 4), which look at the same system except that the recirculation rate is reduced from 160 m3/h to 30 m3/h. The single-pass disinfection rate increases on the whole but the maximum eACH reachable and disinfection time are reduced dramatically. In addition, there is almost no difference between 200 mW and 10 W (50x higher output) on the eACH (Table 4), even though the disinfection per pass is increased by a couple of orders. The key is therefore to understand the limiting factor in the system, defined as the parameter which prevents the increase in other variables to translate into increase in eACH. In this example, it is the recirculation rate. At a higher recirculation rate, output matters more; however, we see again a nonlinear contribution between the UVC output and its relative increase in eACH or decrease in time to D90(Css(ACH)). At 160 m3/h, we find that 500 mW provides 93% of the benefits of 10 W. It must be highlighted that one important assumption in the model does not consider re-mixing after every pass in the chamber.
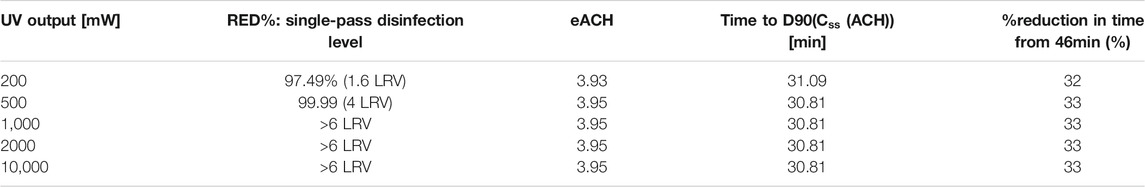
TABLE 4. Impact of UVC on a similar system presented in Table 3, however with recirculation rate reduced from 160 m3/h to 30 m3/h.
While we have shown the limiting factor to be the recirculation rate in air chambers, upper-air systems would definitely not be subject to this limitation. Instead, the KM model can be adapted for upper-air systems by using air convection due to heating and ventilation as recirculation rates, assuming perfect and constant air mixing (which is typically one of the main assumptions in epidemiological models such as Wells–Riley) (Bazant and Bush, 2020) as well as a “UVC corridor” acting as a chamber with 0% reflection, meaning the UVC is fully absorbed by the ceiling of the opposite wall.
Another important concept of the KM model is the fact that UVC is seen as a complementary addition to the existing ventilation, therefore offering an integrated model of actual performances.
A recent study using upper-air systems with both low-pressure mercury lamps and UVC LEDs as light sources showed that a reduction time to 90% of initial concentration just under 2 min from 14 min was naturally achieved with both sources (Nunayon et al., 2020). The performance of the 200 mW LED–powered upper-air system was similar to a 21 W lamp one, which is explained by the fact that most of the lamp output remains in the upper-air module: the actual UVC output which is transmitted out of the upper-air module is estimated to be around 375 mW considering the conversation of electrical to optical energy (33%), the normalization to germicidal power at 265 nm (90%), and the system loss due to the louvers (6% efficiency). The KM model predicts that the 200 mW system should have accelerated the risk reduction to 4.2 min and the 375 mW (lamp) system to 3.4 min yielding an eACH of 22 and 25, respectively. While the overall performances are well captured, we attribute the differences from the air recirculation in the room which is not properly included. In fact, upper-air experiments include the use of fans for air recirculation, which is not included here and would improve the performances as we have shown the importance of recirculation.
Quantifying Benefits
While the KM model allows for outputting eACH and its extracted time to D90 (equivalent to a potential definition of room’s reset time for a shared indoor space before re-use), the benefits of eACH are readily found by inputting the new-ACH into the model by Bazant and Bush from MIT (Bazant and Bush, 2020) to quantify the benefits to end-users in terms of additional number of people or amount of time allowed into a shared enclosed space, thanks to the improved air quality level. For a volume of 50 m3 (a typical conference room of app. 4 × 5 × 2.5 m3), the proximity rule of 2 m between every occupant would limit the occupancy to six people. With ACH = 3, a maximum of three people are allowed without mask for 1 h if the infective person is in the room, to limit transmission risk. With ACH = 12, this number is increased to 7. The guideline restricts the probability of airborne transmissions per infected person to be less than the risk tolerance over the cumulative exposure time listed.
The model developed by Bazant and Bush (2020) allows obtaining the maximum occupancy at different ventilation rates, which in turn allows for a direct comparison of the three approaches, namely, the UVC/occupancy, UVC/volume, and the KM model on equivalent ventilation as presented here. For a 50 m3 room, a maximum of five people are allowed at an ACH = 7, with the eACH being reachable at various outputs (Table 3). The value of eACH = 8 is the maximum reachable but does not allow additional benefit in occupancy from eACH = 7. With a minimum output requirement of 25 mW/person, the first approach yields a 125 mW requirement for highly reflective chambers (PTFE >90%). This number would be directly affected by the UVC reflectivity of the material used in these designs, more so than the other approaches. For instance, an aluminum design (UVR 70%) would increase this value to approximately 400 mW.
The second approach on a volume of 15–20 mW/m3 yields 750–1,000 mW requirement. The difference between the two can be understood from the occupancy limitation imposed on the first, and thus, the higher requirement considers the maximum fill-up of the space. None of these considers the existing ventilation, nor the number of infective people in the room. The KM model does and outputs for a target eACH = 7 from an existing ACH = 3 with a requirement of 500 mW at 160 m3/h recirculating rate (Table 5). The difference from the occupancy model is that as eACH increases, the risk shifts from concentration in the air to the proximity, which is well captured: the KM proximity provides an output equivalent to the occupancy up the point where proximity restrictions are broken down. The volumetric and occupancy approaches converge as occupancy is increased to fill the volume; however, the hypothesis given here is that increasing output will not affect the risk level beyond a certain point. These models are also independent of the number of infective people, while our model allows incorporating this in larger spaces where the probability of multiple infection sources is higher than in the smaller spaces presented in these examples.

TABLE 5. Recommended UVC output by the three approaches (UVC/occupancy, UVC/volume, and UVC/target eACH).
Conclusion
It is challenging to eliminate air recirculation such that only fresh air is supplied to occupants in shared enclosed spaces. The KM model offers blueprints that reduce airborne transmission of pathogens by adding UVC to localized systems and converting the benefits into eACHs, thus complementing the existing ventilation. The model particularly allows withdrawal from a target eACH given by benefits such as increase in occupancy or the time spent in shared enclosed spaces and output a UVC requirement as a function of UVC, space volume, existing ventilation, recirculation rate, and single-pass performance. This allows for devices to be tested on their single-pass performance and to link to the eACH as a function of the recirculation rate and the existing ventilation. Finally, and of importance for building sustainability, the KM model allows the balance of centralized ventilation and localized UVC air treatment options to decrease dependency on outside air injection and increase energy efficiency. This unified view of air quality and energy also provides an alternative approach to upgrade buildings to meet new carbon-zero requirements.
Data Availability Statement
The original contributions presented in the study are included in the article/supplementary material; further inquiries can be directed to the corresponding author.
Author Contributions
KK implemented the idea for this model, contributed to the literature search, drafted the initial manuscript, and revised the final manuscript; RM contributed to the review of the model and literature search, carried out writing of the initial manuscript, and revised the final manuscript.
Conflict of Interest
The authors KK and RM were employed by the company Crystal IS Inc., an Asahi Kasei Company.
Publisher’s Note
All claims expressed in this article are solely those of the authors and do not necessarily represent those of their affiliated organizations, or those of the publisher, the editors, and the reviewers. Any product that may be evaluated in this article, or claim that may be made by its manufacturer, is not guaranteed or endorsed by the publisher.
Acknowledgments
The authors are grateful to Crystal IS Inc. and Asahi Kasei for their support, particularly to Eoin Connolly and Amy Miller. The authors sincerely thank Prof. Leo Schowalter and Dr. Sébastien Blumenstein for their useful insights and for proofreading the manuscript and Pasquale Attrotto for his valuable contribution, including suggesting and validating some relevant formulae used to describe the phenomena presented in this work.
References
Aviv, D., Chen, K. W., Teitelbaum, E., Sheppard, D., Pantelic, J., Rysanek, A., et al. (2021). A Fresh (Air) Look at Ventilation for COVID-19: Estimating the Global Energy Savings Potential of Coupling Natural Ventilation with Novel Radiant Cooling Strategies. Appl. Energ. 292, 116848. doi:10.1016/j.apenergy.2021.116848
Awbi, H. B. (2017). Ventilation for Good Indoor Air Quality and Energy Efficiency. Energ. Proced. 112, 277–286. doi:10.1016/j.egypro.2017.03.1098
Bazant, M. Z., and Bush, J. W. M. (2020). Beyond Six Feet: A Guideline to Limit Indoor Airborne Transmission of COVID-19. medRxiv 118 (17). 2020.08.26.20182824. doi:10.1101/2020.08.26.20182824
Bolton, J. R., Mayor-Smith, I., and Linden, K. G. (2015). Rethinking the Concepts of Fluence (UV Dose) and Fluence Rate: The Importance of Photon-Based Units - A Systemic Review. Photochem. Photobiol. 91, 1252–1262. doi:10.1111/php.12512
Cascella, M., Rajnik, M., Cuomo, A., Dulebohn, S. C., and Di Napoli, R. (2021). Features, Evaluation, and Treatment of Coronavirus (COVID-19). Tamp, Florida: Statpearls. Statpearls [internet].
Chen, C., Zhao, B., Yang, X., and Li, Y. (2011). Role of Two-Way Airflow Owing to Temperature Difference in Severe Acute Respiratory Syndrome Transmission: Revisiting the Largest Nosocomial Severe Acute Respiratory Syndrome Outbreak in Hong Kong. J. R. Soc. Interf. 8, 699–710. doi:10.1098/rsif.2010.0486
Chenari, B., Dias Carrilho, J., and Gameiro da Silva, M. (2016). Towards Sustainable, Energy-Efficient and Healthy Ventilation Strategies in Buildings: A Review. Renew. Sustain. Energ. Rev. 59, 1426–1447. doi:10.1016/j.rser.2016.01.074
Correia, G., Rodrigues, L., Gameiro da Silva, M., and Gonçalves, T. (2020). Airborne Route and Bad Use of Ventilation Systems as Non-negligible Factors in SARS-CoV-2 Transmission. Med. Hypotheses 141, 109781. doi:10.1016/j.mehy.2020.109781
Curtius, J., Granzin, M., and Schrod, J. (2021). Testing mobile Air Purifiers in a School Classroom: Reducing the Airborne Transmission Risk for SARS-CoV-2. Aerosol Sci. Technol. 55, 586–599. doi:10.1080/02786826.2021.1877257
Ethington, T., Newsome, S., Waugh, J., and Lee, L. D. (2018). Cleaning the Air with Ultraviolet Germicidal Irradiation Lessened Contact Infections in a Long-Term Acute Care Hospital. Am. J. Infect. Control 46, 482–486. doi:10.1016/j.ajic.2017.11.008
García de Abajo, F. J., Hernández, R. J., Kaminer, I., Meyerhans, A., Rosell-Llompart, J., and Sanchez-Elsner, T. (2020). Back to Normal: An Old Physics Route to Reduce SARS-CoV-2 Transmission in Indoor Spaces. ACS Nano 14, 7704–7713. doi:10.1021/acsnano.0c04596
Grandusky, J. R., Randive, R. V., Jordan, T. C., and Schowalter, L. J. (2016). “Fabrication of High Performance UVC LEDs on Aluminum-Nitride Semiconductor Substrates and Their Potential Application in Point-of-Use Water Disinfection Systems,” in III-nitride Ultraviolet Emitters: Technology And Applications. Editors M. Kneissl, and J. Rass (Cham: Springer International Publishing)), 171–192. doi:10.1007/978-3-319-24100-5_7
Heilingloh, C. S., Aufderhorst, U. W., Schipper, L., Dittmer, U., Witzke, O., Yang, D., et al. (2020). Susceptibility of SARS-CoV-2 to UV Irradiation. Am. J. Infect. Control. 48, 1273–1275. doi:10.1016/j.ajic.2020.07.031
Horve, P. F., Dietz, L., Fretz, M., Constant, D. A., Wilkes, A., Townes, J. M., et al. (2020). Identification of SARS-CoV-2 RNA in Healthcare Heating, Ventilation, and Air Conditioning Units. Indoor Air. medRxiv, 2020.06.26.20141085. doi:10.1101/2020.06.26.20141085
J. Atkinson, Y. Chartier, C. L. Pessoa-Silva, P. Jensen, Y. Li, and W.-H. Seto (2009). in Natural Ventilation for Infection Control in Health-Care Settings (Geneva: World Health Organization).
Kane, D. W., Finley, C., and Brown, D. (2018). UV-C Light and Infection Rate in a Long Term Care Ventilator Unit. Can. J. Infect. Control. 33.
Kim, S.-H., Chang, S. Y., Sung, M., Park, J. H., Bin Kim, H., Lee, H., et al. (2016). Extensive Viable Middle East Respiratory Syndrome (MERS) Coronavirus Contamination in Air and Surrounding Environment in MERS Isolation Wards. Clin. Infect. Dis. 63, 363–369. doi:10.1093/cid/ciw239
Klompas, M., Baker, M. A., and Rhee, C. (2020). Airborne Transmission of SARS-CoV-2. JAMA 324, 441–442. doi:10.1001/jama.2020.12458
Kowalski, W. (2009). “Airstream Disinfection,” in Ultraviolet Germicidal Irradiation Handbook: UVGI for Air And Surface Disinfection. Editor W. Kowalski (Berlin, Heidelberg: Springer Berlin Heidelberg), 177–209. doi:10.1007/978-3-642-01999-9_8
Lelieveld, J., Helleis, F., Borrmann, S., Cheng, Y., Drewnick, F., Haug, G., et al. (2020). Model Calculations of Aerosol Transmission and Infection Risk of COVID-19 in Indoor Environments. Ijerph 17, 8114. doi:10.3390/ijerph17218114
Li, Y., Huang, X., Yu, I. T. S., Wong, T. W., and Qian, H. (2005). Role of Air Distribution in SARS Transmission during the Largest Nosocomial Outbreak in Hong Kong. Indoor air 15, 83–95. doi:10.1111/j.1600-0668.2004.00317.x
Mariita, R. M., and Randive, R. V. (2020). Disinfection of Methicillin-Resistant Staphylococcus aureus, Vancomycin-Resistant Enterococcus Faecium and Acinetobacter Baumannii Using Klaran WD Array System. bioRxiv 3 (9), 1–3. 2020.12.21.423516. doi:10.1101/2020.12.21.423516
Memarzadeh, F., and Xu, W. (2012). Role of Air Changes Per Hour (ACH) in Possible Transmission of Airborne Infections. Build. Simul. 5, 15–28. doi:10.1007/s12273-011-0053-4
Mphaphlele, M., Dharmadhikari, A. S., Jensen, P. A., Rudnick, S. N., van Reenen, T. H., Pagano, M. A., et al. (2015). Institutional Tuberculosis Transmission. Controlled Trial of Upper Room Ultraviolet Air Disinfection: A Basis for New Dosing Guidelines. Am. J. Respir. Crit. Care Med. 192, 477–484. doi:10.1164/rccm.201501-0060OC
Nardell, E. A. (2021). Air Disinfection for Airborne Infection Control with a Focus on COVID‐19: Why Germicidal UV Is Essential †. Photochem. Photobiol. 97, 493–497. doi:10.1111/php.13421
Nunayon, S. S., Zhang, H., and Lai, A. C. K. (2020). Comparison of Disinfection Performance of UVC‐LED and Conventional Upper‐room UVGI Systems. Indoor Air 30, 180–191. doi:10.1111/ina.12619
Orme, M. (2001). Estimates of the Energy Impact of Ventilation and Associated Financial Expenditures. Energy and Buildings 33, 199–205. doi:10.1016/S0378-7788(00)00082-7
Qian, H., and Zheng, X. (2018). Ventilation Control for Airborne Transmission of Human Exhaled Bio-Aerosols in Buildings. J. Thorac. Dis. 10, S2295–S2304. doi:10.21037/jtd.2018.01.24
Reed, N. G. (2010). The History of Ultraviolet Germicidal Irradiation for Air Disinfection. Public Health Rep. 125, 15–27. doi:10.1177/003335491012500105
Rijn, C., Somsen, G. A., Hofstra, L., Dahhan, G., Bem, R. A., Kooij, S., et al. (2020). Reducing Aerosol Transmission of SARS‐CoV‐2 in Hospital Elevators. Indoor Air 30, 1065–1066. doi:10.1111/ina.12744
Schoen, L. J. (2020). Guidance for Building Operations during the COVID-19 Pandemic. Available at: https://www.ashrae.org/file%20library/technical%20resources/ashrae%20journal/2020journaldocuments/72-74_ieq_schoen.pdf. (Accessed March 3, 2021).
Storm, N., McKay, L. G. A., Downs, S. N., Johnson, R. I., Birru, D., de Samber, M., et al. (2020). Rapid and Complete Inactivation of SARS-CoV-2 by Ultraviolet-C Irradiation. Sci. Rep. 10, 22421. doi:10.1038/s41598-020-79600-8
Walker, C. M., and Ko, G. (2007). Effect of Ultraviolet Germicidal Irradiation on Viral Aerosols. Environ. Sci. Technol. 41, 5460–5465. doi:10.1021/es070056u
Yin, R., Dai, T., Avci, P., Jorge, A. E. S., de Melo, W. C., Vecchio, D., et al. (2013). Light Based Anti-infectives: Ultraviolet C Irradiation, Photodynamic Therapy, Blue Light, and beyond. Curr. Opin. Pharmacol. 13, 731–762. doi:10.1016/j.coph.2013.08.009
Zhang, R., Li, Y., Zhang, A. L., Wang, Y., and Molina, M. J. (2020a). Identifying Airborne Transmission as the Dominant Route for the Spread of COVID-19. Proc. Natl. Acad. Sci. USA 117, 14857–14863. doi:10.1073/pnas.2009637117
Zhang, S., Diao, M., Yu, W., Pei, L., Lin, Z., and Chen, D. (2020b). Estimation of the Reproductive Number of Novel Coronavirus (COVID-19) and the Probable Outbreak Size on the Diamond Princess Cruise Ship: A Data-Driven Analysis. Int. J. Infect. Dis. 93, 201–204. doi:10.1016/j.ijid.2020.02.033
Appendix: Supporting information on computing the LRV in a UVC chamber.
The dose associated with a LRV for a defined pathogen reached in a single-pass UVC chamber is estimated under an assumption of linearity, using the following relationships (Bolton et al., 2015):
The fluence rate is where R is the reflectivity in % and NC is the ratio of surface area not covered by reflective material (for instance, if an LED strip is fixed on top of a reflective surface or end caps of the chamber are used for the fans) (Grandusky et al., 2016).
Keywords: ACH and eACH, airborne transmission, healthy buildings, air quality, UVC disinfection, ventilation, HVAC, COVID-19
Citation: Kahn K and Mariita RM (2021) Quantifying the Impact of Ultraviolet Subtype C in Reducing Airborne Pathogen Transmission and Improving Energy Efficiency in Healthy Buildings: A Kahn–Mariita Equivalent Ventilation Model. Front. Built Environ. 7:725624. doi: 10.3389/fbuil.2021.725624
Received: 15 June 2021; Accepted: 19 August 2021;
Published: 07 October 2021.
Edited by:
Young Ki Kim, United Arab Emirates University, United Arab EmiratesReviewed by:
Francesco Leccese, University of Pisa, ItalyGiuseppe Riccio, University of Naples Federico II, Italy
Copyright © 2021 Kahn and Mariita. This is an open-access article distributed under the terms of the Creative Commons Attribution License (CC BY). The use, distribution or reproduction in other forums is permitted, provided the original author(s) and the copyright owner(s) are credited and that the original publication in this journal is cited, in accordance with accepted academic practice. No use, distribution or reproduction is permitted which does not comply with these terms.
*Correspondence: Kevin Kahn, a2V2aW5oLmthaG5AZ21haWwuY29t; Richard M. Mariita, cmljaGFyZC5tYXJpaXRhQGNpc3V2Yy5jb20=