 Peter E. Robins
 Matt J. Lewis
 Mariam Elnahrawi
 Charlotte Lyddon
 Neil Dickson1
- 1School of Ocean Sciences, Bangor University, Bangor, United Kingdom
- 2School of Environmental Sciences, University of Hull, Hull, United Kingdom
Estuaries are potentially exposed to compound flooding where weather-driven extreme sea levels can occur synchronously with extreme fluvial discharge to amplify the hazard. The likelihood of compound flooding is difficult to determine due to multiple interacting physical processes operating at sub-daily scales, and poor observation records within estuaries with which to determine potential future probabilistic scenarios. We hypothesize that fluvial extremes can occur within the peak of the surge in small/steep catchments because of rapid runoff times, whilst the length-scale in larger/flatter catchments will result in fluvial and marine extremes being out-of-phase. Data (15 min river flow and hourly sea level) spanning 40 years were analyzed to assesses the behaviour and timings of fluvial and sea level extremes in two contrasting estuaries: Humber and Dyfi (United Kingdom). Compound events were common in the Dyfi, a small/steep catchment on Britain’s west coast with fast fluvial response times. Almost half of the 937 skew-surge events (95th-percentile) occurred within a few hours of an extreme fluvial peak, suggesting that flood risk is sensitive to the storm timing relative to high tide—especially since flows persisted above the 95th-percentile typically for less than 12 h. Compound events were more frequent during autumn/winter than spring/summer. For the Humber, a larger/flatter catchment on the east coast with slower fluvial response times, extreme fluvial and skew-surge peaks were less frequent (half as many as the Dyfi) and compound events were less common (15% of events co-occurred). Although flows in the Humber persisted above the 95th-percentile for typically between one and 4 days, hence overlapping several high tides and possibly other surges. Analysis of 56 flooding events across both estuaries revealed: 1) flooding is more common in the Dyfi than Humber; 2) Dyfi flooding is driven by 99th-percentile flows lasting hours and co-occurring with a 95th percentile skew-surge; 3) Humber flooding was driven by 95th-percentile flows lasting days, or surge-driven—but rarely co-occurring. Our results suggest that compound flooding studies require at least hourly data (previous analyses have often used daily-means), especially for smaller systems and considering the potential intensification of rainfall patterns into the future.
Introduction
Estuarine flooding is driven by two types of weather events: strong storms that generate large surges and waves at the coast, and/or intense precipitation leading to high pluvial and fluvial flows (Ward et al., 2018). Several of the world’s major cities and industrial centres are located at the coast of steep catchments where there is a risk of compound flooding from these weather events, e.g., Tokyo/Yokohama (Koyama and Yamada. 2020), Taipei City (Su 2016) and Concepcion (Rojas et al., 2018). In the United Kingdom, coastal flooding has an annual cost of ∼£2.2 billion for flood management and emergency response (Penning-Rowsell 2015). Flooding threatens the integrity of estuarine ecosystems, which rank alongside tropical rainforests and coral reefs as the world’s most productive and biodiverse environments (Cai 2011). Estuarine flooding disrupts land-sea fluxes of nutrients including carbon (Paerl et al., 2020) and exposes harmful pathogenic viruses (Robins et al., 2018) and pollutants (e.g., microplastics; Hitchcock 2020) to coastal environments—potentially impacting upon food security and human health (Barbier et al., 2011). Flood risk zones surrounding estuaries are increasingly being recognised as valuable open spaces that contribute to our social wellbeing, and the long-term physical and mental impacts of flooding, especially for socially deprived communities, are only starting to be realized (Martin et al., 2020). Improved estimates of extreme river flow and sea level behaviour and timings into the future, therefore, are essential for estuary flood emergency response, flood risk policymaking, disaster risk reduction, environmental impact assessments and engineering practices.
Aside from tsunamis, some of the most catastrophic global flooding events are caused by the combination of extreme sea levels and extreme fluvial flows occurring concurrently or in close succession–that together can act to amplify the hazard (Pugh 1987; Paprotny et al., 2018; Bevacqua et al., 2019). Presently, compound flooding hazards are often omitted in coastal flooding risk analyses, implying that extreme sea levels and river flows are considered as independent phenomena (Wahl et al., 2015). However, extreme sea levels derive from wind fields and variations in atmospheric pressure (inverse barometer effect) associated with storm tracks that vary in size, speed and trajectory and interact with tides and surface waves (Von Storch and Woth 2008)—and importantly can bring intense precipitation. In the United Kingdom, for example, low pressure systems typically travel north-eastwards during autumn and winter, causing concurrent extreme precipitation and storm surges–that potentially result in a compound flood risk on south/west-facing catchments and estuaries (Wilby and Wigley 1997; Haigh et al., 2016). Indeed, for estuaries in Southern and Western Britain, Svensson and Jones (2004) generally found strong dependence between extreme river flows and storm surges. Conversely, for estuaries in Eastern Britain, Svensson and Jones (2002) found a weak dependence, since the East coast surge and precipitation events are driven by different storm patterns. Another consideration here is the relatively slow north-to-south propagation of surge peaks in the North Sea (Horsburgh and Wilson 2007). Although Svensson and Jones’ analyses used daily mean river flow data that, for the many small and steep catchments on Britain’s west coast, poorly (or fail to) resolve extreme flow magnitudes (Robins et al., 2018). Adding to this, as compound fluvial-surge events tend to cause flooding only during high tides (Zheng et al., 2013; Petroliagkis et al., 2016; Zellou and Rahali 2019), for flood risk, an analysis of sea level and river flows at < hourly scales is therefore needed. The importance of fluvial extremes in small/flashy catchments in Britain was captured by Robins et al. (2018).
To our knowledge, analyses of compound flooding events have not explored their timings and behaviour at sub-daily scales across different estuary and catchment types. In the light of this, this study aims to investigate for two contrasting estuaries, the Dyfi and Humber (United Kingdom), the likelihood, timings, behaviour and interactions of compound flooding events at sub-daily scales and to establish whether seasonal patterns or long-term trends are evident in the historical data. We hypothesize that: 1) river flow and sea-level extremes can co-occur at sub-daily scales in United Kingdom estuaries, but it is expected that their dependence is higher for the Dyfi than the Humber due to the Dyfi’s exposure to prevailing south-westerly storm tracks and flashy hydrology; and 2) high water levels caused by combination events is therefore more common in the Dyfi than the Humber. Using up to 40 years of historical data that includes reported flooding events, we aim to establish the relative drivers and thresholds for estuary flooding in these catchments, when flooding has occurred, and why. Our main objective is to highlight where sub-daily scale co-occurrence analysis of flood risk is needed—to direct future research that could future proof our coastal communities and ecosystems from the risk of changing extreme river and sea-level climates; both spatially and temporally (e.g., more intense summer down pours predicted for the United Kingdom—see Seneviratne et al., 2012; Kendon et al., 2014).
We focus on the Dyfi and Humber due to their locations on opposite coasts of Britain and contrasting catchment characteristics driving fluvial response behaviour to precipitation (see Figure 1). The Dyfi Estuary is located on the west coast of Britain. It is a macro-tidal estuary with a mean spring tidal range of nearly 5 m. It is relatively small, being 8 km long with a mean surface area around 17 km2 (Shi 1993) and shallow, largely drying out at low tide (Robins and Davies 2010). The River Dyfi is the primary fluvial input to the estuary, draining a catchment area of 470 km2 and having a length of 48 km with an annual mean flow of 23 m3/s and extreme 95th flow of 78 m3/s.1 These scales imply that fluvial flood waters will reach the Dyfi Estuary in a matter of hours. In contrast, the Humber Estuary is located on the east coast of Britain and drains the second largest coastal plain estuary in the United Kingdom, covering an area of over 26,000 km2.1 The Humber has four sub-catchments that drain into the River Derwent, Aire, Ouse and Trent, with a combined mean flow of around 200 m3/s and 95th percentile flow of 570 m3/s. Like the Dyfi, the Humber is a macro-tidal estuary with a mean spring tidal range of 5.7 m (Edwards and Winn 2006) and depths between 4 and 14 m at low water (Marshall and Elliott 1998). With river lengths up to 300 km, it is likely that fluvial waters will take days to reach the Humber Estuary.
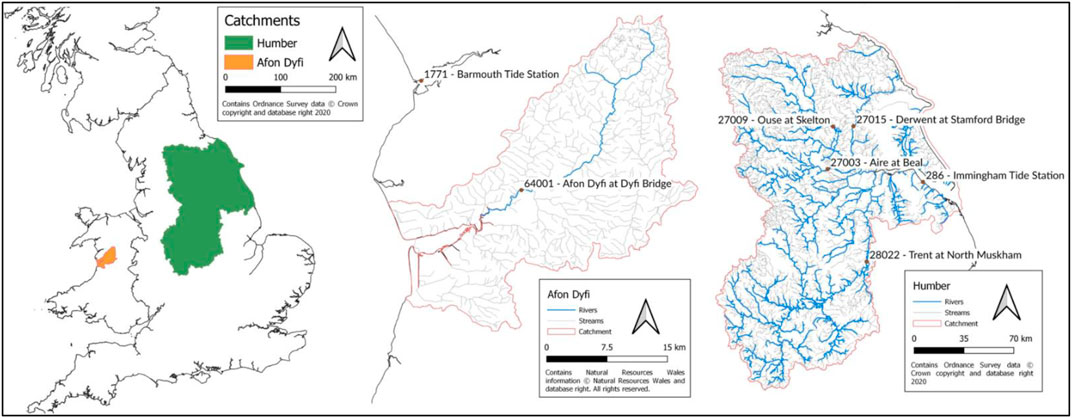
FIGURE 1. Map of Britain showing the location of the Dyfi and Humber estuaries and their drainage basins. Fluvial and sea level gauge stations from which data was acquired are labeled.
Methods
Fluvial and Sea Level Data
River flow data at 15 min instantaneous output frequency was obtained from Natural Resources Wales (Dyfi) and the Environmental Agency (Humber). The data has been quality controlled. The Dyfi gauging station used was at Dyfi Bridge (ID: 64001) (Figure 1). The time series spans 1980 to 2020 and was largely complete (Figure 2). The Humber gauging stations used were at Stanford Bridge on the Derwent (ID: 27015), North Muskham on the Trent (ID: 28022), Skelton on the Ouse (ID: 27009) and Beal on the Aire (ID: 27003) (Figure 1). The four gauges had complete time series data spanning 1980 to 2015 (Figure 2). For the subsequent analyses, these flows were aggregated together to form one flow time series that enters the Humber Estuary. We have assumed that the time of peak flow was equivalent to the time of peak river height, since the gauges are at stable rating sections and they are not affected by the tide.
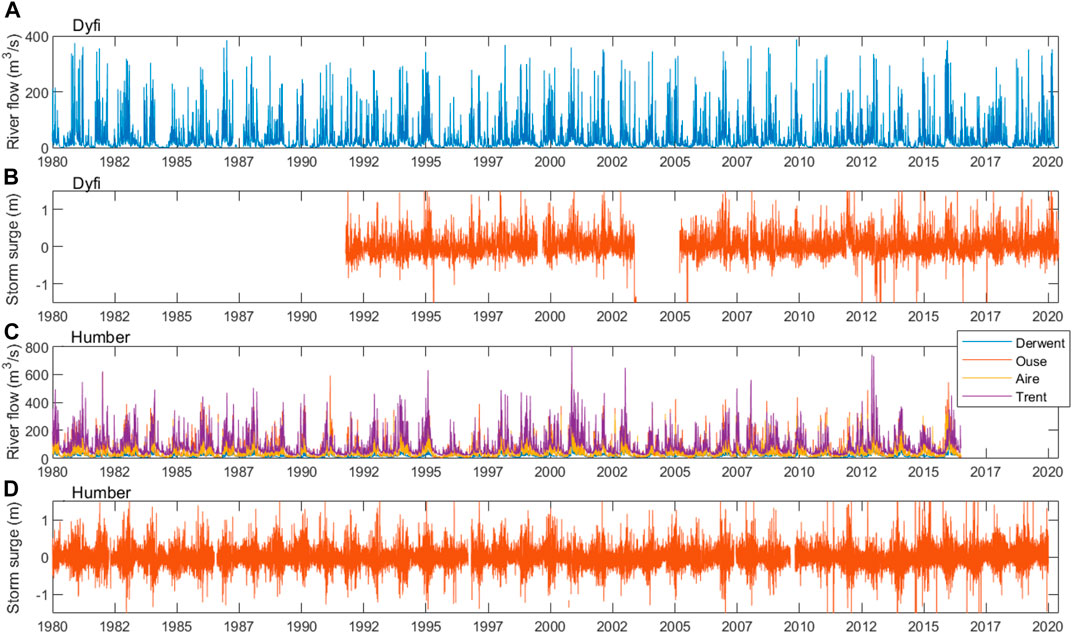
FIGURE 2. Dyfi: (A) Flow at Dyfi Bridge on the Dyfi (ID: 64001) and (B) storm surge at Barmouth tide gauge. Humber: (C) Flow at Stanford Bridge on the Derwent (ID: 27015), North Muskham on the Trent (ID: 28022), Skelton on the Ouse (ID: 27009) and Beal on the Aire (ID: 27003); and (B) storm surge at Immingham tide gauge.
Total water level data, i.e., the astronomical tide plus the storm surge component, were obtained from the nearest tide gauges at hourly frequency, from the national tidal and sea level facility (ntslf.org). The Barmouth tide gauge was used for the Dyfi, that is 20 km from the estuary mouth and 40 km from the river gauge location (ocean distances) (Figure 1). Comparison of observed total water level at Barmouth tide gauge and modeled total water level at Dyfi estuary (from CoDEC, Muis et al., 2020) confirms good phase agreement and up to 0.16 m RMSE on tidal amplitude, indicating Barmouth is representative of sea level at Dyfi. The data spans 1991 to 2020, but with a period of no data during 2003–2004 (Figure 2). For the Humber, the tide gauge at Immingham was used, located within the estuary and approximately 50–60 km from the river gauges (Figure 1). The time series spanned the period 1980 to 2020 and was largely complete (Figure 2). For the subsequent analyses, both the storm surge and the skew surge were extracted from the data. Storm surge was defined as the instantaneous difference between the total water level and the astronomical tide. Storm surge data were interpolated from hourly to 15 min to match the river flow data. Skew surge was used for our extreme value analysis, since this represents the maximum sea level, defined by de Vries et al. (1995) as the difference between the maximum observed sea level and the nearest astronomical high tide (the relative timings of peaks in sea level and astronomical tide can differ slightly)—i.e. producing one skew surge value per high tide (Figure 3).
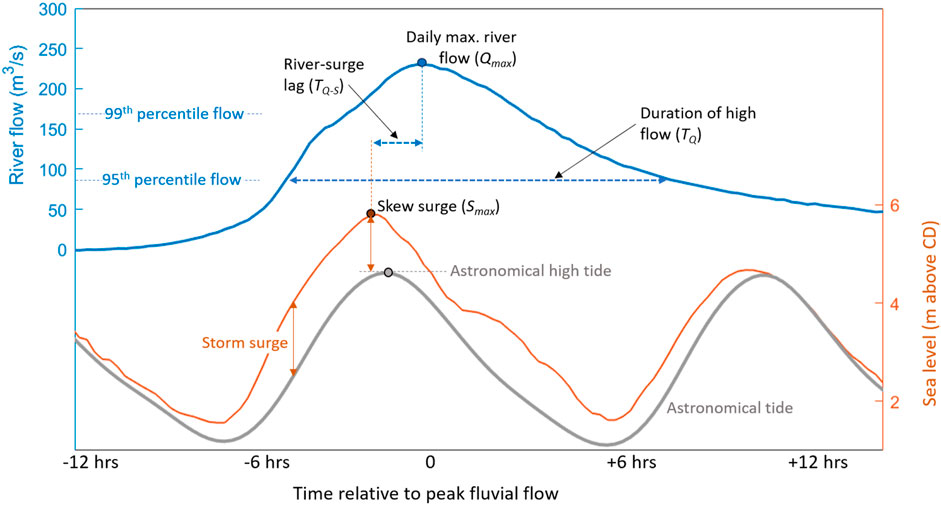
FIGURE 3. Schematic showing definition of the parameters used in the analysis.
Analysis Techniques
We investigated for each estuary whether extreme river flow and skew surge events were correlated and dependent upon one another, using linear regression and correlation. For our regression analysis, we extracted the magnitude and timing of the maximum river flow each day (denoted Qmax in Figure 3). Days with no “peak” fluvial event were omitted from the analysis. Next, we extracted the time of the maximum water level 12.5 h before or after each Qmax and assigned to this the magnitude of the skew surge (denoted Smax in Figure 3), to ensure that one full tidal cycle is captured within the data. Note that a skew surge doesn’t strictly have an associated time as it represents the whole tidal cycle, but we have used the time of maximum water level as this is when the value is calculated. Linear regression (Weisberg 2005) was conducted to establish the direct dependence in magnitude between daily peak fluvial events (Qmax) and the corresponding skew surge (Smax). Correlation coefficients (Abdi 2007) were established to quantify to what extent statistically Qmax and Smax were correlated. Kendall rank correlation coefficient was used as it is less sensitive to data outliers compared with Spearman’s coefficient (Croux and Dehon 2009). Correlation coefficients were calculated based on annual and seasonal (winter: Dec–Feb, summer: May–Jul) time frames, each year, to show interannual changes in correlation. Correlation coefficients were also calculated based on monthly time frames and then these monthly values were averaged over all the years in each record to characterize seasonal variability in the correlations. Cross-correlation analyses were performed, using all 15 min flow and storm surge (interpolated from hourly to 15 min) data, to estimate if surge and river flows were correlated as a function of a time-lag. Our subsequent analysis (see Figure 4 and Supplementary Material figures) shows that 15 min flow data is required to resolve extreme hydrology that drives flooding; hence, the surge data was interpolated to 15 min (rather than averaging the flow data to hourly).
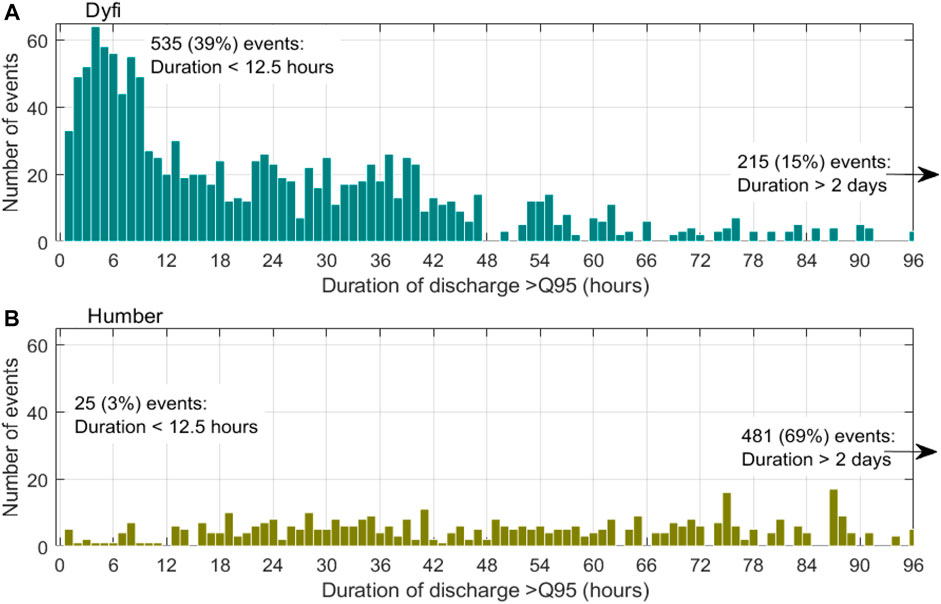
FIGURE 4. Histograms showing fluvial event durations (TQ, in hours) that the flow exceeds the 95th percentile flow, for (A) the Dyfi (Q95 = 80 m3/s) and (B) the Humber (Q95 = 570 m3/s).
The time lags of compound fluvial-skew events were calculated, based on the relative timings of Qmax and Smax, e.g., denoted TQ-S in Figure 3. Only events that exceeded the 95th percentile of the respective time series were considered, thereby omitting smaller events that would not contribute to flooding. This criterion isolated 1,359 fluvial and 937 skew events for the Dyfi, and 696 fluvial and 1,181 skew events for the Humber. The durations of these extreme river flow events were calculated, defined as the period where the flow was above the 95th percentile of the time series, e.g., denoted TQ in Figure 3.
The final step in our analysis involved examining specific events when flooding was reported, to disintangle the fluvial, tidal and surge drivers of the flooding, and hence to set these conditions relative to the broader spectrum of extreme conditions experienced in each estuary. Data quantifying flood inundation characteristics are rare or often qualitative. Nevertheless, the dates that flooding were reported in the Dyfi were isolated between 2000 and 2020 in the upper estuary resulting in the road closure of Dyfi Bridge. The flooding dates were provided by Natural Resources Wales. For the Humber, we focussed on flooding reported in the upper estuary at the confluence of the rivers, in the Goole to Alkborough region. We obtained freely available data on flooding event dates from the DEFRA Data Services Platform (https://environment.data.gov.uk/dataset/8c75e700-d465-11e4-8b5b-f0def148f590). For each date of reported flooding in each estuary, we extracted from our time series data a 3 day period preceding the day of flooding to establish the probable drivers: river flow magnitude (Qmax) and duration (TQ), associated total water level and skew surge (Smax), and the co-occurrence or lag between peak flow and skew surge (TQ-S). This analysis is important for validating the correlation results. Forty-eight flooding events were isolated for the Dyfi and eight events for the Humber.
Results
Fluvial and Sea Level Time Series Analysis
The dependence between daily peak river flow (Qmax) and corresponding maximum skew surge (Smax) was assessed using linear regression. For the Dyfi, the linear regression line shows a positive relationship between the data, but with an R2 value of 24% indicating low confidence or large variability within the regression (Figure 5A). For the Humber, there was also a positive relationship between the data, although with lower confidence still as the R2 value of the regression line was 9% (Figure 5C). The three-way relationship between Qmax, Smax and astronomical high water is shown in Figure 5B (Dyfi) and Figure 5D (Humber). Qualitatively, the positive relationship between Qmax and Smax was clear for the Dyfi (i.e., data colour changing from yellow to red with increasing skew), albeit with much variability; but the relationship was less clear for the Humber. Figures 5B,D show that the compound river-skew events were spread across spring-to-neap tides, i.e. the data points were well distributed along the y-axis, indicating that compound events are equally likely to occur during spring tides as neap tides, as one might intuitively expect.
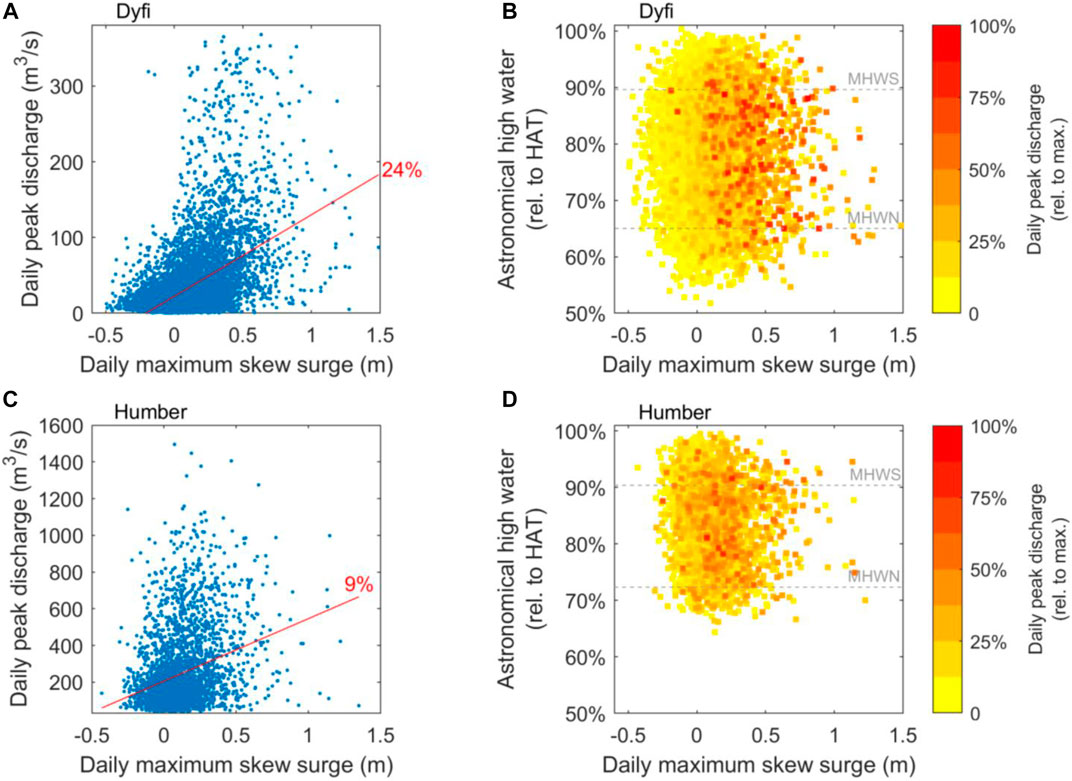
FIGURE 5. Relationship between daily maximum skew surge and daily peak river discharge, for (A) Dyfi and (C) Humber. The linear regression lines are plotted in red with the R2 value (as a percentage). Three-way relationship between daily maximum skew surge, daily maximum astronomical tide and daily peak river discharge, for (B) Dyfi and (D) Humber. The mean high water spring (MHWS) and mean high water neap (MHWN) levels are marked.
For both estuaries, Kendalls rank correlation coefficients (R2 values) between Qmax and Smax, were calculated. We split the analysis into annual time series (Figures 6A,B), winter months only (Dec–Feb.; Figures 6C,D), and summer months only (May–Jul.; Figures 6E,F) to resolve seasonal effects to weather systems that drive flooding. Correlation coefficients were also calculated based on monthly time series segments and then averaged for corresponding months throughout each data record (Figures 6G,H) to further resolve the sub-annual variability to compound flood risk in estuaries. For both the Dyfi and Humber, the inter-annual analysis showed a positive correlation between Qmax and Smax, with R2 ranged between zero and 50%, with time-averaged R2 values of 27% (Dyfi) and 23% (Humber) Figures 6A,B). The annual analysis did not indicate a clear long-term trend in the Dyfi correlations, although a small positive trend was apparent in the winter rather than the summer signal–although with much interannual variability and low confidence (R2 = 5%) (Figures 6A,C,E). Similarly, no clear long-term trends were evident for the Humber either, although a negative trend was apparent in the summer, but again with much interannual variability and low confidence (R2 = 30%) (Figures 6B,D,F). Looking at the seasonal patterns, there were generally higher correlations during autumn/winter than in spring/summer months for the Dyfi–albeit with much inter-annual variability (Figure 6G), but lower correlations and no seasonal pattern for the Humber (Figure 6H). The cross-correlation analyses comparing river flows with storm surges, using all 15 min data to give the strongest correlation score and time-lag, again showed a stronger normalized correlation for the Dyfi than Humber, with the Dyfi displaying a clear peak correlation with a lag of ∼6 h and a muck weaker correlation for the Humber (Figure 7).
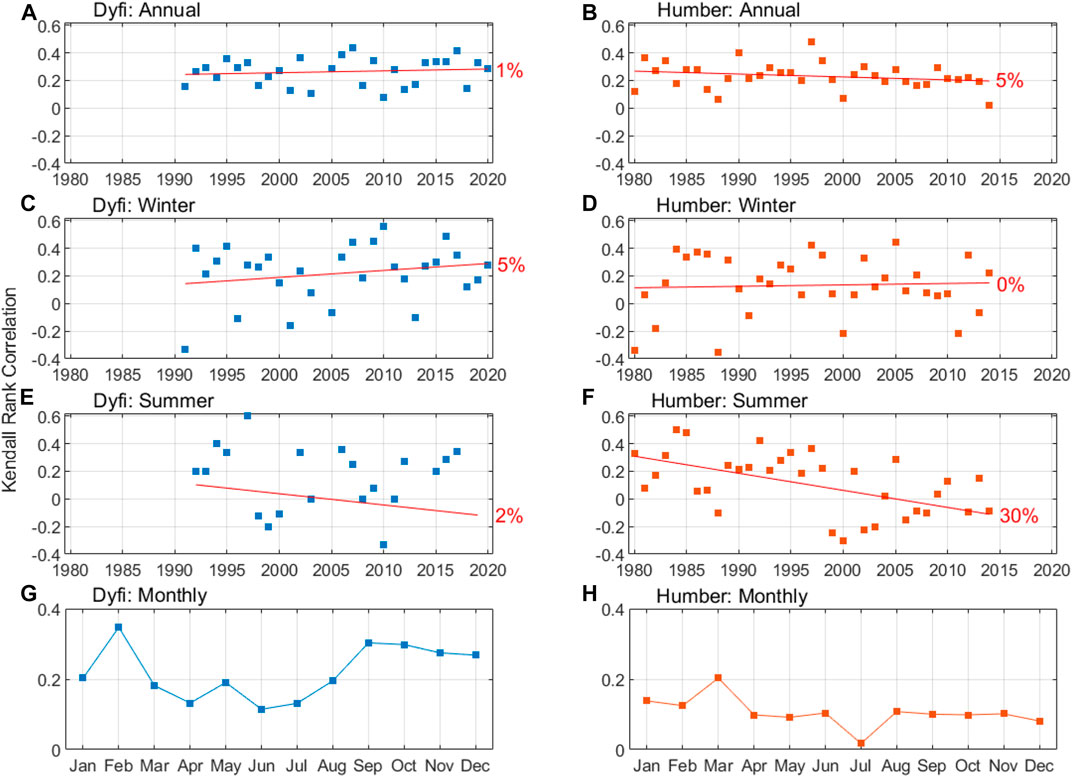
FIGURE 6. Kendall Rank correlation coefficients comparing daily peak fluvial flow with daily maximum skew surge, grouped (A–B) inter-annually, (C–D) inter-winters (Dec–Feb), (E–F) inter-summers (May–Jul), and (G–H) monthly. The left panels represent the Dyfi and right panels the Humber.
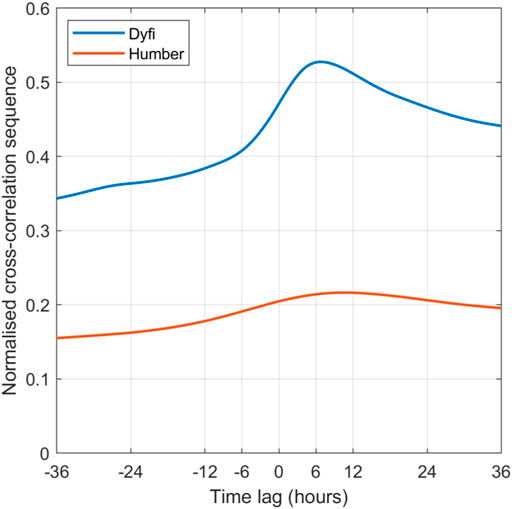
FIGURE 7. Cross-correlation results for river flow versus storm surge, using all 15-min data, for the Dyfi and Humber.
We investigated the relative timings of extreme Qmax events (i.e., those exceeding the 95th percentile) and extreme Smax events (again, those exceeding the 95th percentile), denoted TQ-S. We also calculated the duration that the extreme river flow events exceeded the 95th percentile flow (TQ). For the Dyfi, most of the 937 extreme Smax events co-occurred with an extreme Qmax event, i.e., 45% of these events occurred within 12.5 h of one another (Figure 7A). In contrast, for the Humber only 15% of the 1,181 extreme Smax events occurred within 12.5 h of an extreme Qmax event, and the majority of these events (74%) were separated by more than 2 days and therefore are not considered compound events (Figure 8B). Of the 1359 TQ events in the Dyfi, most were of short duration, in fact 39% of these events exceeded the 95th percentile flow for less than 12.5 h (Figure 4A). This result implies that extreme high flow events in the Dyfi will not necessarily coincide with high tide. The Humber is a much slower responding system, as shown in Figure 4B, where most (69%) of the 696 TQ events had a duration that exceeded the 95th percentile flow continuously for at least 2 days. Therefore, the coincidence of high flow and high sea-level becomes more likely, irrespective of the weak correlation found between the timings of peak river flow and skew surge.
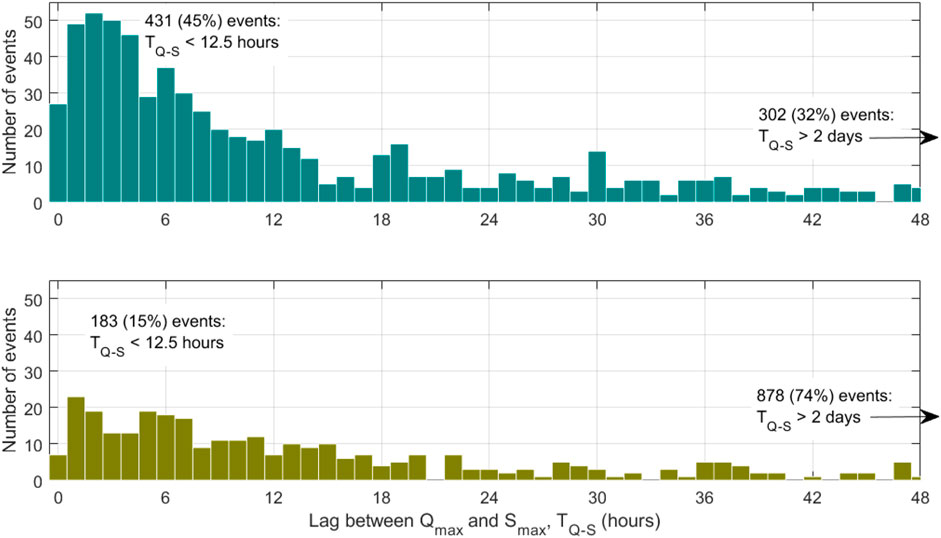
FIGURE 8. Histograms showing the relative time lag in hours between peak river flow (95th percentile flow) and the nearest 95th percentile skew surge (TQ-S), for (A) Dyfi and (B) Humber.
Analysis of Specific Flooding Events
Flooding events in the Dyfi and Humber were isolated for the following analysis, based on flooding dates in the upper estuaries reported by Natural Resources Wales (NRW) and the Environment Agency (EA), for the Dyfi and Humber, respectively. From our time series data, we extracted a 3 day period preceding the day that the flooding occurred to establish the probable drivers of the flooding: river flow magnitude (Qmax) and duration (TQ), total water level and skew surge (Smax), or a combination of these factors. These data are presented in Figure 9, and in Supplementary Table S1; Supplementary Figures S1.1–S1.48 (Dyfi) and Supplementary Figures S2.1–S2.8 (Humber) in the Supplementary Material.
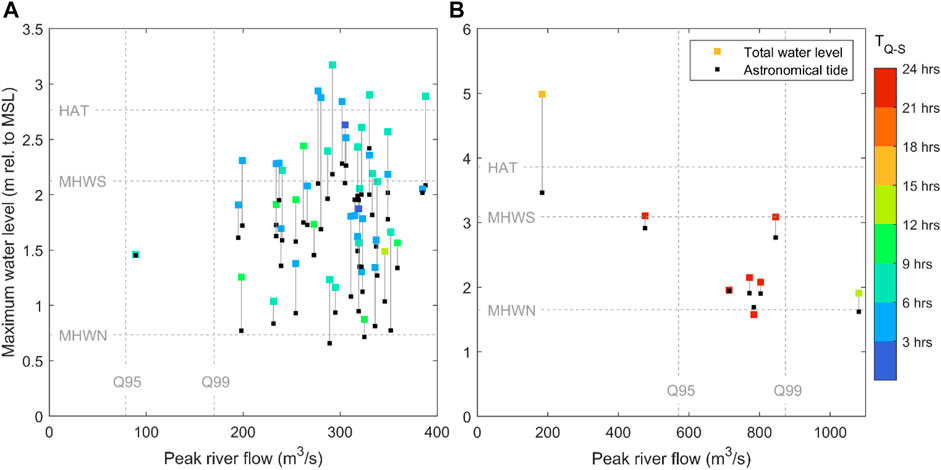
FIGURE 9. Graphs showing the relationship between peak river flow (Qmax) and maximum water level (astronomical tide plus skew surge, Smax), for (A) the Dyfi based on 48 reported flooding events and (B) the Humber base on eight reported flooding events. The colour scale denotes the lag between maximum water level and peak river flow.
Dyfi: The 48 reported flooding events, between 2000 and 2020, all experienced peak flows over 195 m3/s, i.e., above the 99th percentile flow of 170 m3/s (Figure 9A). The majority of these events (>70%) experienced flows above the 99th percentile for more than 12 h (Supplementary Table S1), this threshold being equivalent to the Dyfi’s spring tidal prism, or 7,345 Tons of water entering the estuary. Maximum water levels (astronomic tide plus skew surge) were mostly at a level equivalent to mean high water springs—but not always, as several events occurred with water levels closer to mean high water neaps. Over half the events (56%) experienced a skew surge exceeding the 95th percentile, and 20% of events experienced a skew surge exceeding the 99th percentile. However, approximately 10% of the events occurred with a negligible surge. Roughly half the flooding events experienced extreme fluvial and skew surge events that co-occurred within 3 h and 75% co-occurred within 6 h (Supplementary Table S1). The sub-daily co-occurrence of extreme fluvial and skew surge events is indicated by the colour scale on Figure 9, where all events are coloured blue and occur within 12 h. The exception to the above results was flooding event D1, a summer event when neither the peak discharge (90 m3/s) nor maximum sea level (4.4 m) were particularly extreme and, so, one would not expect D1 to lead to flooding.
Humber: Less flooding events were reported in the upper estuary of the Humber (6 events between 2000–2020 and eight events between 1980–2020) than the Dyfi (48 events between 2000–2020). The majority of the Humber flooding events were fluvially-driven, with peak flows above the 95th percentile of 570 m3/s, but only one event exceeding the 99th percentile (Figure 9B). However, flow durations were long, as indicated by the colour scale on Figure 9: 75% of events had flows above the 95th percentile for more than 2 days, and 35% of events had flows above the 95th percentile for more than 3 days–equating to 1.5 × 10⁵ Tons of water or ∼10% of spring tidal prism. Skew surges were generally small (half the events had a skew surge less than the 95th percentile), although one event had an extremely high skew surge of 1.52 m (well above the 99th percentile), with relatively low flow and longer TQ-S with extreme flow so clearly being a surge-driven flood. These flooding events were generally not compound events, as skew surges and peak river flows were generally several days apart—so either being fluvially-driven or surge-driven.
Discussion
Drivers of Flooding
Flooding in estuaries arises from exceptionally high river levels following heavy rain or snow melt, or from exceptionally high sea levels caused by surge-tides, but the combination of these events—compound flooding—presents the worst-case flood risk. Compound flooding events are presently not well understood across differing locations and catchment and estuary types, meaning that it is difficult to assess the impacts of flooding presently and from future climate and land use changes. Climate predictions for the United Kingdom are in agreement that we are to experience hotter, drier summers and wetter winters (Robins and Lewis 2019). However, high-resolution modelling has shown that this average climate signal may not reflect extreme weather patterns—for example, we are likely to experience more intense downpours, meaning that extreme fluvial flows will likely increase above natural variability (Kendon et al., 2014). These changes in extreme fluvial flows could potentially affect flood risk, especially in smaller catchments but less likely in larger catchments. Climate predictions are less clear on the future behaviour of storm tracks (see Langenbrunner et al., 2015; Shaw et al., 2016), meaning that storm surges may not necessarily increase. Additionally, land-use changes are known to affect hydrology and, in turn the behaviour of extreme flows entering estuaries—not only their magnitude but event durations and timings that will affect compound flood risk (e.g., Kouhi et al., 2020). Therefore, it is clear that we must understand how the drivers of compound flooding may change now, so that we are in a position to assess the impacts of future change. To do so, we examined the past climatology of fluvial flow and sea level behaviour in two contrasting estuaries, the Dyfi and Humber (United Kingdom), over a 40 year period–to explore the potential for their co-occurrence and temporal variability, as well as any longer-term trends. Our study identified robust methods to investigate compound flooding and an obvious extension of this work would be a national or wider study.
We hypothesized that compound events of extreme fluvial flows and sea levels can occur in estuaries, since low-pressure storms increase a component on the sea level (storm surge) and drive the fluvial extreme (precipitation). Whilst this was investigated at national scale by Svensson and Jones (2002) and Svensson and Jones (2004) and more recently Hendry et al. (2019), these studies were based on daily-averaged data that may not resolve the river flow and surge behaviour, especially for flashy catchments where extreme river flows last for hours rather than days (Robins et al., 2018)—meaning that daily-averaged data would smooth out these events. Our analyses used historical 15 min fluvial and hourly sea level observations (interpolated to 15 min)—illustrating for the Dyfi that 39% of fluvial events that exceeded the 95th percentile flow persisted above that threshold for less than 12.5 h. In such flashy catchments, river flow and storm surge data need to be resolved at sub-tidal time scales, since flood risk will also be contingent on the tidal phase. In contrast, the Humber is a much slower responding system, where 95th percentile flows persisted for several days.
Our analysis revealed, for the first time to our knowledge, that fluvial and surge drivers of estuary flooding can and do co-occur at a sub-tidal timescale but is contingent on estuary and catchment size. There was a positive correlation between peak river flow and skew surge for the Dyfi, although the correlation was weak and variable year-on-year. This result is broadly consistent with the findings by Svensson and Jones (2004) and Hendry et al. (2019), who found dependence between daily-averaged storm surge and fluvial flow across western Britain. We found slightly higher correlation during winter and autumn months than spring/summer. This could be explained by soil moisture characteristics; as soil would absorb more precipitation in the summer months, it can affect the magnitude and timings of the fluvial flow (e.g., Aubert et al., 2003). However, the relationship is clearly complex and although Svensson and Jones (2004) showed slightly higher dependence during summer months—attributed to southerly summer storm tracks (the storm tracks are westerly in the winter)—the result was not clear. Elsewhere, Svensson and Jones (2006) found dependence between daily-mean fluvial flow on the River Taff and daily-mean surge heights at Cardiff, whereas Samuels and Burt (2002) concluded no dependence using peak fluvial flow times and peak sea level (highest water level nearest in time to the flow peak). The median lag between extreme river flow and sea level (TQ-S) in the Dyfi was 2–3 h (Figure 8). Although the sea level data analyzed were outside the estuary and the tide will take approximately 2–3 h to propagate through the estuary, so the peaks in sea level and river flow will likely co-occur. Of the reported flooding events analyzed since 2000, roughly 75% experienced a lag ≤6 h, meaning that maximum sea levels and flows were broadly coincident when the tidal propagation is considered1. Simulated flooding in the Dyfi estuary to be sensitive to such lag timings—the greatest flooding occurring with a 45 min lag. Investigations into the precise timings of compound flooding within estuaries require sea-level data that resolves the up-estuary tidal progression.
The Humber showed a weak correlation between peak river flow and skew surge, based on the correlation and cross-correlation analyses. Due to the length of the Humber estuary,1 showed through hydrodynamic modelling that the highest water levels (and most flood inundation) occurred when peak surge at the estuary mouth and peak river flows at the estuary head were 3 hours apart. Our analysis (Figure 8) shows that a lag of 3 hours or so has indeed occurred in the data records, although the majority (74%) of extreme events do not co-occur. Nevertheless, the duration of extreme fluvial events last for several days and span several high tides, presenting a combination hazard risk between extreme river flows and spring tides.
Following on from our initial hypothesis, we expected flooding to be more common in estuaries with higher occurrence of compound events. Indeed, the mean number of fluvial events >95th percentile per year was 34 for the Dyfi compared with 19 for the Humber. Further, more flooding events were reported in the Dyfi (48 events between 2000–2020) than the Humber (6 events between 2000–2020 and eight events between 1980–2020). Is this because the flooding events were selected based on data at a location in the upper estuary? Note that we focused on the upper estuaries where combination flooding is more likely to occur. Our results would undoubtably change in the lower estuary (i.e., where flooding is primarily driven by extreme water levels and waves). Further, the Dyfi has limited flood defence measures. Whereas the Humber is largely covered to a 1 in 50 years water level (Humber Flood Risk Management Strategy 2014). From our analysis, the flooding events in the upper Dyfi estuary were driven by river flows in the extreme 99th percentile, with high sea level contributing as a secondary driver (i.e., not all flooding events occurred with water levels above MHWS). The dominance of fluvial-driven flooding in the Dyfi is likely due to its relatively small size and narrow (∼1 km) mouth obstructing storm surge propagation into the estuary, together with an increase in estuary width (to ∼3 km) and shallowing leading to increased frictional resistance and surge-tide damping (e.g., Lyddon et al., 2018)—although this has not yet been shown in the Dyfi. The effect of the peak river flow-skew surge co-occurrence, or not, is difficult to disentangle because of the short duration of high river flows (lasting several hours). Due to tide-surge interaction and the persistence of storm surge events, elevating marine water-levels above MSL for most of the period between two high tides, there is a reduced capacity for the river water to drain trough the estuary, i.e., the pressure gradient force in the upper estuary is reduced and rivers waters build up—the back water effect. Model simulations by1 agree with this as it is the friction and the dynamic head (driving flow) that ultimately controls the volume of flood water exiting an estuary. Therefore, in the Dyfi, and similar sized estuaries, compound flooding is not only driven by the magnitudes and timings of peak flow and sea-level, but is also contingent on their durations above critical thresholds for flooding that need to be resolved, and their nonlinear interactions.
For the upper Humber estuary, flooding has typically occurred due to large fluvial events (>95th percentile), because such events tend to persist for several high tides. Therefore, in the Humber—and systems with a similar size/geometry—this widens the opportunity for a combination event within a single fluvial event. Though the larger system is likely to experience fewer large fluvial events than a smaller one. Interestingly, from the events we analyzed, the combination of peak surge above the 99th percentile occurring synchronously with peak flow above the 99th percentile had not yet occurred, indicating the potential for a significant combination event hereto unrecorded.
Future Change
Our results do not reveal a strong long-term trend in the fluvial-skew surge correlation, with much uncertainty, for either the Dyfi or Humber. However, there was a weak positive trend in the Dyfi in the correlation in winter months, and a weak negative trend in the Humber in the correlation in summer. With the United Kingdom set to experience fewer but more intense precipitation and fluvial flows (Change 2014; Kendon et al., 2014; Watts et al., 2015), there may be a heightened flood risk for the Dyfi and presumably for similar west coast systems. Although climate predictions are less clear on future storm surge behaviour (UKCP09; Lewis et al., 2011; Lowe et al., 2019), several authors have identified a signal of spatial and temporal clustering of future extreme sea level events due to surges (e.g., interannual surge clustering in Europe: Wadey et al., 2014; spatial clustering on complex coastlines globally: Enríquez et al., 2020). Therefore, it is essential that future flood risk studies resolve future changes to the histogram of river flows, i.e. using in high spatial/temporal resolution rainfall-catchment-river models, e.g., hourly data that includes good land use parameterisation and changes. Further, joint probability methods for river and sea-levels are needed based on coupled river-ocean model data and observational records. Moreover, estuarine flood hazard may be elevated by increasing flashiness of rivers so that a higher volume of fluvial flood water escapes the estuary at a period of low tide, however this is clearly a hypothesis for future work.
Indeed,1 show using hydrodynamic modelling of worst case combination events for Humber and Dyfi, that the largest impact on future flooding in both basins is the role of sea level rise. They showed that increases in the magnitude of fluvial flows shifted the spatial patterns of flooding to the inner estuary in both systems, and that increases in surge magnitude affected the outer estuary more. However, increases in sea level rise affected both—by introducing stronger backwater effects for fluvial events increasing inner flooding and elevated sea levels especially in the outer estuary affecting water elevations and flooding there. However, it is clear from the literature that more detailed investigations of the physical interactions of the drivers of extreme sea levels within different estuary types is needed.
Conclusion
Compound flooding events in estuaries, where the concurrence or close succession of extreme fluvial flows and sea levels amplify a hazard, represent a worst-case flood risk. There is a need to understand the relative drivers of compound flooding events across differing estuaries and catchments to identify when higher temporal resolution assessment, at a sub-daily scale, is needed to resolve higher frequency fluvial-surge events. 40 years of historical sea level and river flow data from two contrasting United Kingdom estuaries were analyzed at 15 min resolution, alongside reported flooding events, to assess the occurrence, timings and behaviour of compound events. The Dyfi, on the west coast of Britain is a small, mountainous, fast-responding system and the Humber is a larger, flatter catchment with a slow fluvial response time.
For the Dyfi, compound flood risk is sensitive to the timing of peak fluvial flows relative to storm generating skew surges, as 45% of skew surge events, above the 95th percentile, occurred within 12 h of peak fluvial flows. The events were also more common in autumn/winter. Only 15% of peak fluvial flows and skew surges co-occurred in the Humber; most were separated by more than 2 days with no clear seasonal trend. The duration of peak fluvial flows has a strong control on compound flood risk in both estuaries. Peak flows persisted for less than 12 h for 39% of events in the Dyfi, further highlighting the sensitivity of the timing of peak fluvial flows to storms generating skew surges. For the Humber, peak flows persisted for longer than 2 days for 69% of events, spanning several tidal cycles so coincidence with high water is more likely. Most flooding events in the Dyfi are primarily fluvial driven, and high sea level is a secondary driver, as the estuary shape blocks surge propagation. Flooding events analyzed in the Humber are either fluvial- or surge-driven, as peak river flow and sea level occurred several days apart, but that is not to say they could not co-occur in the future.
The persistence of peak fluvial flows in the Dyfi for less than 12 h indicates that the drivers of estuary flooding can and do co-occur at sub-daily time scales, and higher frequency analysis is needed to resolve the potential co-occurrence of peak flows with skew surges and tidal high water. The shorter lag times between peak fluvial flows and skew surges, and the higher number of compound flooding events which have occurred in the Dyfi indicate that higher frequency time-series analysis may be dependent on estuary and catchment characteristics. Sub-daily analysis is more critical in flashy catchments like the Dyfi to resolve extreme fluvial flows which persist for less than 12 h, but less critical in the slower responding Humber. Two contrasting estuaries are analyzed here, and additional estuaries could be subject to similar analysis to identify a threshold as to when sub-daily-scale analysis becomes more important, and whether this can be attributed to estuary length, width, or catchment size. An analysis of the coincidence of peak fluvial flows away from the time of high water, which would eliminate the backwater effect, could also contribute understanding on how timing and duration of compound events occurs in smaller estuaries despite not presenting a flood risk.
The results have identified the need for sub-daily time-scale analysis of fluvial-surge data, particularly in smaller systems, which should be incorporated into flood impact studies and risk assessments to help maintain the resilience of estuarine communities and integrity of ecosystems under current and future climate conditions.
Data Availability Statement
Publicly available datasets were analyzed in this study. This data can be found here: https://www.bodc.ac.uk/data/hosted_data_systems/sea_level/uk_tide_gauge_network/processed/.
Author Contributions
PR: Conceptualization, Funding acquisition, Project administration, Supervision, Writing—Original Draft, Data Curation, Investigation, Formal analysis; ML: Conceptualization, Funding acquisition, Supervision, Investigation, Formal analysis, Writing—Review and Editing; ME: Writing—Original Draft, Data Curation, Investigation, Formal analysis; CL: Writing—Review and Editing; ND: Writing—Review and Editing; TC: Conceptualization, Funding acquisition, Writing - Review and Editing.
Funding
UKRI Climate Resilience Program (SEARCH: NE/V004239/1).
Conflict of Interest
The authors declare that the research was conducted in the absence of any commercial or financial relationships that could be construed as a potential conflict of interest.
Publisher’s Note
All claims expressed in this article are solely those of the authors and do not necessarily represent those of their affiliated organizations, or those of the publisher, the editors and the reviewers. Any product that may be evaluated in this article, or claim that may be made by its manufacturer, is not guaranteed or endorsed by the publisher.
Acknowledgments
The authors wish to acknowledge the NERC-UK Climate Resilience Programme project “SEARCH (NE/V004239/1),” the NERC-ERII project “CHEST” (NE/R009007/1), the ERDF funded SEEC project (http://seec.bangor.ac.uk/), the NERC Plastic Vectors project (NE/S004548/1), and the METRIC project (EP/R034664/1). Thomas Clough (Bangor University) kindly provided graphics for Figure 1.
Supplementary Material
The Supplementary Material for this article can be found online at: https://www.frontiersin.org/articles/10.3389/fbuil.2021.727294/full#supplementary-material
Footnotes
1Harrison, L. M., Coulthard, T. J., Robins, P. E., and Lewis, M. J. (2021). Sensitivity of Estuaries to Compound Flooding. Estuaries and Coasts. manuscript in review.
References
Abdi, H. (2007). The Kendall Rank Correlation coefficientEncyclopedia of Measurement and Statistics. Thousand Oaks, CA: Sage, 508–510.
Aubert, D., Loumagne, C., and Oudin, L. (2003). Sequential Assimilation of Soil Moisture and Streamflow Data in a Conceptual Rainfall–Runoff Model. J. Hydrol. 280 (1-4), 145–161. doi:10.1016/s0022-1694(03)00229-4
Bevacqua, E., Maraun, D., Vousdoukas, M. I., Voukouvalas, E., Vrac, M., Mentaschi, L., et al. (2019). Higher Probability of Compound Flooding from Precipitation and Storm Surge in Europe under Anthropogenic Climate Change. Sci. Adv. 5, eaaw5531. doi:10.1126/sciadv.aaw5531
Cai, W.-J. (2011). Estuarine and Coastal Ocean Carbon Paradox: CO2Sinks or Sites of Terrestrial Carbon Incineration?. Annu. Rev. Mar. Sci. 3, 123–145. doi:10.1146/annurev-marine-120709-142723
Change, I. C. (2014). “Mitigation of Climate Change,” in IPCC, 2014: Climate Change 2014: Mitigation of Climate Change. Contribution of Working Group III to the Fifth Assessment Report of the Intergovernmental Panel on Climate Change. Editors O. Edenhofer, R. Pichs-Madruga, Y. Sokonaet al. (New York, NY, United States, Cambridge University Press), 1454.
Croux, C., and Dehon, C. (2009). “Robustness Properties of Some Nonparametric Correlation Measures.” in Nonparametric statistics and time series models conference in honour of Prof. Marc Hallin, Brussels, Belgium, November 27–29, 2009. Brussels, Belgium.
de Vries, H., Breton, M., de Mulder, T., Krestenitis, Y., Ozer, J., Proctor, R., et al. (1995). A Comparison of 2D Storm Surge Models Applied to Three Shallow European Seas. Environ. Softw. 10 (1), 23–42. doi:10.1016/0266-9838(95)00003-4
Edwards, A. M. C., and Winn, P. S. J. (2006). The Humber Estuary, Eastern England: Strategic Planning of Flood Defences and Habitats. Mar. Pollut. Bull. 53 (1-4), 165–174. doi:10.1016/j.marpolbul.2005.09.012
Enríquez, A. R., Wahl, T., Marcos, M., and Haigh, I. D. (2020). Spatial Footprints of Storm Surges along the Global Coastlines. J. Geophys. Res. Oceans 125 (9), e2020JC016367. doi:10.1029/2020jc016367
Haigh, I. D., Wadey, M. P., Wahl, T., Ozsoy, O., Nicholls, R. J., Brown, J. M., et al. (2016). Spatial and Temporal Analysis of Extreme Sea Level and Storm Surge Events Around the Coastline of the UK. Scientific data 3 (1), 1–14. doi:10.1038/sdata.2016.107
Hendry, A., Haigh, I. D., Nicholls, R. J., Winter, H., Neal, R., Wahl, T., et al. (2019). Assessing the Characteristics and Drivers of Compound Flooding Events Around the UK Coast. Hydrol. Earth Syst. Sci. 23 (7), 3117–3139. doi:10.5194/hess-23-3117-2019
Hitchcock, J. N. (2020). Storm Events as Key Moments of Microplastic Contamination in Aquatic Ecosystems. Sci. Total Environ. 734, 139436. doi:10.1016/j.scitotenv.2020.139436
Horsburgh, K. J., and Wilson, C. (2007). Tide‐surge Interaction and its Role in the Distribution of Surge Residuals in the North Sea. J. Geophys. Res. Oceans 112 (C8). doi:10.1029/2006jc004033
Humber Flood Risk Management Strategy 2014 (2014). Available at: https://www.eastriding.gov.uk/EasySiteWeb/GatewayLink.aspx?alId=592095.
Kendon, E. J., Roberts, N. M., Fowler, H. J., Roberts, M. J., Chan, S. C., and Senior, C. A. (2014). Heavier Summer Downpours with Climate Change Revealed by Weather Forecast Resolution Model. Nat. Clim Change 4 (7), 570–576. doi:10.1038/nclimate2258
Kouhi, S., Hashemi, M. R., Kian, R., Spaulding, M., Lewis, M., and Ginis, I. (2020). Flood Risk in Past and Future: A Case Study for the Pawtuxet River's Record‐breaking March 2010 Flood Event. J. Flood Risk Manag. 13 (4), e12655. doi:10.1111/jfr3.12655
Koyama, N., and Yamada, T. (2020). A Proposed Simultaneous Calculation Method for Flood by River Water, Inland Flood, and Storm Surge at Tidal Rivers of Metropolitan Cities: A Case Study of Katabira River in Japan. Water 12 (6), 1769. doi:10.3390/w12061769
Langenbrunner, B., Neelin, J. D., Lintner, B. R., and Anderson, B. T. (2015). Patterns of Precipitation Change and Climatological Uncertainty Among CMIP5 Models, with a Focus on the Midlatitude Pacific Storm Track*. J. Clim. 28 (19), 7857–7872. doi:10.1175/jcli-d-14-00800.1
Lewis, M., Horsburgh, K., Bates, P., and Smith, R. (2011). Quantifying the Uncertainty in Future Coastal Flood Risk Estimates for the U.K. J. Coastal Res. 276 (5), 870–881. doi:10.2112/jcoastres-d-10-00147.1
Lowe, J. A., Bernie, D., Bett, P., Bricheno1, L., Brown, S., Calvert, D., et al. (2019). UKCP18 Science Overview Report. [online] Available at: https://www.metoffice.gov.uk/pub/data/weather/uk/ukcp18/science-reports/UKCP18-Overview-report.pdf doi:10.3917/perri.lowe.2019.01
Lyddon, C., Brown, J. M., Leonardi, N., and Plater, A. J. (2018). Uncertainty in Estuarine Extreme Water Level Predictions Due to Surge-Tide Interaction. PloS one 13 (10), e0206200. doi:10.1371/journal.pone.0206200
Marshall, S., and Elliott, M. (1998). Environmental Influences on the Fish Assemblage of the Humber Estuary, U.K. Estuarine, Coastal Shelf Sci. 46 (2), 175–184. doi:10.1006/ecss.1997.0268
Martin, C. L., Momtaz, S., Gaston, T., and Moltschaniwskyj, N. A. (2020). Estuarine Cultural Ecosystem Services Valued by Local People in New South Wales, Australia, and Attributes Important for Continued Supply. Ocean Coastal Manag. 190, 105160. doi:10.1016/j.ocecoaman.2020.105160
Muis, S., Apecechea, M. I., Dullaart, J., de Lima Rego, J., Madsen, K. S., Su, J., et al. (2020). A High-Resolution Global Dataset of Extreme Sea Levels, Tides, and Storm Surges, Including Future Projections. Front. Mar. Sci. 7, 263. doi:10.3389/fmars.2020.00263
Paerl, H. W., Hall, N. S., Hounshell, A. G., Rossignol, K. L., Barnard, M. A., Luettich, R. A., et al. (2020). Recent Increases of Rainfall and Flooding from Tropical Cyclones (TCs) in North Carolina (USA): Implications for Organic Matter and Nutrient Cycling in Coastal Watersheds. Biogeochemistry, 1–20. doi:10.1007/s10533-020-00693-4
Paprotny, D., Morales-Nápoles, O., and Jonkman, S. N. (2018). HANZE: a Pan-European Database of Exposure to Natural Hazards and Damaging Historical Floods since 1870. Earth Syst. Sci. Data 10 (1), 565–581. doi:10.5194/essd-10-565-2018
Penning‐Rowsell, E. C. (2015). A Realistic Assessment of Fluvial and Coastal Flood Risk in England and Wales. Trans. Inst. Br. Geogr. 40 (1), 44–61. doi:10.1111/tran.12053
Petroliagkis, T. I., Voukouvalas, E., Disperati, J., and Bidlot, J. (2016). Joint Probabilities of Storm Surge, Significant Wave Height and River Discharge Components of Coastal Flooding Events. Italia: European Commission-JRC Technical Reports0KABstXJMAAAEjt5AY4e5L.
Robins, P. E., and Davies, A. G. (2010). Morphological Controls in sandy Estuaries: the Influence of Tidal Flats and Bathymetry on Sediment Transport. Ocean Dyn. 60 (3), 503–517. doi:10.1007/s10236-010-0268-4
Robins, P. E., and Lewis, M. J. (2019). “Changing Hydrology: A UK Perspective,” in Coasts and Estuaries: The Future. Editors E. Wolanski, J. W. Day, M. Elliott, and R. Ramesh (Oxford, United Kingdom: Elsevier), 611–617.
Robins, P. E., Lewis, M. J., Freer, J., Cooper, D. M., Skinner, C. J., and Coulthard, T. J. (2018). Improving Estuary Models by Reducing Uncertainties Associated with River Flows. Estuarine, Coastal Shelf Sci. 207, 63–73. doi:10.1016/j.ecss.2018.02.015
Rojas, O., Mardones, M., Martínez, C., Flores, L., Sáez, K., and Araneda, A. (2018). Flooding in Central Chile: Implications of Tides and Sea Level Increase in the 21st century. Sustainability 10 (12), 4335. doi:10.3390/su10124335
Samuels, P. G., and Burt, N. (2002). A New Joint Probability Appraisal of Flood Risk Proc. Institute. Civil Engineers-Water Maritime Eng. Thomas Telford Ltd, 109–115. doi:10.1680/wame.2002.154.2.109
Seneviratne, S., Nicholls, N., Easterling, D., Goodess, C., Kanae, S., Kossin, J., et al. (2012). Changes in Climate Extremes and Their Impacts on the Natural Physical Environment, in Managing the Risks of Extreme Events and Disasters to Advance Climate Change Adaptation. Editors C. B. Field, V. Barros, and T. F. Stocker (Cambridge, United Kingdom: Cambridge University Press), 109–230.
Shaw, T. A., Baldwin, M., Barnes, E. A., Caballero, R., Garfinkel, C. I., Hwang, Y.-T., et al. (2016). Storm Track Processes and the Opposing Influences of Climate Change. Nat. Geosci 9 (9), 656–664. doi:10.1038/ngeo2783
Shi, Z. (1993). Recent Saltmarsh Accretion and Sea Level Fluctuations in the Dyfi Estuary, central Cardigan Bay, Wales, UK. Geo-Marine Lett. 13 (3), 182–188. doi:10.1007/bf01593192
Su, Y.-S. (2016). Urban Flood Resilience in New York City, London, Randstad, Tokyo, Shanghai, and Taipei. J. Manage Sustain. 6 (1), 92–108. doi:10.5539/jms.v6n1p92
Svensson, C., and Jones, D. A. (2002). Dependence between Extreme Sea Surge, River Flow and Precipitation in Eastern Britain. Int. J. Climatol. 22 (10), 1149–1168. doi:10.1002/joc.794
Svensson, C., and Jones, D. A. (2004). Dependence between Sea Surge, River Flow and Precipitation in South and West Britain. Hydrol. Earth Syst. Sci. 8 (5), 973–992. doi:10.5194/hess-8-973-2004
Svensson, C., and Jones, D. A. (2006). Joint Probability: Dependence between Extreme Sea Surge, River Flow and Precipitation: A Study in South and West Britain. R&D Interim Technical Report FD2308/TR3. London, United Kingdom: Department for Environment Food and Rural Affairs.
Von Storch, H., and Woth, K. (2008). Storm Surges: Perspectives and Options. Sustain. Sci. 3 (1), 33–43. doi:10.1007/s11625-008-0044-2
Wadey, M. P., Haigh, I. D., and Brown, J. M. (2014). A century of Sea Level Data and the UK's 2013/14 Storm Surges: an Assessment of Extremes and Clustering Using the Newlyn Tide Gauge Record. Ocean Sci. 10 (6), 1031–1045. doi:10.5194/os-10-1031-2014
Wahl, T., Jain, S., Bender, J., Meyers, S. D., and Luther, M. E. (2015). Increasing Risk of Compound Flooding from Storm Surge and Rainfall for Major US Cities. Nat. Clim Change 5 (12), 1093–1097. doi:10.1038/nclimate2736
Ward, P. J., Couasnon, A., Eilander, D., Haigh, I. D., Hendry, A., Muis, S., et al. (2018). Dependence between High Sea-Level and High River Discharge Increases Flood hazard in Global Deltas and Estuaries. Environ. Res. Lett. 13 (8), 084012. doi:10.1088/1748-9326/aad400
Watts, G., Battarbee, R. W., Bloomfield, J. P., Crossman, J., Daccache, A., Durance, I., et al. (2015). Climate Change and Water in the UK - Past Changes and Future Prospects. Prog. Phys. Geogr. Earth Environ. 39 (1), 6–28. doi:10.1177/0309133314542957
Wilby, R. L., and Wigley, T. M. L. (1997). Downscaling General Circulation Model Output: a Review of Methods and Limitations. Prog. Phys. Geogr. Earth Environ. 21 (4), 530–548. doi:10.1177/030913339702100403
Zellou, B., and Rahali, H. (2019). Assessment of the Joint Impact of Extreme Rainfall and Storm Surge on the Risk of Flooding in a Coastal Area. J. Hydrol. 569, 647–665. doi:10.1016/j.jhydrol.2018.12.028
Keywords: coast, combination hazard, flood risk, humber, dyfi, estuary
Citation: Robins PE, Lewis MJ, Elnahrawi M, Lyddon C, Dickson N and Coulthard TJ (2021) Compound Flooding: Dependence at Sub-daily Scales Between Extreme Storm Surge and Fluvial Flow. Front. Built Environ. 7:727294. doi: 10.3389/fbuil.2021.727294
Received: 18 June 2021; Accepted: 02 August 2021;
Published: 16 August 2021.
Edited by:
Mark Hemer, Commonwealth Scientific and Industrial Research Organisation (CSIRO), AustraliaReviewed by:
Jacob Stolle, Université du Québec, CanadaWilliam James Pringle, Argonne National Laboratory (DOE), United States
Copyright © 2021 Robins, Lewis, Elnahrawi, Lyddon, Dickson and Coulthard. This is an open-access article distributed under the terms of the Creative Commons Attribution License (CC BY). The use, distribution or reproduction in other forums is permitted, provided the original author(s) and the copyright owner(s) are credited and that the original publication in this journal is cited, in accordance with accepted academic practice. No use, distribution or reproduction is permitted which does not comply with these terms.
*Correspondence: Peter E. Robins, cC5yb2JpbnNAYmFuZ29yLmFjLnVr