 Mats Sandberg
- Department of Building Engineering, Energy Systems and Sustainability Science, University of Gävle, Gävle, Sweden
Ventilation removing and spreading contaminants.
A large number of people becoming sick due to the COVID -19 pandemic are infected in their homes. Therefore, the spread of infectious agents, when infectious and susceptible individuals are together in their homes, is an important issue. Usually, ventilation is regarded as a process of only diluting and removing contaminants, but it is also a mechanism for spreading contaminants. The latter issue is of major importance when there is a pandemic. An air distribution system must, therefore, be viewed from a wider perspective than is generally the case. There is a need for a shift of paradigm. The scope of this study is to introduce new concepts that will make it possible to analyze air distribution systems from such a wider perspective.
Introduction
The two main mechanisms for spreading infectious agents are room to room transfer and transfer within a room.
Room to Room Transfer Through Doorways
Figure 1 shows a visualization of the flow through a doorway with an open door. There is bidirectional flow consisting of a layer with warmer and lighter air floating above a layer of colder and heavier air. The thickness of each layer is approximately equal to half the door height; see Chapter 9 in the study by Etheridge and Sandberg (1996).
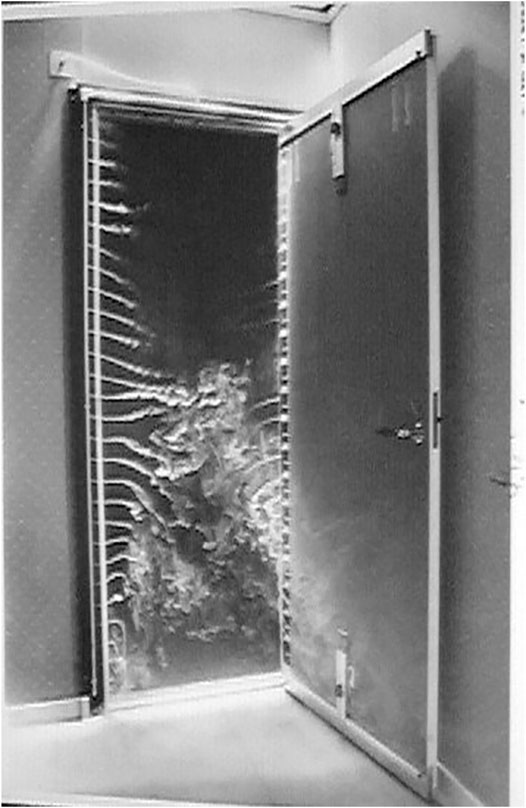
FIGURE 1. Bidirectional flow in a doorway caused by the room-to-room temperature difference.
Temperature difference between rooms leads to a large bidirectional exchange of air between the rooms. The velocities within the doorway are relatively small, but the opening is large, and therefore, the flow rates are large. The flow rate is normally much larger than the ventilation flow rate. Transfer between rooms will not be dealt with in this article. Transfer between rooms is dealt with in the study by Blomqvist (2009), and the imposed flow rate necessary to change from bidirectional flow to unidirectional flow is dealt with in the study by Blomqvist and Sandberg (1998).
Transfer Within a Room
Air movement within a room is generated by ventilation systems and boundary layer flows along vertical surfaces with a temperature different from the room air. A human body is a buoyancy source with a higher temperature than the ambient air and generates vertical air movement. The ventilation system generates air movements that are not only dilute and remove contaminants but also spread contaminants. The latter effect is the main focus of this article. The mechanism for contaminant spread by a ventilation system within a room rests on the fact that air and contaminants cannot leave the room immediately and are forced to recirculate. Their evacuation is delayed, and air and contaminants are recirculated within the room. This is a function of the air distribution system itself.
Ventilation and the Risk of Becoming Infected
One purpose of ventilation is to reduce the risk of being infected, and therefore, it is appropriate to see what models are available for assessing the risk. The classical model for assessing the risk of being infected (infection probability PI) is the Wells–Riley model proposed by Wells (Wells, 1955) and modified by Riley et al. (Riley et al., 1978). In the model, one considers a room ventilated by a ventilation flow rate qV. The assumption is that in the room, there are two groups of people: infectors who are sick and a group of healthy but susceptible persons. The number of persons in the room is constant, but the number of infectors in the room is much less than the number of susceptible persons. This is the condition in the very beginning of a pandemic. As time goes by, healthy people are becoming infected and sick; therefore, the number of infected people increases. After some time there will also be a third group of people in the room: those who have recovered but this is not considered in the Wells–Riley model. The number of susceptible persons in the room is S, and the number of infectors is I. The infected persons are spreading virus by their breathing. The source strength due to virus is, in this context, called the viral load and is expressed in terms of the quanta emission rate qquanta [quanta/h/person]. A quantum is defined as the dose of airborne droplet nuclei required to cause infection in (1—1/e)
The concentration of quanta Cquanta is given by the dilution Eq. 1
where
This is sometimes called the contact rate. Not all quanta give rise to an infection. Therefore, the next issue is the probability of becoming infected by quanta during an exposure of duration t. Not every quantum generates an infection. The assumption is that the risk of being infected follows a Poisson process. The probability that the time until an infection occurs is less than or equal to t is
With ΔI equal to the number of new cases of infectors, the probability of becoming infected is the ratio between the number of new cases divided by the number of susceptible persons S in the room.
This probability is equal to expression Eq. 5 when we have complete mixing. Usually the number of susceptible persons in the room is set equal to the number of susceptible persons at the beginning S0.
We do not always have well-mixed rooms. Perhaps the most well-known example is warm air heating using the ventilation air. With the air terminals located at the ceiling level, this gives rise to short circuiting which is equivalent to the occupied zone being ventilated with a flow rate less than the supplied flow rate. The assumption of complete ventilation makes the model insensitive to actual conditions. Therefore, there is a need to improve the model to be able to cope with actual conditions. A way to improve the model is to use the purging flow rate instead of using the ventilation flow rate, which is introduced later on.
Basic properties of air distribution systems—Dilution capacity, evacuation capacity, internal flow, excess flow, and flooding
Figure 2 shows a room where ventilation air is supplied as a single jet. The supply of clean air with a flow rate qV to a room with a contaminant generation rate
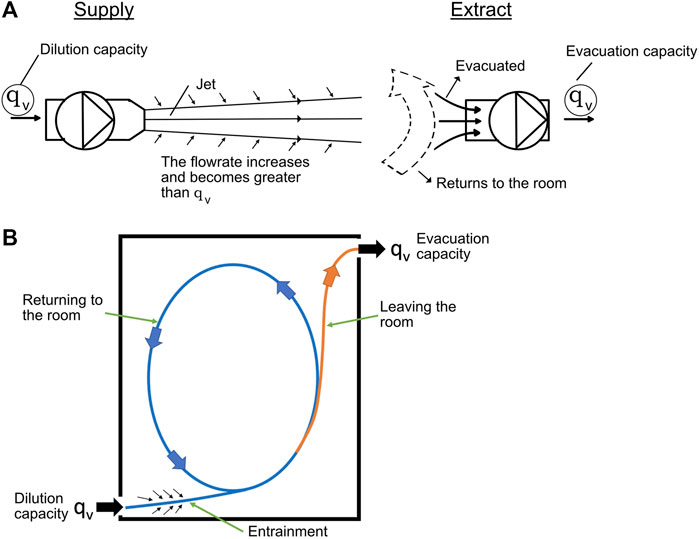
FIGURE 2. (A) Generation of an excess flow rate returning to the room when the evacuation capacity is less than the internal flow rate. (B) Sketch of the resulting flow rate in the room when the evacuation capacity is less than the internal flow rate.
The dilution capacity is the lowest concentration of contaminants that can be attained. We assume that air is extracted through an extract device from the room with the same flow rate as it is supplied to the room; see the upper inset in Figure 2. Therefore, qV is the evacuation capacity by which contaminants and air are removed from the room.
The jet drives the air flow within the room. During its course in the room, the jet is entraining ambient air and the flow in the jet increases and becomes larger than qV. The flow in the jet is the internal flow rate in the room. In this case, from the very beginning, the internal flow is larger than the evacuation capacity qV.
If q(x) is the internal flow rate within a region centered at position x, the excess flow rate within the region is q(x)—qV
The excess flow cannot be evacuated immediately and is forced to return to the room. Recirculation is generated within the room; see the inset at the bottom of the Figure 2. Flooding is notified as that air and contaminants return to the room. It occurs when the flow within the room is larger than the evacuation capacity. When flooding occurs, there are two populations of air in the room: a population ventilating, i.e., removing and diluting contaminants, and a population spreading contaminants by returning to the room.
The excess air flow rate is generated by entrainment into the driving flow which in this case is a jet. Entrainment is a tricky thing because there is a duality associated with entrainment. By entrainment, dilution of contaminants occurs, but at the same time, excess air is generated by which contaminants are forced to return to the room. An efficient air distribution system that also provides protection against spread of infectious agents requires that there is a suitable balance between the two competing mechanisms.
Purpose of Ventilation—Reducing the Concentration of Infectious Agents or Protection From Spread of Infectious Agents?
Lowering the concentration of contaminants by increasing the ventilation flow rate is a natural measure, but in practice, it is not a simple one. One must consider the risk for introducing a draft, which must be avoided, otherwise people may start to manipulate the ventilation system and may end up with a lower ventilation flow rate. Increasing the flow rate may also change the air flow pattern within the building that may introduce other problems. Therefore, increasing the flow rate is not a simple measure because several factors must be considered carefully.
The occurrence of infectious agents within a room where more than one person is present calls for the need for protection from transfer of infectious agents among individuals. One potential remedial measure is to supply clean air to a region within the room with the aim of creating clean (protected) zones. By entrainment of ambient air, clean air will be gradually polluted. This raises the question of how far clean air can be supplied, which is the delivery capacity. An ultimate goal would be to have a unidirectional flow taking infectious agents with it. The possibility to create a unidirectional flow will be dealt with later on.
Until now, ventilation has mainly been seen as a way of diluting the contaminants according to relation Eq. 1. Efficient dilution is based on entrainment, and therefore, an efficient entrainment process is desirable. The requirement of supplying clean air raises the opposite requirement because clean air is polluted by entrainment, and the entrainment should be minimized. This raises some novel questions about the possibility to generate a unidirectional flow and at what distance from the point of supply has the clean air been consumed and is no longer clean air?
A Refined Model of the Ventilation Process
Figure 2 shows the basic concepts related to the ventilation process. Figure 3 shows a region where there is a continuous and steady generation of a contaminant with a rate
- The population of air and contaminants leaving and never returning. This is the population that is ventilating in the sense that it dilutes and removes the contaminants.
- The population of air and contaminants returning to the room. This is the population spreading the contaminant within the room.

FIGURE 3. Probabilities related to the two populations (Kato et al., 2003; Lim et al., 2013; Lim et al., 2014; Chung et al., 2017; Lim et al., 2021). q is the standard flow rate (based on the velocity field) in and out of the region.
Associated with each population, there are probabilities, see Figure 3, reflecting the transfer between different positions within the room and to the extract of the room. Air and contaminants have two choices: either returning or leaving never to return. Subsequently, the probability to return r and the probability leaving never to return (1-r) adds up to one. The maximum flow rate of air in the population ventilating is the ventilation flow rate qV. At a location where the concentration is equal to the dilution capacity Eq. 1, the full capacity has been consumed. Henceforth, the contaminant is transported away without being further diluted. The flow rate in the population returning is according to definition Eq. 2: the difference between the total internal flow rate and the ventilation flow rate qV. The population returning is spreading the contaminants. Examples of different populations are shown in Figure 4.
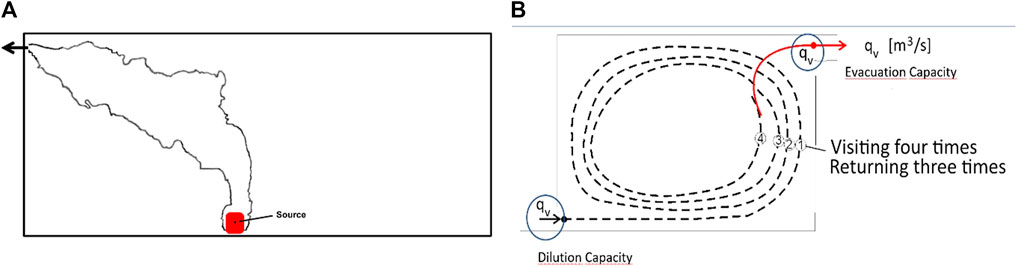
FIGURE 4. (A) Contaminant goes directly from the source to the extract (Skåret and Mathisen, 1982). (B) Population of air returning to the room.
Purging Flow Rate
When a flow q, fluid dynamicist’s flow rate generated by the velocity field, flowing into a region is loaded with the contaminant, it is going to remove from the region its dilution capacity which is lower than q. This is the rationale for introducing the concept purging flow rate.
Consider the region in Figure 3 where the flow in and out of the region is q. When the probability to return is zero, r = 0, then the concentration in the inflow is zero. Cin = 0. The mass balance for removal of the contaminants is as follows:
When contaminants are returning, r
This can be written on the same form as Eq. 7.
The quantity
The purging flow rate is the flow rate associated with the population leaving never to return.
The flow rate associated with population returning is as follows:
These two flow rates add up to become equal to the fluid dynamicist’s flow rate q
These two flow rates are not flow rates in the usual sense based on the movement solely of fluid particles but are related to the rate of removal of contaminants. For example, if there is a room without any openings, there is no removal of contaminants, and the purging flow rate is zero, but a fluid dynamicist will register a flow rate due to the fact that there is a movement of fluid particles.
When Cin = 0, the purging flow rate coincides with the fluid dynamicist’s flow rate q, and the returning flow rate is zero.
When
Visitation Frequency
When the contaminant is returning we can ask, how often? The answer is given by Kato et al., (2003)
where the denominator (1-r) is the net escape probability. The purging flow rate and flow rate returning are discussed in more detail in Supplementary Appendix SC.
Example of the Dilution Process with an Air Distribution System Aimed at Generating Mixing
This example is from the study by Tommaso and Sandberg (1996). Both the supply and extract terminals were located at the ceiling level. The tracer gas source was located in the center of the room. The tracer gas was emitted with a constant release rate
where CMax is the concentration along the red dotted line in inset a) in Figure 5. The local flow rate increases with increasing distance from the source until it becomes equal to the ventilation flow rate qV;, see inset b) in Figure 5. At this distance, all the dilution capacity has been consumed, and henceforth, the contaminant concentration cannot be further reduced. We call this distance from the source as the dilution distance XDil. The dilution distance is shown in inset c) of Figure 5.
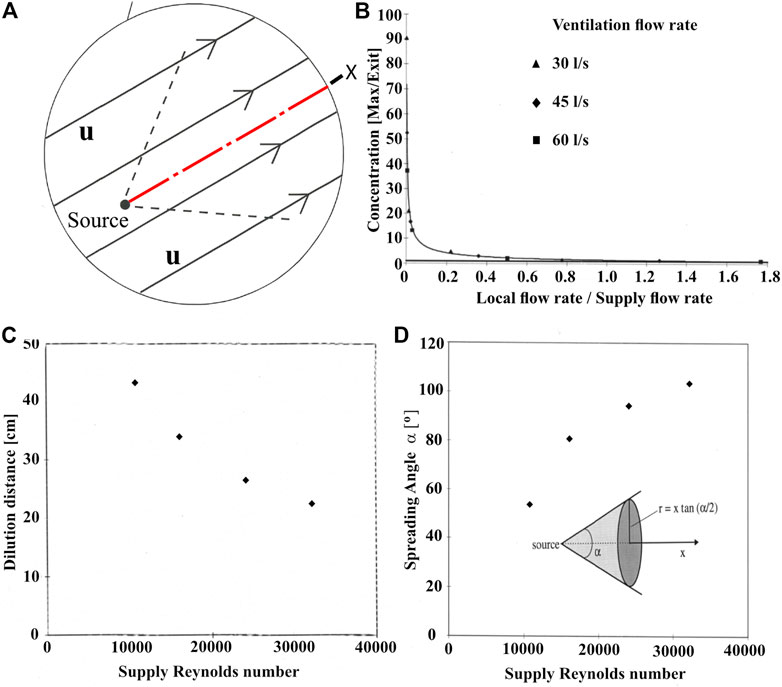
FIGURE 5. Signature of the dilution of a point source; (A) Spreading cone. (B) Dilution. (C) Dilution distance. (D) Opening angle of the cone.
With the increasing ventilation flow rate, the spreading angle increases; see inset c). The spreading cone from a point source can be seen as a fundamental quantity, characterizing the spread of a contaminant within a ventilated room. In this case, the dilution occurred within a region consisting of a cone whose length was less than 50 cm. In the remaining part of the room, the contaminant is spread out by excess air returning to the room. This process can be described as “flooding of contaminants”. Thus, by flooding of contaminants, the concentration in the room becomes, on the whole, uniform.
Displacement Ventilation
Displacement ventilation is the natural reference case in this context because it offers the possibility to completely avoid recirculation, which means that a unidirectional flow can be established within the whole room. This can be seen as the ultimate goal when the aim is to protect. Furthermore, displacement ventilation offers the means to exemplify the use of the population concept. The possibility to avoid recirculation is a consequence of the driving flow being generated by a pure buoyancy source by starting with a flow rate equal to zero. This is in contrast to when the flow in the room is driven by a jet.
Figure 6 shows two cases; one with a short heat source and a source which spans the whole height of the room. The temperature is the temperature in the ambient air outside the driving flow. The operating fluid in this case is water, and therefore, there is no influence of radiation in contrast to what would occur with air as the operating fluid. With the shorter buoyancy source, there are three stages in the development of the flow. To begin with, there is a boundary layer flow along the surface of the heat source which continues above the heat source as a plume. When the plume reaches the height where the flow in the plume is equal to the ventilation flow rate, the temperature in the plume becomes equal to the ambient temperature. Henceforth, there is no driving force due to buoyancy. Now, the flow is driven as a jet by the momentum at the height where the flow rate in the plume is equal to the ventilation flow rate. The ventilation air is supplied as chilled air at the floor level with a low velocity terminal and enters the room as gravity current. Due to this arrangement, both the boundary layer and plume are initially immersed in clean supply air which the boundary layer and plume are entraining, and the flow rate in the plume and the boundary increases when rising. The flow is unidirectionally up to the height where internal flow, ventilation air, and the flow from the buoyancy sources are equal to the supplied ventilation flow. Up to this height, we have just one population of air. At this height, the dilution capacity has been consumed, and above this height, there is a recirculation of air which means that above this height, there is a spread of heat. The recirculation (reflux) is due to that the evacuation capacity from the upper zone is less than that of the internal flow within the zone. This is an example of where a fraction of the room is flooded by contaminants.
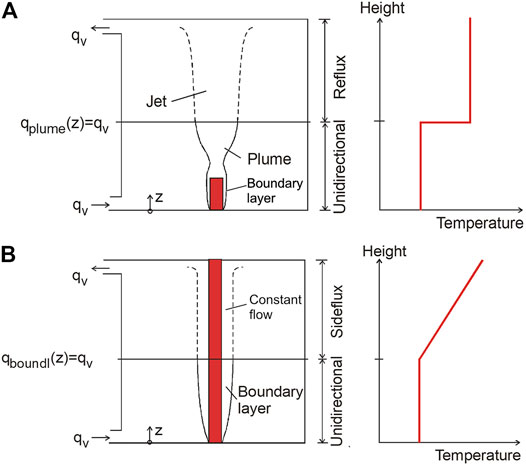
FIGURE 6. (A) Short buoyancy source (B) Buoyancy source spans the whole height of the room. The temperature is the temperature in the ambient air based on paragraph 8.9.6 in the study by Etheridge and Sandberg (1996).
With the short buoyancy source, there are three different types of flow driving the flow within the room, boundary layer, plume, and finally a jet. With the buoyancy source that spans the whole height of the room, the driving flow is a boundary layer.
Figure 7 shows more details about the case with a buoyancy source spanning the whole height of a room. A very special flow pattern is generated. This is because above the height where the flow rate in the driving flow is equal to the ventilation flow rate, the temperature in the ambient air increases due to the sources continuing to generate heat, thereby colder and heavier air will be located underneath warmer and lighter air. This heavier air cannot be transported upwards along the heat source, but instead detrainment starts. The result is that the flow in the boundary layer now becomes constant and equal to the ventilation flow rate. This is a consequence of there being no entrainment, and therefore, no recirculation occurs.
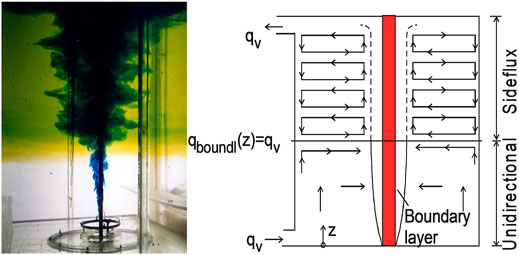
FIGURE 7. Visualization of a flow generated by a buoyancy source that spans the whole height based on paragraph 8.9.6 in the study by Etheridge and Sandberg (1996).
Tests were done by using water as the operating fluid. The flow was visualized by using dyes: blue dye for the boundary layer and fluorescent yellow dye for the ambient air above the location of the front. The height of the front is controlled by the ventilation flow rate, and we can increase the height of the front by increasing the ventilation flow and thereby generating a unidirectional flow within the whole room. This shows that in principle, it is possible to generate a unidirectional flow. But what about applying in practice? One limitation with displacement ventilation is that it only works when heating via air is not required.
Delivery Capacity–How Far Can Clean Air Be Supplied?
In the study by Sandberg et al., (2019), this question was dealt with. The definition of the delivery capacity assumes that in the room, there is a constant and uniform concentration Ca of a passive contaminant; see Figure 8.
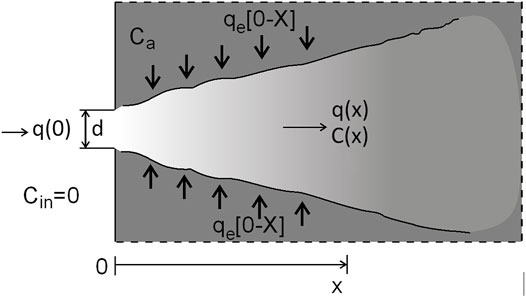
FIGURE 8. Jet immersed in ambient air with uniform concentration Ca.
We assume that we supply air to the room with a jet with an initial flow rate q (0). By entrainment, the flow in the jet increases and at position x the flow rate is q(x). The entrainment, qe [0 −x], into the jet between the distance from 0 to x is
This is the excess flow rate according to definition Eq. 2.
The entrained air carries contaminants with concentration Ca into the jet and the amount of contaminants that has been entrained at distance x is
We obtain the concentration C(x) at position x by dividing the flow rate q(x) at position x.
The concentration in the jet approaches the concentration in the ambient air when the flow rate in the jet approaches infinity. At the distance where the ratio between the flow rate and the initial flow rate is
This is the distance at which q(x)
The delivery capacity can be determined by monitoring the relative concentration C(x)/Ca, see Figure 9, as a function of the distance from the supply.
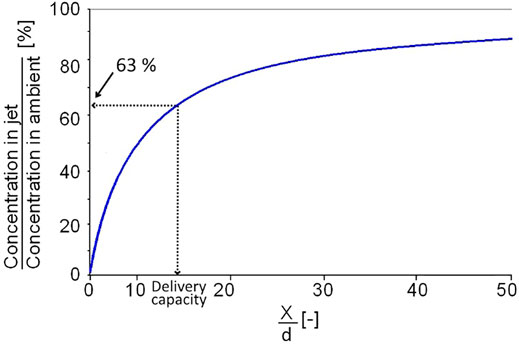
FIGURE 9. Determination of the delivery capacity. The hatched line shows the position where the flow rate in the jet is q(x)
The curve in Figure 9 shows how the clean air is consumed. An alternative is to solve the differential equation determining the entrainment of ambient polluted air into a jet of clean air; see Supplementary Appendix S1. The prerequisite for this is that the entrainment rate or the flow rate is known.
Methods for Supplying Clean Air
Displacement ventilation is a method of supplying clean air to a part of a room. The clean zone reaches the height where the flow rate in the driving flow is equal to the ventilation flow rate. In this paragraph, we will show cases where the supply of air is by one or several jets.
Supply With One Jet
The ventilation flow rate is supplied as a jet through one nozzle; see Figure 10. The jet entrains ambient air, and from the very beginning, the internal flow rate becomes larger than the evacuation capacity. Therefore, we have a return flow from the very beginning. Within the potential core of the jet, we have supplied air conditions. The potential core extends to a distance of about six times the diameter of the nozzle. There is a possibility of increasing the size of the potential core by increasing the diameter of the nozzle; see the inset on the right-hand side of Figure 10. But there is a limit due to the fact that with the increasing diameter d, the velocity decreases and the flow can become unstable.
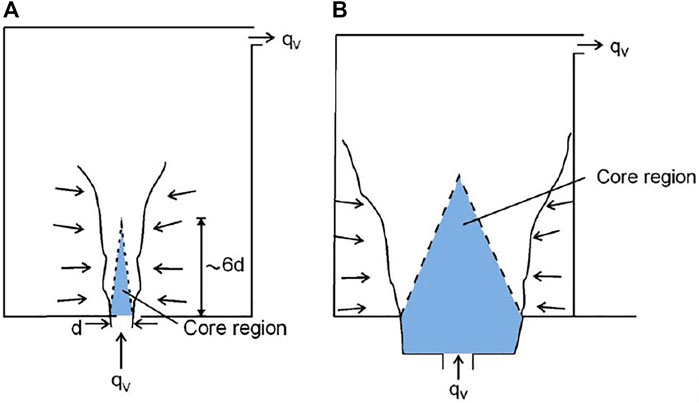
FIGURE 10. Supply of ventilation air with one jet. (A) Supply with a high velocity. (B) Supply with a low velocity.
Expanding the Core Region by Supply Through a Bundle of Nozzles
By supplying air through a bundle of nozzles, we can maintain a high velocity when spreading out the supply over a larger area. This is equivalent to finding ways to diminish the entrainment into the jet. In principle, this can be achieved by supplying air over the whole floor area by using a bundle of nozzles. The entrainment is prevented by the walls of the room. This can be seen as a way of generating a unidirectional flow within the whole room; see the left inset of Figure 11.
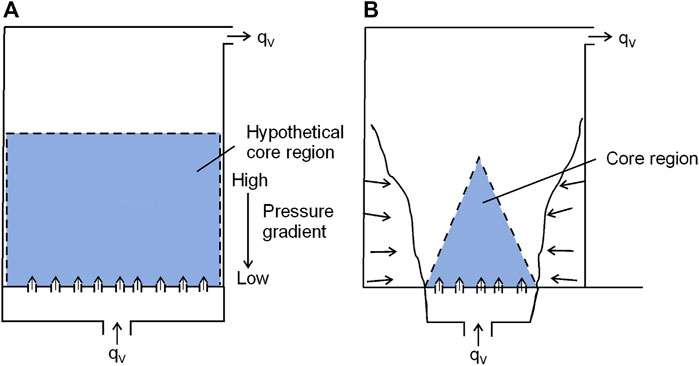
FIGURE 11. (A) Supply covering the whole floor area. (B) Supply covering a part of the floor area.
In the case when the nozzles cover the whole flow area, the flow from the individual nozzles expands and the velocity decreases. This occurs without an increase in the flow rate. The final result is a decrease in momentum, see Supplementary Appendix S2, which is compensated by an increase in pressure; see Supplementary Appendix S2. Therefore, the flow is propagating against an adverse pressure gradient which is a well-known troublemaker in fluid mechanics. This may lead to instability; see Figure 2 in Supplementary Appendix S2. In the right hand side of Figure 11, the nozzles cover only a fraction of the floor; there is space for return air to arrive to the jet, and the flow is stable.
Example of Systems With a Supply Close to the Target
The target in this context is of course people. The supply devices are located in the occupied zone. The idea is that by minimizing the distance between the point of supply and the person, the pollution of the supplied air will be less than usually is the case.
Confluent Jet
The method of supply of air by a bundle of nozzles has become popular in recent decades and is called confluent jet (Karimipanah et al., 2007; Cho et al., 2008; Andersson et al., 2020). The flow from the individual nozzles merges into a sheet of air. Figure 12 shows a system where the flow from the nozzles is directed towards the wall. The air is spread out along the walls and continuous into the occupied zone.

FIGURE 12. Modern version of supply thorough a bundle of nozzles (confluent jet).
Displacement Ventilation
At supply with displacement ventilation, the distance is relatively short. In practice, one can say the supply to a person occurs at the feet of a person. This is due to the ventilation air being discharged at the floor level as a stable gravity current. The entrainment of ambient air is, therefore, very low, and it is relatively clean air that arrives at the feet and henceforth, it will continue to climb upward along the person´s body. The drawback is that displacement ventilation only works when heating via air is not required.
Impinging Jet Ventilation
Impinging jet ventilation (sometimes called “drainpipe” ventilation) is an air distribution method where the ventilation air is supplied as an impinging jet at the floor level, see Figure 13, with a relatively high velocity (Karimipanah and Awbi, 2002).
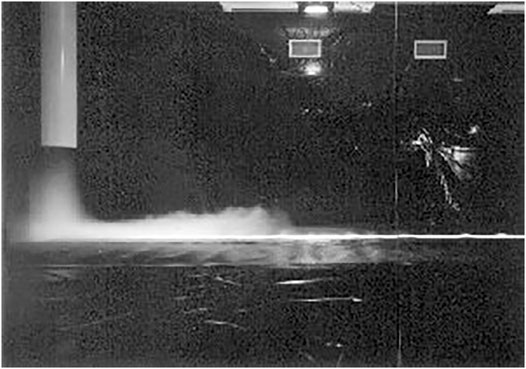
FIGURE 13. Impinging jet ventilation.
Due to the supply with a high velocity, warm air can be supplied, and therefore, it has the potential to overcome the limitation of displacement ventilation. Of course, there is an entrainment of polluted air, but the distance between the point of supply and a person in the middle of the room is relatively short. Draught does not seem to be a problem because the jet expands after hitting the floor and becomes thin. Therefore, people are protected from draught by their shoes.
Personalized Ventilation
This is the extreme case of supplying close to the target; see Figure 14. This is called personalized ventilation (Melikov, 2004; Kabanshi and Sandberg, 2019; Kabanshi, 2020).
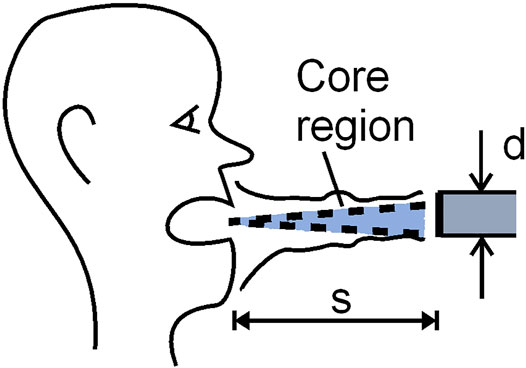
FIGURE 14. Personalized ventilation. The distance s is typically about 20 cm or less.
Discussion and Summary
Ventilation is a process of diluting and removing contaminants, but at the same time, it is also a process spreading contaminants. An air distribution system must, therefore, be viewed from a wider perspective than has been done so far. One must distinguish between the process of removing contaminants and the process of spreading contaminants. To make this possible, two populations of air and contaminants are introduced.
- A population ventilating by diluting contaminants and removing contaminants from the room
- A population spreading the contaminants by returning to the room
As a complement to the fluid dynamicist’s flow rate, q, derived from the velocity field, we introduce the following additional flow rates (ventilation engineer’s flow rates); see the region in Figure 3.
Purging flow rate
Flow rate of air returning
These flow rates are dependent on both the velocity field and the concentration field, but their sum is equal to the fluid dynamicist’s flow rate q based on the velocity field. The concentration field comes into play due to the fact that if the flow rate is polluted, the potential for removing and diluting contaminants is lowered as a result of the fact that the purging flow rate becomes less than the flow rate q based on the velocity field. Conventional measuring techniques, used in fluid dynamics, cannot discriminate between fluid particles belonging to the two different populations. Air is returning to the room if the internal flow within the room is larger than the evacuation capacity of the ventilation system. The excess air has to queue before it can leave the room. The queueing can be quantified by the number of times it returns, the visitation frequency. The excess air is generated by entrainment into the driving flow. Minimizing the spread of a contaminant is equivalent to minimizing the entrainment. A way of minimizing pollution of the supply air by entrainment is to supply the ventilation air close to people. A number of such air distribution systems—displacement ventilation, confluent jet, impinging jet (“drainpipe” ventilation), and personalized ventilation—have been shown. To enable a practical design procedure with the scope of protecting people, there is a need to determine the ventilation system’s delivery capacity of clean air as a function of the distance between the supply point and people at different operating conditions. A definition of delivery capacity of clean air has been introduced; see Figure 9. If the entrainment rate is known, one can calculate the delivery capacity; see Supplementary Appendix SA.
An ultimate goal for protection would be to generate a unidirectional flow within the whole room. The possibility to generate a unidirectional flow has been dealt with. But it is shown that it is very difficult to be applied in practice to realize a unidirectional flow. In general, a room can be viewed as being subdivided into two zones; the dilution zone and the zone of recirculation (spreading). There is a need to develop methods for identifying these two zones. When one has stratified flow as e.g., displacement ventilation this is quite straightforward but not in the general case. An example is shown where the dilution zone is volume-shaped as a cone with an extension of less than 0.5 m. In the remaining part of the room, the contaminant is spread out by excess air returning (“flooding”) to the room. By the process of entrainment, dilution of contaminants occurs, but at the same time, excess air is generated by entrainment. By the excess air, contaminants are returned to the room and spread out. An important task for research in the future is to explore if there is a balance between the competing process dilution and spread of contaminants that give rise to efficient air distribution systems.
Figure 15 shows an air stream arriving to a person. When protection of people is important a natural question to ask would be, where have you been?
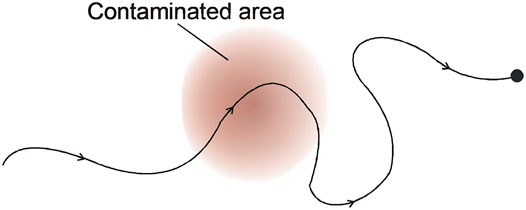
FIGURE 15. Where have you been?
This can be answered by identifying the trajectories along which air and contaminants are transported. This is an important task for research in the future.
Data Availability Statement
The original contributions presented in the study are included in the article/Supplementary Material, further inquiries can be directed to the corresponding author.
Author Contributions
The author confirms being the sole contributor of this work and has approved it for publication.
Funding
This work is partly supported by Formas (Dnr: 2021-01606) under the project “Ventilation as a strategy to reduce indoor transmission of airborne diseases: Development of new strategies and a risk assessment model”.
Conflict of Interest
The author declares that the research was conducted in the absence of any commercial or financial relationships that could be construed as a potential conflict of interest.
Publisher’s Note
All claims expressed in this article are solely those of the authors and do not necessarily represent those of their affiliated organizations, or those of the publisher, the editors, and the reviewers. Any product that may be evaluated in this article, or claim that may be made by its manufacturer, is not guaranteed or endorsed by the publisher.
Acknowledgments
The help with the artwork by A Armen and E Linden (University of Gävle) is acknowledged. The help by Taghi Karimipanah (University of Gävle) and Wei Liu (KTH, Stockholm) with finding the reference literature is acknowledged. Discussions with Prof. Kazuhide Ito, Kyushu University, Japan, regarding the Wells–Riley model are acknowledged. Valuable comments on the content by Rodney Gale, London, UK, are acknowledged.
Supplementary Material
The Supplementary Material for this article can be found online at: https://www.frontiersin.org/articles/10.3389/fbuil.2021.728968/full#supplementary-material
References
Andersson, H., Cehlin, M., and Moshfegh, B. (2020). Experimental and Numerical Investigation of Confluent Jets Ventilation Supply Device in Conference Room. Energies 13. doi:10.3390/en13205415
Blomqvist, C. (2009). Distribution of Ventilation Air and Heat by Buoyancy Forces inside Buildings an Experimental Study. Stockholm, Sweden: Doctoral Thesis, KTH. ISBN 978-91-7415-322-4.
Blomqvist, C., and Sandberg, M. (1998). Transition from Bi-directional to Unidirectional Flow in a Doorway Proceedings Roomvent´98. Stockholm, Sweden, 539–546.
Cho, Y., Awbi, H. B., and Karimipanah, T. (2008). Theoretical and Experimental Investigation of wall Confluent Jets Ventilation and Comparison with wall Displacement Ventilation. Building Environ. 43, 1091–1100. doi:10.1016/j.buildenv.2007.02.006
Chung, J., Lim, E., Sandberg, M., and Ito, K. (2017). Returning and Net Escape Probabilities of Contaminant at a Local point in Indoor Environment. Building Environ. 125, 67–76. doi:10.1016/j.buildenv.2017.08.028
Etheridge, D. W., and Sandberg, M. (1996). Building Ventilation: Theory and Measurement. Chichester: John Wiley & Sons.
Johannis, G. (1968). Strömungs- und temperaturverhätnisse in Räumen mit Luftungsdecken. Gesundheits-Ingenieur 89, 193–202.
Kabanshi, A. A., and Sandberg, M. (2019). Entrainment and its Implications on Microclimate Ventilation Systems: Scaling the Velocity and Temperature Field of a Round Free Jet. Indoor Air 29, 331–346. doi:10.1111/ina.12524
Kabanshi, A. (2020). Near-Field Flow Structure and Entrainment of a Round Jet at Low Exit Velocities: Implications on Microclimate Ventilation. Computation 8, 100. doi:10.3390/computation8040100
Karimipanah, T., Awbi, H. B., Sandberg, M., and Blomqvist, C. (2007). Investigation of Air Quality, comfort Parameters and Effectiveness for Two Floor-Level Air Supply Systems in Classrooms. Building Environ. 42, 647–655. doi:10.1016/j.buildenv.2005.10.016
Karimipanah, T., and Awbi, H. B. (2002). Theoretical and Experimental Investigation of Impinging Jet Ventilation and Comparison with wall Displacement Ventilation. Building Environ. 37, 1329–1342. doi:10.1016/s0360-1323(01)00117-2
Kato, S., Ito, K., and Murakami, S. (2003). Analysis of Visitation Frequency through Particle Tracking Method Based on LES and Model experiment. Indoor Air 13, 182–193. doi:10.1034/j.1600-0668.2003.00173.x
Lim, E., Sandberg, M., and Ito, K. (2021). Returning Characteristics of Pollutants for a Local Domain in the Presence of Returning and Recirculating Airflow in Indoor Environments. Indoor Air 00, 1–14. doi:10.1111/ina.12803
Lim, E., Ito, K., and Sandberg, M. (2013). New Ventilation index for Evaluating Imperfect Mixing Conditions - Analysis of Net Escape Velocity Based on RANS Approach. Building Environ. 61, 45–56. doi:10.1016/j.buildenv.2012.11.022
Lim, E., Ito, K., and Sandberg, M. (2014). Performance Evaluation of Contaminant Removal and Air Quality Control for Local Ventilation Systems Using the Ventilation index Net Escape Velocity. Building Environ. 79, 78–89. doi:10.1016/j.buildenv.2014.04.020
Malmström, T-G. (1974). Om Funktionen Hos Tilluftsgaller. Stockholm, Sweden: Royal Institute of Technology.
Melikov, A. K. (2004). Personalized Ventilation. Indoor Air 14, 157–167. doi:10.1111/j.1600-0668.2004.00284.x
Riley, E. C., Murphy, G., and Riley, R. L. (1978). Airborne Spread of Measles in a Suburban Elementary School. Am. J. Epidemiol. 107, 421–432. doi:10.1093/oxfordjournals.aje.a112560
Sandberg, M., Kabanshi, A., and Hans, W. (2019). Is Building Ventilation a Process of Diluting Contaminants or Delivering Clean Air? Indoor Built Environ., 1–7.
Tommaso, R. M. D., and Sandberg, M. (1996).Characterisation of the Mixing in a Room by Recording the Concentration Close to a point Source. In Proceedings ROOMVENT ´96. Yokohama, Japan, 21–28. July 17 -19, 1996.
Keywords: purging flow rate, visiting frequency, entrainment, delivery capacity of clean air, two populations of air, flooding of contaminants
Citation: Sandberg M (2022) The Dual Role of an Air Distribution System, Both Reducing the Concentration of Infectious Agents and Spreading Infectious Agents. Front. Built Environ. 7:728968. doi: 10.3389/fbuil.2021.728968
Received: 22 June 2021; Accepted: 08 December 2021;
Published: 24 January 2022.
Edited by:
Runa T. Hellwig, Aalborg University, DenmarkReviewed by:
Haiguo Yin, Xi’an University of Architecture and Technology, ChinaJiying Liu, Shandong Jianzhu University, China
Copyright © 2022 Sandberg. This is an open-access article distributed under the terms of the Creative Commons Attribution License (CC BY). The use, distribution or reproduction in other forums is permitted, provided the original author(s) and the copyright owner(s) are credited and that the original publication in this journal is cited, in accordance with accepted academic practice. No use, distribution or reproduction is permitted which does not comply with these terms.
*Correspondence: Mats Sandberg, bWF0cy5zYW5kYmVyZ0BoaWcuc2U=