 Fatemeh Orooji1*
 Carol J. Friedland2
 Rose Dominic Savio2Arash Taghinezhad2
 Carol C. Massarra3
 Nazla Bushra4
 Robert V. Rohli4,5
- 1School of Engineering and Applied Sciences, Western Kentucky University, Bowling Green, KY, United States
- 2Bert S. Turner Department of Construction Management, Louisiana State University, Baton Rouge, LA, United States
- 3Department of Construction Management, East Carolina University, Greenville, NC, United States
- 4Department of Oceanography and Coastal Sciences, Louisiana State University, Baton Rouge, LA, United States
- 5Coastal Studies Institute, Louisiana State University, Baton Rouge, LA, United States
Wind is one of the deadliest and most expensive hazards in the United States. Wind hazards cause significant damage to buildings and economic losses to homeowners. Economic losses average approximately $3.8 billion annually from hurricane winds and are not decreasing, even despite enhanced construction practices to reduce wind damage. Thus, the effectiveness of mitigation strategies should be evaluated in order to lower the cost incurred by this hazard. Several studies have suggested building code improvements to mitigate the wind hazard, this additional comprehensive research provides selecting economically beneficial mitigation strategies to consider in building code revisions. In a step toward addressing this need, the current study was conducted to determine the cost effectiveness of mitigation strategies for new and retrofit construction of a wood-framed, single-family, residential building case study. Net benefit, defined as the difference between the life-cycle wind loss before and after implementation of the mitigation strategy, was calculated for 15 wind mitigation strategies and their combinations, with new and retrofit construction costs ranging between $1,200 to $12,000 and a decision-making time horizon ranging between 5 and 30 years. Payback periods, defined as the number of years to recover the investment, were calculated for each mitigation strategy. Results were summarized by cost effectiveness for all ASCE 7 wind speed contour intervals. The results of this study serve as a starting point for further refinement of the economic justification needed to properly evaluate potential building code changes.
Introduction
Wind is one of the deadliest and most expensive hazards in the United States (Emanuel et al., 2006). From 2010 to 2020, the continental U.S. experienced average property damage of $3.8 billion per year from tropical storms and hurricanes (National Weather Service, 2020). Furthermore, the frequency and magnitude of wind hazard events has increased in recent decades (National Science Board (U.S.) and National Science Foundation (U.S.), 2007; Rosenzweig and Solecki, 2014). For instance, 2020 is known as one of the most active Atlantic-Caribbean-Gulf of Mexico tropical cyclone seasons, with multiple tropical storm and hurricane events in the Gulf Coast and southeastern United States (National Oceanic and Atmospheric Administration, 2020). Therefore, a future change in building codes regarding wind design speed contours is probable.
Hurricane risk assessment strategies for building structures are focused on both storm surge and wind induced risk (Unnikrishnan and Barbato,2016a; Unnikrishnan and Barbato, 2017; Baradaranshoraka et al., 2017), but it is challenging to isolate the most effective mitigation approach under various scenarios of new and retrofit modeled structures. In recent years, several studies analyzed the cost effectiveness of various mitigation approaches for various structure models. Among these, Performance-Based Hurricane Engineering framework was frequently used to assess risk and cost-effectiveness of mitigation measures of residential structures subjected to hurricane hazard (Barbato et al., 2011; Barbato et al., 2013; Unnikrishnan and Barbato, 2015; Unnikrishnan and Barbato, 2016a; Unnikrishnan and Barbato, 2016b; Unnikrishnan and Barbato, 2017). Although in recent years, it is a common practice to consider multi-hazard criteria for hazard mitigation planning and cost calculation, especially in the coastal region where flood and wind are the two most common hazards, it is also important to calculate the losses from the wind hazard individually and then to evaluate the cost effectiveness of the mitigation plan. This is because flood events are more severe but less frequent, while wind events are the most commonly occurring atmospheric phenomena causing damage to structure even when there is no flood or storm surge. While the increasing elevation of buildings may reduce the chances of losses from flood events, it concurrently increases the chance of losses from the force of wind, which increases with elevation. Hamid et al. (2010) used a probabilistic model to assess risk to insured residential property associated with hurricane wind. Pinelli et al. (2004) estimated expected annual damage induced by hurricane winds on various building types for possible damage states.
In the United States, the building code requirements for hazard mitigation are disparate in each state. For instance, the State of Florida has one of the most comprehensive building codes for hurricane hazards (FBC, 2020). To decrease the unprecedented challenge for residences located in hurricane and wind-prone communities, improvements in the building codes in the areas with outdated or non-comprehensive building codes and/or construction to higher standards are recommended (Stevenson et al., 2020). Proven, existing construction practices can reduce the cost and damage from wind hazards (Gurley and Masters, 2011; Simmons et al., 2020). However, improving the building resiliency through such mitigation actions is usually associated with a higher investment cost that needs to be evaluated by benefit-cost analysis (Torkian et al., 2014). According to Qin and Stewart. (2020a), mitigation activities are associated with the effectiveness of mitigation strategies, and they should be evaluated in order to reduce the cost incurred by hazards. Although the building codes and some guidelines, such as Federal Emergency Management Agency (FEMA) publications, show the minimum design requirement and suggest mitigation strategies for improving building resiliency to natural hazards, they tend to overlook the cost-effectiveness of mitigation strategies. Several studies have suggested building code improvements to mitigate the wind hazard [Applied Research Associates, Inc. (ARA), 2008; Pinelli et al., 2009], this additional comprehensive research provides selecting economically beneficial mitigation strategies to consider in building code revisions.
The net benefit of mitigation strategies can be calculated using factors such as cost of mitigation-avoided loss, particular location of the building within the wind contours, building life-cycle or time horizon, and the payback period—the time in years required to recover the initial investment (Orooji and Friedland, 2017; Qin and Stewart, 2020b; Orooji and Friedland, 2021a). Net benefit analyses continually show that the mitigation is cost-effective; however, the homeowners or decision-makers are also interested in knowing the payback period of investment in mitigation to make better decisions on selecting mitigation strategies (De Nocker et al., 2006; Chiu et al., 2013; Noshadravan et al., 2017; Noori et al., 2018).
In this research, we aim to provide detailed and informative guidance for decision-makers and other stakeholders to improve their understanding of the effectiveness of mitigation strategies which can enhance community resilience against wind hazards and form a basis for building code revisions. To achieve this goal, a methodology is provided to first calculate the payback period of each mitigation option based on the location of the building within the wind contours. Then, based on the net benefit and cost-effectiveness results of proposed mitigation options, a generalized recommendation list is provided for use by decision-makers and stakeholders.
To achieve the research objectives, a wood-framed, single-family, residential building case study is used to calculate the cost-effectiveness of mitigation strategies that are available in Hazus loss functions in each mitigation scenario. Net benefit as an indicator for cost-effectiveness is defined as the difference between the life-cycle wind loss before and after implementing the mitigation strategy. Net benefit is calculated for 15 wind mitigation strategies, with new and retrofit construction costs ranging between $1,200 to $12,000 and a decision-making time horizon ranging between 5 and 30 years. Payback periods are calculated for each mitigation strategy, and results are summarized by cost-effectiveness for all American Society of Civil Engineers (ASCE) 7–16 wind speed contour intervals (ASCE, 2017).
Methodology
This research contributes to the literature by providing a methodology and results that can serve as a starting point for further refinement of the economic justification needed to properly evaluate potential building code changes to make building communities more resilient against the wind hazard. Also, it provides a system to rank the mitigation strategies based on the cost savings and payback period of the mitigation investment.
Wind Hazard Characteristics
The International Code Council (ICC) model building codes (e.g., International Building Code) reference ASCE 7, an engineering standard used to determine loads on structures. The 700-years return interval for a 3-s wind gust at 33 feet above the ground level (basic wind speed) forms the basis for ASCE 7 Risk Category (RC) II building design. RC II buildings are those that pose a moderate risk to human lives and include single-family homes. The 700-years wind speed is defined as the wind speed that has an annual exceedance probability (AEP) of 1/700, or 0.143%. In 50 years, there is approximately a 7% probability of this level of wind speed being equaled or exceeded. Figure 1 provides the ASCE. (2017) RC II 3-s gust wind contour lines for the state of Louisiana, which range from 47 m/s (110 mph) to 80 m/s (180 mph).
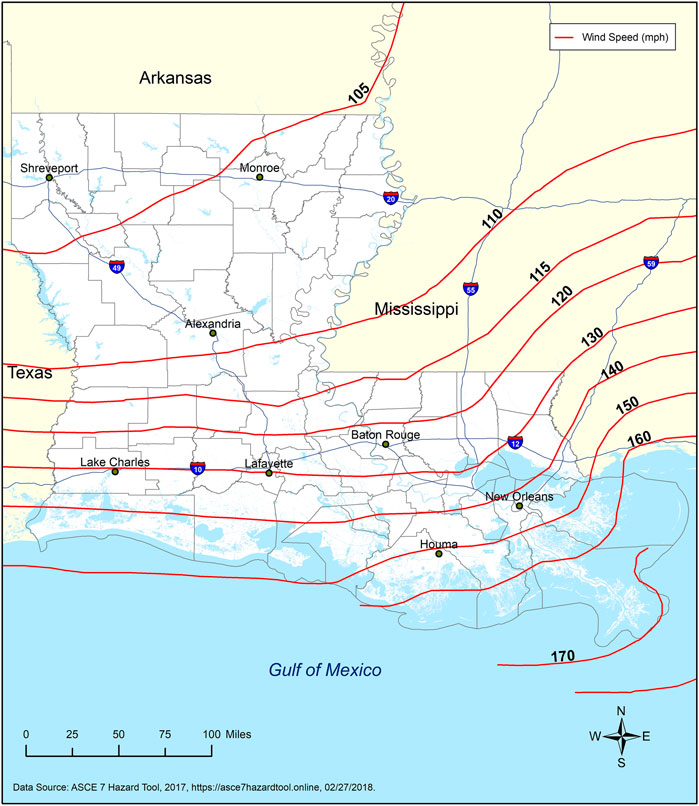
FIGURE 1. ASCE 7,700-year return period 3-sec gust wind speed (mph) hazard map for Louisiana (GOHSEP, 2019).
The probability density function of a two-parameter Weibull distribution (
Wind Loss Functions
Building loss functions, L(v), as shown in Hazus-MH database (FEMA, 2012; FEMA, 2018), define economic building loss as a function of attributes such as building structure type, wind speed, and the classifications of terrain (Vickery et al., 2006). In this research, to generalize the effectiveness of wind mitigation, Hazus-MH loss functions, which are publicly available and applicable to a variety of building configurations in the United States, were used. Also, it should be noted that although the loss functions term is used here to compromise with the definitions in Hazus-MH, in some studies they may call them vulnerability curves or damage functions.
Hazus-MH is a computer-based, multi-hazard model developed by FEMA used to estimate direct losses for building, contents, and loss of use. Multiple Hazus models are implemented within a geographic information system (GIS) platform to analyze wind, flood, and earthquake hazards. Economic losses as a function of wind speed (i.e., loss functions) for five terrain classifications are embedded within the Hazus-MH Hurricane Model. Each loss function is associated with a unique building configuration, called the wind building identity (WBID). Hazus-MH loss functions are widely used for loss studies and are applicable nationally (Jain et al., 2005). Figure 2 shows an example of the loss ratio of damage to the building value, as a function of wind speed for multiple classifications of terrain (e.g., open, suburban, trees) for unmitigated (WBID 6) and partially mitigated (WBID 41) buildings.
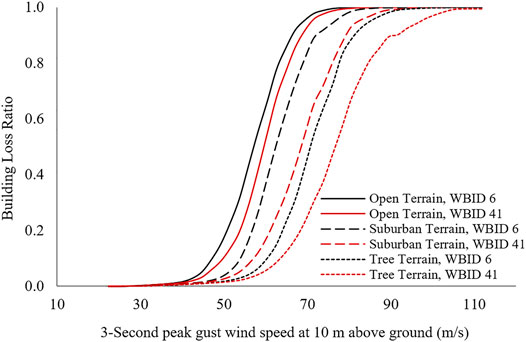
FIGURE 2. Building-loss functions, expressed as the ratio of repair or replacement cost to building value, for multiple terrain classifications for an unmitigated (ID 6) and partially mitigated (ID 41) building extracted from the Hazus database.
This study utilizes the Hazus wind loss functions, which are extracted from the Hazus-MH version 3.2 database, rather than the Hazus software itself. Building loss functions
Residential Building Characteristics
The residential building data used in this study were obtained from the databases underlying the Hazus-MH Hurricane Model. In the Hazus database, wood-frame, single-family houses are characterized using a combination of “building options” i) within five “mitigation categories” (n): 1) roof shape, 2) roof-to-wall (RTW) connection type, 3) presence of secondary water-resistant (SWR) barrier, 4) roof deck attachment (RDA) nailing pattern, and 5) shutter and garage door types.
A wood-frame, single-family, one-story residential building is characterized using one of the building options in each mitigation category, and each of the 15 mitigation strategies has two or more building options. Given these options, Hazus classifies single-family, one-story homes into 160 unique WBIDs based on the combination of building options (i|n) within the five mitigation categories (n). A numerical coding system to describe each building WBID in the Hazus database was developed by Orooji and Friedland. (2017), shown in Eq. (3), where
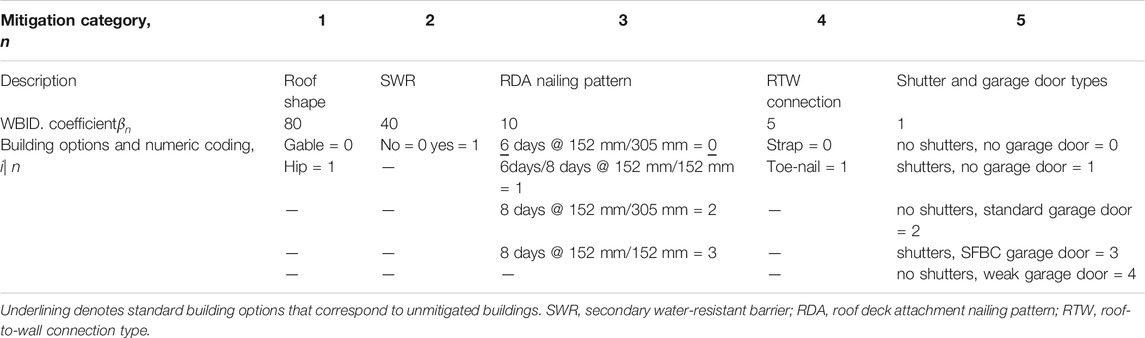
TABLE 1. Descriptions and numerical coding for one-story, single-family, residential building WBID calculation (adapted from Orooji and Friedland 2017).
Based on the building options, WBIDs were categorized as “unmitigated” or “mitigated” using Table 1. WBIDs 6, 8, 10, 86, 88, and 90 do not have any mitigation options; therefore, Table 2 categorized them as unmitigated buildings. All other buildings are considered to have at least one mitigation option. The 15 mitigation strategies with their corresponding WBIDs were defined in Table 2, where “SWR,” “RDA,” “RTW,” and “Shutter” referred to the implementation of mitigated building options for mitigation categories 2, 3, 4, and 5, respectively. Unmitigated building options are used for another category.
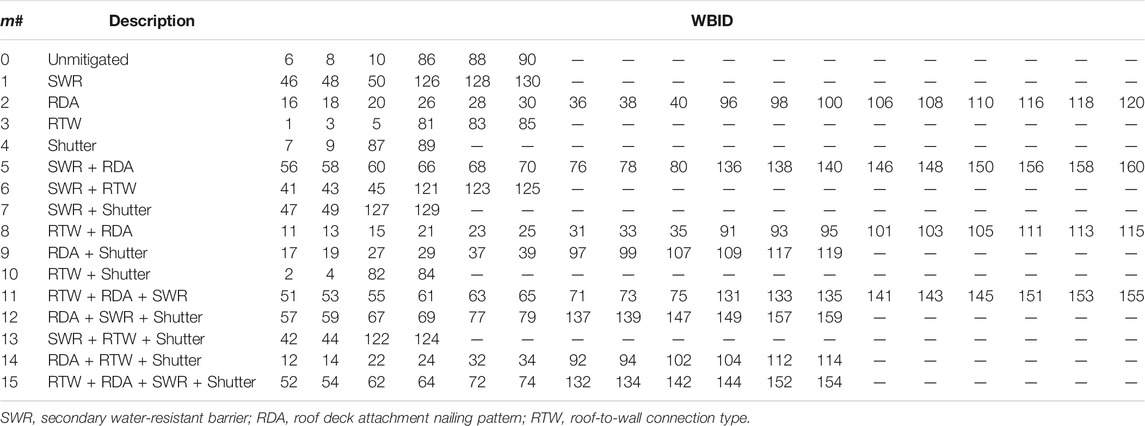
TABLE 2. WBIDs corresponding to unmitigated buildings and mitigated buildings for each mitigation strategy, m.
Residential Wind Mitigation Cost
The one-story residential case study building utilized for this study was developed by Orooji and Friedland. (2021b), which assumes a floor area of 206m2 (2,213 SF) and an unmitigated construction cost of $258,487 located in a light suburban community in Louisiana (Latitude: 29.35, Longitude: 90.24). Figure 3 shows a 3D schematic of the case study building. Each mitigation strategy considered will result in additional new or retrofit construction cost, using the assumptions in Table 3, which were adapted from Orooji and Friedland. (2017) who obtained cost data from a local builder’s supply, “big box” stores, and published component-level housing cost data included in RSMeans (Gordian, 2013).
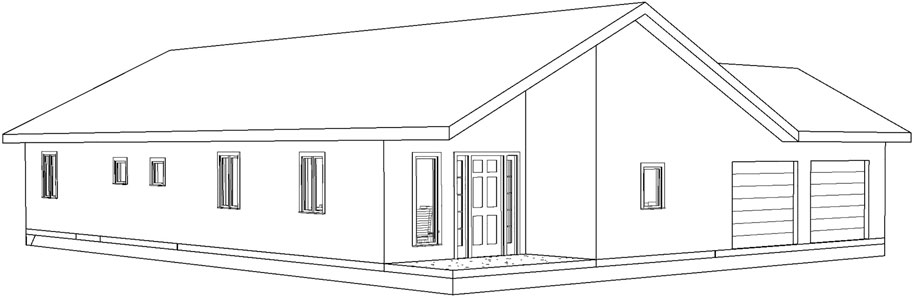
FIGURE 3. 3D Schematic of the case study building.
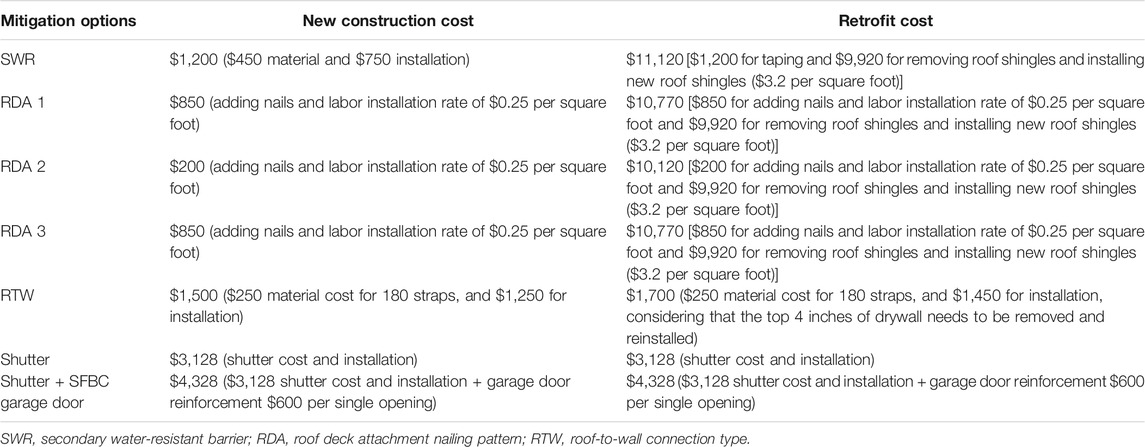
TABLE 3. New and retrofit construction cost for each mitigation strategy in a one-story residential building (adapted from Orooji and Friedland 2017).
Average Annual Loss
Average annual loss (AAL) is the average expected loss per year calculated over a long period of time. It is calculated as the integral of the loss exceedance curve (Eq. 4). AAL can be expressed in two ways, first as a percentage of building value where the loss function is a function of building value, and second as absolute currency where the loss function is manifested in terms of currency. In this paper, AAL refers to an average annual loss in general, and AAL% and AAL$ refer to relative and absolute AAL, respectively.
In the Hazus-MH Hurricane Model repository, direct economic loss functions are presented as a function of wind speed at 2.24 m/s (5 mph) intervals instead of continuous curves. Therefore, Monte Carlo simulation was used to estimate AALs for each type of direct economic loss function (Eqs 5–7).
AALb,%, AALc,%, and AALu,% represent the average annual loss of building, content, and loss-of-use, respectively; S is the number of simulations; and Rands is a random number between zero and one generated for each simulation s representing the non-exceedance probability. F−1(Rands) is the inverse of the cumulative Weibull distribution and returns the maximum annual wind speed for each simulation, and Lb [F−1(Rands)], Lc [F−1(Rands)], and Lu [F−1(Rands)] returns the building, content, and loss-of-use economic losses, respectively, as a proportion of building value corresponding to the maximum wind speed for simulation years.
Total average annual loss AALT as a proportion of building value, AALT,% is the summation AAL of the building, content, and loss-of-use expressed as a ratio of building value (Eq. (8)). The absolute value of average annual loss in monetary terms, AALT,$, is calculated by Eq. (9) where BV is a building value.
Net Benefit and Payback Period
The life-cycle wind loss (LK) of these WBIDs is calculated using Eq. (10), considering an adjusted discount rate (RAD) of 4%, where K represents the decision-making time horizon (years) and B is the building cost. RAD shows the relationship between inflation and discount rates. The cost of the material and installation, which depends on the type of construction (retrofit or new), Cm, is also included in the life-cycle wind loss calculation.
The life-cycle wind loss for mitigation strategy m (
The cost effectiveness of a mitigation strategy within a particular wind contour indicates a positive net benefit (NB) after implementing the mitigation strategy. Each mitigation strategy is analyzed by comparing the life-cycle wind loss before and after the implementation of the mitigation strategy. In other words, the net benefit of mitigation strategy m is the difference between the mean life-cycle wind loss of the unmitigated buildings (
To represent the variability of the calculated net benefit, a one-sample t-test is calculated to determine the 95% confidence interval for the mean life-cycle wind loss across wind contours for each mitigation strategy (m = 0–15).
Payback period is the time required for the net benefit to become zero. If zero net benefit occurs between any two decision-making time horizons, the payback period is calculated by linear interpolation.
Results
Net benefits can be positive or negative and are calculated for a building without insurance for wind hazard. Positive values occur when the accumulated avoided losses exceed the new or retrofit implementation construction cost. Positive values represent mitigation strategies that are, on average, cost effective during the time period considered. On the other hand, negative values occur when the reduction in AAL is not sufficient to recoup the new or retrofit construction costs within the given time horizon. Negative values represent mitigation strategies that are, on average, cost ineffective during that time period.
Figure 4 shows the average net benefit of the 15 evaluated wind hazard mitigation strategies for a 30-years time horizon on ASCE 7 wind speed contours for a newly constructed building on terrain ID 2 (0.15 m, light suburban). The highest net benefit occurs for the mitigation option that includes all the mitigation strategies, RTW + RDA + SWR + Shutter, inside the 62 m/s (140 mph) wind contour. But the same is not the case for wind speeds below 62 m/s (140 mph). The RDA mitigation strategy gives a higher positive result for wind speeds below 62 m/s (140 mph).
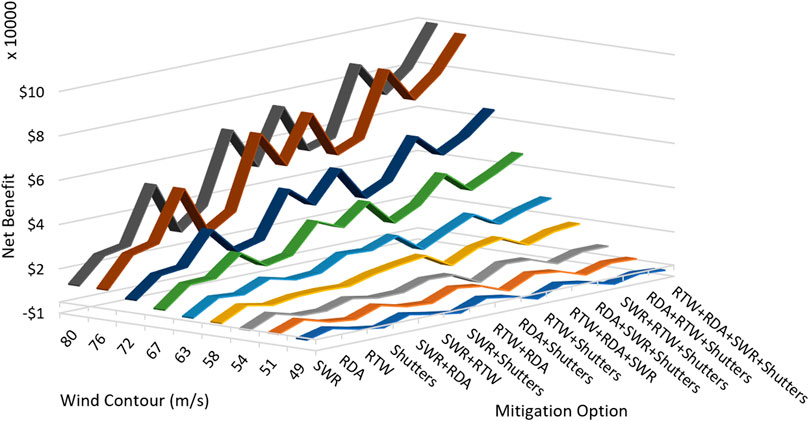
FIGURE 4. Net benefit of wind hazard mitigation strategies for a 30-year time horizon based on ASCE 7 wind speed contours using new construction cost.
The net benefit of wind hazard mitigation strategies for a 30-years time horizon on ASCE 7 wind speed contours, based on the retrofit cost, is shown in Figure 5. The mitigation option that includes all the mitigation strategies, RTW + RDA + SWR + Shutter, has the highest net benefit inside the 67 m/s (150 mph) wind contour. Below 67 m/s (150 mph) the net benefit is higher for SWR + RTW + Shutter combination, and below 53 m/s (120 mph) winds RTW has a higher net benefit.
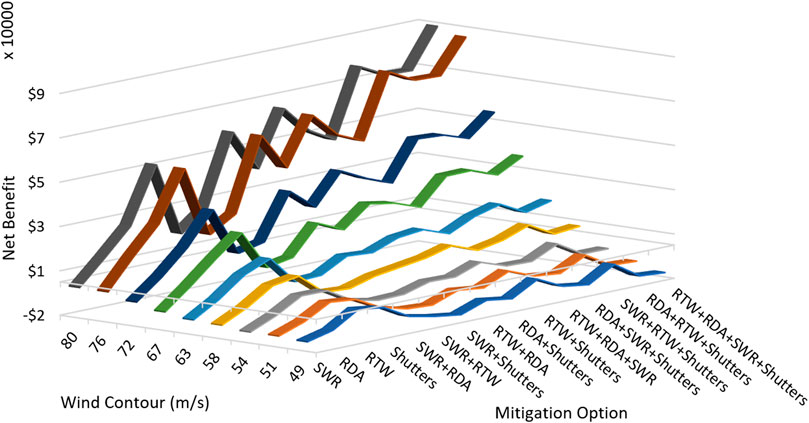
FIGURE 5. Net benefit of wind hazard mitigation strategies for a 30-year time horizon based on ASCE 7 wind speed contours using retrofit construction cost.
Whether a mitigation strategy is cost effective or not is highly dependable on the payback period. Here, the period is assumed to be 30 years. If a mitigation strategy gives positive values below the 30-years time horizon, the cost of mitigation strategy and the loss are redeemed within 30 years of the building life. If not, the mitigation strategy is considered cost ineffective within the 30-years time horizon. Table 4 presents the payback period of mitigation strategies inside each wind contour for new and retrofit construction.
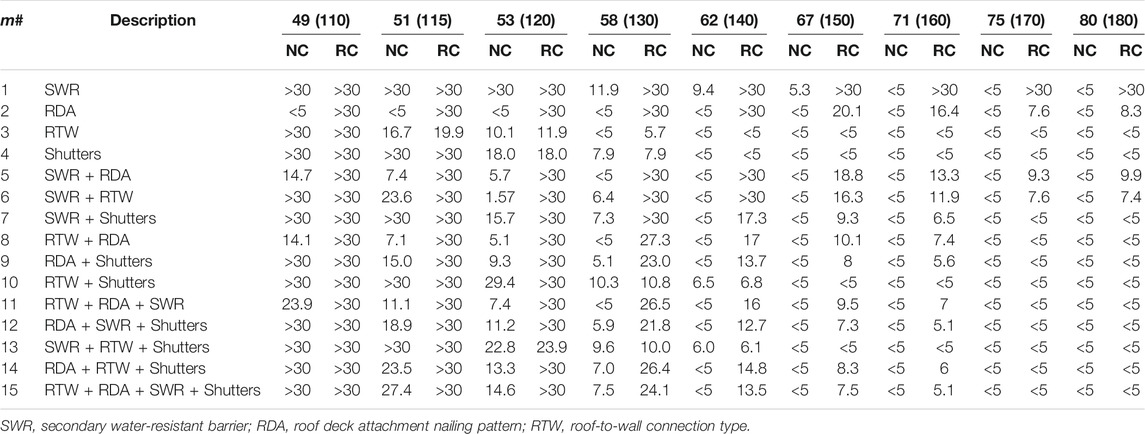
TABLE 4. Payback period (in years) of mitigation strategies by wind contour, m/s (mph), for new construction (NC) and retrofit construction (RC).
It is noteworthy that adding secondary water resistance and changing the nail pattern requires replacement of roof cover and maybe more economical if applied upon roof replacement. In addition, replacing toe-nail roof-wall connections with rated strap connections requires removal and reinstallation of the top 4 inches of drywall and maybe more economical if applied during drywall replacement (Orooji and Friedland, 2017). These retrofit adjustments can significantly reduce the payback period, similar to that of new construction for the mitigation strategies of SWR, RDA, RTW, and their combinations. Table 5 provides mitigation strategies for each wind speed contour for the case study based on the highest net benefit and NBCR.
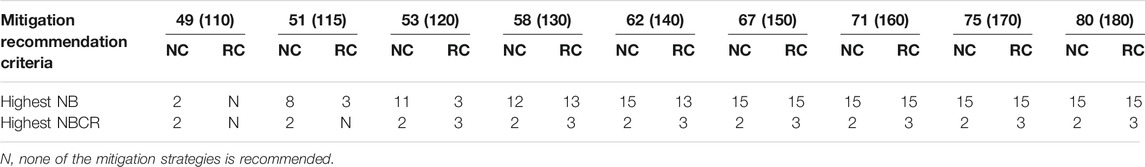
TABLE 5. Mitigation recommendation (mitigation strategy number) by wind contour, m/s (mph), for new construction (NC) and retrofit construction (RC) based on the highest net benefit (NB) and the highest net benefit cost ratio (NBCR).
Discussion
In this study, the mitigation strategies are analyzed based on net benefit value and payback period. The payback period calculated in this study has some values that are outside the time frame assumed for this study. Those values are not extrapolated to find the exact payback period outside the range, but instead they are denoted as “out of the range” values of >30 or <5 years.
The results show that all 15 mitigation strategies are cost effective within the 58 m/s (130 mph)–80 m/s (180 mph) wind contours, and all mitigation strategies except SWR only are cost effective inside the 53 m/s (120 mph) wind contour. Moreover, all mitigation strategies except SWR, Shutters, SWR + Shutters, RTW + Shutters, and SWR + RTW + Shutters are cost effective inside the 51 m/s (115 mph) wind contour. RDA, SWR + RDA, RTW + RDA, and RTW + RDA + SWR mitigation strategies are cost effective inside the 49 m/s (110 mph) wind contour. For retrofit construction, utilization of only SWR is not cost effective inside any wind contours shown. All other strategies are cost effective within the 67 m/s (150 mph)–80 m/s (180 mph) wind contours. Also, inside the 49 m/s (110 mph) wind contour, no mitigation strategy is cost effective, showing that the mitigation strategy is cost effective outside the 49 m/s (110 mph) wind contour only when installed during construction. Inside the 51 m/s (115 mph) wind contour, only RTW provides a cost-effective return on investment in 30 years.
Table 5 shows mitigation recommendations in each wind contour based on the highest NB and NBCR. The most frequent strategy with the highest NB is strategy no. 15 (RTW + RDA + SWR + Shutters) with all mitigation practices together and the most frequent strategies with the highest NBCR are strategies no. 2 (RDA) and 3 (RTW).
Table 6 shows the recommended mitigation strategies in each wind contour based on the net benefit for a 30-years time horizon for new and retrofit construction. The recommendations are categorized into four groups. First, highly recommended mitigations are mitigation strategies with more than $40,000 in net benefit. The second and third groups are the mitigation strategies that have between $25,000 to $40,000 and $10,000 to $25,000 in net benefit after 30 years. The fourth category includes the mitigations that have less than $10,000 in net benefit after 30 years and are denoted by “-”. To validate the results, the percentage decreases in the average annual total loss by mitigation strategy reported by Hazus were presented in Table 7.
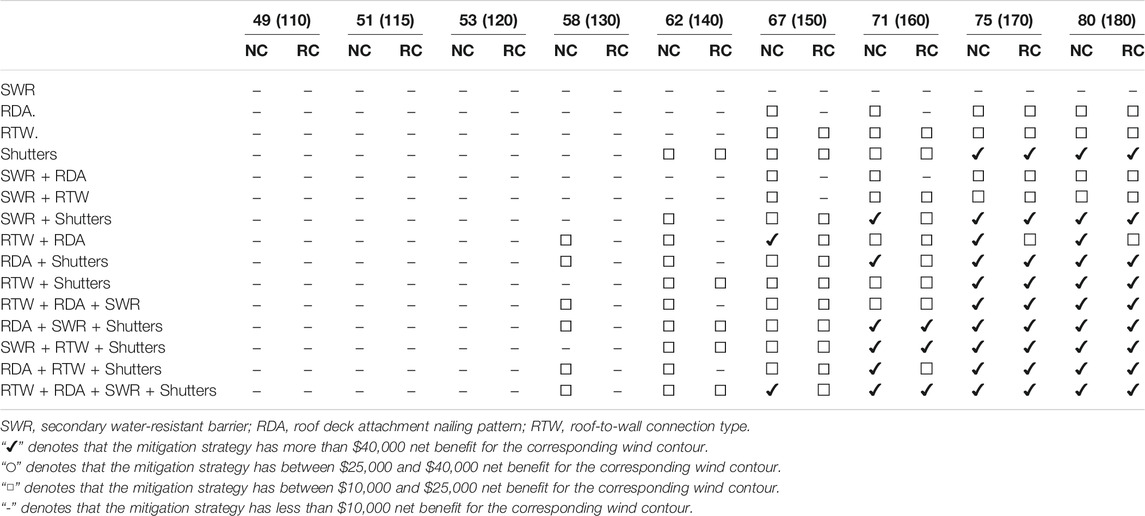
TABLE 6. Mitigation recommendation by wind contour, m/s (mph), for new construction (NC) and retrofit construction (RC), for a 30-year time horizon.
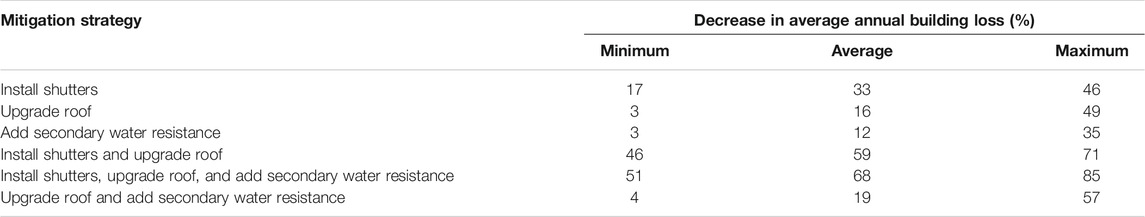
TABLE 7. Percent decreases in the average annual total loss due to mitigation parameters (minimum/average/maximum)—residential buildings (FEMA, 2012).
Under unprecedented hazard scenarios, increases in wind intensity may damage even the residences that have applied the recommended mitigation plan. The recommended mitigation strategies, which are effective for the 30–years payback period, exhibit cost-effectiveness for only ASCE 7 wind speed contour intervals, which is a basic wind speed followed as a standard in engineering building codes. Extra caution should be taken to avoid risks due to intensified wind, which may become more common in the future under climate change scenarios. Figure 6 implies that for each of the 15 mitigation strategies, the net benefits have large gaps among the contour surface along the y- and z-axes, for all five mitigation categories over a 30-years time horizon. Thus, one should apply the best judgment for receiving risk-free net benefit based on the location of the building within the existing wind contour and the probability of experiencing a more intense wind over the relevant time horizon.
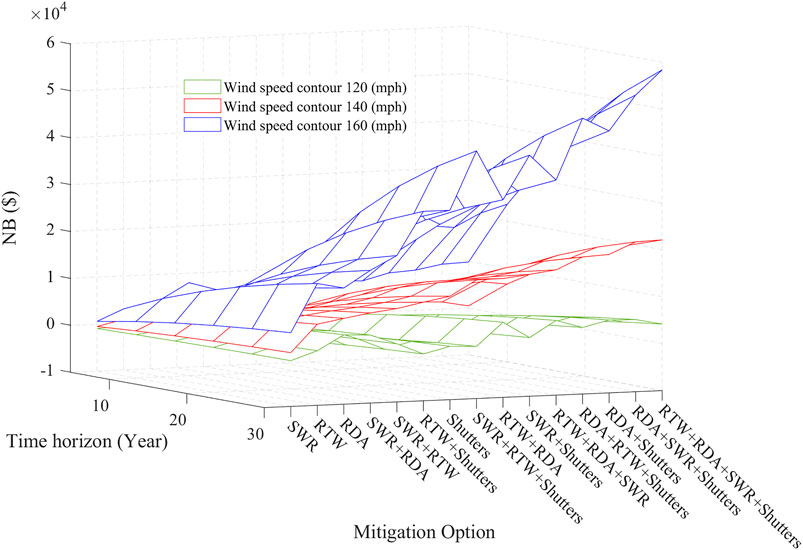
FIGURE 6. Net benefit for wind contour 120, 140, and 160 as a function of homeowner time horizon and mitigation option.
According to FEMA. (2012), AALT can be reduced only by implementing six of the 15 mitigation strategies, i.e., by 1) installing shutters, 2) upgrading roof, 3) adding SWR, 4) installing shutters and upgrading roof, 5) installing shutters, upgrading roof, and adding SWR, and 6) upgrading roof and adding SWR. For each of these mitigation strategies, one can decrease the AAL by 12–68 percent, on average. For example, upgrading the roof of a residential building can reduce the AALT by 3–49 percent, while installing shutters, upgrading roof, and adding SWR can reduce the average annual total loss by 51–85 percent. These six mitigation strategies make a huge contribution to reducing the AAL; therefore, one should consider these mitigation strategies for either new construction or retrofit.
Additional Assumptions, Limitations, and Future Work
This study is based on loss functions extracted from the Hazus-MH version 3.2 database. Hence, the calculated net benefit depends on the accuracy of the Hazus-MH loss functions. The latest version of Hazus-MH (version 4) can be utilized in future work to calculate the net benefit. Also, wind directionality was not considered in this study, since in Hazus, wind direction is an attribute for engineered building types, and it is not an attribute for wood-frame single-family homes.
The nature of our analysis focuses on using the mitigation techniques presented in Hazus. However, the practicality of some of the mitigation strategies for existing buildings (e.g., RTW), needs further investigation. For example, strengthening a component can lead to overload of an unretrofitted, component. In future work, FORTIFIED Roof™ (https://fortifiedhome.org/roof/) by Insurance Institute for Business & Home Safety (IBHS) can be considered as one of the mitigation strategies that have a combination of all mitigation practices for the roof component of a building.
The AALs are calculated for ASCE 7 Risk Category II wind contours. The life cycle cost analysis includes AAL and does not account for homeowner’s insurance. Because insurance premiums are a significant life-cycle cost, these will be included in future work. Moreover, for new construction, for which the cost of wind mitigation is typically amortized into a monthly mortgage payment, the homeowner may realize significant savings on the insurance that reduce the overall cost of ownership and shorten or eliminate the payback period. Inclusion of policy payments requires a different analysis that simulates individual events and apportion loss to the homeowner or the insurance carrier.
Although hurricane is a multi-hazard (e.g., surge/flooding, rain, debris), in this study, authors only considered the wind effect of hurricane on building to isolate the impact of wind mitigation options with regards to the wind hazard.
The repair or replacement cost in this paper is adopted from RSMeans cost of new construction but the actual repair cost can be higher due to the cost of removing the damaged components. Also, the costs are always prone to change as the prices for material and labor change daily. Therefore, the numbers are used in this research solely to explain the methodology and changing them can affect the recommended mitigation strategies based on the net benefit cost ratio. In future studies, more comprehensive cost studies can improve the accuracy of results.
The literature on the impacts of climate change on extreme winds is conflicting, and since there is still debate about the future of thunderstorm activity, it should come as no surprise that there remains a general lack of consensus regarding the impact of global climatic change on tornado frequency and/or intensity. Forecasts are difficult to make, even with the most advanced general circulation models (GCMs), in part because of the vast difference in scale between model output and the local nature of the weather conditions that create tornadoes. Furthermore, an incomplete understanding of the physics involved in tornadic development complicates projections. Therefore, in this study, the impact of climate change is not considered.
For future work, sensitivity analysis will be performed to evaluate the analysis by changing the cost of the building value and understanding the impact of fluctuating material cost. Since this analysis depends on the building value of a one-story, single-family, residential wood-framed building, future work should consider varied unit costs of the building. If the results replicate the same trend in the net benefit and payback period values, the confidence of the results will be improved. Also, the sensitivity analysis can be performed on the selection of other ranges of discount rates. The other factors that vary over time are new and retrofit cost and adjusted discount rate. These factors should also be considered in the sensitivity analysis by varying one factor at a time while holding all others constant. Finally, the impact potential climate change effects will be considered in future work to support longer time horizons for building mitigation avoided loss analysis.
Summary and Conclusion
This research presents the generalized cost effectiveness of residential wind mitigation strategies for wood-frame, single-family housing in the United States. Results show that significant opportunities exist to improve economic resilience to wind hazards. Implementing cost effective wind mitigations pays off the initial or retrofit cost within the building life while improving the overall performance of buildings. Building codes have minimum standards for mitigation strategies in wind-prone areas. Enhancing the building codes based on this and future analysis will result in better building performance against wind hazards and benefit citizens and communities financially through decreased public assistance. Important contributions of the study are as follows:
• cost effectiveness of mitigation strategies inside different wind contours for new and retrofit construction, considering a wood-framed, single-family residential building
• net benefit of the mitigation strategy for a combination of 15 wind mitigation strategies, with new and retrofit construction costs ranging between $1,200 and $12,000 and a decision-making time horizon ranging between 5 and 30 years
• payback periods for each mitigation strategy and results summarized by net benefit for all ASCE 7 wind speed contour intervals
• enhanced economic benefits of implementing mitigation strategies during building construction rather than as a retrofit
Data Availability Statement
The original contributions presented in the study are included in the article/Supplementary Material, further inquiries can be directed to the corresponding author.
Author Contributions
RS initiated the research, data analysis, and manuscript preparation. FO improved the methodology and contribute to the analysis. CF provided original ideas and supervised this research and advice on the overall project methodology. CM, AT, and NB assisted in running the analysis. FO, CF, AT, CM, RS, NB, and RR contributed the organizing the research, formulation, and selection, and evaluation of the case study as well as writing of the manuscript. All authors contributed to the article and approved the submitted version.
Funding
This research was supported by the Gulf Research Program of the National Academies of Sciences, Engineering, and Medicine under the Grant Agreement number: 2000–10,880 “The New First Line of Defense: Building Community Resilience through Residential Risk Disclosure” Any opinions, findings, and conclusion or recommendations expressed in this research are those of the authors and do not necessarily reflect the views of the Gulf Research Program or the National Academies of Sciences, Engineering, and Medicine. Publication of this article was subsidized by the Louisiana State University (LSU) Libraries Open Access Author Fund and the Performance Contractors Professorship in the College of Engineering at LSU.
Conflict of Interest
The authors declare that the research was conducted in the absence of any commercial or financial relationships that could be construed as a potential conflict of interest.
Publisher’s Note
All claims expressed in this article are solely those of the authors and do not necessarily represent those of their affiliated organizations, or those of the publisher, the editors and the reviewers. Any product that may be evaluated in this article, or claim that may be made by its manufacturer, is not guaranteed or endorsed by the publisher.
References
Applied Research Associates, Inc. (ARA) (2008). 2008 Florida Residential Wind Loss Mitigation Study. Florida Office of Insurance Regulation. Available at: https://www.floir.com/sitedocuments/aralossmitigationstudy.pdf.
ASCE (2017). Minimum Design Loads and Associated Criteria for Buildings and Other Structures. Reston, Virginia: American Society of Civil Engineers. doi:10.1061/9780784414248
Baradaranshoraka, M., Pinelli, J. P., Gurley, K., Peng, X., and Zhao, M. (2017). Hurricane Wind versus Storm Surge Damage in the Context of a Risk Prediction Model. J. Struct. Eng. 143 (9), 04017103. doi:10.1061/(ASCE)ST.1943-541X.0001824
Barbato, M., Petrini, F., and Ciampoli, M. (2011). A Preliminary Proposal for a Probabilistic Performance-Based Hurricane Engineering Framework. Structures Congress 2011, 1618–1629. doi:10.1061/41171(401)141
Barbato, M., Petrini, F., Unnikrishnan, V. U., and Ciampoli, M. (2013). Performance-based Hurricane Engineering (PBHE) Framework. Struct. Saf. 45, 24–35. doi:10.1016/j.strusafe.2013.07.002
Chiu, C. K., Chen, M. R., and Chiu, C. H. (2013). Financial and Environmental Payback Periods of Seismic Retrofit Investments for Reinforced Concrete Buildings Estimated Using a Novel Method. J. Archit. Eng. 19 (2), 112–118. doi:10.1061/(ASCE)AE.1943-5568.0000105
De Nocker, L., Broekx, S., Liekens, I., Bulckaen, D., Smets, S., Gauderis, J., et al. (2006). “Cost-benefit Analysis to Select the Optimal Flood Protection Strategy along the Scheldt,” in Risk Analysis V: Simulation and Hazard Mitigation. Editors V. Popov, and C. A. Brebbia (UK: Wessex Institute of Technology), 271–277. doi:10.2495/RISK060261
Drobinski, P., Coulais, C., and Jourdier, B. (2015). Surface Wind-Speed Statistics Modelling: Alternatives to the Weibull Distribution and Performance Evaluation. Boundary-layer Meteorol. 157 (1), 97–123. doi:10.1007/s10546-015-0035-7
Emanuel, K., Ravela, S., Vivant, E., and Risi, C. (2006). A Statistical Deterministic Approach to Hurricane Risk Assessment. Bull. Amer. Meteorol. Soc. 87 (3), 299–314. doi:10.1175/BAMS-87-3-299
FBC (2020). Florida Building Code, Residential. International Code Council Available at: https://codes.iccsafe.org/codes/florida.
FEMA (2018). Hazus hurricane Model User Guidance. Washington, D.C: Federal Emergency Management Agency.
FEMA (2012). Multi-Hazard Loss Estimation Methodology: Hazus-MH 2.1. Hurricane Model Technical Manual. Washington DC. Available at: https://www.hsdl.org/?view&did=701265.
GOHSEP (2019). Louisiana Hazard Mitigation Plan. Louisiana Governor’s Office of Homeland Security and Emergency Preparedness. Baton Rouge, LA. http://gohsep.la.gov/MITIGATE/HM-PLANNING/State-Hazard-Mitigation-Plan.
Gurley, K. R., and Masters, F. J. (2011). Post-2004 Hurricane Field Survey of Residential Building Performance. Nat. Hazards Rev. 12 (4), 177–183. doi:10.1061/(ASCE)NH.1527-6996.0000044
Hamid, S., Golam Kibria, B. M., Gulati, S., Powell, M., Annane, B., Cocke, S., et al. (2010). Predicting Losses of Residential Structures in the State of Florida by the Public Hurricane Loss Evaluation Model. Stat. Methodol. 7 (5), 552–573. doi:10.1016/j.stamet.2010.02.004
Jain, V. K., Davidson, R., and Rosowsky, D. (2005). Modeling Changes in Hurricane Risk over Time. Nat. Hazards Rev. 6 (2), 88–96. doi:10.1061/(asce)1527-6988(2005)6:2(88)
Li, Y., and Ellingwood, B. R. (2006). Hurricane Damage to Residential Construction in the US: Importance of Uncertainty Modeling in Risk Assessment. Eng. Structures 28 (7), 1009–1018. doi:10.1016/j.engstruct.2005.11.005
National Oceanic and Atmospheric Administration. (2020). Record-breaking Atlantic Hurricane Season Draws to an End. Available at: https://www.noaa.gov/media-release/record-breaking-atlantic-hurricane-season-draws-to-end [Accessed July 20, 2021].
National Science Board (U.S.) and National Science Foundation (U.S.) (2007). Hurricane Warning: The Critical Need for a National Hurricane Research Initiative. Arlington, VA: National Science Foundation.
National Weather Service. (2020). Weather Related Fatality and Injury Statistics. Available at: https://www.weather.gov/hazstat/[Accessed July 20, 2021].
Noori, M., Miller, R., Kirchain, R., and Gregory, J. (2018). How Much Should Be Invested in Hazard Mitigation? Development of a Streamlined Hazard Mitigation Cost Assessment Framework. Int. J. Disaster Risk Reduction 28, 578–584. doi:10.1016/j.ijdrr.2018.01.007
Noshadravan, A., Miller, T. R., and Gregory, J. G. (2017). A Life-Cycle Cost Analysis of Residential Buildings Including Natural Hazard Risk. J. Construction Eng. Manage. 143 (7), 04017017. doi:10.1061/(ASCE)CO.1943-7862.0001286
Orooji, F., and Friedland, C. J. (2021a). Analytical Framework for Homeowner-Focused Computational Cost-Benefit Mitigation Decision Making. Front. Built Environ. 6. doi:10.3389/fbuil.2020.592511
Orooji, F., and Friedland, C. J. (2021b). Average Annual Wind Loss Libraries to Support Resilient Housing and Community Decision-Making. Housing Soc. 48 (2), 155–184. doi:10.1080/08882746.2020.1796108
Orooji, F., and Friedland, C. J. (2017). Cost-Benefit Framework to Generate Wind Hazard Mitigation Recommendations for Homeowners. J. Architectural Eng. 23 (4), 04017019. doi:10.1061/(ASCE)AE.1943-5568.0000269
Orooji, F. (2015). Risk-based Wind Loss and Mitigation for Residential Wood Framed Construction. dissertation. Baton Rouge (LA): Louisiana State University.
Pinelli, J.-P., Simiu, E., Gurley, K., Subramanian, C., Zhang, L., Cope, A., et al. (2004). Hurricane Damage Prediction Model for Residential Structures. J. Struct. Eng. 130 (11), 1685–1691. doi:10.1061/(asce)0733-9445(2004)130:11(1685)
Pinelli, J.-P., Torkian, B. B., Gurley, K., Subramanian, C., and Hamid, S. (2009). “Cost Effectiveness of hurricane Mitigation Measures for Residential Buildings,” in Paper presented at the Proceedings, 11th America’s Conference on Wind Engineering (American Association of wind Engineering). www.aawe.org.
Qin, H., and Stewart, M. G. (2020a). Risk Perceptions and Economic Incentives for Mitigating Windstorm Damage to Housing. Civil Eng. Environ. Syst. 38 (1), 1–19. doi:10.1080/10286608.2020.1855429
Qin, H., and Stewart, M. G. (2020b). Risk-Based Cost-Benefit Analysis of Climate Adaptation Measures for Australian Contemporary Houses under Extreme Winds. J. Infrastruct Preserv Resil 1 (1), 1–19. doi:10.1186/s43065-020-00002-1
Rosenzweig, C., and Solecki, W. (2014). Hurricane Sandy and Adaptation Pathways in New York: Lessons from a First-Responder City. Glob. Environ. Change 28, 395–408. doi:10.1016/j.gloenvcha.2014.05.003
Simmons, K. M., Kovacs, P., and Smith, A. B. (2020). State- By-State Analysis of Benefits to Cost from Wind-Enhanced Building Codes. Nat. Hazards Rev. 21 (2), 04020007. doi:10.1061/(ASCE)NH.1527-6996.0000358
Stevenson, S. A., Kopp, G. A., and El Ansary, A. M. (2020). Prescriptive Design Standards for Resilience of Canadian Housing in High Winds. Front. Built Environ. 6, 99. doi:10.3389/fbuil.2020.00099
Torkian, B. B., Pinelli, J.-P., Gurley, K., and Hamid, S. (2014). Cost-and-Benefit Evaluation of Windstorm Damage Mitigation Techniques in Florida. Nat. Hazards Rev. 15 (2), 150–157. doi:10.1061/(ASCE)NH.1527-6996.0000122
Unnikrishnan, V. U., and Barbato, M. (2017). Multihazard Interaction Effects on the Performance of Low-Rise Wood-frame Housing in Hurricane-prone Regions. J. Struct. Eng. 143 (8), 04017076. doi:10.1061/(asce)st.1943-541x.0001797
Unnikrishnan, V. U., and Barbato, M. (2015). Performance-Based Comparison of Different Design Alternatives and Retrofit Techniques for Residential Buildings Subjected to Hurricane Hazards. Structures Congress 2015, 1596–1607. doi:10.1061/9780784479117.137
Unnikrishnan, V. U., and Barbato, M. (2016b). Performance-based Comparison of Different Storm Mitigation Techniques for Residential Buildings. J. Struct. Eng. 142 (6), 04016011. doi:10.1061/(ASCE)ST.1943-541X.0001469
Unnikrishnan, V. U., and Barbato, M. (2016a). “Performance-based Hurricane Engineering: A Multi-hazard Approach,” in Multi-hazard Approaches to Civil Infrastructure Engineering (Cham: Springer), 337–356. doi:10.1007/978-3-319-29713-2_16
Vickery, P. J., Skerlj, P. F., Lin, J., Twisdale, L. A., Young, M. A., and Lavelle, F. M. (2006). HAZUS-MH hurricane Model Methodology. II: Damage and Loss Estimation. Nat. Hazards Rev. 7 (2), 94–103. doi:10.1061/(asce)1527-6988(2006)7:2(94)
Keywords: wind hazard, cost effectiveness, net benefit, payback period, wood frame residential, mitigation, Hazus-MH, resilient construction
Citation: Orooji F, Friedland CJ, Savio RD, Taghinezhad A, Massarra CC, Bushra N and Rohli RV (2022) Generalized Cost-Effectiveness of Residential Wind Mitigation Strategies for Wood-Frame, Single Family House in the USA. Front. Built Environ. 7:745914. doi: 10.3389/fbuil.2021.745914
Received: 22 July 2021; Accepted: 16 December 2021;
Published: 24 January 2022.
Edited by:
Teng Wu, University at Buffalo, United StatesReviewed by:
Reda Snaiki, École de Technologie Supérieure, CanadaFrancesco Petrini, Sapienza University of Rome, Italy
Kurtis Robert Gurley, University of Florida, United States
Jean-Paul Pinelli, Florida Institute of Technology, United States
Copyright © 2022 Orooji, Friedland, Savio, Taghinezhad, Massarra, Bushra and Rohli. This is an open-access article distributed under the terms of the Creative Commons Attribution License (CC BY). The use, distribution or reproduction in other forums is permitted, provided the original author(s) and the copyright owner(s) are credited and that the original publication in this journal is cited, in accordance with accepted academic practice. No use, distribution or reproduction is permitted which does not comply with these terms.
*Correspondence: Fatemeh Orooji, ZmF0ZW1laC5vcm9vamlAd2t1LmVkdQ==