 Karel B.J. Van den Berghe1*
 Teun J. Verhagen2
- 1Department of Management in the Built Environment, Delft University of Technology, Delft, Netherlands
- 2Leiden University, Institute of Environmental Sciences, Leiden, Netherlands
Increasingly, space for remanufacturing is seen as the most valuable resource to achieve circular economy (CE) policy goals, in particular for cities. However, in many cities, industrial urban areas are increasingly subject of – mostly circular designed - residential redevelopment. The proposition of this paper is that these diminishing industrial areas host, at least potentially, essential functions necessary to “close the material loop.” The reason why policy makers neglect the necessity of remanufacturing capacity, is because it is difficult to pinpoint the “ideal” geography of a circular loop. Most (circular) products can be transported limitless, thus their remanufacturing functions can be located around the world. But what if a critical material cannot be transported limitless and has circular potential? Therefore, this paper focusses on concrete for two reasons. First, concrete is by far the most abundant material in urban areas. Second, newly/circular made fluid concrete can only be transported for a limited time and distance. The hypothesis of this paper is that concrete plants are and will become essential for circular cities. Subsequently, we focus on the Dutch city of The Hague and combine a Material Flow Analysis with the locations of the concrete resupply chain. Our results show that potentially The Hague has a 100% circular concrete chain, but the importance of its concrete plant is (implicitly) neglected. We conclude that The Hague is illustrative for the problem of many circular cities that are without (implicitly) taking into account the whole circular resupply chain, jeopardized today a future urban CE.
Introduction
This paper operationalizes the concept of urban metabolism to explore the spatial challenges of urban circular economy (CE) policies. Our arguments start from the paper by Newell and Cousins (2015) on the boundaries of urban metabolism. In their paper, they point out that the concept of urban metabolism is not straightforward and can be perceived within three different ecologies: Marxist, industrial and urban ecologies (see also Wachsmuth, 2012). Without explaining them in detail, they differ in how they use urban metabolism as an analytical unit to study respectively nature-society relationships, quantitative material flows and stocks, and urban complex ecosystems (of sub-systems, cf. Luhmann (1982)). As they continue, all three have their advantages and disadvantages. But, similar to Newell and Cousin’s arguments, in this paper we don’t state the one is better suited than the other, but emphasize that advantages in our understanding will come if we combine insights from all three. In particular, Newell and Cousins propose to combine industrial ecological with political ecological research. That enables on the one hand to use clear result oriented quantitative methodologies, but simultaneously on the other hand enables to apply qualitative spatial critical socio-economic and institutional approaches. In other words, the concept of urban metabolism is useful to understand relational socio-ecological systems, by applying quantitative material processes.
The goal of this paper is to continue this endeavour and go to the next step, namely the operationalization of the concept of urban metabolism in order to understand its boundaries. The setting in which we operationalize the concept is the CE. It is not the first time the concept of urban metabolism and CE are combined, quite the contrary (Russell et al., 2019; Paiho et al., 2020). Nevertheless, arguably at least implicitly many of these studies quickly see them as synonyms. We, however, state that this is not true. While urban metabolism is a neutral quantitative and qualitative analytical concept examining (im)material, institutional and energy relations and flows within, from and towards cities, the CE is normative as it strives that the existing flows are or should become circular. Another difference is that the CE in essence is a network concept, without a clear geography, or (urban) boundaries. Hence, translating the CE towards an urban context, via thus in this case urban metabolism, is not straightforward. In other words, it is not because the CE is combined with urban metabolism, one then has solved the issue of scale and has clearly defined an urban CE. The misunderstanding here comes exactly from the reason that an urban metabolism is not only a clear quantifiable concept, but also a political ecological one, as explained above. Putted more simply, although thus urban metabolism clearly focusses on the urban, it still remains vague what that urban then exactly entails (Heynen et al., 2006). Indeed, a city is all but a clear defined entity (Brenner and Schmid, 2014). Hence, a circular urban metabolism is maybe easy to understand as a normative discourse, nevertheless, it remains difficult to exactly know what it entails. The reason for this is because it is unclear what the ‘urban’ entails, where it starts and where it ends. In other words, it is not clear what the spatial contours are of a circular urban economy (see in this respect also Tapia et al., 2021). This leads to our research question: What is the geography of a circular city?
Until today, foremost the quantitative methods dominate both the urban metabolic as CE studies, receiving vast critiques by now (Korhonen et al., 2018a; Korhonen et al., 2018b). While most critiques underline – correctly – that we should enhance our insights on the topic of the social and economic elements of the CE, in this paper, we focus on the political institutional part of the CE. We do this because a circular city is in essence a political subject. Different than urban metabolism or CE, circular city as a concept and by now even discourse (Van den Berghe and Vos, 2019), did not emerge within a dominantly scientific community (cf. Wolman, 1965), but within policy maker environments. As described by others (Williams, 2019; 2021), the policy ambition to become a circular city has recently become embraced by numerous city governments around the world, such as Paris, London or Amsterdam (Williams, 2021). The core of these urban policy goals is to avoid waste as much as possible and to use no longer virgin materials. Different themes are then chosen to focus on, but a constant is a focus on the built environment. This is not a coincidence, because the built environment and construction sector is the major reason of the vast use of virgin materials and the production of waste of cities (UN, 2019).
The reason why in this paper we attempt to explicitly research the geography of the circular city, is because recently increasing authors have signalled that the current application of the circular city policy is at least implicitly not being used in the first place to make cities more circular, but to accelerate the development of residential and commercial land use. As explained by Van den Berghe and Vos (2019) and Williams (2019), a circular city exists if both the outcome of the built environment, thus a circular designed built environment, is combined with a circular functioning built environment. The latter entails that a circular city policy also takes into account that the material flows going to (cf. construction) and coming from (cf. demolition/harvest) the built environment are processed in a circular way. Put otherwise, a successful circular city implies that the whole existing chain of the built environment is circular. This implies that not only supply and demand of materials is matched, but also the often forgotten step-in-between, the remanufacturing, is taken into account. It is in most cases an utopia that supply and demand match perfectly. This is because of two reasons. First, realistically there is a time difference, which implies that materials have to be stored temporally before they can be used again. For this reason, increasingly cities are thinking of creating so-called circular material hubs (Loeber and Snoek, 2020), areas where materials can temporarily be stored. Second, mostly materials cannot be used one-on-one from a demolished building into a new building. Mostly, materials need to be modified (e.g. painted). Sometimes, materials have to be processed entirely to become useful again. Examples are steel or concrete, abundantly present in urban built environments, that in many cases have to be melted or grinded respectively before they can be circularly be remade into new steel and concrete.
To answer the research question the article is structured as following. In the next section, we explain the conceptual challenge of connecting space with networks, or geography with relations, exactly the conceptual challenge of a circular urban metabolism as explained. Next we introduce our conceptual framework presenting a circular (re)supply chain, not only composed by the source and destination of circular materials, but also including the necessary connecting functions in-between. Next, we introduce our case study of the city of The Hague in Netherlands, a city which has the policy ambition to become a circular city, but is characterized as a foremost residential and commercial land use city, without the presence of large industrial areas. As we will show, exactly these areas and the (potential) circular functions it hosts, will come crucial in the (near) future to achieve circular city policies. However, the current land use policy of The Hague does all, but safeguarding these areas, paradoxically thus by referring to its circular city policy. We end with a discussion and conclusion.
Urban Circular Cities: Policy, Geography and Networks
Combining geography and networks in the CE literature has been touched upon by a number of authors (Newell and Cousins, 2015; Hobson and Lynch, 2016; Deutz et al., 2017; Haezendonck and Van den Berghe, 2020; Salomone et al., 2020; Van den Berghe et al., 2020; Van den Berghe and Daamen, 2020; Williams, 2021). Although obvious differences in analytical focus, subject and methodologies exist between these works, what they have in common is stressing out the challenge of taking into account the spatial systems boundaries when dealing with sustainable development, of which the CE is the most recent popular advocate (Köhler et al., 2019). In particular Korhonen et al. (2018b) argue that the choice of unit of analysis and the accompanying methodological approaches should always be interpreted together with a critical reading, otherwise it can lead to “scale misperceptions in the interpretation of the applicability of the study results [… whereby for example] a microeconomic-level success can be falsely understood as a contribution to the overall macroeconomic-level sustainability” (Korhonen et al., 2018b).
Until today, arguably the role of scale within the CE literature has been used merely as a way to explain the starting point of the research, rather than being the subject itself. For example, Pomponi and Moncaster (2017), exploring the CE for the built environment, categorized scale using three analytical levels: 1) the micro level, which focuses on materials and components, 2) the meso level, which focuses on buildings, and 3) the macro level, which focuses on cities. Others like Kalmykova et al. (2016), Reike et al. (2018) or Bauwens et al. (2020) use local/regional, national or global as their divisions. We argue, however, that this is not straightforward. The at least implicitly ‘mistake’ in these studies is namely that scale is seen as a given. In contrast scale is not an objective reality, but influenced by many path- and context-dependent processes of structure and agency (Elder-Vass, 2010). Different processes of regulation eventually lead to different regimes of accumulation (Jessop et al., 2008) at which the production, circulation, realization and interpretation of value are regulated (Savini, 2019).
Bringing this back to urban metabolism and circular cities, seeing scale as such, fits well with seeing the city as a social boundary object, and seeing the city as part of a relational socio-ecological system, as argued by Newell and Cousins (2015). In other words, urban metabolism or circular cities are not a given, but part of an ever-changing path- and context-dependent process of structure and agency. This implies that policy measures taken to achieve a circular city policy goal, have effects not only on the policy area related to the policy domain (e.g. a municipality and its administrative area), but it also effects the (im)material relations coming to and from the city in particular (cf. the urban metabolism).
If one is analysing a circular city, it is necessary therefore to take two system boundaries into account: a political one, and a network one. The first one is related to the level the policy goal is spoken out of, and its related administrative area. This can be from an international level (e.g. the European Commission) to a local level (e.g. a municipality). The network one is related to the particular material and/or immaterial flows taken into account. Finding the system boundary of a network is less obvious than the political boundary. A network is namely in most cases limitless. However, a network can be spatially demarcated by taking into account the spatial boundary one focusses one, in this case thus the political one (e.g. a municipality), and the thematic boundary (e.g. organic flows, financial transactions, labour transfers, … ) (see in this respect Menzel and Fornahl, 2009). Although always arbitrary, one will detect that the relevance of the network at some point decreases significantly for the place taken as the starting point, and this then can be seen as the relevant network system boundary. Now, one has two system boundaries that together are the system boundary of the circular city taken into account. The operational problem is, however, that in this globalized world, most materials and immaterials travel around the world. This makes it difficult to demarcate the relevant network system boundary, and as such it is difficult to examine ‘action (cf. measures) and reaction’ when circular city policies are executed. Understanding this is essential, because only as such research can analyse how a measure taken within the political administrative area (cf. a circular city measure), affects the network it is part of, both within the area as beyond. As such, one can see how a policy measure affects other policy areas. The advantage is hereby that one can see if there is a so-called “problem displacement” going on, a concept well-known within political geography, whereby a policy (environmental) measure taken into one place to ‘improve’ a certain situation, worsen the one in another place (cf. Dryzek, 1987; Emel and Peet, 2001 [1989]). In the next section, we explain how we operationalize the “action-reaction” of circular cities.
Methodology
In this section, we first explain the political system boundary taken into account, namely the Dutch city of The Hague. Next we explain why we focus on concrete, among the numerous possible (im)materials relevant within the CE. Then we explain our conceptual framework and how we will calculate the different steps to fill in the framework.
The Hague and Its Circular City Policy
The Hague belongs to the so-called “G5-cities,” or the five biggest cities in Netherlands (Amsterdam, Rotterdam, Utrecht, The Hague and Eindhoven). This group of five is not an institutionalised set of administration, although one arguably can say that these five do have more administrative capacities. To some level, arguably that is one of the reason that all five cities have in one way or another visions and policy developed in line with the ‘newest kid on the block’, the CE. Amsterdam is world-wide known as a frontrunner (Williams, 2021), but also the others have clear policy documents to become a ‘circular city’.
Similar to most circular city policy documents, The Hague focusses on three important material flows in its city (Den Haag, 2018): 1) biomass, or organic waste, 2) construction and demolition waste (CDW), and 3) critical metals. In this paper we focus on CDW. The Hague explains that at the moment 95% of the CDW is already being recycled, but almost exclusively “down-cycled,” in particular for road foundations. Therefore, the policy document states that the built environment has to be circular designed and combined with a “material passport,” explaining what and how much materials are in buildings. The document also states that there is a need for a physical “market place” where materials can be stored and sold. As we will explain further, this can be labelled as a circular material hub, a concept many cities explore (Ramli, 2021). For our paper, interestingly is that the policy document is not appointing the land use functions that re-make, re-fit or re-manufacture the old materials into new circular materials.
Circular Concrete
In Europe, the average composition of CDW consists of 85% stony waste (Gálvez-Martos et al., 2018), in particular concrete. Hence, avoiding the use of virgin concrete can result in significant ecological improvements (Huntzinger and Eatmon, 2009; Nußholz et al., 2019). Generally speaking, there are four possible ways of dealing with stony waste, beyond thus the “traditional” land-fill (Zhang et al., 2018): 1) recycling aggregate for brick manufacturing, 2) on-site breaking for road base filling (a very popular and widely applied process, but which can be labelled as “down-cycling”), 3) recycling aggregate for prefabricated components, and lastly 4) recycling clean aggregate for structure concrete. The latter is the most impactful and can be labelled as “up-cycling” and implies that old concrete can be used as new concrete. In principal, it is possible to recycle 100% of concrete with the existing technologies, of course neglecting market and cost and benefit conditions, and also neglecting the vast amount of (fossil) energy and water needed to support the process. Nevertheless, even taking these into account, the ecological gains of up-cycled circular concrete, thus avoiding the use of virgin materials, remain significant (Zhang et al., 2019).
Without going further into (very technical and socio-ecological) calculations (cf. Meyer, 2009), in this paper we go beyond the “yes, but” discussion and take the proposition that concrete can be 100% circular reused. Following this proposition, one can see the city not as a source of huge CDW, but as a huge potential circular material stock. Taking into account that in the contemporary “urban age” (Brenner and Schmid, 2014) most of the construction is and will happen in urban regions, the potential of re-using concrete from CDW is arguably clear. Of course, much debate is going on if at all we should keep on using concrete in our built environment, mostly accompanied with the call for using timber as a construction material (Kremer and Symmons, 2015). Without neglecting the very needed discussion here, we though question the challenge which then would emerge concerning the huge material stock of concrete in our urban built environment that at that moment is no longer of (re-)use anymore. In other words, since we during the last century have accumulated an enormous amount of concrete, maybe it is not a bad idea to try to keep on using this material stock; even more taking into account that we don’t have yet the material stock of wood available for a (circular) built environment. Hence, on the short term, all this wood will be virgin, and the (circular) benefits will only arrive on the longer term. Thus, in the meantime, we argue that at least try to reuse the concrete there is available, should not be neglected.
But the main reason why we focus on concrete, is because the material can only be transported for a rather short distance. Different than asphalt, bricks, steel, food, clothes, or almost any material or product used in urban environments, concrete is per definition a local product. The reason is that concrete, an artificial stone, is made by adding water to cement and granulate (sand and gravel). At that moment a chemical reaction occurs whereby the spaces between the gravel become filled with sand, “glued” to each other by the cement. When the material then hardens, one has concrete. Since mostly very large quantities of concrete are needed in a short period, the chemical reaction starts at the concrete plant, whereby then the concrete is transported by very heavy concrete trucks (cf. 14 ton), that keep on mixing the concrete until it can be poured and hardened at the definitive location. The time, and therefore distance, between the start of the process (cf. the concrete plant) and the destination is limited, before the concrete becomes too much hardened. The order of magnitude is around 15–20 km (de Kort, 2017).
Conceptually, concrete becomes therefore an interesting analytical subject. As explained in the introduction, a large debate within the CE literature is namely what geographical extent the closed material networks should have (Tapia et al., 2021; Van den Berghe, 2021; Williams, 2021). Some advocate to have a CE as local as possible, but it remains vague “how local” it then should be. Following this ambiguity, circular spatial planning remains arguably absent and fails until now to link it to what circular functions are essential to maintain or create a “as local as possible” circular material flow. This becomes even more a challenge if space is non-abundant, especially in urban regions, where space is scarce. Hence, if for policy makers the location of circular functions is not very clear, and therefore its importance is not clear, the land use function “loses” to other urban land use functions, in particular residential land use functions. In many aspects, this is a rather ‘logical’ explanation of the evolution of cities during last 2 decades or so, whereby increasingly urban areas became mono-functional, with residential and commercial functions, and the ecological impactful and therefore difficult to mix industrial and logistical functions left urban areas to greenfields out of the city (Van den Berghe, 2018; Van den Berghe et al., 2018). Subsequently, goods and products are transported into city centres, illustrated by the vast increase of all different types of (urban) transport modes (Hall and Hesse, 2012).
But for concrete, there is thus a geographical limit. Hence, if a city wants to become circular, whereby waste becomes input, for concrete it will therefore need to host a concrete plant within or nearby (with a maximum of 15–20 km) its contemporary and also future construction and demolition locations, as these two will become connected. Note that of course concrete could also be reused as modules, but we argue that it is an utopia that there will be no need any more of fluid concrete, hence the 15–20 km limit.
The Circular Supply Chain
If waste becomes a commodity or output becomes input, one moves from a linear to a circular material flow. In economic or logistical terms, the supply production or construction chain becomes here a re-supply chain. The difference thus with the linear supply chain is that a same location is at one point the supply of materials, when it is demolished, and at another point is the demand of materials, a circle thus. Sometimes a location is even both at the same time, for example when a building is renovated or adapted. For concrete, this implies that when a building is demolished, old concrete is removed from the supply location, and, before it is brought to the demand location, is collected and stored, which could be the building’ site itself, but mostly is another location. As explained, it is namely an utopia that concrete can one-on-one be reused in a new construction, not only in terms of fitting, but also in time. To solve this, increasingly cities are exploring the potential of a so-called “circular material hub,” where thus materials are stored temporarily and even can be combined with a market function (Ramli, 2021). However, what these hubs do not include, it the possibility to adapt the materials and goods (Williams, 2020). For concrete, this implies a function is needed that broadly is able to fracture the old concrete into small particles, that subsequently can be remade into liquid new concrete. To some extent, these functions are already known, namely the current concrete plant, this with the difference that almost none of those have a fracturing function.
Our conceptual framework presents the circular resupply chain of concrete (Figure 1). It shows three steps: a supply of old concrete (cf. demolition or “harvesting”), a remanufacturing place where the old concrete is made into new concrete, and a demand of circular concrete.
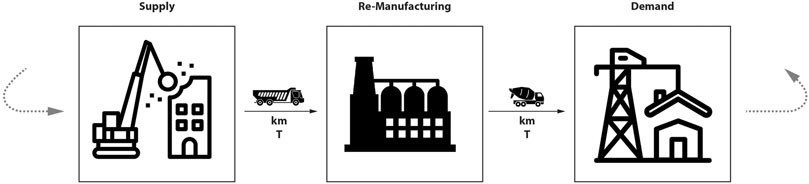
FIGURE 1. The circular resupply chain of concrete.
In the following parts, we explain how we calculate the different steps to visualize and analyse the circular resupply chain of concrete in The Hague.
Supply and Demand
To quantify the metabolic reproductive system of concrete, we calculated the material stock of concrete in the Hague and the in-and outflows generated by this supply from 2020 to 2025. To put the size of the concrete stock within our case study into perspective, we calculated the total material stock of the built environment of the Hague. Together with the construction and demolition agenda of the municipality of the Hague and the available concrete mortar plants, the reproductive capacity of concrete per year was calculated.
Supply: calculation of the material stocks for the case study.
The building material stocks within the case study were calculated based on the methodology by Verhagen et al. (2021). The public spatial dataset of the Netherlands, the BAG3D (2020 version), was combined with the material intensity data of Sprecher et al. (2021) for the municipal boundaries of the Hague. With the use of the BAG3D dataset, it was possible to identify the following residential buildings types: detached houses, row houses, apartments and high rise. For utility buildings, the following building types were identified: offices, commercial buildings and other types. The BAG3D dataset also contains information on the floor area, building type, year of construction and the building height. The material stocks per building were calculated as follows
Where the material intensity (MI) for each material (j) was calculated based on the building type (k) and the year of construction (l). The following building materials were included in the quantification: aluminium, bitumen, brick, cast iron, ceramic, concrete, glass, gypsum, roof gravel, steel, wood, and others. The category “other” contains a multitude of materials which were difficult to identify and quantify separately. The material intensity of the building stock in metric tonnes per m2 of building floor area is shown in section 4.1 of the results to illustrate the division of building materials in the case study.
Supply and Demand Over Time
We used the construction and demolition agenda of the municipality of the Hague to calculate the concrete supply and demand of its built environment over time. The included period for this data is from 2020 to 2025, and the data includes the amount of floor area (m2), and the types of buildings planned to be built. The buildings planned to be demolished were based on the location of the planned construction projects and we identified the corresponding building characteristics from the BAG3D dataset. In total, 1,839,406 m2 of floor area is planned to be constructed, while 2,647,786 m2 of floor area is planned to be demolished in the included timeframe. We calculated the materials in the buildings planned for demolition and construction based on the method explained before.
Though the construction and demolition agenda contained a considerable amount of data, some assumptions had to be made to be able to calculate the in-and outflow of building materials over time. Some buildings have in reality multiple roles, such as a residential and a commercial function. In our analysis we only used the building function with the largest share of floor space. Also, the municipal demolition and construction agenda is more accurate for the earlier years, as not all the future construction and demolition projects were already included for the later period. We use this data in our research to visualize the potential size of material flows, and how the construction and demolition flows compare to each other.
Geography: Origin-destination (O/D) analysis of the concrete spatial remanufacturing capacity
To quantify the impact of the relocation of concrete mortar plants within the Hague, we used an origin-destination analysis (O/D analysis). We used an overview of the concrete production plants in the province of Zuid-Holland (de Kort, 2017), and the location of the demolition and construction projects. This analysis was applied using ArcGis Pro. The Google Maps Street data is used in the O/D tool of ArcGis Pro to calculate the distance travelled by road between the locations. We calculated the travel distance and travel time in the current and future situation with a relocated or removed concrete plant in the case study. We illustrate this analysis in a GIS map with the demolition and construction projects and the corresponding concrete plant used in the scenario.
According to de Kort (2017) in general the distance to concrete plants is ideally 15 km. To calculate the maximum viable range of transporting concrete within our case study, we used the ‘service area’ option within ArcGIS, using the Dutch National Road Transport shapefile (NWB, 2021).
CO2 Footprint of Concrete Transportation
To assess the increase in CO2 emissions of concrete mortar transportation, we used the travel distance calculated from the O/D analyses. We assumed that a concrete truck with a net weight of 14 tonnes can transport 9m3, or 21,6 tonnes of concrete, resulting in a total transport weight of 43 tonnes (Betoncentraal, 2021). Together with the transport distance, back and forth, and the resulting CO2 impact of transporting concrete in kg CO2/ton/km we calculated the overall CO2 impact of the transportation of concrete between the concrete plants. The impact of transporting concrete in (0.154 kg CO2/ton/km) was obtained from a Dutch report made for the Dutch ministry of infrastructure and the environment (CE Delft, 2013).
Results
Material Stocks Within the Municipal Boundaries of the Hague
Of all calculated building materials, concrete is by far the biggest material stock in the case study with 3.4 × 10⁷ metric tonnes (Table 1). All the other materials range from 3.8 × 10⁴ metric tonnes for ceramic roof tiles up to 7.5 × 10⁶ metric tonnes for brick. The results in Figure 2 illustrate the material intensity within the municipality of the Hague, ranging from 0.5 tonnes/m2 to 49 tonnes/m2. Especially in the city centre and the high-rise commercial buildings area a high material intensity can be observed. Taken together, we find a weight of 5.1 × 10⁷ metric tonnes for the built environment of The Hague in 2020.
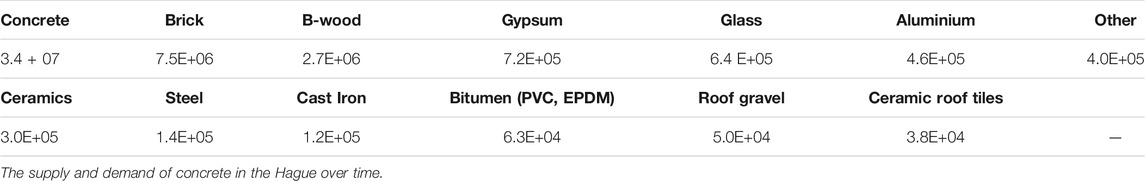
TABLE 1. Materials in the built environment of The Hague (tonnes).
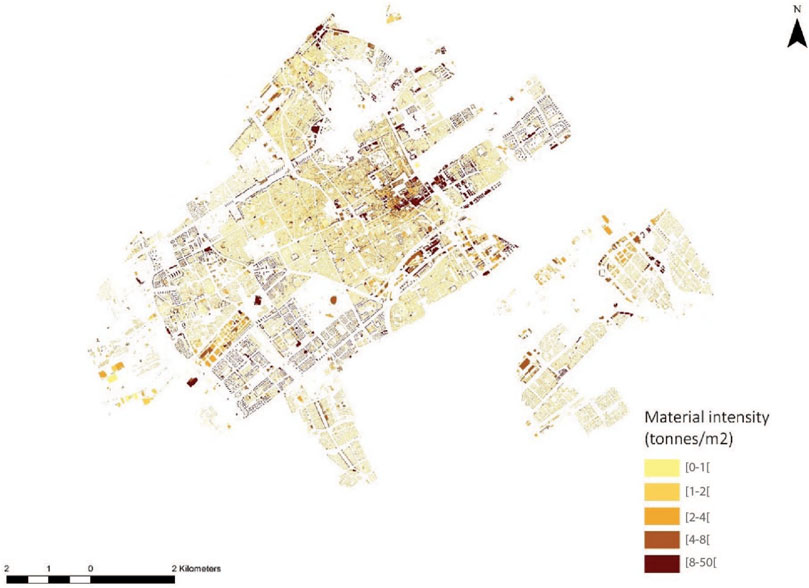
FIGURE 2. The material intensity in the built environment of The Hague (source. Authors).
Overall, the demand and supply of concrete are fairly matched. In our case study (Figure 3), the supply and demand of concrete decreases over time from 891 kilotonnes supply and 765 kilotons demand in 2020, to 12 kilotonnes supply and 48 kilotonnes demand in 2024. The available concrete supply and demand varies per year. In 2020 there is an oversupply of 126 kilotonnes of concrete within the municipality of the Hague, while in 2021 there is a shortage of 134 kilotons. Also, in comparison with the material stock in 2020, the concrete outflow through demolition in 2020 is 2.6% of the stock, while the material inflow through construction is 2.2%.
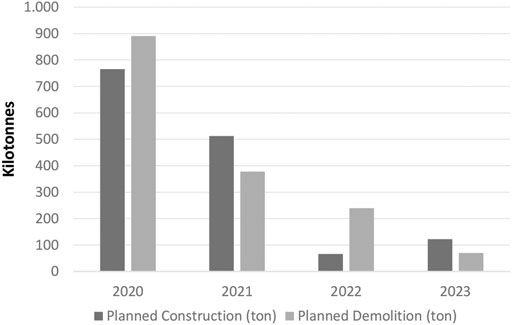
FIGURE 3. Material supply (demolition) and demand (construction) for the period 2020–2025 in The Hague (tonnes).
The overall demand and supply of concrete decreases over time due to the limited agenda and planning of the construction and demolition projects. It does however give an indication of the variation between the demand and supply of the construction sector within our case study. A more balanced supply and demand of concrete often increases the recycling rate of materials.
The spatial distribution of potential circular concrete plants.
We now have estimated the supply and demand of concrete in The Hague. One could thus conclude now that The Hague needs around 750 kilotons of concrete mortar each year to fulfil the demand of the construction sector. Even more important, a comparable amount of concrete will be available from demolition each year.
Within the surroundings of the Hague, four of the 12 nearest concrete plants are reachable within 20 km (Figure 4). Increasing the transportation distance to 30 km, a theoretical upper limit for wet concrete mortar, expands the availability of concrete mortar plants to 10 for the city of the Hague. Though the available capacity of concrete plants can be increased by expanding the transportation distances, this also has impact on the drying of the concrete mortar, pressure on the road network, and the resulting CO2 emissions from transportation.
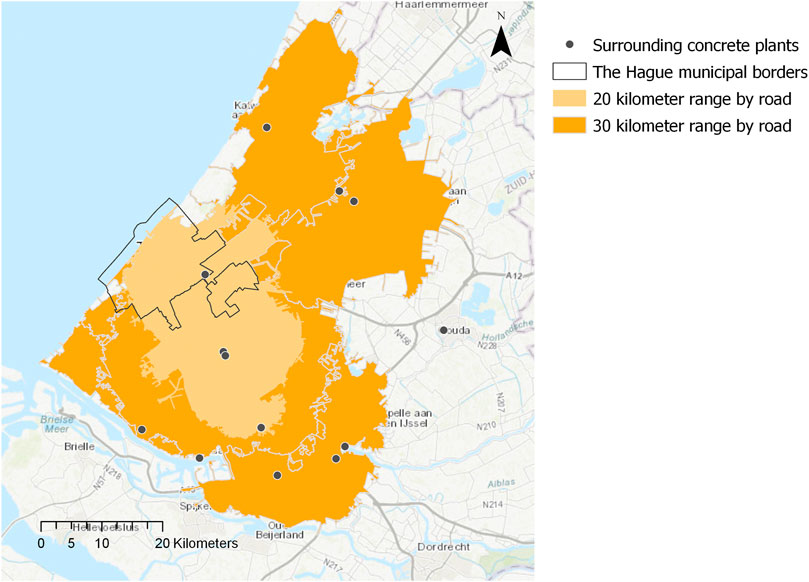
FIGURE 4. Concrete plants in and around The Hague.
O/D analysis and CO2 impact of transportation.
On average, the distance of all the demolition and construction projects in the Hague to the closest concrete plant, located in The Hague, is 7.0 km and 11.8 min, or 6,849 km and 11,612 min in total. As shown in Figure 5, closing this concrete plant will redirect all the concrete flows to the second closest concrete plant in Delft, increasing the average distance to 15.5 km and 18.1 min, or 15,458 km and 17,755 min in total (Table 2). Furthermore, this increase in travel distance produces an additional 4,947 tonnes of CO2 emissions per year (Table 3).
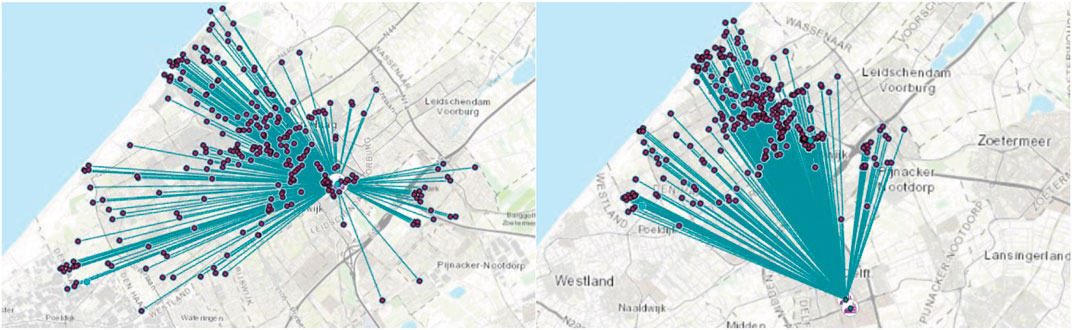
FIGURE 5. O/D analysis for the concrete plant in the Hague (left), and Delft (right).
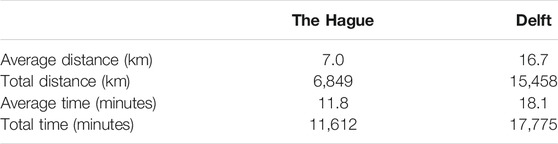
TABLE 2. Distance and time results of the O/D analysis.

TABLE 3. CO2 impact for each concrete plant.
Switching from the concrete plant in the Hague to the one in Delft increases the total distance by 126%, increases the travel time by 53%. This has implications for the concrete drying time the impact of traffic jams and a larger environmental impact from transportation, in particular since concrete trucks are large trucks (43 tonnes), with a significant impact on the already saturated roads.
Discussion and Conclusion
This paper operationalized the concept of urban metabolism to explore the spatial challenges of urban CE policies, also known as circular cities. We developed a conceptual framework that is able to visualise and analyse the different steps of the complete resupply chain of concrete. We applied this conceptual framework on the Dutch city of The Hague. The particular characteristic of concrete is that when the chemical process starts, it can only be transported for a limited time and therefore distance. For Netherlands, the maximum distance is around 15 km, before the concrete becomes too much hardened out and cannot be poured anymore. As such, choosing concrete as material is promising as it can overcome the conceptual challenge of knowing on what scale a material resupply chain should be organized. Thus different than wood, steel, glass, bricks, and so many other materials used in our built environment that can be transported limitless, concrete makes the challenge of a circular built environment and its geographical resupply chain thus clear. Our empirical results show that The Hague can at least in potential (taking into account that concrete could be 100% circular reused) become almost self-sufficient for its future demand of concrete. We showed that this potential is, however, jeopardized because there are plans to close its existing concrete plants in The Hague, paradoxically because of the plans to redevelop the area wherein they are located – The Binckhorst -, as a circular built residential and commercial area. We mapped where then the concrete could come from, and showed that there is only one concrete plant at the moment that can serve within the 15 km range the whole area of The Hague with (circular) concrete, namely the one of Delft. We calculate that, however, only with this arguably small addition in distance, the overall needed driven kilometres and linked CO2 emission are significant. Even if all this transport would be electrified, still the enormous addition of driven square meters to the already saturated road network – especially because we deal here with almost 50 tonnes trucks – is not really desirable in dense urban areas.
We conclude therefore that our focus on circular concrete has discovered an important challenge for circular cities, namely the need of (re)manufacturing functions to match supply and demand of materials. If these are not included, and hence are not present within the respectively administrative area, the city with its circular policy is dependent on other municipalities in their attempt to achieve their policy goal. For concrete, this remains within Netherlands, but for other products, municipalities/regions and even Netherlands (Rijksoverheid, 2016) as a whole are thus dependent on locations around the world, locations that host the functions that enable to match supply and demand of circular products. For concrete, The Hague will thus become dependent on Delft. The paradox is, however, that also in Delft the concrete plant’s location, the Schieoevers, is being questioned and subject of residential and commercial redevelopments (Delft, 2021). Although not yet decided, most likely the concrete plant will be closed in Delft or it will have to move to a more southern location in Delft. In any case, the distance from and to the concrete plant to and from The Hague will most likely increase, maybe even beyond the threshold of 15 km.
Our paper shows thus the importance of linking space and responsibility, or in other words, how ‘circular sherry picking’ can jeopardize a circular city policy goal. We have one clear policy recommendation, namely that it is not enough to pose circular city policies, but also needs a focus on the sometimes difficult choices there have to be made. If not, one could argue that there is (at least implicitly) “circular washing” ongoing. For future research, we would welcome more research that tackles the conceptual difficulty between networks and places, scale and responsibility, or material flows and circular (always normative) economy policies.
Data Availability Statement
The original contributions presented in the study are included in the article, further inquiries can be directed to the corresponding author.
Author Contributions
KV has focussed on the theory and conceptual framework, TV on the methods and results. Both on the discussion and conclusion.
Funding
This article is part of the research project Circular Area Development Binckhorst, funded by the Accelerating the Circular Economy Zuid-Holland (ACCEZ), a collaboration between the Dutch Province Zuid-Holland, employers association VNO-NCW West and the universities of Leiden University, Delft University of Technology, Erasmus University Rotterdam, and Wageningen Research University.
Conflict of Interest
The authors declare that the research was conducted in the absence of any commercial or financial relationships that could be construed as a potential conflict of interest.
Publisher’s Note
All claims expressed in this article are solely those of the authors and do not necessarily represent those of their affiliated organizations, or those of the publisher, the editors and the reviewers. Any product that may be evaluated in this article, or claim that may be made by its manufacturer, is not guaranteed or endorsed by the publisher.
References
Bauwens, T., Hekkert, M., and Kirchherr, J. (2020). Circular futures: What Will They Look Like? Ecol. Econ. 175, 106703. doi:10.1016/j.ecolecon.2020.106703
Betoncentraal (2021). Transport van stortklaar beton [Online]. Available: https://www.betoncentraal.nl/betontransport/([Accessed].
Brenner, N., and Schmid, C. (2014). The ‘Urban Age' in Question. Int. J. Urban Reg. Res. 38 (3), 731–755. doi:10.1111/1468-2427.12115
de Kort, E.-J. (2017). Sectorschets betonindustrie. Stec Groep: Grip op ruimtebehoefte betonbedrijven Zuid-Holland.
Delft, C. E. (2013). Milieu-impact van betongebruik in de Nederlandse bouw (Delft, Netherlands: CE Delft).
Delft, G. (2021). Herontwikkeling Schieoevers [Online]. . Available: https://www.delft.nl/wonen/bouwen/bouwprojecten-de-stad/schieoevers ([Accessed].
Deutz, P., Baxter, H., Gibbs, D., Mayes, W. M., and Gomes, H. I. (2017). Resource recovery and remediation of highly alkaline residues: A political-industrial ecology approach to building a circular economy. Geoforum 85, 336–344. doi:10.1016/j.geoforum.2017.03.021
Elder-Vass, D. (2010). The Causal Power of Social Structures: Emergence, Structure and Agency. Cambridge: Cambridge University Press.
Emel, J., and Peet, R. (2001). “Resource Management and Natural Hazards,” in New models in geography. Editors R. Peet, and N. Thrift (London, United Kingdom: Routledge), 1.
Gálvez-Martos, J.-L., Styles, D., Schoenberger, H., and Zeschmar-Lahl, B. (2018). Construction and demolition waste best management practice in Europe. Resour. Conservation Recycling 136, 166–178. doi:10.1016/j.resconrec.2018.04.016
Haezendonck, E., and Van den Berghe, K. (2020). Patterns of Circular Transition: What Is the Circular Economy Maturity of Belgian Ports? Sustainability 12 (21), 9269. doi:10.3390/su12219269
Hobson, K., and Lynch, N. (2016). Diversifying and de-growing the circular economy: Radical social transformation in a resource-scarce world. Futures 82, 15–25. doi:10.1016/j.futures.2016.05.012
Huntzinger, D. N., and Eatmon, T. D. (2009). A life-cycle assessment of Portland cement manufacturing: comparing the traditional process with alternative technologies. J. Clean. Prod. 17 (7), 668–675. doi:10.1016/j.jclepro.2008.04.007
Jessop, B., Brenner, N., and Jones, M. (2008). Theorizing sociospatial relations. Environ. Plan. D 26 (3), 389–401. doi:10.1068/d9107
Kalmykova, Y., Rosado, L., and Patrício, J. (2016). Resource consumption drivers and pathways to reduction: economy, policy and lifestyle impact on material flows at the national and urban scale. J. Clean. Prod. 132, 70–80. doi:10.1016/j.jclepro.2015.02.027
Köhler, J., Geels, F. W., Kern, F., Markard, J., Onsongo, E., Wieczorek, A., et al. (2019). An agenda for sustainability transitions research: State of the art and future directions. Environ. Innovation Societal Transitions 31, 1–32. doi:10.1016/j.eist.2019.01.004
Korhonen, J., Honkasalo, A., and Seppälä, J. (2018a). Circular Economy: The Concept and its Limitations. Ecol. Econ. 143, 37–46. doi:10.1016/j.ecolecon.2017.06.041
Korhonen, J., Nuur, C., Feldmann, A., and Birkie, S. E. (2018b). Circular economy as an essentially contested concept. J. Clean. Prod. 175, 544–552. doi:10.1016/j.jclepro.2017.12.111
Kremer, P. D., and Symmons, M. A. (2015). Mass timber construction as an alternative to concrete and steel in the Australia building industry: a PESTEL evaluation of the potential. Int. Wood Prod. J. 6 (3), 138–147. doi:10.1179/2042645315Y.0000000010
Loeber, L., and Snoek, S. (2020). Een verkenning naar de potentie van bouwhubs om grondstoffenverbruik te verminderen. Hoofddorp, Netherlands: C-creators.
Luhmann, N. (1982). The World Society as a Social System. Int. J. Gen. Syst. 8 (3), 131–138. doi:10.1080/03081078208547442
Menzel, M.-P., and Fornahl, D. (2009). Cluster life cycles–dimensions and rationales of cluster evolution. Ind. Corporate Change 19, 205–238. doi:10.1093/icc/dtp036
Meyer, C. (2009). The greening of the concrete industry. Cement and Concrete Composites 31 (8), 601–605. doi:10.1016/j.cemconcomp.2008.12.010
Newell, J. P., and Cousins, J. J. (2015). The boundaries of urban metabolism. Prog. Hum. Geogr. 39 (6), 702–728. doi:10.1177/0309132514558442
Nußholz, J. L. K., Nygaard Rasmussen, F., and Milios, L. (2019). Circular building materials: Carbon saving potential and the role of business model innovation and public policy. Resour. Conservation Recycling 141, 308–316. doi:10.1016/j.resconrec.2018.10.036
Paiho, S., Mäki, E., Wessberg, N., Paavola, M., Tuominen, P., Antikainen, M., et al. (2020). Towards circular cities-Conceptualizing core aspects. Sust. Cities Soc. 59, 102143. doi:10.1016/j.scs.2020.102143
Pomponi, F., and Moncaster, A. (2017). Circular economy for the built environment: A research framework. J. Clean. Prod. 143, 710–718. doi:10.1016/j.jclepro.2016.12.055
Ramli, R. (2021). The Role of Circular Building Material Hubs in the Built Environment. A circular transition in the Hague. Leiden: Leiden University.
Reike, D., Vermeulen, W. J. V., and Witjes, S. (2018). The circular economy: New or Refurbished as CE 3.0? - Exploring Controversies in the Conceptualization of the Circular Economy through a Focus on History and Resource Value Retention Options. Resour. Conservation Recycling 135, 246–264. doi:10.1016/j.resconrec.2017.08.027
Rijksoverheid, N. (2016). Nederland circulair in 2050. Den Haag, Netherlands: Nederlandse Rijksoverheid.
Russell, M., Gianoli, A., and Grafakos, S. (2019). Getting the ball rolling: an exploration of the drivers and barriers towards the implementation of bottom-up circular economy initiatives in Amsterdam and Rotterdam. J. Environ. Plann. Manag. 63, 1903–1926. doi:10.1080/09640568.2019.1690435
Salomone, R., Cecchin, A., Deutz, P., Raggi, A., and Cutaia, L. (2020). Industrial Symbiosis for the Circular Economy. Operational Experiences, Best Practices and Obstacles to a Collaborative Business Approach. Berlin: Springer.
Savini, F. (2019). The economy that runs on waste: accumulation in the circular city. J. Environ. Pol. Plann. 21 (6), 675–691. doi:10.1080/1523908X.2019.1670048
Sprecher, B., Verhagen, T. J., Sauer, M. L., Baars, M., Heintz, J., and Fishman, T. (2021). Material intensity database for the Dutch building stock: Towards Big Data in material stock analysis. J. Ind. Ecol., n/a(n/a. doi:10.1111/jiec.13143
Tapia, C., Bianchi, M., Pallaske, G., and Bassi, A. M. (2021). Towards a territorial definition of a circular economy: exploring the role of territorial factors in closed-loop systems. Eur. Plann. Stud., 1–20. doi:10.1080/09654313.2020.1867511
Van den Berghe, K. (2018). Planning the Port City. A Contribution to and Application of the Relational Approach, Based on Five Case Studies in Amsterdam (The Netherlands) and Ghent (Belgium). PhD. Ghent: Ghent University.
Van den Berghe, K., Bucci Ancapi, F., and van Bueren, E. (2020). When a Fire Starts to Burn. The Relation between an (Inter)nationally Oriented Incinerator Capacity and the Port Citie's Local Circular Ambitions. Sustainability 12 (12), 4889. doi:10.3390/su12124889
Van den Berghe, K., and Daamen, T. (2020). “From Planning the Port/City to Planning the Port-City: Exploring the Economic Interface in European Port Cities,” in European Port Cities in Transition. Moving Towards More Sustainable Sea Transport Hubs. Editors A. Carpenter, and R. Lozano (Berlin: Springer). doi:10.1007/978-3-030-36464-9_6
Van den Berghe, K., Jacobs, W., and Boelens, L. (2018). The relational geometry of the port-city interface: Case studies of Amsterdam, the Netherlands, and Ghent, Belgium. J. Transport Geogr. 70 (C), 55–63. doi:10.1016/j.jtrangeo.2018.05.013
Van den Berghe, K., and Vos, M. (2019). Circular Area Design or Circular Area Functioning? A Discourse-Institutional Analysis of Circular Area Developments in Amsterdam and Utrecht, The Netherlands. Sustainability 11 (18), 4875. doi:10.3390/su11184875
Verhagen, T. J., Sauer, M. L., van der Voet, E., and Sprecher, B. (2021). Matching Demolition and Construction Material Flows, an Urban Mining Case Study. Sustainability 13 (2), 653. doi:10.3390/su13020653
Wachsmuth, D. (2012). Three Ecologies: Urban Metabolism and the Society-Nature Opposition. Sociological Q. 53 (4), 506–523. doi:10.1111/j.1533-8525.2012.01247.x
Williams, J. (2021). Circular cities : a revolution in urban sustainability. Abingdon, Oxon: Routledge.
Williams, J. (2020). The role of spatial planning in transitioning to circular urban development. Urban Geogr. 41 (6), 915–919. doi:10.1080/02723638.2020.1796042
Wolman, A. (1965). The Metabolism of Cities. Sci. Am. 213 (3), 178–190. doi:10.1038/scientificamerican0965-178
Zhang, C., Hu, M., Dong, L., Gebremariam, A., Miranda-Xicotencatl, B., Di Maio, F., et al. (2019). Eco-efficiency assessment of technological innovations in high-grade concrete recycling. Resour. Conservation Recycling 149, 649–663. doi:10.1016/j.resconrec.2019.06.023
Keywords: concrete, urban metabolism, (re)supply chain, circular city, circular washing
Citation: Van den Berghe KB and Verhagen TJ (2021) Making it Concrete: Analysing the Role of Concrete Plants’ Locations for Circular City Policy Goals. Front. Built Environ. 7:748842. doi: 10.3389/fbuil.2021.748842
Received: 28 July 2021; Accepted: 04 October 2021;
Published: 22 October 2021.
Edited by:
Satu Paiho, VTT Technical Research Centre of Finland Ltd., FinlandCopyright © 2021 Van den Berghe and Verhagen. This is an open-access article distributed under the terms of the Creative Commons Attribution License (CC BY). The use, distribution or reproduction in other forums is permitted, provided the original author(s) and the copyright owner(s) are credited and that the original publication in this journal is cited, in accordance with accepted academic practice. No use, distribution or reproduction is permitted which does not comply with these terms.
*Correspondence: Karel B.J. Van den Berghe, Sy5CLkouVmFuZGVuQmVyZ2hlQFRVRGVsZnQubmw=