 Sakdirat Kaewunruen
 Chayut Ngamkhanong
 Lichen Ren3
- 1Department of Civil Engineering, School of Engineering, University of Birmingham, Edgbaston, United Kingdom
- 2Department of Civil Engineering, Faculty of Engineering, Chulalongkorn University, Bangkok, Thailand
- 3Department of Civil Engineering, School of Civil and Environmental Engineering, Harbin Institute of Technology, Shenzhen, China
This paper aims to quantify and assess the reliability of mast structures as a part of ensuring structure safety. The mast structure is a basic aspect of the overhead line electrification equipment (OHLE) used in railway systems. This structure is very important as the failure of structure leads to the failure of an electric system that supplies the power to the train. To ensure structural safety and reliability, this paper thus analyses the reliability index of the mast, stay tube, and bracket tube structures. According to Eurocode, buckling resistance under compression of these parts were calculated based on specific material properties, and the load condition of these structures is based on Australian Railcorp document TMC331. In this paper, the strength load combination with the wind loading on the wire at 45° on the track is considered in particular as being the worst load combination for structures to bear, and the random variables used to affect reliability probabilistic analysis. Various parameters including self-weight, wind load, dimension parameters, materials, geometrical properties are taken into consideration. Statistical models of these parameters are taken from previous studies. The reliability index value was calculated via quantification of structure reliability using the first-order reliability method (FORM). Finally, a sensitivity analysis is used to evaluate the impacts of yield strength, length, cross-section, density, and load combination on reliability. The obtained results show that increasing length of structure can potentially reduce the reliability of mast structure to buckling resistance while the density of material also plays a major role in the reliability index. The findings will provide the structural safety criteria of the railway mast structure and improve the standard design to mitigate the risks and unplanned maintenance due to the uncertainties.
Introduction
An efficient railway system is a significant part of the robust national infrastructure of a country. Passenger traffic has increased by nearly 100% and freight by 60% over the past 15 years (Baxter, 2015). The overhead line electrification equipment (OHLE) is currently the preferred train power supplement worldwide, based on benefits in terms of operation, environment, passenger service, and comfort. The mast structure is the trackside column supporting an OHLE (Figure 1), which is made of steel. It should be noted that mast structure is a very sensitive structure to vibration (Beagles et al., 2016; Ngamkhanong et al., 2017) and environmental effects such as ground borne vibration (Ngamkhanong et al., 2018a; Ngamkhanong and Kaewunruen, 2018), wind (Network Rail, 2017; Ngamkhanong et al., 2018b), earthquake (Ngamkhanong et al., 2018a; Ngamkhanong et al., 2018c) etc., leading to the failure of OHLE due to the loss of contact wire (Shing and Wong, 2008; Robinson and Bryan, 2009; Taylor, 2013). Support condition of mast structure is a significant effect on the behaviour of mast structure (Ngamkhanong et al., 2017; Ngamkhanong et al., 2018b; Ngamkhanong and Kaewunruen, 2018). The transportation capability will be seriously affected if a mast structure is failed or not properly operated. Also, due to the increase in traffic and load demands, it is important to ensure the reliability and structural safety of the mast structure.
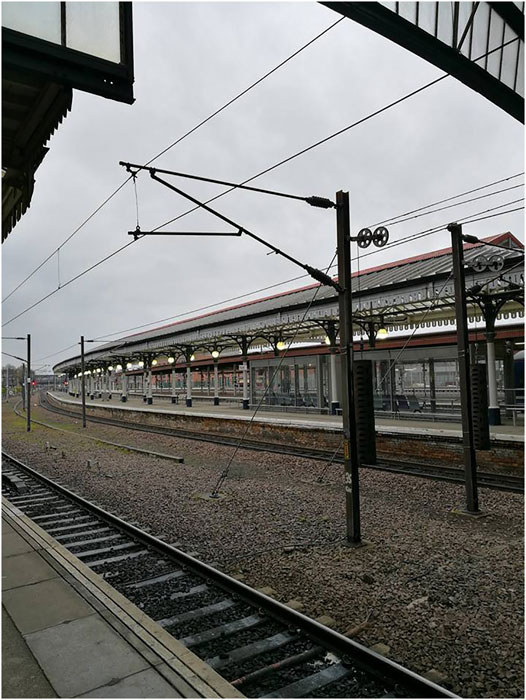
FIGURE 1. Single mast structure.
Due to the failure probability of mast structure leading to the failure of an electrical system, reliability analysis is a useful method to determine the structural ability to withstand the load actions under different conditions and uncertainties. Analysing reliability can help ensure the indicative values of design working life, reducing unnecessary and unplanned maintenance within the service life. Based on critical literature, the most practical method to analyse reliability is the limit state method. Probabilistic methods are frequently used when a few methods of reliability analysis exist (Omishore and Kala, 2009). But reliability analysis can be applied not only at the stage of structure design but also on assessing existing structures (Leonardo da Vinci Pilot Project, 2005). Research into the reliability of every kind of structure exists, and many studies state reliability as a reflection of the relationship between load actions and resistance. Five essential components for determining loading and resistance criteria were summarised as follows (Ellingwood and Galambos, 1982):
• Identify sufficient statistical data to describe the load and resistance variables
• Build procedures about calculating the reliability of structural members
• Establish design reliability indices for every member based on existing criteria
• Develop an equation that can balance theory and professional practice
• Develop criteria that let resistance and load correspond that come as close as possible to the target value chosen previously
Recently, the reliability analysis for steel structures has been studied. For instance, the reliability index of I section steel column was examined. Beck and Dória (2008) offered a reliability index of 2.5, corresponding to a nominal failure probability according to Eurocode. They also highlighted that whether this was a sufficient factor depending on the specifics of the occasion. Determining properties of compressive resistance of steel columns includes cross-section geometry; slenderness ratio; elasticity modulus; yield strength; residual stresses; and geometric imperfections. Other references for corroded steel bridges’ reliability (Galambos and Ravindra, 1978; Kayser and Nowak, 1989; BS 5950-3, 1990; Haiderali, 2020) listed the additional parameters associated with modes of resistance: for corroded steel under bending, these were compression yield strength, elastic modulus, reinforcement strength, and web and flange thickness. Clearly, the reliabilities of structures are influenced by many structural properties depending on the specific location and circumstances; therefore, it is important to find the basic variables underlying the process. Although all selected references considered some variables in their research, all the researchers noted that considering more variables and uncertainties would make their results more accurate. Moreover, time can be a variable to analyse the reliability of structures considering time-dependent properties. Time invariant analysis and time variant analysis with a 1-year period were used to compare the reliability index between time invariant and time variant models of steel frame (Sýkora, 2002). The effect of time-dependent deterioration was considered to analyse the reliability index of railway portal overhead structure (Hu and Chan, 2019). The study focused on the reduction of reliability index over time due to section loss. Time may indeed be a critical variable, and many standards involve timed limits. Note that most of the references noted above investigated the single variable influencing the whole structure; thus, they controlled single variables in their calculations. However, sought the difference in the evaluation of the reliability index sensitivity on random variables for each part (Radoń, 2011), thus developing three cases: Case 1 had a random variable in the load while the stiffness and coordinates were deterministic; Case 2 had random variables in the load and stiffness, with the coordinates remaining deterministic; and Case 3 had random variables in all three parts. The paper concluded that the whole structure was most at risk when load, resistance, and coordinates were all random variables. that the reliability of a structure was generally determined by the random variability of every component within the load, capacity, and system (Kubicka and Radon, 2015). Whatever the variables they chose; most references conclude that reliability analysis is a very complicated task and mostly based on the theoretical method. Based on known probability distributions, structure analysis can be used to observe the behaviours of a component, meanwhile, and where more data on variables are available, the results become closer to an accurate evaluation (Radoń, 2011).
The reliability analysis of railway mast structure considering the variations of sectional and material properties has not been fully investigated. It is important to note that the uncertainties in either load actions or resistance may significantly reduce the reliability index. The uncertainties related to structural geometries and material properties are taken into consideration in this study. This paper analyses the reliability of a specific structure, based on the definition in ISO standard (ISO, 2012; ISO, 2015), which is the ability of a structure or structural member to fulfil the specified requirements, during the working life for which it has been designed. The reliability index of a mast structure and its failure probability are developed to check the reliability of railway electricity supply structures. Calculating a reliability index involves applying the probabilistic theory of variables to resistance and load. The resistance and load effects of a structure determine the structure’s reliability, while they are influenced by many parameters such as density, elastic modulus, and cross-section. Based on recommended minimum values for reliability index under the ultimate limit states in EN 1990 (The European Union, 2002), the design process can be checked by using a reliability index; such a reliability index can also be used to assess existing structures. This paper not only aims to calculate a reliability index value based on multiple variables but also to study the sensitivity of the parameters on the whole structure’s reliability. Although the reliability analysis method has been adopted in analysing many kinds of structures such as steel truss and steel frame, it is new to analyse railway mast structure reliability. The findings of this study will quantify risks and therefore improve the reliability and inspection regime of mast structure while taking into account the degree of uncertainty of manufacturing process and construction and material properties.
Cantilever Mast Structure
Nowadays, trains are powered by electricity through the third rail or overhead wire. Overhead line equipment (also called “OHLE”), which is support by a cantilever mast structure or portal frame, is an equipment to supply power to make electric trains run faster and quicker. Cantilever mast structure is used for single or two tracks while the portal frame supports the OHLE for more than two tracks. It is known that a cantilever mast is a single slender column that is sensitive to vibrations (Kaewunruen and Remennikov, 2009; Dindar et al., 2018; Ngamkhanong et al., 2017; Ngamkhanong et al., 2019).
Based on different engineering requirements and geological conditions, several basic types of overhead wiring structures are used (RailCorp, 2011): these include single masts; cantilever masts; portal structures; anchor structures (guyed); anchor structures (free standing); and walkway structures (signal or feeder). This study focuses on the analysis of cantilever mast structures, in particular the support structures of this type used for OHLE, as shown in Figure 2. The sections, that will be analysed, are mast, stay tube and bracket tube as they carried the weight and wind load in a cantilever mast system. The stay tube and bracket tube are usually made of aluminium, and the diameter of the bracket tube is always greater than that of the stay tube due to their respective functions. The bracket tube is the structure-supporting catenary, while the stay tube insulates the structure from the mast using a stay arm insulator and adjusts the bracket tube position (Jain, 2014).
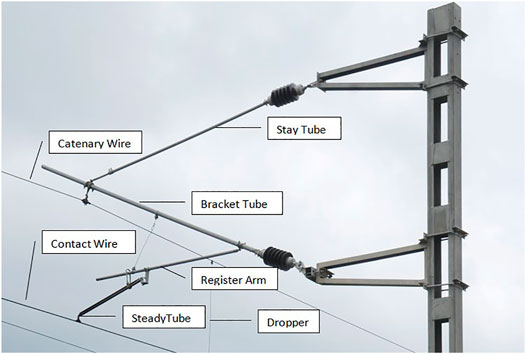
FIGURE 2. OHLE support components (Jain, 2014).
Methodology
In this section, the reliability concept is first introduced. This concept can help the engineer to quantify and assess the structural risks to guarantee structural safety. This paper uses the first-order reliability method (FORM) to quantify the reliability index. This method has been widely used for estimating structural reliability. The following sections present the calculation methodologies for load action and structural buckling resistance, respectively. This study considers the compression resistance of each component of a single mast structure for railway system. Three main components: mast, stay tube, and bracket tube are considered. The reliability of mast structures is analysed by the relationship between reliability index and failure probability of the load action and resistance of the mast structure. Therefore, it determined the probability of mast structure failure based on random variables under different uncertainties is determined. As the load, material and geometry are subjected to uncertainties, the parameters related to both load action and structural resistance including yield strength, cross section modulus, length, load factor, and density are taken into consideration.
Reliability Concept
Structural performance is determined by load and resistance parameters (Ghasemi, 2015). The theory of structural reliability requires that the relationship between the load actions (E) and structural resistance (R) to guarantee the safety of a structure. This limit state is defined as Z, being calculated as R minus E. Thus, the limit state function Z(X) is a safe state of a structure when it is positive, that is, when Z(X) > 0 where X is the random variables. The structure state is unlikely safe when this state function Z(X) is negative, which is Z(X) < 0. It is thus obvious that Z(X) = 0 is a critical point, and acts as the basic limitation of quantification of reliability. As for the limit state form, the load action and resistance are normally derived from the probabilistic models based on statistical distributions. The relationship can be represented by distribution curves as seen in Figure 3, which mainly describes the distributions of load action and capacity (resistance). It should be noted that the overlap area can be called the interference region. This region indicates the probability of failure in which the load action distribution exceeds the structural capacity. The structure is reliable when the interference region is small. Thus, it is important to move these distribution curves away from each other to reduce the probability of failure or increase the reliability index. Thus, this figure suggests that two methods to improve the reliability index are to increase the resistance or reduce load action.
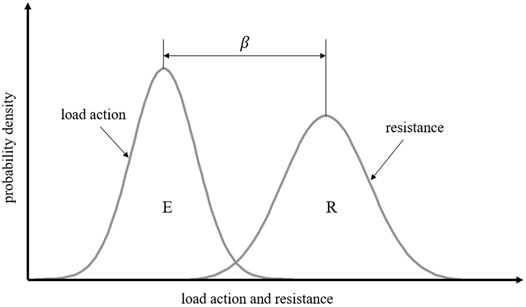
FIGURE 3. Relationship between reliability index and probability density functions.
The reliability index β and probability density functions are shown in Figure 3. It should be noted that the reliability index is directly related to the failure probability. The reliability index can be calculated by various methods. This paper utilises the first-order reliability method (FORM) by taking advantages of the desirable properties of the standard normal probability distribution to approximate the limit state function and calculate the reliability index based on mean and standard deviation of the variables, where the failure probability of a structure is defined as
Where ϕ is the standard normal distribution function. Thus, the reliability index, β, is inversely proportional to the probability of failure,

TABLE 1. Relationship between failure probability and reliability index (Leonardo da Vinci Pilot Project, 2005).
On the other hand, the probability of failure can be written as Eqs 2–4.
Hence, the reliability index can be calculated based on the function of the mean value of Z to its standard deviation as presented in Eq. 5.
Although the actual calculation of these two parameters appears complex, it is obvious that a larger value of β makes a structure safer. Thus, the calculation of β is a process of quantification of reliability. Hasofer and Lind (1974) developed an algorithm variant for the formulation of the limit state function, and the steps to calculate reliability were proposed from this:
1) Determine the limit state function.
2) Determine the statistical basic variables and get some data about them such as mean value, standard deviation, distribution function, and correlation matrix.
3) Transform the set of basic random variables into a set of independent variables.
4) Standardize the set of basic variables with the transformation X→U, which just like:
5) Find the length of the minimum distance vector from the new origin point to the limit state surface.
6) Obtain the design point and the sensitivity coefficients.
This paper aims to assess mast structure reliability based on mast structure model in the literature review, much like the practical structure. As practical masts have different specifications and material types, this paper model is assumed according to Pfisterer (2016). Mean value and standard deviation of resistance and load actions, which are presented in the next section, are required to develop the resistance and load action curve of the model. These values can be calculated based on some variable parameters’ mean values and standard deviations.
Load Actions on Mast Structure
To verify the reliability, the design situation and relevant limit states should be identified. It is important to ensure structural safety and integrity of the operational railway imposed to any additional loads. Each overhead wiring structure should meet the limit state requirement including strength, stability and serviceability. This paper uses STRAND7 software to generate load combinations acting on a mast structure to quanlity the compression force on each component. It is noted that the FE model has been validated previously and is considered in this study. The design value of various loads can be determined by applying the standard: design of overhead wiring structures. However, calculating load effects requires the use of partial factors. Normally, Eurocode 3 (The European Union, 2002) offers partial factors for permanent and variable actions. But taking into account the special nature of the mast structure compared with other structures, this paper chose partial factors for load combinations from RailCorp (2011) since it provides a more crucial effect on mast structure than Eurocode 3. The primary load cases that have been selected for design are based on combining comparable actions such as permanent effects, transient effects, and wind loading together, allowing for the application of appropriate load factors to each while still producing enough flexibility in load cases to produce combinations that will produce the desired strength and serviceability results. The primary load cases are weight load (LC1), live load (LC2), radial load (LC3), wind wire X (LC4), wind structure X (LC5), wind structure 45 (LC6) and wind structure Z (LC7). Theses primary load cases are combined to determine limit state design loading. For overhead wiring structures, three kinds of combination limit state load cases (LC) are considered: strength load cases, serviceability load cases and, stability load cases. Due to the special functions and components involved, the major loads acting on mast structures are weight load and wind load. After calculation and comparison, the strength load cases from RailCorp (2011) is the most critical. Thus, it is used to calculate the worst influence of combination load for the structure considering Eqs 7–10:
WL = weight load, which includes every part of this system
RL = radial load and anchor load
WWX = wind wire X, which is the wind loading on the wire at 90° on the track
WW45 = wind wire 45, which is the wind loading on the wire at 45° on the track
WSX = wind structure X, which is the wind loading on the structure at 90° to the
WS45 = wind structure 45, which is the wind loading on the structure at 45° to the track
RailCorp (2011) provides a set of uniformly distributed loads on the members to represent wind pressure based on the structural type and section and wind direction. In the case of WW45, the loads are distributed equally on mast structure in longitudinal and transverse direction of the track. Meanwhile, WWX is the wind loading acting on mast structure in transverse direction of the track. It should be noted that LC11 is noted as a worst scenario for load action. As for the strength combination, LC11 can be written as 1.2LC1 + 1.2LC3 + 0.5LC4+ LC6 Where LC1 is the weight load case, LC3 is the radial load and anchor load case. LC4 is the wind wire 45 load case. LC6 is the wind structure 45 load case. Weight load includes self-weight of structural components, overhead wire, and electrical fitting. It is noted that the spacing between the mast structure of 50 m is assumed in this study. The overhead wiring with 150 mm2 nominal cross-section and self-weight of 1.42 kg/m is transferred to the registration contact point on mast structure (Elcowire, 2017). Moreover, the weight of electrical fitting is 1.2kN applied to the drop vertically and then transferred to the mast structure. As for wind load, the wind pressure on the structure is determined using the average recurrence interval of 25 years according to Joint Standards Australia/Standards New Zealand Committee (2011). The wind span, which is the spacing between mast structure, of 50 m is assumed in this study. The wind pressure of 0.36 kN/m is uniformly distributed on the mast at 45° to the track.
Buckling Resistance of Members Under Compression
In terms of civil engineering, different structure failures display different kinds of failure patterns. For mast structures, one of the most common failure patterns is buckling. According to Eurocode 3 (The European Union, 2005), the buckling resistance of a column in compression can be calculated. This paper focuses only on the associated axial force so that only the axial force and capacity of each component are calculated. However, it should be noted shear stress and bending moment also have significant influences on mast structure failure. Therefore, future research will focus on shear stress and bending moment. For this paper, buckling resistance under axial compression can be calculated according to Eurocode 3 (The European Union, 2005):
α = imperfection factor (depend on the buckling curves in (The European Union, 2005)
The imperfection factor α is determined by the steel cross-section shape, which is different in the mast, stay tube, and bracket tube. It is also determined by its limits, axis, and steel type. These parameters determine the buckling curve of a specific steel column, and thus, for every type of buckling curve, there is an associated value of imperfection factor, as seen in Table 2.
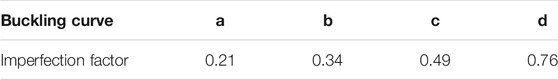
TABLE 2. Recommended values for imperfection for buckling curves (The European Union, 2005).
To obtain the structural resistance, this paper uses specific size and materials for mast, stay tube, and bracket tube that have been generally used for mast structure. The structure materials and other properties were adopted (PPS International, 2018; Government of South Australia, 2013). Stay tube and bracket tube are made of special aluminium alloy with A2/A4 grade stainless steel hardware while the mast column is made of steel with a yield strength of 320 MPa. For the model’s size, the standard of minimum length was given Gwalior (2013). So, the length of each part is chosen according to circumstances in the United Kingdom. Dimensions of each component are presented in Table 3. As for the statistical parameters, Joint Committee on Structural Safety (JCSS, 2000) is a committee in the field of structural related risk and reliability that publishes statistical properties of related parameters, as shown in Table 4 and used in the current work. The mean values of material properties are the typical values that have been widely used for steel and aluminium alloy. Mean values and coefficient of variation are given in Table 4. These values are used to quantify the reliability index following the methodology in Section 3.1 by evaluating the mean value of limit state function divided by the standard deviation of limit state function.
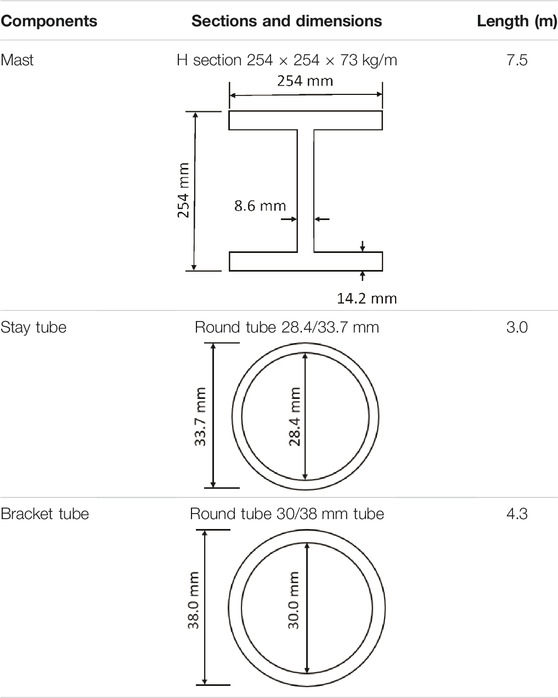
TABLE 3. Sections of each component.
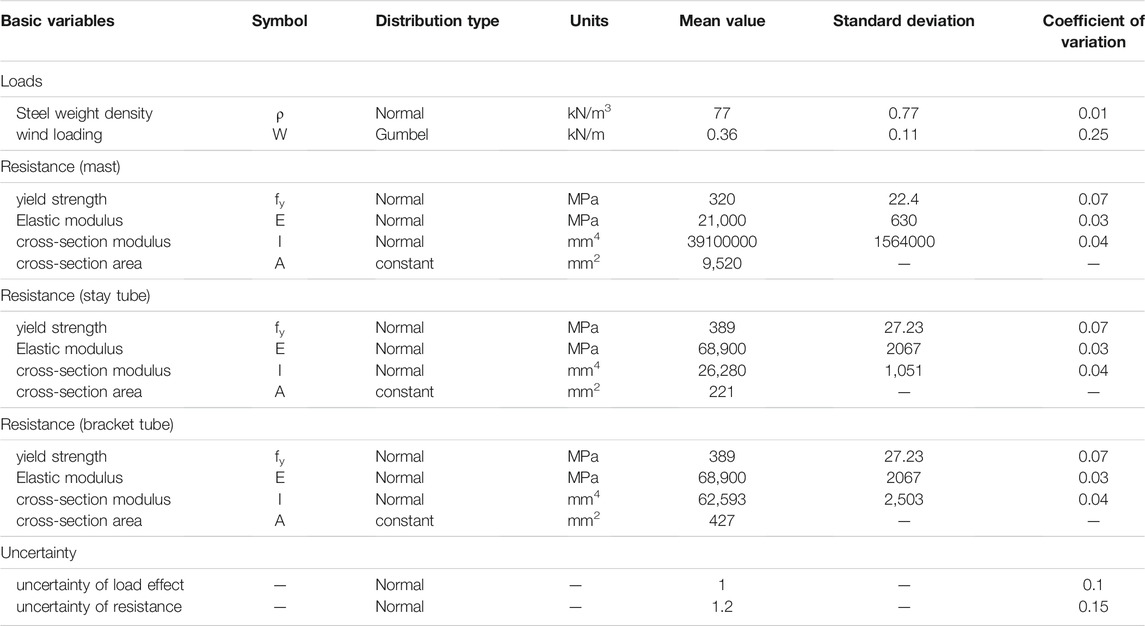
TABLE 4. Statistical model of the selected mast structure (JCSS, 2000).
It should be noted that the resistance values based on Eurocode three demonstrate discrepancies compared with practical data; however, they are usable in theoretical methods to obtain a value for resistance. It is noted that load case LC11, the most critical load action, is chosen to be considered for reliability index quantification while the resistance model is based on Eurocode three shown in Eq. (11) taking into account the mean and standard deviation values of each material property and component. Thus, the limit state equation based on variations of load and resistance parameters is shown. Reliability analysis is conducted in accordance with FORM.
where
The following conditions present the states of structural components:
• Failure state:
• Safe state:
• Limit state:
Reliability Analysis Results and Discussions
This paper adopts the well-known first order reliability method (FORM), which has been widely used, to calculate the reliability index. The FORM approach approximates the limit state function with a linear assumption and will therefore provide the same assessment of the probability of failure. This approximation slightly introduces errors in the assessment of the probability of failure. However, this method is a convenient theoretical way to study the sensitivity of the parameters and obtain the reliability index (Manoj, 2016). As noted in the previous section, the target reliability index is required and this target reliability index depends on the specifics of a structure, including the structure design service life and its degree of importance. According to JCSS (2000), as for mast structure, the minor consequences class of failure can be selected as the target reliability index design for the ultimate limit state of structural systems. It is classified by the relative cost of safety measure. The target reliability indices are set as 3.1, 3.7 and 4.2 for the large, normal, and small relative cost of safety measure.
Generally, for a connected structure, the minimum value of the reliability index is used to evaluate the whole structure. As seen in Table 5, the minimum value 1.90 corresponds to a failure probability of 6 × 10⁻² (After interpolating the values from Table 1). For structures without long lifespans that are easy to maintain, this is not particularly dangerous.
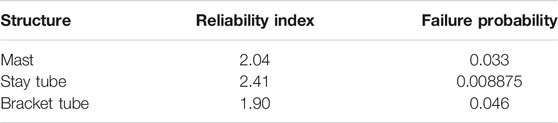
TABLE 5. Reliability index of every part.
With regard to sensitivity analysis, some parameters and properties such as density, whose standard deviation is not so big in practice, fluctuate by up to 10% under research conditions, while some parameters, such as yield strength, change significantly for different kinds of materials, possibly even more than 10%. Even though, in fact, the variations of the section and material properties are not as big as 10% since the manufacturer carefully control the standard, the section and strength of materials could be affected and deteriorated by environmental effects and design problem. The reliability index obtained from different parameters is then compared with the target reliability index.
As noted in the methodology section, yield strength is relative to resistance, and thus also has a relationship with the reliability index. In practice, steel and aluminium have different kinds of yield strength to choose. Figure 4 shows the effect of yield strength variation on the reliability index of every part, and this data can be used to offer proposals about material usage in different situations for the mast structure. The reliability index will increase as the yield strength increases, and the mast, stay tube, and bracket tube show similar trends as the yield strength changes. Although it is not obvious, the trending lines suggest that as the yield strength becomes higher, the influence of yield strength becomes lower. These trending lines resemble a logarithmic function line, suggesting that higher yield strength can slightly improve structure reliability as a higher yield strength will offer the structure higher resistance, making it more reliable.
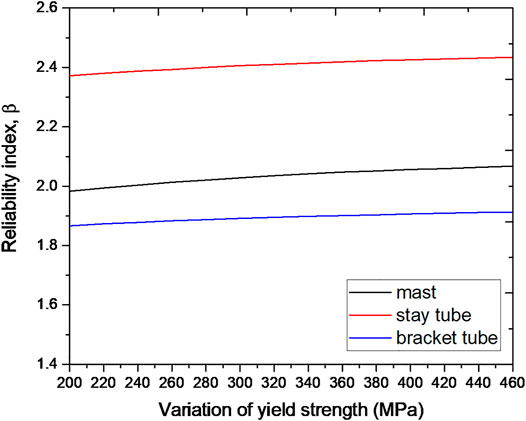
FIGURE 4. Effect of yield strength variation on reliability index.
As well as yield strength, cross-section modulus could be an influential parameter for structure resistance. Figure 5 shows the results of the reliability index when changing cross-section modulus. When cross-section modulus value fluctuating by around 10 percent the lines show the influence of cross-section modulus on reliability. Cross-section modulus variation does not influence the reliability index much from these lines trending. However, as the actual cross-section variation of a specific area is small, and thus the standard deviation of cross-section modulus does not matter in terms of reliability. The mast, stay tube, and bracket tube reliability indices show similar trends as the cross-section modulus changes. Thus, although its influence is not large, increasing cross-section modulus can slightly increase structure reliability.
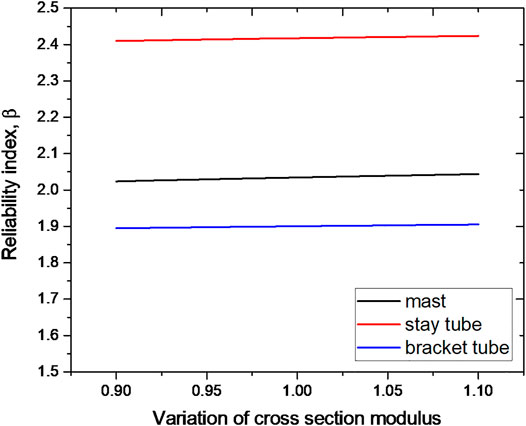
FIGURE 5. Effect of cross section modulus variation on reliability index.
As seen in Figure 6, the reliability index is influenced by structure length significantly, with a trend line resembling an exponential function line. The longer the structure, the lower the reliability index, as the structure is at risk of buckling with specific loading. For the mast, because its length is 7.5 m, 10% of length is 75 cm, creating a large error in mean value. This situation rarely appears. For stay tube, which is always 3 m or less, 10% is 30 cm or less, and such a variation will have a severe influence; this situation is more likely to appear in practice. Longer columns have a negative impact on structure reliability. Since OHLE special functions, mast structure has a minimum length in practice. Nonetheless, the result can suggest designers how to choose the proper length for mast structure.
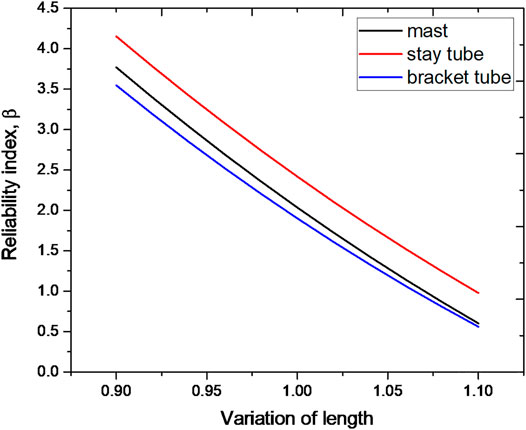
FIGURE 6. Effect of length on reliability index.
Figure 7 represents the load factor’s effects on the reliability index. It should be noted that the load factor presented is the factor that multiplies the strength load case LC11 so that each load factor for each load is larger. For the mast and stay tube, when the load factor is 1.3, the reliability index reaches zero, which means that loading of anything over 1.3 times the present load may make this structure dangerous. For the bracket tube, this value is 1.4. Compared with the stay tube, the bracket tube can thus bear a little more stress. For these three parts, changing load combinations has more influence than some variables of resistance. As the load grows, the structure thus becomes weaker. For a practical situation, it is more important to analyse the components of the strength limit state load combination, which is mainly self-weight and wind influence for a mast structure. Even in some extreme climate, the load combination could change a lot. The designers should take them into consideration.
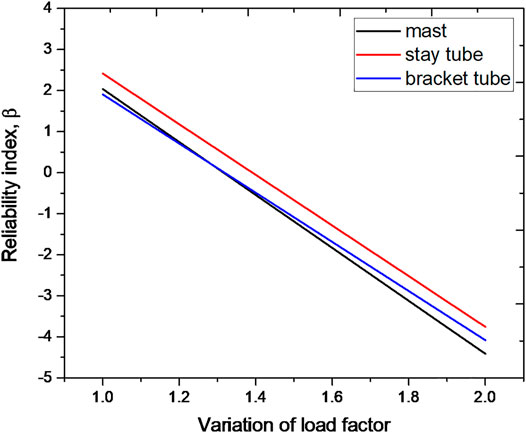
FIGURE 7. Effect of load factor on reliability index.
The self-weight of the OHLE mast structure plays an important role in load action. Self-weight depends on structure density. And for any specific structure, density usually does not change a lot in practice, since in Table 4 coefficient of variation of steel density is 0.01. This paper thus completed a 10% sensitivity analysis. As the three parts of interest are not made from the same materials, changes of density based on their original density are required, and it is obvious that the three parts do not show the same trends as Figure 8. The trends of reliability index changes in the three structures as the densities change are very different. For the mast, the reliability index reduced as the steel density increased. However, for the stay tube and bracket tube, the reliability index increased with increases of steel density as the wind load on the wires is the major load for the stay tube and bracket tube, with their self-weights being small. The wind load on wires has the opposite direction to self-weight, and thus, as the self-weight of the stay tube and bracket tube increase, the load action combination of these structures reduces. In contrast, the self-weight of the mast plays an important role in forming the load it bears. Density increases thus make the mast bear more load, making it more dangerous. Thus, the reliability indices of the stay tube and bracket tube increase but the reliability index of the mast reduces as steel density rises. This effect can be used to predict the influence of structure materials on structure reliability. And it is rarely the case that the heavier a structure is, the more reliable it is.
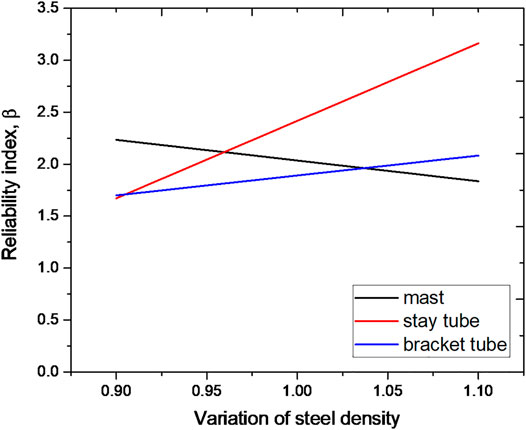
FIGURE 8. Effect of density on reliability index.
Conclusion
This paper investigates the reliability or safety indices of a mast structure using a strength load combination. The results were obtained using FORM. The reliability indices seen show that the bracket tube is the most dangerous part of this structure and comparatively the stay tube is the safest part in this structure. The reliability of a structure involves many random variables, and it is obvious that different variables will affect structure reliability differently. According to the results, resistance and load effects distribution impact the reliability index directly, and this paper thus offers the reliability index of the mast, stay tube, and bracket tube based on the specific material properties described. These values will change where any material property changes or load changes are made; thus, a sensitivity analysis was undertaken to examine the results of such influences. Among all parameters, the cross-section modulus may influence reliability least; however, as the cross-section modulus does not directly relate to the cross-section area, it may be better to find another parameter connected with the cross-section area. It was found that structural density and length are the most sensitive variables affecting the reliability index. It should be noted that, in order to reach the target reliability index, the length of the mast should be decreased from the nominal value to reduce the slenderness ratio of the member. Quantification reliability index could save unnecessary cost and unplanned maintenance. Normally, if the reliability index has met the target reliability requirements, it is easy to find the most cost-optimisation structural size capable of withstanding the loads. Quantification of mast structure reliability could evaluate existing mast structural safety and do some prediction of its service life in advance considering many uncertainties. The outcome of this study will help structural engineer to improve the design standard of the mast structure and mitigate the risk of safety concerns and delays due to unplanned maintenance, thus paving the way for a practical impact for society.
Data Availability Statement
The original contributions presented in the study are included in the article/Supplementary Material, further inquiries can be directed to the corresponding author.
Author Contributions
Conceptualisation: SK, CN, and LR; Investigation: SK, CN, and LR; Methodology: SK, CN, and LR; Data Analysis: CN and LR; Validation: CN and LR; Visualisation: CN and LR; Draft: CN and LR; Review and Editing: SK and CN.
Conflict of Interest
The authors declare that the research was conducted in the absence of any commercial or financial relationships that could be construed as a potential conflict of interest.
Publisher’s Note
All claims expressed in this article are solely those of the authors and do not necessarily represent those of their affiliated organizations, or those of the publisher, the editors and the reviewers. Any product that may be evaluated in this article, or claim that may be made by its manufacturer, is not guaranteed or endorsed by the publisher.
Acknowledgments
The authors are sincerely grateful to European Commission for the financial sponsorship of the H2020-MSCA-RISE Project No. 691135 “RISEN: Rail Infrastructure Systems Engineering Network,” which enables a global research network that tackles the grand challenge of railway infrastructure resilience and advanced sensing in extreme environments (www.risen2rail.eu) (Kaewunruen et al., 2016). The APC has been sponsored by the University of Birmingham Library’s Open Access Fund.
Abbreviations
E, is the load actions; R, is the structural resistance; Z(X), is the limit state function;
References
Baxter, A. (2015). Network Rail A Guide to Overhead Electrification Equipment. London: Network Rail.
Beagles, A., Fletcher, D., Peffers, M., Mak, P., and Lowe, C. (2016). Validation of a New Model for Railway Overhead Line Dynamics. Proc. Inst. Civil Eng. - Transport 169, 339–349. doi:10.1680/jtran.16.00020
Beck, A. T., and Dória, A. S. (2008). Reliability Analysis of I-Section Steel Columns Designed According to New Brazilian Building Codes. J. Braz. Soc. Mech. Sci. Eng. 30 (2), 152–159. doi:10.1590/s1678-58782008000200008
BS 5950-3 (1990). Tests for Geometrical Properties of Aggregates. Determination of Particle Size Distribution. Test Sieves, Nominal Size of Apertures. London, UK: BSI.
Dindar, S., Kaewunruen, S., An, M., and Sussman, J. M. (2018). Bayesian Network-Based Probability Analysis Of Train Derailments Caused By Various Extreme Weather Patterns On Railway Turnouts. Safety Science 110, 20–30. doi:10.1016/j.ssci.2017.12.028
Ellingwood, B., and Galambos, T. V. (1982). Probability-Based Criteria for Structural Design. Struct. Saf. 1, 15–26. doi:10.1016/0167-4730(82)90012-1
Galambos, T. V., and Ravindra, M. K. (1978). Properties of Steel for Use in LRFD. J. Struct. Div. 104 (9), 1459–1468. doi:10.1061/jsdeag.0004988
Ghasemi, S. H. (2015). Target Reliability Analysis for Structures. Available at: https://pdfs.semanticscholar.org/748d/9b5659365afad7f045e6478a94c79f3cb5a7.pdf Accessed Oct 1, 2020.
Government of South Australia (2013). Rail Electrification. South Australia: Department of Transport, Government of South Australia.
Gwalior, M. (2013). Important OHE Parameters. Maharajpura, India: Government of India Ministry of Railways.
Haiderali, A. E. (2020). Mitigation of Ancient Coal Mining Hazards to Overhead Line Equipment Structures. Proc. Inst. Civil Eng. - Transport 173 (4), 218–231. doi:10.1680/jtran.18.00143
Hasofer, A. M., and Lind, M. C. (1974). An Exact and Invariant First Order Reliability Format. J. Eng. Mech. 100 (1), 111–121. doi:10.1061/jmcea3.0001848
Hu, B., and Chan, R. W. K. (2019). Time-Dependent Reliability Analysis of Railway Overhead Structures. SN Appl. Sci. 1, 1279. doi:10.1007/s42452-019-1323-5
ISO (2012). ISO 13822 Bases for the Design of Structures—Assessment of Existing Structures. Geneva: International Organization for Standardization.
ISO (2015). ISO 2394: 2015 General Principles on Reliability for Structures. Geneva, Switzerland: International Organization for Standardization.
Jain, M. K. (2014). Over Head Equipment – Cantilever. Available at: https://www.railelectrica.com/traction-distribution/over-head-equipment-cantilever Accessed Oct 1, 2020.
JCSS (2000). Probabilistic Model Code. Joint Committee on Structural Safety. Available at: https://www.jcss.byg.dtu.dk/publications/probabilistic_model_code Accessed Oct 1, 2020.
Joint Standards Australia/Standards New Zealand Committee (2011). AS/NZS 1170.2: 2011 Structural Design Actions—Part 2: Wind Actions. Australian/New Zealand Standard (AS/NZS): Joint Technical Committee BD-006, Australia/New Zealand.
Kaewunruen, S., Sussman, J. M., and Matsumoto, A. (2016). Grand Challenges in Transportation and Transit Systems. Front. Built Environ. 2, 4. doi:10.3389/fbuil.2016.00004
Kaewunruen, S., and Remennikov, A. M. (2009). Structural Safety of Railway Prestressed Concrete Sleepers. Aust. J. Struct. Eng. 9 (2), 129–140. doi:10.1080/13287982.2009.11465016
Kayser, J. R., and Nowak, A. S. (1989). Reliability of Corroded Steel Girder Bridges. Struct. Saf. 6 (1), 53–63. doi:10.1016/0167-4730(89)90007-6
Kubicka, K., and Radoń, U. (2015). Proposal for the Assessment of Steel Truss Reliability under Fire Conditions. Arch. Civil Eng. 61 (4), 141–154. doi:10.1515/ace-2015-0041
Leonardo da Vinci Pilot Project (2005). Implement of Eurocodes Handbook 2. Prague, Czech Republic: Reliability Background.
Manoj, N. R. (2016). First - Order Reliability Method: Concepts and Application. Netherlands: Graduation Thesis, Faculty of Civil Engineering and Geosciences (CiTG), Delft University of Technology.
Network Rail (2017). How Storms and Flooding Affect the Railway. Available at: https://www.networkrail.co.uk/storms-affect-railway-team-orangeprepares/ Accessed November 1, 2020.
Ngamkhanong, C., Kaewunruen, S., Baniotopoulos, C., and Papaelias, M. (2017). Crossing Phenomena in Overhead Line Equipment (OHLE) Structure in 3D Space Considering Soil-Structure Interaction. IOP Conf. Series: Mater. Sci. Eng. 245, 032047. doi:10.1088/1757-899x/245/3/032047
Ngamkhanong, C., Kaewunruen, S., Calçada, R., and Martin, R. (2019). “Failure of Overhead Line Equipment (OHLE) Structure under Hurricane,” in Advances and Challenges in Structural Engineering. GeoMEast 2019. Sustainable Civil Infrastructures. Editors H. Rodrigues, and A. Elnashai (Cham: Springer). doi:10.1007/978-3-030-34252-4_6
Ngamkhanong, C., Kaewunruen, S., and Costa, B. J. A. (2018a). State-of-the-Art Review of Railway Track Resilience Monitoring. Infrastructures 3 (1), 3. doi:10.3390/infrastructures3010003
Ngamkhanong, C., Kaewunruen, S., and Baniotopoulos, C. (2018b). Far-Field Earthquake Responses of Overhead Line Equipment (OHLE) Structure Considering Soil-Structure Interaction. Front. Built Environ. 4, 35. doi:10.3389/fbuil.2018.00035
Ngamkhanong, C., Kaewunruen, S., Calçada, R., and Martin, R. (2018c). “Condition Monitoring of Overhead Line Equipment (OHLE) Structures Using Ground-Bourne Vibrations from Train Passages,” in Advances and Challenges in Structural Engineering. GeoMEast 2018. Sustainable Civil Infrastructures. Editors H. Rodrigues, and A. Elnashai (Cham: Springer), 14–22. doi:10.1007/978-3-030-01932-7_2
Ngamkhanong, C., and Kaewunruen, S. (2018). The Effect of Ground Borne Vibrations from High Speed Train on Overhead Line Equipment (OHLE) Structure Considering Soil-Structure Interaction. Sci. Total Environ. 627, 934–941. doi:10.1016/j.scitotenv.2018.01.298
Omishore, A., and Kala, Z. (2009). Reliability Analysis of Steel Structures with Imperfections. Dartmouth, Nova Scotia, Canada: Nova Scotia Community College.
Pfisterer (2016). Railway Catenary System, Solutions for Overhead Contact Line. Available from www.pfisterer.com Accessed November 1, 2020.
PPS International (2018). Aluminiun Cantilever Assembly for Railways/Metros. Available at: www.ppsinternational.in Accessed November 1, 2020.
Radoń, U. (2011). Reliability Analysis of Misses Truss. Arch. civil Mech. Eng. 11 (3), 723–738. doi:10.1016/S1644-9665(12)60112-5
RailCorp (2011). Design of Overhead Wiring Structures & Signal Gantries. Australia: Engineering Manual –Civil.
Robinson, P., and Bryan, C. (2009). Network Rail Electrical Power Reliability Study. Milton Keynes, UK: Network Rail.
Shing, A. W. C., and Wong, P. P. L. (2008). Wear of Pantograph Collector Strips. Proc. Inst. Mech. Eng. F: J. Rail Rapid Transit 222 (2), 169–176. doi:10.1243/09544097jrrt156
Sýkora, M. (2002). Reliability Analysis of a Steel Frame. Acta Polytechnica 42, 27–34. doi:10.14311/370
The European Union (2002). EN1990 Eurocode – Basis of Structural Design Brussels, Belgium: European Committee for Standardization (CEN).
Keywords: overhead line equipment (OHLE), mast structure, reliability, first order reliability method (FORM), resilience
Citation: Kaewunruen S, Ngamkhanong C and Ren L (2021) Reliability Quantification of Railway Electrification Mast Structure Considering Buckling. Front. Built Environ. 7:761491. doi: 10.3389/fbuil.2021.761491
Received: 19 August 2021; Accepted: 12 November 2021;
Published: 13 December 2021.
Edited by:
Zili Li, Delft University of Technology, NetherlandsReviewed by:
Hongrui Wang, Delft University of Technology, NetherlandsZhendong Liu, Royal Institute of Technology, Sweden
Copyright © 2021 Kaewunruen, Ngamkhanong and Ren. This is an open-access article distributed under the terms of the Creative Commons Attribution License (CC BY). The use, distribution or reproduction in other forums is permitted, provided the original author(s) and the copyright owner(s) are credited and that the original publication in this journal is cited, in accordance with accepted academic practice. No use, distribution or reproduction is permitted which does not comply with these terms.
*Correspondence: Sakdirat Kaewunruen, cy5rYWV3dW5ydWVuQGJoYW0uYWMudWs=
†ORCID: Sakdirat Kaewunruen, 0000-0003-2153-3538; Chayut Ngamkhanong, 0000-0003-1321-9952