 Mohammad Arar
 Chuloh Jung
- Ajman University, Ajman, United Arab Emirates
The residents of Dubai spend more than 90% of their time indoors and this lifestyle makes them easily exposed to Sick Building Syndrome (SBS). Even though Dubai Municipality strictly apply the IAQ (Indoor Air Quality) stipulation, indiscreet use of unproven finishing materials has been increased to deteriorate the health of residents in Dubai. The objective of this paper is to investigate the degree of influence of building material on indoor air pollutants concentration by measurement and prediction. As a methodology, indoor pollutants concentration was measured and investigated, variables were extracted through emission intensity experiments, and the indoor concentration was predicted by applying the double exponential decay model. The result had shown that electronic products, furniture, and textile products become new sources of indoor air pollution. The difference in emission patterns of wallpaper and flooring is confirmed via the emission rate test. It is statistically proven that Formaldehyde (CH2O) and VOCs showed a difference in the cumulative emission amount within 100 h but after that, it was confirmed that the difference in emission amount between materials became very small. In case of CH2O, the cumulative emission of the flooring material is greater than that of the wallpaper. This study will serve as a basic data to explore the cause of indoor air pollutants in daily life to reduce SBS symptoms in Dubai.
1 Introduction
In global metropolis, residents spend more than 90% of their time indoors including housing, office work, and transportation, and indoor air quality (IAQ) has a critical impact on their health as well as their comfort and productivity (Benito et al., 2021; Megahed and Ghoneim, 2021). Formaldehyde (CH2O), Acetaldehyde (C2H4O), (C3H6O), and Volatile Organic Compounds (VOCs) such as Benzene (C6H6), Toluene (C7H8), Ethylbenzene (C8H10), Xylene (C8H10), Styrene (C8H8) are representative indoor air pollutants and have been researched in many previous studies (Duan et al., 2016; Skulberg et al., 2019). The emissions of hazardous chemicals from residential buildings have been reported from building materials such as wallpaper, flooring, paints and adhesives and from furniture such as sofas, wardrobes and desks (Son et al., 2013; Xiong et al., 2016). In addition, it has been reported that gas stoves and gas heaters used indoors significantly affect the deterioration of IAQ and many studies have shown that smokers’ homes have significantly higher concentrations of VOCs than non-smokers’ homes (Canha et al., 2019).
Health disorders caused by various indoor air pollutants can be broadly classified into respiratory diseases represented by asthma, allergies, and chemical syndromes that have not been studied much yet (Huo et al., 2020). The pollution state of the outdoor air is an important factor that affects indoor air pollution, and the amount of the outside air environment flowing into the room varies depending on the season, lifestyle, and housing type and affects indoor air pollution (Sun et al., 2018). IAQ is affected by the characteristics of various indoor pollutant sources along with the current status of outside air (Sun et al., 2019). Indoor pollution sources are broadly classified into types and characteristics of building materials, number of years elapsed, indoor microclimate, and lifestyle. In particular, in new building, the generation of hazardous chemicals from building materials is reported as a major factor in indoor air pollution (Leung, 2015).
The emission of VOCs from the building materials is influenced by the type of material and internal characteristics such as the total amount of VOC contained in the material (elapsed years), as well as the environmental conditions exposed to the material (Zhang et al., 2018). In addition, it is reported that the effect on indoor temperature and humidity causes a large difference in the amount of generation (Zhou et al., 2017). However, this is mostly the result of experiments in which environmental conditions are strictly controllable, and there are actually more factors affecting the emission of chemical substances in the indoor living environment (Wang et al., 2020).
Indoor air pollution in a residential building is affected by many factors such as furniture, temperature and humidity, ventilation rate, indoor living activities, and adsorption effect (Jung et al., 2019). It has a more complex emission mechanism than the release characteristics seen in single materials (Gunschera et al., 2013). Most of the research on hazardous chemicals in a residential building reports on the condition before moving in (Kang et al., 2010). There are not many studies on the evaluation and characteristics of indoor air quality in living conditions. Surveys on indoor air quality in residential buildings are being conducted mainly on multi-purpose buildings and schools. Relatively few studies have been conducted on residential building.
The residents of Dubai in United Arab Emirates (UAE) spend more than 90% of their time indoors due to sweltering outside weather (Jung et al., 2021a). This lifestyle makes them easily exposed to Sick Building Syndrome (SBS) (Jung and Awad, 2021a). According to Dubai Healthcare City report, an estimated 15% of Dubai residents have suffered SBS symptoms such as such as fatigue, headache, red eyes, eye/nose/throat irritation, dry cough, dry or itchy skin, dizziness, and difficulty in focus on work (Jung and Awad, 2021b). Due to the social phenomenon that threatens public health, the Dubai Municipality initiated the regulation for IAQ (Indoor Air Quality) with less than .08 ppm (parts per million) of CH2O, less than 300 μg/m3 of TVOC (Total Volatile Organic Compound), and less than 150 μg/m3 of suspended particulates (less than 10 microns) in 8 h of continuous monitoring prior to occupancy (DEWA, 2021). However, indiscreet use of unproven finishing materials has been increased to deteriorate the health of residents in Dubai (Awad and Jung, 2021).
The important factors of indoor air pollution are the indoor microclimatic factors related to temperature and humidity (Salthammer et al., 2018), the application of building materials made of chemical substances (Schito et al., 2016), lifestyle, and the influence of the external environment (Yu and Kim, 2011). Among them, research has been conducted to reveal the major causes and the degree of their impact on building materials and furniture, as well as harmful substances generated during the construction process (Harb et al., 2018). Also, it has been reported via many research that the emission pattern of hazardous substances from building materials tends to decrease with time (Kaunelienė et al., 2016). However, studies on the degree of influence and emission characteristics of building materials on the living environment after moving in where daily life takes place have not been actively conducted yet (Shrubsole et al., 2019). This is because there are many restrictions and methodological difficulties in determining the influence of pollutants in the environment in which real life takes place (Silva et al., 2017). However, it is a necessary to explore the cause of indoor air pollutants in daily life.
The purpose of this study is to investigate the building materials as the indoor air pollutant source by measuring and predicting the concentration of indoor air pollutants based on the pollutant source survey via the measurement of amount of building materials and daily lifestyle.
2 Materials and Methods
Hazardous substances in buildings are emitted from various building materials such as wood, plywood, and furniture (Lee, 2011; Böhm et al., 2012). VOCs are emitted from household appliances and textile products of various clothes (Bari et al., 2015; Lucattini et al., 2018). In particular, the main cause of the release of CH2O is the adhesive used to attach the building finish (Yu and Kim, 2012) (Table 1).
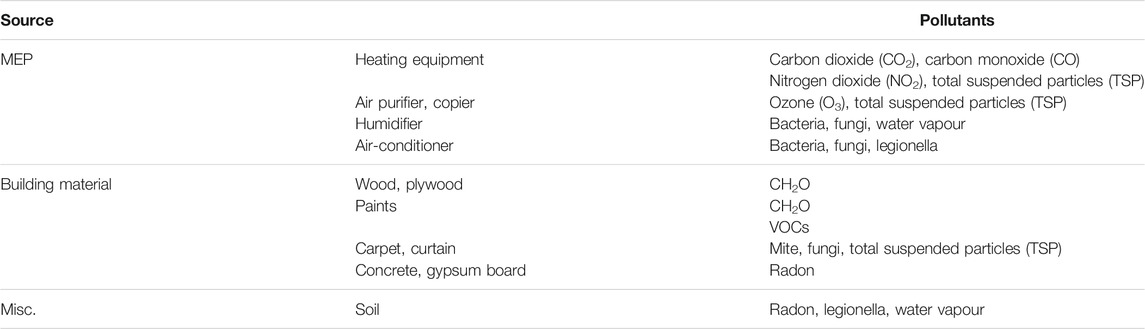
TABLE 1. Hazardous substances source and pollutants.
Indoor air quality is polluted as large amounts of VOCs and CH2O are emitted from new building (Jazar et al., 2013; Wei et al., 2015). This causes a lot of critical damage to children and the elderly (Cho et al., 2019). In the elderly, a lot of damage occurred, such as fatigue, headache, red eyes, eye/nose/throat irritation, dry cough, dry or itchy skin, dizziness, and difficulty in focus on work (Smedje et al., 2017; Sun et al., 2018), and the effects of each toxic substance on the human body are shown in Table 2.

TABLE 2. The effects of hazardous substances on the human body.
The simple measurement method refers to measurement through portable equipment and devices that measure indoor air pollutants and know the measured values in the field. A simple measurement method is required as a screening test for precision measurement or a response by a designer, a sanitation manager, and a resident at the site (Tian et al., 2020). However, in order to manage indoor air quality more effectively, it is necessary to present a simple measurement method with reliable measurement results (Kim et al., 2012).
The simplified measurement method can be classified in several ways. It can be divided into continuous measurement and one-time measurement with manual analysis. In the field, there are cases where changes in elapsed time are continuously observed over a long period of time, and in some cases, the objective can be achieved by measuring in a specific time period. The detection principle is divided into the physical principle with and without chemical reaction (Kim et al., 2013). The physical method is to use infrared absorption (Table 3).
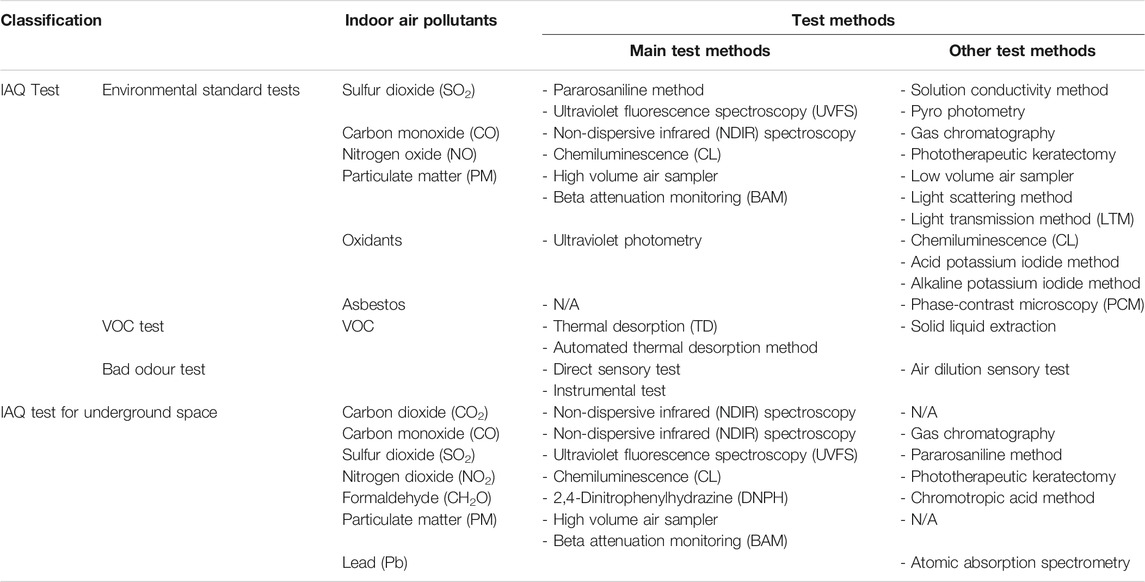
TABLE 3. Classification of measurement methods by indoor air pollutants.
The physical measurement method of CH2O is limited in principle to chemical reactions (Maruo and Nakamura, 2011). The visual method is divided into indicator tube method, absorptiometry analysis method to measure absorbance, and photoelectric photometer method to measure reflected light. There are also bubbler absorption method and diffusion absorption method. As an optical principle, there is a chemiluminescence method using light emission during CH2O absorption reaction. In addition, electrochemical detection methods are classified into electrostatic potential and galvanic cell methods (also called fuel cell methods).
VOCs test method can be classified into optical detection method and conductive detection method (Hwang and Park, 2019). Although the photoacoustic method is mentioned as an optical detection method, in order to detect electrically stable VOCs, large energy must be given to VOCs in order to discriminate it from the air. There are also hydrogen flame ionization method and photoionization method. In the hot-radiation semiconductor method, which confirms the ion conductivity of the semiconductor surface, the element is heated. In addition, the bilayer adsorption/piezoelectric balance method is only effective for odorous VOCs.
The measurement concentration range generally required for measuring equipment is .01∼10 mg/m3 (.008∼.8 ppm) for CH2O and .1∼100 mg/m3 (.03∼30 ppm) for VOCs (Rizk et al., 2018).
It is better to have a wide range of measurement concentration, but a precise one should be selected considering the low concentration measurement and precision generally refers to accuracy including reproducibility (Gallon et al., 2020). In particular, since the generation of indoor air pollutants is affected by temperature and humidity, it is required that these effects should be minimal.
The measurements of indoor air pollutants were conducted in December 2020 and April and May 2021 for the same units in DAMAC Maison Privé apartment in Business Bay (Figure 1), Dubai. This 36-floor twin tower apartment has identical twin masses with mirrored plan layout and contains a total of 100 units (Figure 2) (DXBOffplan, 2021). The construction began in 2014 and was completed in 2019 by DAMAC Properties (Propsearch, 2021). Regarding these five residential units (Table 4), indoor air pollutant sources such as the number of purchased electronic products, the number of purchased furniture, and the number of built-in furniture were investigated based on the same ventilation rate since one bedroom and two bedroom unit plans are identical (Jung et al., 2021a; Jung et al., 2021b).

FIGURE 1. DAMAC Maison Privé in Business Bay, Dubai.
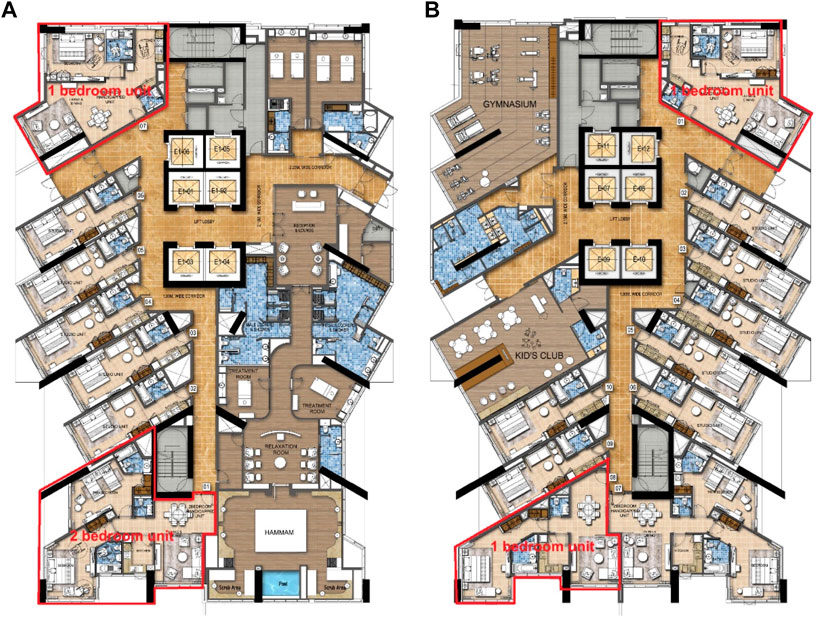
FIGURE 2. Tower A level 1 plan (A) and tower B level 1 plan (B) in DAMAC Maison Privé.

TABLE 4. Target residential units in DAMAC Maison Privé.
In this study, a small chamber system was used to measure the release rate of chemical substances from building materials based on WHO/UNEP (United Nation Environment Program) (UNEP, 2021). The small chamber system is an equipment to analyze the amount of CH2O and VOCs emitted from building material samples. A small stainless steel 15 L chamber is fixed inside, and there is a display in the upper right corner to check environmental conditions such as temperature, humidity, flow rate, and pressure (Figure 3). The temperature and humidity sensor and the flow control pump are mounted on the inside right side. The principle is that the outside air is first purified through the filter system, then passes through the temperature and humidity control device, and a constant flow rate of clean air is supplied into the chamber by the flow control device. The air supplied to the inside through the inlet at the bottom of the chamber is discharged through the outlet at the top. At this time, since the air containing the contaminants emitted by the sample is discharged into the chamber, the air contaminants are precisely analyzed by connecting the adsorption tube and sampling.
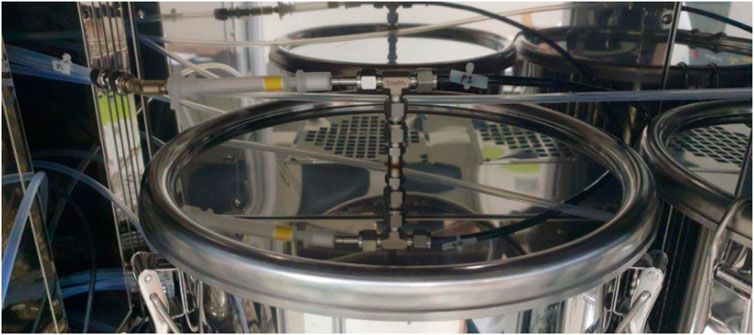
FIGURE 3. Small chamber system.
Based on indoor air quality process test standard by Ministry of Environment in South Korea (Ministry of Environment, 2021), the test conditions were setup at a temperature of 25°C, a relative humidity (RH) of 50%, and a ventilation rate of .5 times/h (Mahyuddin and Awbi, 2010). The sample load rate was 2.2 m2/m3, the area of the test was .044 m2, and the blank concentration was measure (Heiselberg and Perino, 2010). The emission intensity was calculated as follows according to the lapse of time after the sample was added (Eq. 1).
Ct: Formaldehyde concentration in the chamber at time t (mg/m3); Ctb,t: background concentration at time t (mg/m3); EFa: Emission intensity per unit area (mg/m2h); n: number of ventilation (times/h); L: Sample load rate (m2/m3).
Chemicals to be analyzed are VOCs [C6H6, C7H8, Ethylbenzene (C8H10), Xylene (C8H10), C8H8] and CH2O (Wei et al., 2019; Mentese et al., 2020). For sampling of VOCs, after connecting the adsorption tube of Tenax TA to the flow sampling pump, a total of 3.0 L of air in the small chamber was collected at 167 ml/min (Yassin and Pillai, 2019). For sampling of CH2O, LpDNPHS10 cartridge was connected to the flow sampling pump, and a total of 15 L of air in the chamber was collected at 167 ml/min (Hwang et al., 2018). The wallpaper was manufactured in January 2018 and about 18 months had elapsed before the start of the experiment. The flooring material was manufactured in August 2018 and used for about 16 months. As for the storage form after production of the above materials, the wallpaper was sealed in plastic and the flooring was packaged in a general paper box, and the materials stored at room temperature in the warehouse (Choi et al., 2010; Choi et al., 2013).
The measured indoor air pollutants were CH2O and VOCs. The measurement method is based on the WHO standards, which is measured at a location of 1.5 m from the center of the living room from 10 a.m. to 6 p.m. after 30 min of ventilation and 5 h of sealing before measurement (Table 5) (Saini et al., 2020). A sample is collected with a DNPH (2,4-Dinitrophenylhydrazine) cartridge after 5 h, which is rolled up with tinfoil to block any possible light effects (Walgraeve et al., 2011). At this time, both the natural and forced ventilation are sealed and samples are collected. Ozone scrubber is used when collecting air samples, and 15 L is collected for 20 min using a precise mini suction pump (.5 ml/min) (Xiong et al., 2015). The air samples in the last step are precisely analyzed by HPLC (High Performance Liquid Chromatography). In the TVOC concentration measurement method, the two steps of the CH2O sampling method are the same, and a Tenan-TA tube is used in the third step (Wang and Zhang, 2011). In the last step, the air sample is analyzed by GC/MS (Gas Chromatography/Mass Spectroscopy). However, since the device used in this study is a direct-reading method for instantaneous values, it is a method of measuring instantaneous concentrations multiple times, unlike the collection method of process test methods (Wang and Zhang, 2011). To avoid the errors of manual reading, two minimum and maximum readings were excluded especially from the measurement of CH2O.
TABLE 5. Measuring IAQ factors and methods.
To investigate the degree of influence of building materials on the indoor air pollution, the indoor concentration was predicted using the coefficient obtained from the chemical emission rate experiment in the building materials (Thevenet et al., 2018). The emission intensity prediction model used for indoor concentration prediction was Eq. 2, a double exponential decay model based on the emission pattern of building materials proposed by Chang and Guo (1992) (Chang and Guo, 1992). This double exponential decay model was validated by many previous IAQ research (Brown, 1999; Brown, 2002; Deng and Kim, 2004; Zhang et al., 2020a; Zhang et al., 2020b).
EF1: Amount of Generation at t = 0 (mg/m2·h) of Rapid Decay Generation Process; k1: Damping Coefficient (h−1) of Rapid Decay Generation Process; EF2: Amount of Generation at t = 0 (mg/m2·h) of Slow Decay Generation Process; k2: Damping Coefficient (h−1) of Slow Decay Generation Process; t: Time.
The double exponential model predicts by dividing the first and second decrease points in the emission pattern of chemical substances. The first reduction point is a point in which the emission intensity is rapidly decreased after passing the maximum point in the emission pattern. The secondary decrease point is the time when the emission intensity slightly decreases, or an equilibrium state is reached after the primary decrease is completed. The indoor concentration was estimated using Eq. 3 below. Assuming that the single room is ventilated with the number of ventilation N using Eq. 2 and C = 0 at t = 0, the chemical concentration C (mg/m3) in the single room can be expressed as Eq. 3.
C: Indoor Concentration at Time t (mg/m3); L: Load Factor (Room Surface Area/Room Volume (m2/m3); N: Number of Ventilation (h−1).
3 Results
3.1 Results of Investigation on Residential Units and Pollutant Sources
Measurements were conducted continuously in December 2020 and April and May 2021 for the target units. Table 6 shows the distribution of indoor temperature and humidity during measurement. In the December 2020 survey, it was distributed between 23.0–25.0°C, but in the April and May 2021 survey, the indoor temperature was distributed in the range of 28.0–31.0°C, showing a temperature difference of about 5.0°C. Humidity was in the range of 45.0–73.5% in April and May 2021, and 23.6–56.4% in December 2020 survey. The humidity difference was about 20.0% by season. Under the general premise that the generation of chemicals in building materials depends on the conditions of temperature and humidity, the probability of lower concentrations appearing in the measured values of the December 2020 survey was confirmed. The number of electronic products purchased at the time of moving in was found to be mostly between three and six in the entire residential units, and it was investigated those two additional electronic products were purchased around the time of the April and May 2021 survey in Tower-A 231. In addition, furniture purchased at the time of moving in was found to be two in all residential units except three in Tower-A 322. The number of textile purchase such as carpet and curtains were four in Tower-A 322, two in Tower-A 231, and one in the rest of the houses.
TABLE 6. Investigation on the indoor pollutant sources of target residential units.
3.2 The Result of Building Material Emission Rate Test
The interior finishing materials of residential units differ by type, but most of them use eco-friendly building materials certified products. It was confirmed that the main finishing materials, such as wallpaper and flooring, obtained the highest grade of the HB mark. In this experiment, wallpaper and flooring materials were targeted since they have the largest surface area in residential units. In consideration of the elapsed time from the completion of construction to the measurement time, 18-month-old wallpaper and 16-month-old flooring materials were selected and used in the experiment. The purpose of this study was to calculate the emission intensity of the finishing material after a certain period after construction.
3.2.1 Wallpaper
Figures 4, 5 show the results of emission tests for VOCs (C6H6, C7H8, Ethylbenzene (C8H10), Xylene (C8H10), C8H8) for wallpaper 18 months after production. The emission intensities of C6H6, Xylene (C8H10), and C8H8 (Figure 4) showed relatively low emission levels compared to C7H8 and Ethylbenzene (C8H10) (Figure 5). In case of C6H6, the emission pattern over time showed the maximum emission intensity when approximately 24 h had elapsed and showed a decreasing pattern thereafter. The emission pattern of CH2O is different from that of VOCs as shown in Figures 4, 5. After the start of the experiment, it started to increase continuously for a certain period, and when about 144 h (6 days) elapsed, the maximum emission intensity appeared as 22 µg/m2h. After that, it showed a release pattern showing a mild decrease (Figure 6).
FIGURE 4. Emission pattern of benzene, xylene, and styrene from wallpaper.
FIGURE 5. Emission pattern of toluene and ethylbenzene from wallpaper.
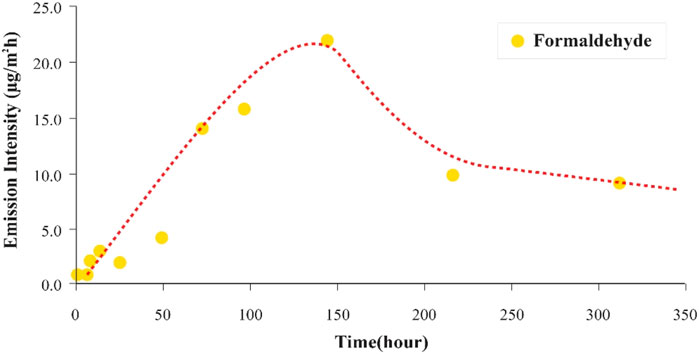
FIGURE 6. Emission pattern of CH2O from wallpaper.
3.2.2 Flooring
The results of the emission test for each VOCs on the flooring materials 16 months after production are as follows. C6H6, Xylene (C8H10), and C8H8 (Figure 7) showed relatively low emission intensities compared to C7H8 and Ethylbenzene (C8H10) (Figure 8). Their emission patterns over time were all similar. VOCs emission from parquet flooring was found to have a low initial value unlike wallpaper, and then slightly increased, and then showed a gradual decrease in all materials after about 24 h. This is different from the wallpaper, which shows the maximum emission intensity immediately after the experiment. Xylene (C8H10) showed only a slight increase in emission intensity when about 24 h and other materials about 12 h had elapsed, so it is judged as a material property showing different emission patterns at the same experimental temperature (25°C).
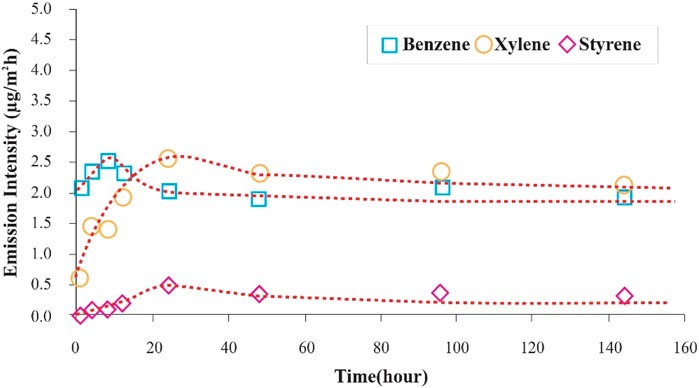
FIGURE 7. Emission pattern of benzene, xylene, and styrene from flooring.
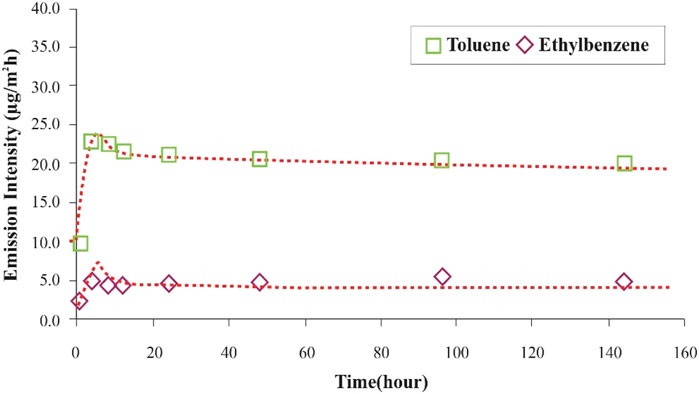
FIGURE 8. Emission pattern of toluene and ethylbenzene from flooring.
Figure 9 shows the emission intensity of CH2O from the flooring material over time. After about 100 h, the gentle increase in emission intensity stopped and started to decrease. The values of the concentrations exhibiting these fluctuations were very small. The release pattern of CH2O showed a large difference between the maximum release intensity and the initial release intensity in case of wallpaper but showed a slight difference in the release pattern in case of flooring.
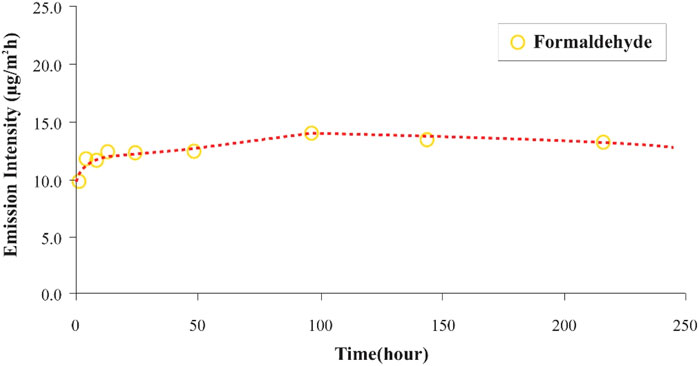
FIGURE 9. Emission pattern of CH2O from flooring.
3.3 Characteristics of Cumulative Emissions of Building Materials
Due to the emission intensity pattern characteristics of building materials, the cumulative emission amount (µg/m3) over time was calculated and compared. Figure 10 shows the characteristics of the cumulative emission amount of each VOC for wallpaper and Figure 11 for flooring. Both building materials showed the largest cumulative emission of C7H8. The accumulated amount up to 300 h was about 600 μg/m3 for wallpaper and about 710 μg/m3 for flooring material up to 150 h, indicating that the cumulative emission of flooring materials was larger than that of wallpaper. In particular, the emission of Ethylbenzene (C8H10) from wallpaper was high, confirming that the emission characteristics of individual VOCs were different depending on the characteristics of the material. On the other hand, in case of CH2O, the cumulative emission amount from the flooring was significantly higher than that of the wallpaper (Figure 12). The elapsed time after production was shorter than that of wallpaper, and the flooring material, which was stored in a state where natural radiation rather than closed storage, showed higher emission than wallpaper. It can be predicted that the main pollutant source of CH2O in the room is the influence of the flooring material. The two building materials had a difference in that the elapsed time after production was about 2 months, but in case of VOCs, the wallpaper showed a slightly higher emission amount, and in case of CH2O, the flooring material showed a high emission amount.
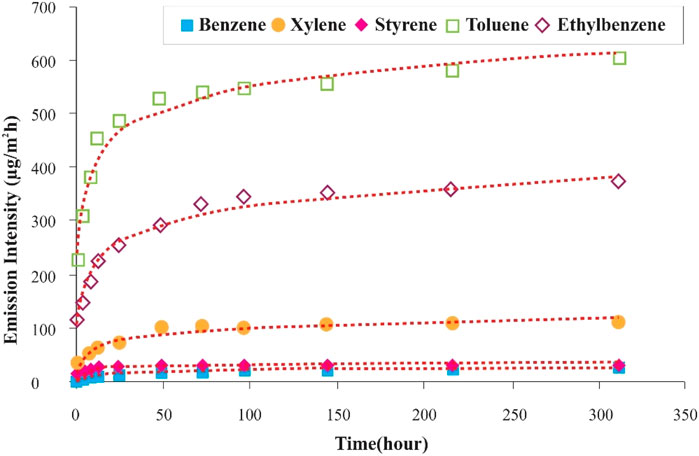
FIGURE 10. Cumulative emission of VOCs from wallpaper.
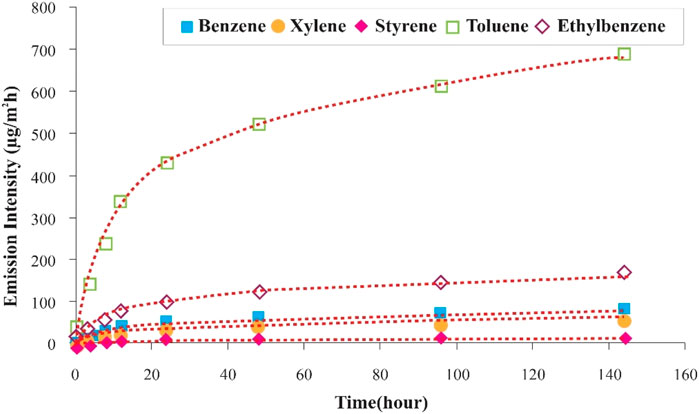
FIGURE 11. Cumulative emission of VOCs from flooring.
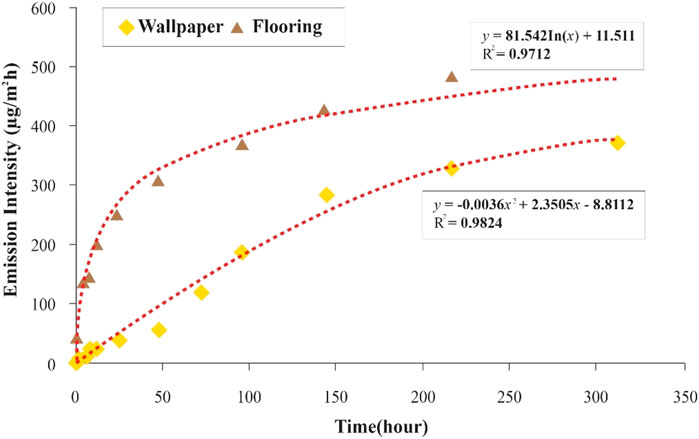
FIGURE 12. Cumulative emission of CH2O from wallpaper and flooring.
3.4 Indoor Concentration Measurement Results by Residential Units
To understand the distribution of indoor air pollutants by residential unit, the concentration of chemicals in winter (December 2020) and spring (April and May 2021) was measured. Indoor air pollutants analyzed were CH2O, C6H6, C7H8, Ethylbenzene (C8H10), Xylene (C8H10), and C8H8. Except for Tower-B 312 for C6H6 and Tower-A 322 for Ethylbenzene (C8H10), the indoor concentration measurement in December 2020 clearly showed an increasing trend compared to the measurement in April and May 2021. Although there is a difference in the degree of decrease for each residential unit and for each indoor air pollutants, the trend of increase in C7H8, Xylene (C8H10), and C8H8 was the same for residential units (Figure 13). On the other hand, in case of CH2O, the concentration increased with time in all units except for Tower-A 322 (Figure 14). CH2O change in Tower-A 322 was not investigated for increasing factors in interviews and lifestyle surveys. This is judged as the uncertainty of general measurement that can occur in everyday life.
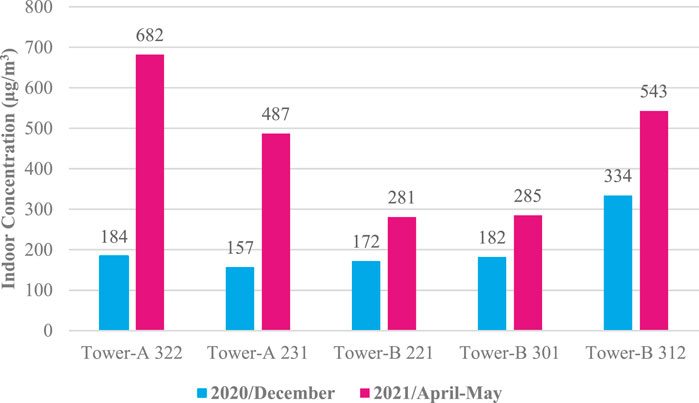
FIGURE 13. Changes in indoor concentration of toluene by residential unit.
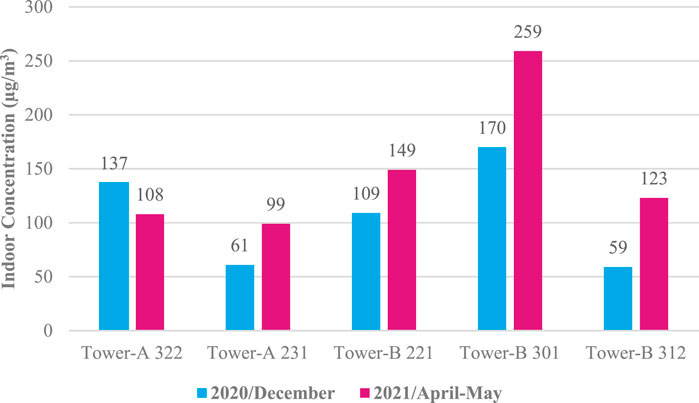
FIGURE 14. Changes in indoor concentration of CH2O by residential unit.
3.5 Indoor Concentration Prediction Results
For VOCs and CH2O, the indoor concentration of the residential units was predicted. Table 7 shows the variable values related to the prediction of VOCs and CH2O based on the emission patterns of the two building materials. To use the double exponential decay model Eq. 2, the coefficients related to the amount of generation in building materials require the initial emission intensity and attenuation coefficient at the time of the first decrease, and the initial emission intensity and the attenuation coefficient at the time of the second decrease. In addition, the contents of various parameters applied to predicting the indoor concentration using Eq. 3 described above are shown in Table 8. In this study, the indoor concentration was predicted for a living room. The main parameters to be applied for this purpose are the age of the material, the time of measuring the indoor concentration, the time to be predicted, the surface area and volume (load factor) of the wallpaper and flooring, and the number of ventilations. As shown in Table 9, the load ratio of building materials in the target house was found to exist between .84–.98 m2/m3 for wallpaper and .41–.43 m2/m3 for flooring. Therefore, this indoor concentration prediction is premised on the existence of a difference in the load factor from 2.2 m2/m3 conducted in the building material test.
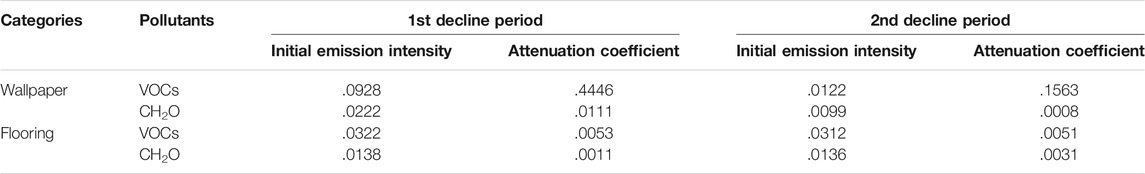
TABLE 7. Variables related to Predicting the Emission Intensity.
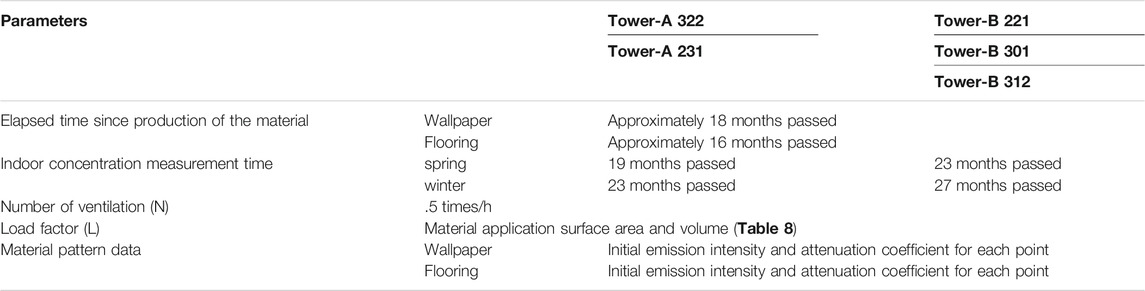
TABLE 8. Parameters for prediction of indoor concentration.
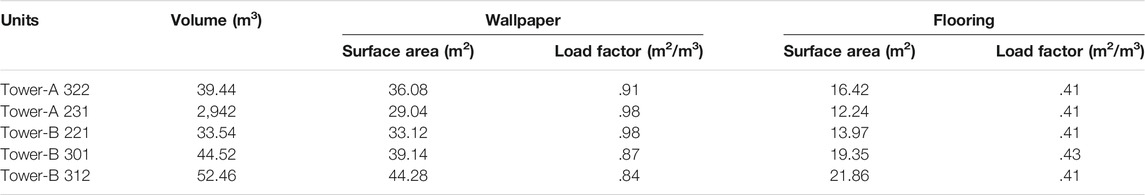
TABLE 9. Surface area and volume of the living rooms in target units.
For the period of predicting the indoor concentration, the indoor concentration was predicted for the period from 16 to 27 months after moving in with the consideration of the elapsed years of materials and the period of indoor concentration. The number of ventilations was set to .5 times/h, and the initial emission intensity and attenuation coefficient were substituted for the data on material characteristics using the variables derived from Table 6. In addition, the concentration up to 27 months was predicted (the predicted value) by using the data obtained from 16 months for flooring and 18 months for wallpaper. Comparison with data measured in an actual residential unit was conducted. Figures 15, 16 show the comparison of the predicted and measured values for the living concentration of VOCs and CH2O in the houses under investigation. VOCs are higher in all units than the actual concentration predicted, suggesting that there is a high probability of factors other than building materials. In case of VOCs, the fact that the measured value is higher than the predicted value even though there is no specific source of contamination or introduction of household goods that affect the occurrence of VOCs at the beginning of move-in means that there is a possibility of the introduction of pollutants from the outside during daily life. On the other hand, the actual value of CH2O showed that the emission amount was lower or close to the predicted value in all houses. In the review of the amount of internal generation described above, it is estimated that the amount of emission calculated from materials is at the same level despite the presence of built-in furniture and newly purchased furniture that affect the emission of CH2O at the beginning of move-in after 16 months or more. At this point, the influence on the number of pollutants generated from furniture in the living room was attenuated.
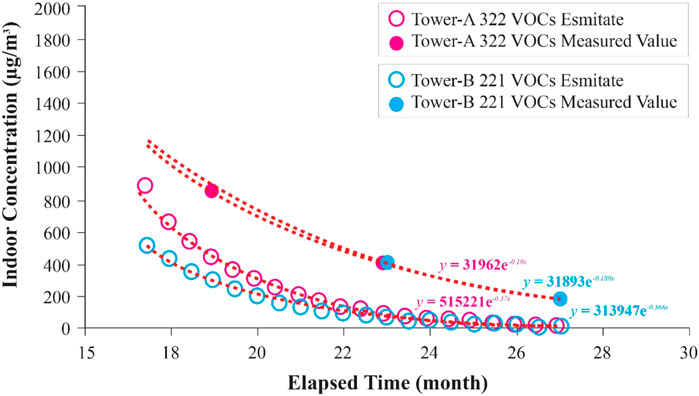
FIGURE 15. Comparison between VOCs estimate and measured value at Tower-A322 and Tower-B 221.
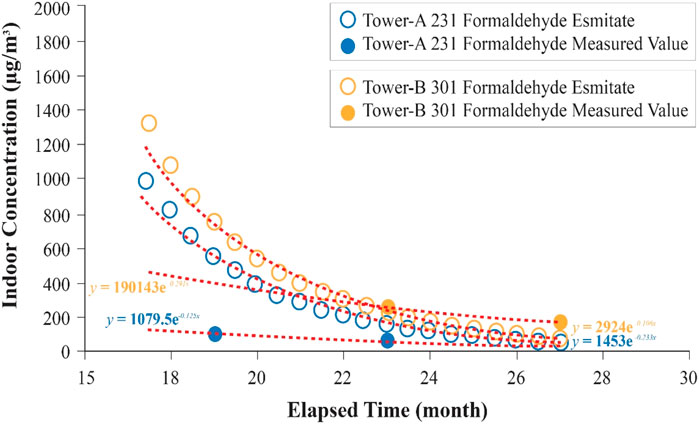
FIGURE 16. Comparison between formaldehyde estimate and measured value at Tower-A231 and Tower-B 301.
4 Discussion
In the current situation in the UAE, there are no studies on the identification of the material properties of building materials and the dominant influencing factors. Therefore, the lack of database on the basic properties of building materials suitable for the UAE situation brings many limitations to research development such as verification and development of prediction models via modeling or simulation, and there is a limit to suggesting practical measures. The emission of hazardous chemicals from building materials is affected by the environmental conditions to which the materials are exposed, as well as the effects of material characteristics such as the type of material and the total amount of hazardous chemicals contained in the material. In particular, in the case of the UAE, which has a high temperature and low humidity desert climate, there are many factors that change the material temperature due to changes in the outdoor temperature during the day and night and excessive use of air conditioners. As such, it is an urgent issue to accumulate data on the amount of emission of hazardous substances on the influencing factors of basic building materials in a situation where they are exposed to various temperatures, humidity, and wind.
The limitation of this study is a premise that there is a difference between the load factor applied in the emission rate test of building materials and that applied to the living room of the residential units. The emission of VOCs should be further investigated with influencing factors in daily life.
In future studies, an in-depth study on the age, emission pattern, and emission coefficient of building materials, is indispensable since these are important variables for predicting indoor concentration.
In addition, it is necessary to establish a database and methodologies for load factor, ventilation frequency, and measurement points for actual application to residential units.
5 Conclusion
The purpose of this study is to understand the degree of influence of building material on indoor pollutants concentration by measuring and predicting the indoor concentration of target residential units. To this end, indoor concentration was measured, and pollutant source was investigated, variables were extracted through emission intensity experiments of applied building materials, and the indoor concentration was predicted by applying the double exponential decay model. Therefore, the degree of influence of the building materials applied to the residential units was analyzed by comparing it with the actual value and evaluating the influencing factors. The conclusion based on the analysis of the results are as follows.
First, it was found that there are many purchases of electronic products, furniture, and textile products, which can become new sources of indoor air pollution after moving in.
Second, there was a difference in indoor temperature and humidity during winter and spring measurements, so that the indoor temperature in winter was about 5.0°C and the humidity was about 20.0% lower. In addition, the indoor concentration measurement result of the residential units also clearly shows the tendency of the indoor concentration to increase with the passage of time in winter and spring in most units, confirming that this experimental data can be applied as data for prediction.
Third, the difference in the emission patterns of wallpaper and flooring was confirmed via the emission rate test of building materials in an environment of 25°C, 50%, and ventilation frequency of .5 times/h. The wallpaper showed a typical chemical emission pattern, with the initial value being the highest during the experimental period and decreasing thereafter. CH2O also showed a longer initial rise period and decreased after increasing for a certain period. However, in case of flooring materials, the initial values of both VOCs and CH2O were low, and a difference was confirmed in the emission pattern, which rose to a fine concentration within 24 h, reached a maximum value, and then gradually decreased thereafter. Understanding the difference in emission patterns is an essential process of parameter calculation for prediction, and parameters were calculated based on this.
Fourth, the cumulative emission amount was reviewed to understand the relationship between the difference in the emission patterns of the two materials and the internal content of the building materials. VOCs showed a difference in the cumulative emission amount due to the difference in emission patterns within 100 h after the start of the experiment, but after that, it was confirmed that the difference in emission amount between materials became very small. Therefore, it is important to understand the emission pattern at the initial time point until the maximum emission intensity is exhibited, and the difference in the cumulative amount appeared at this time point.
Fifth, in case of CH2O, the cumulative emission of the flooring material is greater than that of the wallpaper, and there is no period in which the flooring material exhibits a sudden emission with respect to temperature. However, it was confirmed that the high emission amount was continuously displayed. Although the chemical content inside the flooring material is greater than that of the wallpaper, it does not show the form of a general emission pattern. Therefore, it is judged that it is necessary to grasp the emission pattern according to the content, each building material, and environmental conditions (temperature, humidity, number of ventilation) for the emission pattern of chemical substances for prediction.
Sixth, VOCs were predicted to be lower than the actual values in the simulations predicted by applying the parameters calculated based on the building materials and emission patterns. CH2O was predicted to be slightly higher or at about the same level. Therefore, in predicting the indoor concentration of the residential unit, the characteristics of the building material to which CH2O is applied are effective and can be predicted.
Data Availability Statement
The original contributions presented in the study are included in the article/supplementary material, further inquiries can be directed to the corresponding author.
Author Contributions
All authors contributed significantly to this study. CJ and MA identified and secured the example buildings used in the study. The data acquisition system and installations of sensors were designed and installed by CJ and MA. MA were responsible for data collection. Data analysis was performed by CJ and NA. The manuscript was compiled by CJ and NA and reviewed by MA and NA. All authors have read and agreed to the published version of the manuscript.
Conflict of Interest
The authors declare that the research was conducted in the absence of any commercial or financial relationships that could be construed as a potential conflict of interest.
Publisher’s Note
All claims expressed in this article are solely those of the authors and do not necessarily represent those of their affiliated organizations, or those of the publisher, the editors and the reviewers. Any product that may be evaluated in this article, or claim that may be made by its manufacturer, is not guaranteed or endorsed by the publisher.
Acknowledgments
The authors would like to express their gratitude to Ajman University for the generous support to publish this paper.
References
Awad, J., and Jung, C. (2021). Evaluating the Indoor Air Quality after Renovation at the Greens in Dubai, United Arab Emirates. Buildings 11 (8), 353. doi:10.3390/buildings11080353
Bari, M. A., Kindzierski, W. B., Wheeler, A. J., Héroux, M.-È., and Wallace, L. A. (2015). Source Apportionment of Indoor and Outdoor Volatile Organic Compounds at Homes in Edmonton, Canada. Building Environ. 90, 114–124. doi:10.1016/j.buildenv.2015.03.023
Benito, P. A., Piña Ramírez, C., Viccione, G., and Lepore, E. (2021). Ventilation for Residential Buildings: Critical Assessment of Standard Requirements in the COVID-19 Pandemic Context. Front. Built Environ. 7, 656718. doi:10.3389/fbuil.2021.656718
Böhm, M., Salem, M. Z., and Srba, J. (2012). Formaldehyde Emission Monitoring from a Variety of Solid wood, Plywood, Blockboard and Flooring Products Manufactured for Building and Furnishing Materials. J. Hazard. Mater. 221, 68–79. doi:10.1016/j.jhazmat.2012.04.013
Brown, S. K. (1999). Chamber Assessment of Formaldehyde and VOC Emissions from Wood-Based Panels. Indoor air 9 (3), 209–215. doi:10.1111/j.1600-0668.1999.t01-1-00008.x
Brown, S. K. (2002). Volatile Organic Pollutants in New and Established Buildings in Melbourne, Australia. Indoor air 12 (1), 55–63. doi:10.1034/j.1600-0668.2002.120107.x
Canha, N., Lage, J., Coutinho, J. T., Alves, C., and Almeida, S. M. (2019). Comparison of Indoor Air Quality during Sleep in Smokers and Non-smokers' Bedrooms: A Preliminary Study. Environ. Pollut. 249, 248–256. doi:10.1016/j.envpol.2019.03.021
Chang, J. C. S., and Guo, Z. (1992). Characterization of Organic Emissions from a Wood Finishing Product - Wood Stain. Indoor Air 2 (3), 146–153. doi:10.1111/j.1600-0668.1992.03-23.x
Cho, H. M., Lee, J., Wi, S., and Kim, S. (2019). Field Study on Indoor Air Quality of wood Remodeled Welfare Facilities for Physical and Psychological Benefits. J. Clean. Prod. 233, 197–208. doi:10.1016/j.jclepro.2019.05.293
Choi, D. H., Dong Hwa Kang, D. H., Sun Sook Kim, S. S., Myoung Souk Yeo, M. S., and Kwang Woo Kim, K. W. (2010). The Impact of a Non-adhesive Floating Installation Method on Emissions and Indoor Concentrations of VOCs. Indoor Built Environ. 19 (4), 435–443. doi:10.1177/1420326x10372730
Choi, D. H., Kang, D. H., Yeo, M. S., and Kim, K. W. (2013). Cold Weather Installation of wood Flooring by Adhesive Bonding and its Impact on Indoor Air Quality. J. Adhes. Sci. Technol. 27 (5-6), 632–647. doi:10.1080/01694243.2012.690626
Deng, B., and Kim, C. N. (2004). Physical-based Double-Exponential Model for VOCs Emission from Carpet. Atmos. Environ. 38 (24), 4085–4089. doi:10.1016/j.atmosenv.2004.04.004
DEWA (2021). Green Building Regulations & Specifications. Available at: https://www.dewa.gov.ae/∼/media/Files/Consultants%20and%20Contractors/Green%20Building/Greenbuilding_Eng.ashx.
Duan, H., Liu, X., Yan, M., Wu, Y., and Liu, Z. (2016). Characteristics of Carbonyls and Volatile Organic Compounds (VOCs) in Residences in Beijing, China. Front. Environ. Sci. Eng. 10 (1), 73–84. doi:10.1007/s11783-014-0743-0
DXBOffplan (2021). Prive at Business Bay by DAMAC. Available at: https://dxboffplan.com/properties/damac-maison-prive/.
Gallon, V., Le Cann, P., Sanchez, M., Dematteo, C., and Le Bot, B. (2020). Emissions of VOCs, SVOCs, and Mold during the Construction Process: Contribution to Indoor Air Quality and Future Occupants' Exposure. Indoor air 30 (4), 691–710. doi:10.1111/ina.12647
Gunschera, J., Mentese, S., Salthammer, T., and Andersen, J. R. (2013). Impact of Building Materials on Indoor Formaldehyde Levels: Effect of Ceiling Tiles, mineral Fiber Insulation and gypsum Board. Building Environ. 64, 138–145. doi:10.1016/j.buildenv.2013.03.001
Harb, P., Locoge, N., and Thevenet, F. (2018). Emissions and Treatment of VOCs Emitted from wood-based Construction Materials: Impact on Indoor Air Quality. Chem. Eng. J. 354, 641–652. doi:10.1016/j.cej.2018.08.085
Heiselberg, P., and Perino, M. (2010). Short-term Airing by Natural Ventilation - Implication on IAQ and thermal comfort. Indoor Air 20 (2), 126–140. doi:10.1111/j.1600-0668.2009.00630.x
Huo, X., Sun, Y., Hou, J., Wang, P., Kong, X., Zhang, Q., et al. (2020). Sick Building Syndrome Symptoms Among Young Parents in Chinese Homes. Building Environ. 169, 106283. doi:10.1016/j.buildenv.2019.106283
Hwang, S. H., and Park, W. M. (2019). Indoor Air Quality Assessment with Respect to Culturable Airborne Bacteria, Total Volatile Organic Compounds, Formaldehyde, PM10, CO2, NO2, and O3 in Underground Subway Stations and Parking Lots. Air Qual. Atmos. Health 12 (4), 435–441. doi:10.1007/s11869-019-00666-z
Hwang, S. H., Roh, J., and Park, W. M. (2018). Evaluation of PM10, CO2, Airborne Bacteria, TVOCs, and Formaldehyde in Facilities for Susceptible Populations in South Korea. Environ. Pollut. 242, 700–708. doi:10.1016/j.envpol.2018.07.013
Jazar, R. M., Ismail, R., and Abdull, N. H. (2013). Building and Indoor Environment: A Study on Three Stages of a New Building Commisioning. Int. J. Eng. 3 (3), 8269.
Jung, C.-C., Hsu, N.-Y., and Su, H.-J. (2019). Temporal and Spatial Variations in IAQ and its Association with Building Characteristics and Human Activities in Tropical and Subtropical Areas. Building Environ. 163, 106249. doi:10.1016/j.buildenv.2019.106249
Jung, C., Awad, J., and Chohan, A. (2021). The Planning of Smart Elderly Housing in Dubai with IoT Technologies. Open House Int. 46, 668–681. doi:10.1108/ohi-08-2020-0121
Jung, C., and Awad, J. (2021). Improving the IAQ for Learning Efficiency with Indoor Plants in University Classrooms in Ajman, United Arab Emirates. Buildings 11 (7), 289. doi:10.3390/buildings11070289
Jung, C., Awad, J., Mahmoud, N. S. A., and Salameh, M. (2021). An Analysis of Indoor Environment Evaluation for the Springs Development in Dubai, UAE. Open House Int. 46, 651–667. doi:10.1108/ohi-11-2020-0165
Jung, C., and Awad, J. (2021). The Improvement of Indoor Air Quality in Residential Buildings in Dubai, UAE. Buildings 11 (6), 250. doi:10.3390/buildings11060250
Kang, D. H., Choi, D. H., Lee, S. M., Yeo, M. S., and Kim, K. W. (2010). Effect of Bake-Out on Reducing VOC Emissions and Concentrations in a Residential Housing Unit with a Radiant Floor Heating System. Building Environ. 45 (8), 1816–1825. doi:10.1016/j.buildenv.2010.02.010
Kaunelienė, V., Prasauskas, T., Krugly, E., Stasiulaitienė, I., Čiužas, D., Šeduikytė, L., et al. (2016). Indoor Air Quality in Low Energy Residential Buildings in Lithuania. Building Environ. 108, 63–72. doi:10.1016/j.buildenv.2016.08.018
Kim, M., Liu, H., Kim, J. T., and Yoo, C. (2013). Sensor Fault Identification and Reconstruction of Indoor Air Quality (IAQ) Data Using a Multivariate Non-gaussian Model in Underground Building Space. Energy and buildings 66, 384–394. doi:10.1016/j.enbuild.2013.07.002
Kim, M., SankaraRao, B., Kang, O., Kim, J., and Yoo, C. (2012). Monitoring and Prediction of Indoor Air Quality (IAQ) in Subway or Metro Systems Using Season Dependent Models. Energy and buildings 46, 48–55. doi:10.1016/j.enbuild.2011.10.047
Lee, Y. S. (2011). Comparisons of Indoor Air Quality and thermal comfort Quality between Certification Levels of LEED-Certified Buildings in USA. Indoor Built Environ. 20 (5), 564–576. doi:10.1177/1420326x11409453
Leung, D. Y. C. (2015). Outdoor-indoor Air Pollution in Urban Environment: Challenges and Opportunity. Front. Environ. Sci. 2, 69. doi:10.3389/fenvs.2014.00069
Lucattini, L., Poma, G., Covaci, A., de Boer, J., Lamoree, M. H., and Leonards, P. E. G. (2018). A Review of Semi-volatile Organic Compounds (SVOCs) in the Indoor Environment: Occurrence in Consumer Products, Indoor Air and Dust. Chemosphere 201, 466–482. doi:10.1016/j.chemosphere.2018.02.161
Mahyuddin, N., and Awbi, H. (2010). The Spatial Distribution of Carbon Dioxide in an Environmental Test Chamber. Building Environ. 45 (9), 1993–2001. doi:10.1016/j.buildenv.2010.02.001
Marques, G., Roque Ferreira, C., and Pitarma, R. (2018). A System Based on the Internet of Things for Real-Time Particle Monitoring in Buildings. Ijerph 15 (4), 821. doi:10.3390/ijerph15040821
Maruo, Y. Y., and Nakamura, J. (2011). Portable Formaldehyde Monitoring Device Using Porous Glass Sensor and its Applications in Indoor Air Quality Studies. Analytica Chim. Acta 702 (2), 247–253. doi:10.1016/j.aca.2011.06.050
Megahed, N. A., and Ghoneim, E. M. (2021). Indoor Air Quality: Rethinking Rules of Building Design Strategies in post-pandemic Architecture. Environ. Res. 193, 110471. doi:10.1016/j.envres.2020.110471
Mentese, S., Mirici, N. A., Elbir, T., Palaz, E., Mumcuoğlu, D. T., Cotuker, O., et al. (2020). A Long-Term Multi-Parametric Monitoring Study: Indoor Air Quality (IAQ) and the Sources of the Pollutants, Prevalence of Sick Building Syndrome (SBS) Symptoms, and Respiratory Health Indicators. Atmos. Pollut. Res. 11 (12), 2270–2281. doi:10.1016/j.apr.2020.07.016
Ministry of Environment (2021). Laws and Policies for Environmental Health. Available at: http://me.go.kr/home/web/policy_data/read.do?menuId=10276&seq=6559.
Propsearch (2021). Damac Maison Privé. Available at: https://propsearch.ae/dubai/damac-maison-prive.
Rizk, M., Guo, F., Verriele, M., Ward, M., Dusanter, S., Blond, N., et al. (2018). Impact of Material Emissions and Sorption of Volatile Organic Compounds on Indoor Air Quality in a Low Energy Building: Field Measurements and Modeling. Indoor air 28 (6), 924–935. doi:10.1111/ina.12493
Saini, J., Dutta, M., and Marques, G. (2020). A Comprehensive Review on Indoor Air Quality Monitoring Systems for Enhanced Public Health. Sust. Environ. Res. 30 (1), 1–12. doi:10.1186/s42834-020-0047-y
Salthammer, T., Schieweck, A., Gu, J., Ameri, S., and Uhde, E. (2018). Future Trends in Ambient Air Pollution and Climate in Germany - Implications for the Indoor Environment. Building Environ. 143, 661–670. doi:10.1016/j.buildenv.2018.07.050
Schito, E., Testi, D., and Grassi, W. (2016). A Proposal for New Microclimate Indexes for the Evaluation of Indoor Air Quality in Museums. Buildings 6 (4), 41. doi:10.3390/buildings6040041
Shrubsole, C., Dimitroulopoulou, S., Foxall, K., Gadeberg, B., and Doutsi, A. (2019). IAQ Guidelines for Selected Volatile Organic Compounds (VOCs) in the UK. Building Environ. 165, 106382. doi:10.1016/j.buildenv.2019.106382
Silva, M. F., Maas, S., Souza, H. A. d., and Gomes, A. P. (2017). Post-occupancy Evaluation of Residential Buildings in Luxembourg with Centralized and Decentralized Ventilation Systems, Focusing on Indoor Air Quality (IAQ). Assessment by Questionnaires and Physical Measurements. Energy and Buildings 148, 119–127. doi:10.1016/j.enbuild.2017.04.049
Skulberg, K. R., Nyrud, A. Q., Goffeng, L. O., and Wisthaler, A. (2019). Health and Exposure to VOCs from Pinewood in Indoor Environments. Front. Built Environ. 5, 107. doi:10.3389/fbuil.2019.00107
Smedje, G., Wang, J., Norbäck, D., Nilsson, H., and Engvall, K. (2017). SBS Symptoms in Relation to Dampness and Ventilation in Inspected Single-Family Houses in Sweden. Int. Arch. Occup. Environ. Health 90 (7), 703–711. doi:10.1007/s00420-017-1233-z
Son, Y.-S., Lim, B.-A., Park, H.-J., and Kim, J.-C. (2013). Characteristics of Volatile Organic Compounds (VOCs) Emitted from Building Materials to Improve Indoor Air Quality: Focused on Natural VOCs. Air Qual. Atmos. Health 6 (4), 737–746. doi:10.1007/s11869-013-0207-x
Sun, C., Zhang, J., Guo, Y., Fu, Q., Liu, W., Pan, J., et al. (2018). Outdoor Air Pollution in Relation to Sick Building Syndrome (SBS) Symptoms Among Residents in Shanghai, China. Energy and Buildings 174, 68–76. doi:10.1016/j.enbuild.2018.06.005
Sun, Y., Hou, J., Cheng, R., Sheng, Y., Zhang, X., and Sundell, J. (2019). Indoor Air Quality, Ventilation and Their Associations with Sick Building Syndrome in Chinese Homes. Energy and Buildings 197, 112–119. doi:10.1016/j.enbuild.2019.05.046
Thevenet, F., Debono, O., Rizk, M., Caron, F., Verriele, M., and Locoge, N. (2018). VOC Uptakes on gypsum Boards: Sorption Performances and Impact on Indoor Air Quality. Building Environ. 137, 138–146. doi:10.1016/j.buildenv.2018.04.011
Tian, X., Zhang, S., Awbi, H. B., Liao, C., Cheng, Y., and Lin, Z. (2020). Multi-indicator Evaluation on Ventilation Effectiveness of Three Ventilation Methods: An Experimental Study. Building Environ. 180, 107015. doi:10.1016/j.buildenv.2020.107015
UNEP (2021). United Nation Environment Program. Available at: https://www.unep.org/.
Walgraeve, C., Demeestere, K., Dewulf, J., Van Huffel, K., and Van Langenhove, H. (2011). Diffusive Sampling of 25 Volatile Organic Compounds in Indoor Air: Uptake Rate Determination and Application in Flemish Homes for the Elderly. Atmos. Environ. 45 (32), 5828–5836. doi:10.1016/j.atmosenv.2011.07.007
Wang, H., Zheng, J., Yang, T., He, Z., Zhang, P., Liu, X., et al. (2020). Predicting the Emission Characteristics of VOCs in a Simulated Vehicle Cabin Environment Based on Small-Scale Chamber Tests: Parameter Determination and Validation. Environ. Int. 142, 105817. doi:10.1016/j.envint.2020.105817
Wang, Z., and Zhang, J. S. (2011). Characterization and Performance Evaluation of a Full-Scale Activated Carbon-Based Dynamic Botanical Air Filtration System for Improving Indoor Air Quality. Building Environ. 46 (3), 758–768. doi:10.1016/j.buildenv.2010.10.008
Wei, W., Ramalho, O., Malingre, L., Sivanantham, S., Little, J. C., and Mandin, C. (2019). Machine Learning and Statistical Models for Predicting Indoor Air Quality. Indoor Air 29 (5), 704–726. doi:10.1111/ina.12580
Wei, W., Ramalho, O., and Mandin, C. (2015). Indoor Air Quality Requirements in green Building Certifications. Building Environ. 92, 10–19. doi:10.1016/j.buildenv.2015.03.035
Xiong, J., Zhang, P., Huang, S., and Zhang, Y. (2016). Comprehensive Influence of Environmental Factors on the Emission Rate of Formaldehyde and VOCs in Building Materials: Correlation Development and Exposure Assessment. Environ. Res. 151, 734–741. doi:10.1016/j.envres.2016.09.003
Xiong, Y., Krogmann, U., Mainelis, G., Rodenburg, L. A., and Andrews, C. J. (2015). Indoor Air Quality in green Buildings: A Case-Study in a Residential High-Rise Building in the Northeastern United States. J. Environ. Sci. Health A 50 (3), 225–242. doi:10.1080/10934529.2015.981101
Yassin, M. F., and Pillai, A. M. (2019). Monitoring of Volatile Organic Compounds in Different Schools: a Determinant of the Indoor Air Quality. Int. J. Environ. Sci. Technol. 16 (6), 2733–2744. doi:10.1007/s13762-018-1838-0
Yu, C. W. F., and Kim, J. T. (2011). Building Environmental Assessment Schemes for Rating of IAQ in Sustainable Buildings. Indoor Built Environ. 20 (1), 5–15. doi:10.1177/1420326x10397780
Yu, C. W. F., and Kim, J. T. (2012). Long-term Impact of Formaldehyde and VOC Emissions from wood-based Products on Indoor Environments; and Issues with Recycled Products. Indoor Built Environ. 21 (1), 137–149. doi:10.1177/1420326x11424330
Zhang, X., Cao, J., Wei, J., and Zhang, Y. (2018). Improved C-History Method for Rapidly and Accurately Measuring the Characteristic Parameters of formaldehyde/VOCs Emitted from Building Materials. Building Environ. 143, 570–578. doi:10.1016/j.buildenv.2018.07.030
Zhang, Y., Liu, Y., Wu, Y., Niu, Y., Jiang, J., and Guan, H. (2020). “Double Exponential Decay Empirical Model for Indoor Building Materials TVOC Emissions,” in IOP Conference Series: Earth and Environmental Science, Majalengka, West Java, Indonesia, November 20-22, 2019 (IOP Publishing), 032043. doi:10.1088/1755-1315/446/3/032043
Zhang, Y., Wu, Y., Niu, Y., Liu, Y., and Jiang, J. (2020). “A Three-Exponential Decay Empirical Model of TVOC Emission from Indoor Building Materials,” in 2nd International Symposium on Architecture Research Frontiers and Ecological Environment (ARFEE 2019), Guilin, China, December 20-22, 2019 (EDP Sciences), 01018. doi:10.1051/e3sconf/202014301018
Keywords: indoor air pollutant source, building material, total volatile organic compounds (TVOC), formaldehyde (CH2O), Dubai
Citation: Arar M, Jung C and Qassimi NA (2022) Investigating the Influence of the Building Material on the Indoor Air Quality in Apartment in Dubai. Front. Built Environ. 7:804216. doi: 10.3389/fbuil.2021.804216
Received: 29 October 2021; Accepted: 30 December 2021;
Published: 28 January 2022.
Edited by:
Yuexia Sun, Tianjin University, ChinaReviewed by:
Jiying Liu, Shandong Jianzhu University, ChinaGraziano Salvalai, Politecnico di Milano, Italy
Copyright © 2022 Arar, Jung and Qassimi. This is an open-access article distributed under the terms of the Creative Commons Attribution License (CC BY). The use, distribution or reproduction in other forums is permitted, provided the original author(s) and the copyright owner(s) are credited and that the original publication in this journal is cited, in accordance with accepted academic practice. No use, distribution or reproduction is permitted which does not comply with these terms.
*Correspondence: Chuloh Jung, Yy5qdW5nQGFqbWFuLmFjLmFl