 Nitish R. Bastola
 Mena I. Souliman
 Samer Dessouky
 Raja Daoud1
- 1The University of Texas at Tyler, Department of Civil Engineering, Tyler, TX, United States
- 2The University of Texas at San Antonio, Department of Civil and Environmental Engineering, San Antonio, TX, United States
Various Departments of Transportation in the South-Central States and elsewhere have made extensive use of the Non-Destructive Testing (NDT) surface deflection bowl data. The falling weight deflectometer (FWD) test is a popular NDT-based test used by transportation authorities to evaluate the performance of flexible pavement. Nevertheless, it is rare to develop a method for evaluating pavement sections using FWD data from all sensors. There is a constant demand for DOTs and highway agencies to have a streamlined approach that can be applied directly to their databases. This research focuses on extending and verifying the concept of previously published area ratio parameters to the pavement section of South-Central States (Arkansas, Louisiana, New Mexico, Oklahoma, and Texas) in order to properly analyze pavement performance. Simulation-based deflections are employed to strengthen deflection-based parameters and minimize the need for lengthy FWD field testing. Ninety-seven pavement sections in these states are being investigated for the implementation and validation of simplified processes that will be widely accessible to different transportation authorities in order to assess pavement problems at the network level.
1 Introduction
In the whole of the United States, asphalt pavement constructions are the most prevalent kind of highways. Most transportation authorities are mostly concerned with the performance of pavement infrastructure. The performance of a pavement structure steadily declines as its age and traffic load rise. Several non-destructive methods (NDT) are used to evaluate the everyday performance of pavement constructions. The Falling Weight Deflectometer (FWD) test is one of the most well-known nondestructive testing (NDT) methods used in the United States and worldwide. Being straightforward and based on real field circumstances, the FWD test is one of the most favored types of tests for evaluating pavement structures (Smith et al., 2017). In the United States, FWD testing has a long history, and it is common to discover voluminous data kept in the country’s leading database, the Long-Term Pavement Performance (LTPP) database. Using the FWD data, several research concerning the performance monitoring of pavement constructions have been conducted (Souliman et al., 2018). Moreover, in the majority of transportation agencies, FWD data are often examined through arduous and time-consuming back-calculations. In network-level analysis, the simplified approaches for using FWD data to evaluate pavement performance are unavailable. However, Project 17PUTA02, entitled Simplified Approach for Structural Evaluation of Flexible Pavements at the Network Level, provided simplified procedures to assess the flexible pavement structures at the network level (Souliman et al., 2018). Under this project, various parameters encompassing a wider area of the deflection bowls were developed, and the study focused on the pavement sections in Texas. The study is the foundation for assessing the pavement conditions in all South-Central States: Arkansas, Louisiana, New Mexico, Oklahoma, and Texas.
In this study, several LTPP sections in Arkansas, Louisiana, New Mexico, Oklahoma, and Texas are evaluated for their fatigue performance in order to determine the structural state of the pavement. Ninety-seven sections are utilized and verified to formulate the deflection area parameters and their utilization in the network level of the pavement management system (PMS) database. An extensive categorization of each of the pavement sections is made eventually to simplify the performance prediction tasks for engineers and researchers so that the maintenance and rehabilitation tasks can be carried out at the optimum time. Furthermore, the utilization of software-based simulations reduces the FWD field tests and helps to analyze the pavement sections with ease.
2 Literature review
For the purpose of monitoring the performance of flexible pavement structures, many NDT techniques are used. The primary advantage of non-destructive testing is that it does not compromise the integrity of the structure, unlike prior methods such as field coring. Various NDT studies are used in the area of pavement engineering. Benkelman Beam and La Croix deflect graph, falling weight deflectometer (FWD), Dynaflect, the Road rater system, and the dynamic deflection device are a few noteworthy examples (Vij and Kumar, 2004). FWD is recognized as one of the world’s oldest and most prevalent forms of NDT-related examinations. The essential objective of FWD testing is the application of load to a pavement surface and the measurement of localized deflection. Similarly, the load applied at varied drop heights causes geophone sensors mounted at specific offsets from the load plate to record deflection data. Figure 1 illustrates the placement of the loading plate and sensor offset in a FWD device (Wilke, 2015). Each of the loading plates has its sensors to record the deflection, and eventually, a deflection bowl can be generated using the recorded deflections.
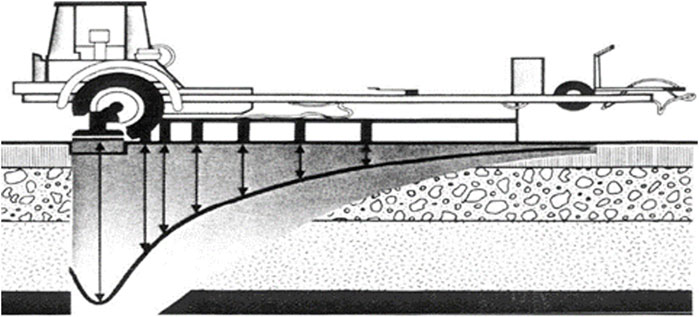
FIGURE 1. FWD device and sensors.
Remarkably, the FWD test has been one of the primary pavement monitoring tools in the United States for decades. To forecast the dynamic modulus of pavement layers, FWD measurements are analyzed using time-consuming back-calculation processes despite having been used for decades. Numerous researchers are developing bowl-based deflection parameters in an effort to provide a simpler method for use by transportation organizations.
Hossain and Zaniewski, in 1991, performed a characterization of falling weight deflectometer deflection basis. In their study, various parameters were developed for describing the structural characteristics of a pavement structure. The development was based on the non-destructive testing device. A curve in an exponential form, as presented in Eq. 1 was developed to fit the field deflections and the back-calculated deflections.
where Y is the surface deflection, and X is the offset distance of the center, while A and B denote the structural characteristics of the pavement.
A higher value of A represents the stiffer layer at the top. In contrast, the stiff subgrade is represented by a higher value of B. The developed procedure and fitting were utilized in judging the suitability of back-calculation in predicting the layer moduli, which is a time-consuming process (Hossain and Zaniewski, 1991).
In another study, Scullion introduced a new structural strength index in Texas’s pavement evaluation system (PES) (Scullion, 1988). Present Serviceability Index (PSI) and visual distresses were the prime factors in rating the pavement condition following this system. The utilization of deflection bowl parameters and mechanistic approach in the calculation process of the developed system made this index more promising to estimate the remaining service life of pavement sections at the project level. The conclusion was made under the report that under a load level of 9000 lbs, the structural strength index might assess pavement structure at the network level.
Similarly, Bryce et al. (2013) defined the structural conditions of the pavement in terms of the structural requirements of the pavement structure. The distress data and FWD measurements were utilized to develop decision approaches and indices. The study was based on the state of Virginia. Furthermore, numerous sensitivity analyses were performed, which revealed that the in-situ conditions were the prime factors influencing a flexible pavement structure (Bryce et al., 2013). Statistical correlation of central deflection and functional indicators such as Pavement Condition Rating (PCR) and International Roughness Index (IRI) was significantly less; however, a new structural-based condition index was developed for central deflection as presented in Eq. 2.
where d1 is the FWD central deflection and SSI is the structural strength indicator.
In addition, a study by Smith et al. (2017) was based on utilizing FWD data in the mechanistic and empirical design analysis of the pavement structures. Rehabilitation procedures for the flexible pavement structures with FWD data are discussed in this report and the review of pre-existing systems followed by the various transportation agencies. The back-calculation procedure for flexible and composite pavement structures is also reviewed. The whole of the study was found to be equally crucial for the researchers and agencies practicing the rehabilitation and management of pavement structures. However, the back-calculation procedures were equally challenging to be implemented at the agency level (Smith et al., 2017).
Additionally, Saleh (2015), Saleh (2016). Created more sophisticated metrics for evaluating the structural capability of pavement. Their research examined the evolution of deflection ratio (Dr), normalized deflection ratio (Dr’), area ratios (Ar), and normalized area ratio (Ar’) across 900 mm offsets in the deflection bowl. To establish area-based deflection parameters for the state of Texas, Souliman et al. (2018). took broader deflection bowls with 1524 mm offsets into account. In developing the area-based parameters, simulated deflection bowls were employed. Significant correlations between deflection and the newly established area ratio parameter demonstrate the reliability of the newly developed parameter. Eq. 3 displays the normalized comprehensive area ratio (CAr’) derived from this research.
where D0, D203, D305, D457, D610, D914, and D1524 are deflections measured at the center of the plate, 203, 305, 457, 610, 914, and 1524 mm from the center of the load plate, respectively.
Various tools related to pavement structural capacity assessments were also developed based on the study. The utilization of area ratio parameters to obtain the remaining service life of pavement structures and ranking the pavement sections based on the distress conditions were the two significant findings from the Tran-SET Project 17PUTA02 (Loganathan et al., 2019; (Loganathan et al., 2020; Bastola et al., 2021a). However, the project only focused on the pavement sections in Texas and subsequently required a broader verification. Therefore, a distinct approach in simplifying and verifying different deflection basin parameters using full deflection bowls is followed in this study. Eventually, a pavement ranking system is proposed utilizing the newly developed parameters. The chart (Figure 9) will facilitate DOTs and highway agencies to carry out the rehabilitation and maintenance work on time, spotting the critical sections in the network.
3 Goals and objectives
The primary goal of this study is to implement and validate a simple analysis method for determining the structural conditions of pavement sections at the network level. In addition, a simplified pavement health categorization chart is developed utilizing the FWD simulated deflection bowls and deflection parameters to facilitate pavement assets management at the network level.
4 Description of collected data
Initiated in the year 1987, Long Term Pavement Performance (LTPP) database has always been the largest pavement database under the Strategic Highway Research Program (SHRP) (Federal Highway Administration, 2020). This study utilizes various LTPP sections of five South-Central States in the United States to evaluate the proposed Comprehensive Area Ratio parameter developed under the project 17PUTA02 for effective utilization by various transportation engineers and officials in the early estimation of proper pavement rehabilitation and maintenance strategies. The following Figure 2 shows the South-Central States and the pavement sections considered in the study.
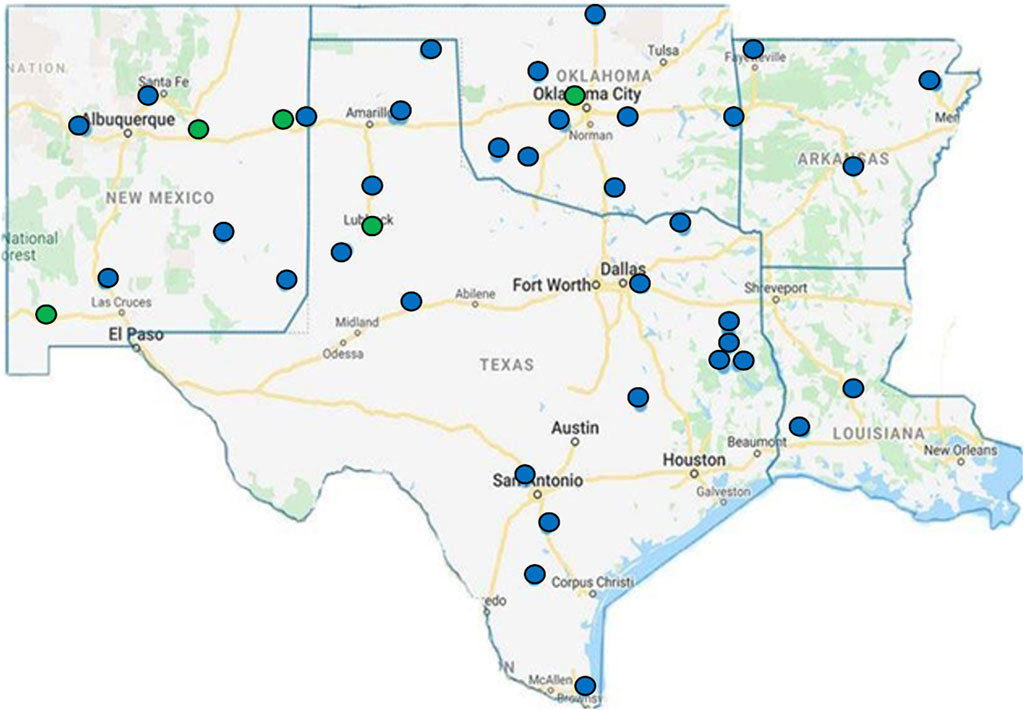
FIGURE 2. South-Central States and Pavement Sections considered in the study.
A total of 97 pavement sections were considered in this study (11 from Arkansas, 11 from Louisiana, 18 from New Mexico, 22 from Oklahoma, and 35 from Texas). The sections are chosen to represent a broader geographic location of the given states and concerning the availability of FWD and fatigue cracking at the same date. Active sections (green) and the out of study section (blue) were utilized in this study. The primary purpose of using both types of sections is to create the pavement section’s vast database to generate a state-inclusive classification chart. Out-of-study sections also represent valuable historical data to assess the pavement conditions during specific time frames. Furthermore, the data utilized in this study is the data associated with pavement deflection through FWD testing performed over the ranges of time; therefore, both section types can be fruitful for fulfilling the sole purpose of this study. Similarly, as mentioned earlier, the primary database for this study is LTPP; hence, it has been utilized to obtain the layer modulus and layer thickness. ANNACAP software had been used to obtain HMA elastic moduli. The approximation has been carried out to match the age of pavement sections during FWD testing. This was performed to have all the data of the same time frame. The soil classification data were utilized to get the properties of the base, sub-base, and sub-grade layers. The pavement sections utilized in the study had different layers. Some were typical four-layer systems, while others had numerous layers such as the asphalt layer, treated base, untreated base, treated subbase, untreated subbase, and subgrade. The properties associated with each of the layers are summarized in Table 1. The properties presented are the lowest to the highest range for the 97 pavement sections.
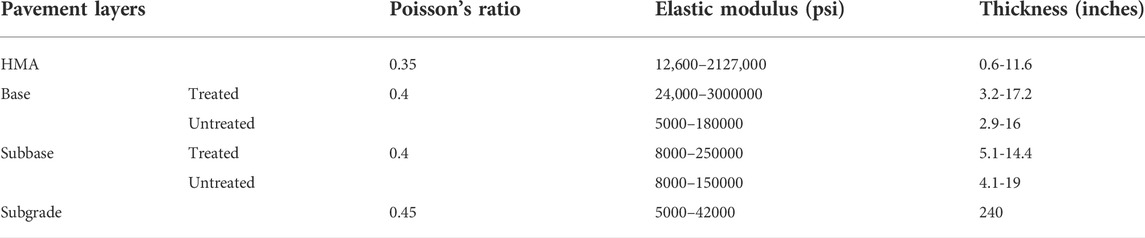
TABLE 1. Summary of the pavement structural layer properties.
5 Utilization of 3D-move analysis software package in simulating deflection bowls
The 3D-Move Software package is one of the most renowned flexible pavement structure analysis software tools. The open-source software developed and published by the University of Reno is recognized for its capacity to withstand fluctuating load circumstances. In addition to the Fourier transformation method, a continuum-based finite element methodology is applied to construct the program. Among the several benefits of using the 3D- Move Analysis software program is its capacity to handle complicated surface loadings and non-uniform tire pressures (2). Other sophisticated uses of the program include estimating pavement performance at intersections and under off-road agricultural tractors. The applications of the 3D-Move software package are not restricted to a select number of these features. In addition, the program could be used to analyze non-standard tire and axle configurations in a flexible loading configuration. Other sophisticated uses of the 3D- Move Software suite include modeling of 3D surface stresses, the influence of braking, and viscoelastic systems.
5.1 Analysis approach
In this subsection, the 3D-Move Analysis software’s full analysis technique is discussed. In this part, the step-by-step procedures for precisely calculating FWD testing using software are described. In addition, a static analytical technique is used to mimic FWD testing in the field. Since the study focuses on each drop load, only static loading conditions are presented. The 3D-Move software requires the following procedures to simulate the field-measured FWD deflection bowl. Figure 3 shows the flowchart for the entire process utilized in the simulation.
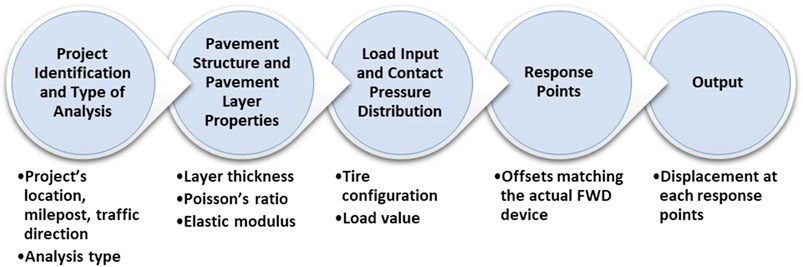
FIGURE 3. Flow chart for 3D-Move deflection simulation.
5.2 Project identification and type of analysis
In the 3D-Move Software package, the first step in assessing any pavement construction is to identify the project’s location for simple identification of the pavement sections encountered. Inputs particular to this part include project location, milepost, and traffic directions. Additionally, forms of analysis (Static/Dynamic) are included in this section. For a better simulation, the FWD plate loading situation is simulated using static analysis.
5.3 Pavement structure and pavement layer properties
Pavement sections are distinguished by their unique structures and layer thickness. Moreover, the material characteristics of the pavement at the layer systems are crucial to the pavement’s performance. In this section, the number of layers and their respective thicknesses are indicated. Other materials pertaining to modulus values and Poisson’s ratio are added after the corresponding layers. Moduli of elasticity were taken from the LTPP database. In contrast, for the purpose of consistency, the Poisson’s ratio was 0.35 for asphalt layers, 0.40 for base layers, 0.40 for subbase layers, and 0.45 for subgrade layers (Souliman et al., 2018; Bastola et al., 2021b).
5.4 Load input and contact pressure distribution
This section is a crucial part of any 3D-Move analyzing technique. This ection details the necessary load for conducting the analysis. For allocating the configuration of tires in any study, the program provides six distinct alternatives (A to F). Since configuration type B is based on a single load type and the FWD test matched such a setup, it was determined to be the optimal configuration for the study. In this part, the definition of the contact area and the application of loads are done concurrently. Each load is coupled with its own drop height. The predominance of four kinds of loads necessitated four distinct studies for each area. The desired load for the study was derived from the stress produced during FWD testing and the area of the load plate (300 mm in diameter). In field FWD devices, a circular contact area was eventually selected to match the load plate.
5.5 Response points
Multiple offsets from the center point of the load plate to the whole test section define a FWD test device. Therefore, the software simulations need the precise offset of the sensor in order to precisely assess and forecast the FWD test. As the reaction point for analysis by the 3D-Move,
As the reaction point for analysis by the 3D-Move, the reaction points were put at distances of 0mm, 203mm, 305mm, 457mm, 610mm, 913mm, and 1524 mm to simulate the real FWD test.
5.6 3D-move software outputs
The 3D-Move program provides several outputs, including strain, stress, and displacement at any given position in the pavement layers. However, the primary objective of this research project is to develop and mimic FWD deflection bowls using displacement data.
5.7 Comparison of the 3D-move simulated deflection, actual FWD test deflection and field-based deflection bowls
As previously indicated, the LTPP database stores innumerable FWD test results as deflection bowls. Using the simulation capabilities of the 3D-Move software package, a similar deflection bowl was obtained. A plot between the LTPP deflection bowls and the bowl simulated by software has been shown to aid comparisons. It has been noted that comparable deflection-related software results have been obtained. Although certain sections have deflection deviation, it could be checked by temperature and any other required modifications (Chen et al., 2000). Figure 4 shows the field-measured FWD deflection bowl in comparison to the simulated FWD using the 3D-Move Analysis software package.
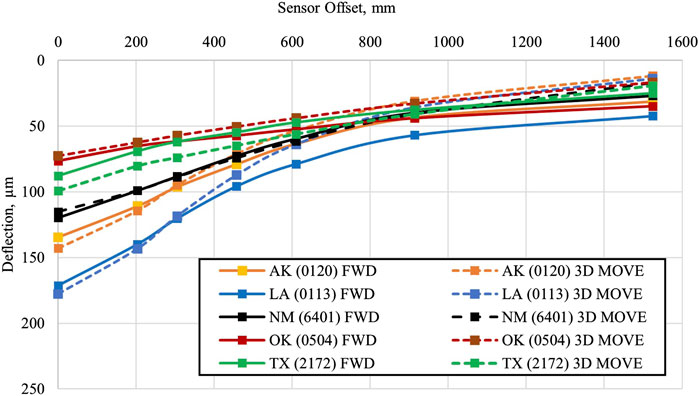
FIGURE 4. Comparison of Deflection observed for different states based on 3D-Move and FWD.
Presented data imply that 3D-Move may be used for FWD-based deflection prediction on a variety of pavement structures. Therefore, 3D-Move may be exploited by pavement engineers interested in discovering deflection-induced effects, since software replications of pavement and genuine FWD testing were highly similar and yielded comparable results.
The deflection value in the center of the load plate has a greater significance in determining the pavement’s condition. This is due to the fact that load plate deflection is maximal at the plate’s center and decreases away from it. The deflection beneath the load plates is specified as the central deflection and denoted as D0, which corresponds to the real corresponding deflection (D0) from the FWD testing. Figure 5 provides a comparison of the simulated real D0 of all the states (Arkansas, Louisiana, New Mexico, Oklahoma, and Texas). Similarly, the 3D-Move computed deflection bowls are compared to the real FWD test, as illustrated in Figure 6.
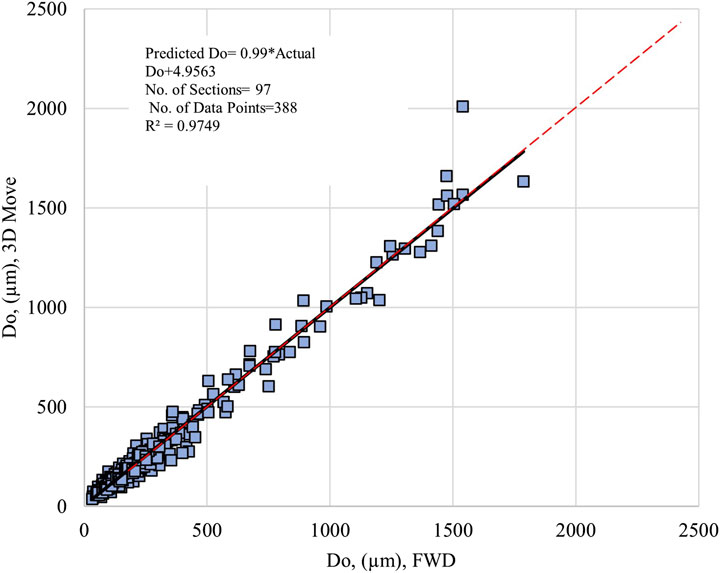
FIGURE 5. Measured FWD versus simulated 3D-Move central deflections for the South-Central States.
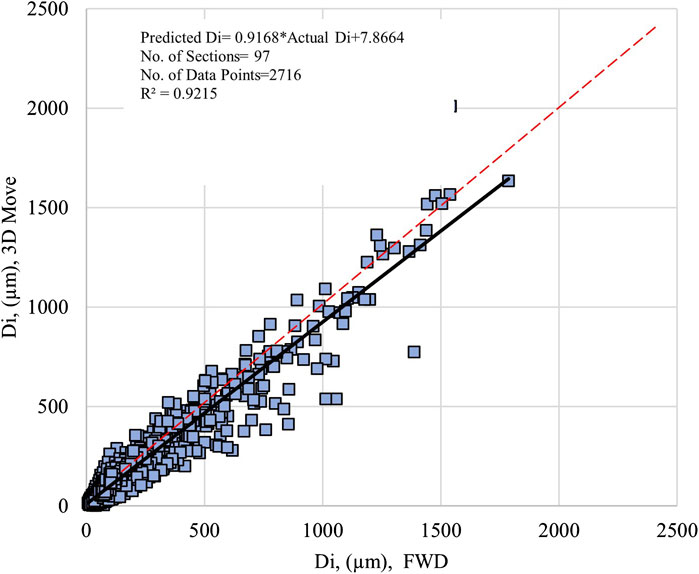
FIGURE 6. Measured FWD versus simulated 3D-Move all point deflections for the South-Central States.
It was noticed that the deflection received from 3D-Move Analysis was significantly associated with the deflection obtained from the FWD test conducted in the field. The comparison of D0 demonstrated a greater coefficient of determination (R2) than the comparison of the whole deflection bowls. These increased degrees of accuracy demonstrate the dependability of 3D-Move software in predicting and simulating the deflection and modeling of deflection bowls.
6 Simplified deflection parameters
The simulated deflection data are used to construct simplified parameters for evaluating a section of pavement. Using simulated deflection values, the comprehensive area ratio (CAr) and normalized comprehensive area ratio are the crucial parameters derived in this research.
6.1 Comprehensive area ratio
In this approach, the area beneath the deflection bowl is subdivided into several subdivisions, with each subdivision’s area that is represented by the equation below. In this study, as stated in Eq. 4, the trapezoidal area beneath the deflection bowl is examined. It is known as the Comprehensive Area under Pavement Profile (CAPP).
where D0, D203, D305, D457, D610, D914, and D1524 are the deflections data at the plate’s center, 203, 305, 457, 610, 914, and 1524 mm from the center of the load plate, respectively.
Similarly, the minimum magnitude of the deflections measured at various sensor offsets for a strong pavement section would differ from the deflection reported at the plate’s center. For a stiff pavement segment, the deflection is constant along the entire length (i.e., D0 = D203 = D305 = .... = D1524). Eq. 5 shows the Comprehensive Area under Pavement Profile (CAPP) of an imaginary pavement section deflection bowl.
Consequently, a comprehensive area ratio (CAr) is calculated by dividing the CAPP of the pavement section by the CAPP of the imagined pavement. Eq. 6 is the simplified form of the CAr formula. The area of a strong section will be greater than that of a weak section, and CAr will be less weak. A weak section may have a CAr value of 0.1, whereas a strong part has a CAr value of close to 1.0.
Two SHRP pavement sections (0114 and 3071) of the state of Arkansas were compared, as presented in Figure 7. It was observed that the imaginary rigid pavement area covered by section 0114 was less than section 3071, reflected in CAr values of 0.18 and 0.67, respectively.
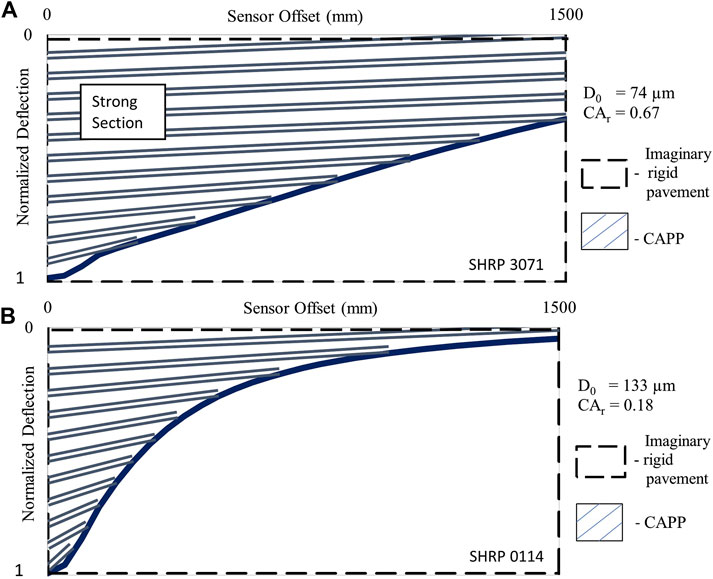
FIGURE 7. Normalized area of deflection profiles for SHRP sections: (A) 3071 and (B) 0114.
6.2 Normalized comprehensive area ratio
The area ratio parameter provided a superior method for evaluating the structural integrity of pavement, despite the fact that it did not account for the various target loads. Consequently, a combination of area ratio and central deflection is provided to indicate the influence of various target loads. The parameter was normalized by dividing the parameter for the area ratio by the value for the central deflection. Eq. 7 (previously mentioned eq. 3) was found to be highly effective in analyzing the structural capability of flexible pavements.
The area ratio was incapable of appropriately accounting for load variations. It was observed that various target load levels were too low for distinguishing the structural properties of pavement sections. Figure 8 depicts the deflection bowl observed for Arkansas section 0113. Despite fluctuations in deflection, a constant CAr was detected regardless of the load levels. The data indicate that the structural performance of the pavement was inadequate.
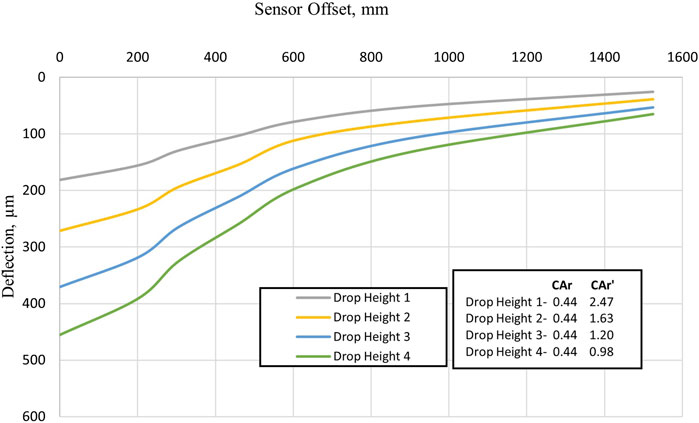
FIGURE 8. An illustration of the importance of CAr and CAr’ based on AK SHRP 0113.
Clearly, a pavement segment must respond differently to varied drop load levels, but this was not accomplished with CAr. Nevertheless, the newly established parameter CAr’ might account for the variation in pavement section and drop heights. CAr’ varies from 2.47 to 0.98 for Arkansas section 0113, indicating that it can be used as a parameter for evaluating the structural health state of pavement. The utilization of these specified parameters enables an accurate evaluation of pavement conditions based on experienced deflection.
6.3 Sensitivity of normalized comprehensive area ratio to asphalt layer thickness
Different pavement sections accounted for in this study had different asphalt layer thicknesses. The thickness ranged from 1.4 to 14.8 inches and the average thickness observed for all the 97 sections was 7 inches. Therefore, pavement sections were categorized into two groups based on the average thickness presented in Figure 9. The effect of thickness on the newly developed parameter was considered utilizing the 97 sections. Fifty pavement sections have a thickness greater than 7 inches, and they have the average CAr’ value of 3.32. On the other side, the relatively thin pavement sections have a lower value of CAr’ as 2.65. The following chart (Figure 9) present the comparison following the thickness and developed parameters.
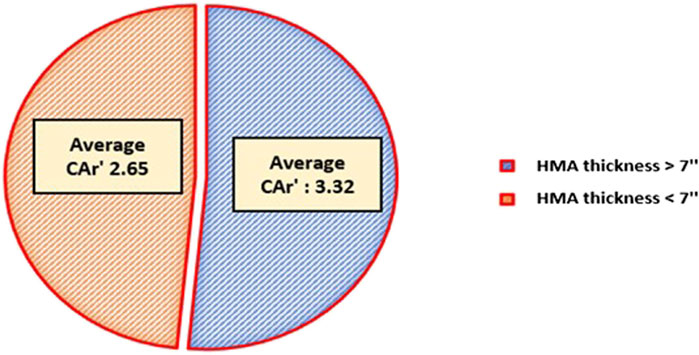
FIGURE 9. Average values of normalized comprehensive area ratio normalized comprehensive deflection ratio (CDr’) based on asphalt layer thickness.
CAr’ effectively accounts for the thickness of the HMA layer, which plays a significant role in the efficient performance of any pavement section. It is important to note that the thinner section might not be weak, as the pavement weakness is mainly governed by the accumulated distresses.
7 Development of pavement health classification scale based on observe field fatigue cracking
Various deflection parameters were developed based on the simulated deflection bowls for 97 pavement sections of the South-Central States. Normalized Comprehensive Area Ratio (CAr’) was effective and reliable parameter to assess the structural conditions of pavements structures. Furthermore, various distresses were compared to these newly developed parameters to develop a pavement overall health classification scale. Structural distresses, such as fatigue cracking, were thoroughly studied and correlated with such parameters. Fatigue failure is often characterized as the area of occurrence in any pavement section. It is essential to know that the higher fatigue failure refers to a structurally weak section.
The developed parameters were correlated with measured fatigue for categorizing and creating a scoring scale to rank the pavement sections. The relationship is shown in Figure 10. Ninety-seven sections from the South-Central States were accounted for the generation of pavement ranking scale, and a coefficient of determination of greater than 0.7 was observed. The relationship between fatigue cracking and CAr’ was found to be reliable as it encompasses different pavement structures throughout the South-Central states with a relatively high coefficient of determination. Furthermore, a pavement section with lesser CAr’ exhibits higher fatigue cracking extent as expected, proving the ability of the developed parameter to predict the conditions of the pavement structure effectively. Also, unlike the deflection ratio and pavement area ratio, the new scale distinguished the drop load effects, and the variations were observed based on different drop loads. An excellent pavement section concerning drop height 1 had the CAr’ value of greater than 6, and a very good pavement section concerning drop height 4 has the CAr’ of 2.4. This example signifies that load-induced effects are accounted for in the newly developed scale. Figure 10 shows the newly developed scale based on the different drop heights. Each drop height and drop load can be easily matched with the traffic-induced pavement loading for the pavement performance prediction.
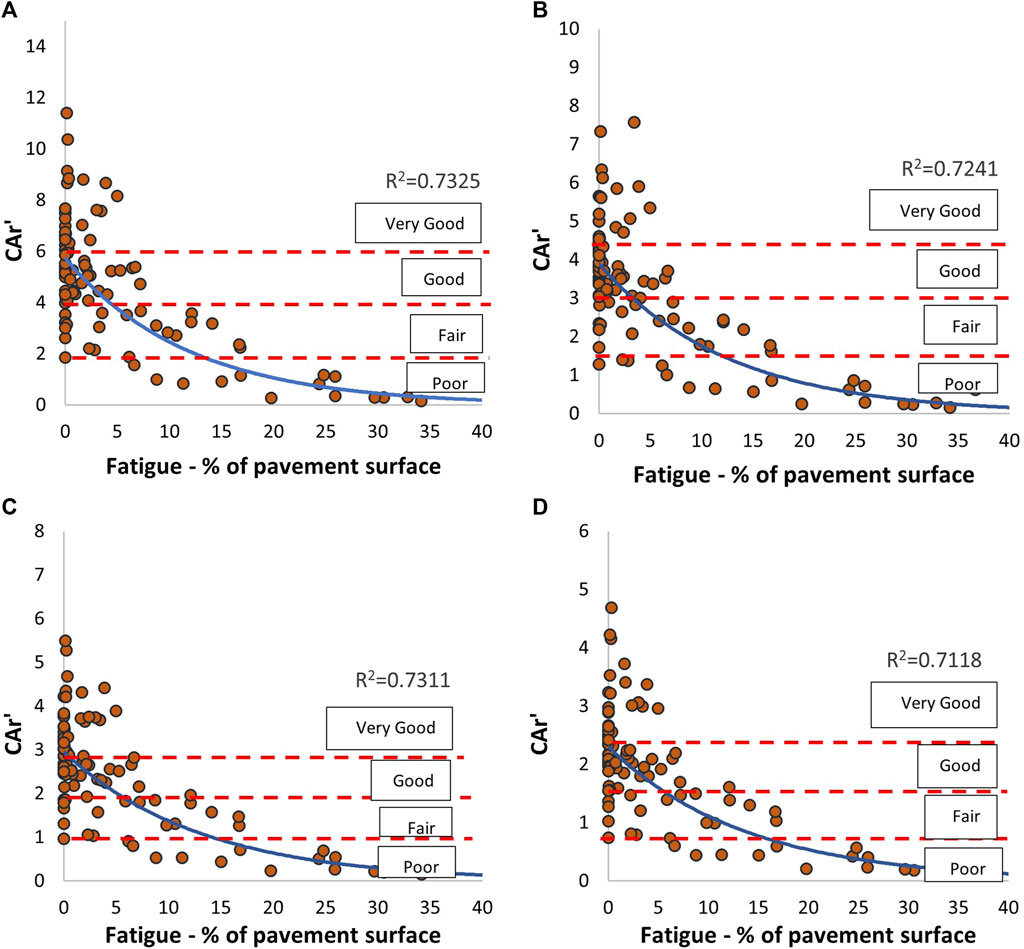
FIGURE 10. Pavement categorization scale based on fatigue cracking and comprehensive area ratio: (A) Drop Height 1, (B) Drop Height 2, (C) Drop Height 3, and (D) Drop Height 4.
7.1 Classification of pavement sections based on normalized comprehensive area ratio
(CAr')
A classification scale was developed based on the illustration in Figure 10 presented above, and the pavement sections are categorized into very good, good, fair, and poor pavement sections. The load levels at each drop height were utilized to generate the scale. Furthermore, the ranges were fixed in such a way that the pavement conditions match one drop load level to another. An actual load in the pavement section can be matched with the target load level for effectively obtaining the resultant performance due to the prevalent traffic loadings. The developed scale is shown in Table 2.
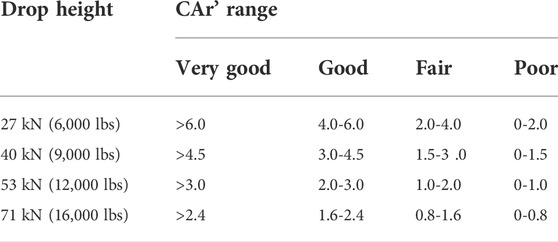
TABLE 2. CAr’ Range for different categories of the pavement structure.
The range of CAr’ to be utilized in any flexible pavement is presented in the above table. The pavement section, which has CAr’ values greater than six, is considered very good, while the section having the CAr’ in the range of 4–6, 2-4, and 0–2 can be categorized as good, fair, and poor section respectively under the target load of 27 KN. The categorization scale is produced in such a way that the category of the pavement section remains unchanged irrespective to the drop loads. Each other target load has its own CAr’ range. Furthermore, a validation can be presented utilizing the scale developed with four sections to compare the structural properties and pavement conditions. SHRP sections 0124, 0507, 4161, and AA63 of Oklahoma are being used in such comparisons at drop height 1. It is evident that section 0124 must be structurally sound due to its physical properties and lesser fatigue percentages. The following table compares different properties of the considered pavement sections in terms of elastic modulus, thickness, fatigue percentage, and CAr’. The differentiation is crucial as it provides basic knowledge in understanding the significance of developed pavement comprehensive area ratio categorization scales.
As presented in Table 3, it is observed that all pavement systems are different due to their pavement structures. SHRP section 0124 comprises two asphalt layers, treated and untreated base layers, with subbase and subgrade layers. Other sections 0507, 4161, and AA63 had two asphalt layers, base layers, and subgrade layers. Section 0124 has a lesser fatigue percentage and higher stiffness modulus for all the layers leading to the categorization of the pavement in a very good class. The pavement sections 0507, 4161, and AA63 had a lower stiffness value with increasing fatigue, and CAr’ is reducing gradually. Therefore, the newly developed categorization scale includes the pavement sections properties and the fatigue distress occurrence. Hence, the developed classification scale is successful and reliable to include pavement practiced throughout. Figure 11 represents pavement classification in South-Central states with the newly developed scale, and different colors represent different structural health conditions of the analyzed pavement structures. The classification is based on the newly developed classification scale.
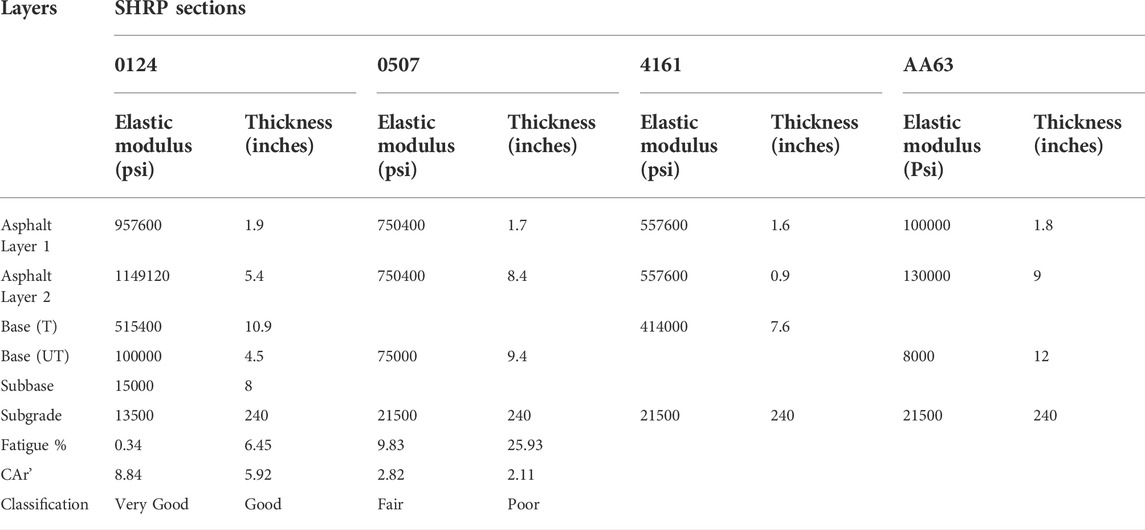
TABLE 3. Pavement sections comparison based on the new scale.
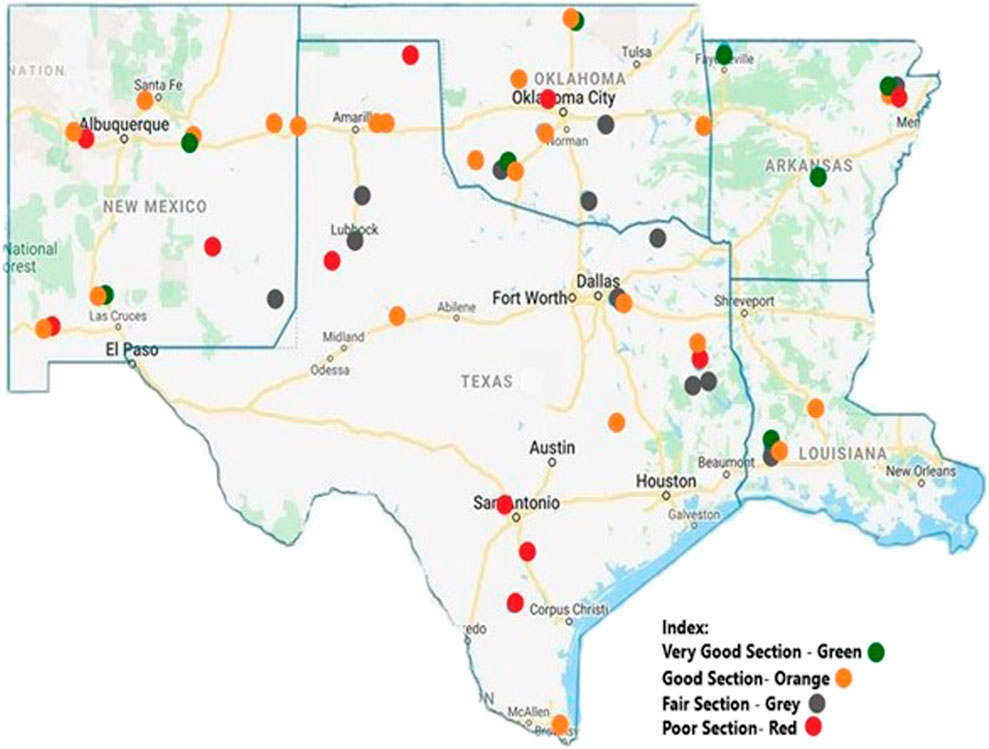
FIGURE 11. Classification of pavement structures with newly developed scale.
8 Conclusions and recommendations
The utilization of the FWD tests for assessing pavement conditions has been practiced for decades. FWD surface deflection bowl data is often utilized to identify the structural condition of the flexible pavement sections. However, there are only a few simple procedures to identify the pavement sections utilizing the FWD data. The previously developed methods were based on the single deflection point measured at a certain distance from the load plate. The utilization of a single deflection may result in an erroneous evaluation as the entire deflection bowls are not considered. Therefore, in this study, 97 LTPP pavement sections are utilized to come across a simplified deflection-based method and the following findings were derived from the study.
• 3D-Move Analysis software package was utilized in simulating the actual FWD test, and it was observed that the simulated and actual deflection bowls were highly correlated.
• The area ratio parameter known as normalized comprehensive area ratio (CAr’) was developed and introduced to evaluate the entire pavement structure using the simulated deflection bowls. CAr’ was normalized in such a way that it reflects the effect of different drop loads.
• The structural capacity of pavement in the South-Central States at the network level was easily assessed with the development of a classification scale. The classification scale can categorize the pavement section as very good, good, fair, and weak pavement sections.
Hence, the developed parameter and the categorization scale can be beneficial tools for transportation agencies to decide on pavement structural conditions. Based on the suggested process, the most appropriate technique for pavement maintenance and rehabilitation may be simply selected. The established area ratio parameter can be an effective tool for network-level analysis of flexible pavement structures using FWD data. The parameter is created to utilize the abundant FWD surface deflection bowl data obtained by various DOTs and are processed as received. Temperature and hard rock effect corrections may refine the correlation obtained with multiple factors. The utilization of these corrections is highly recommended for further study.
Data availability statement
The raw data supporting the conclusion of this article will be made available by the authors, without undue reservation.
Author contributions
The authors confirm contribution to the paper as follows: study conception and design: NB, MS, SD; data collection: NB, MS, SD; analysis and interpretation of results: NB, MS, SD, RD; draft manuscript preparation: NB, MS, SD, RD. All authors reviewed the results and approved the final version of the manuscript.
Acknowledgments
The authors would like to acknowledge the USDOT Transportation Consortium of the South-Central States (TRAN-SET) for the funding and necessary support in completing the research.
Conflict of interest
The authors declare that the research was conducted in the absence of any commercial or financial relationships that could be construed as a potential conflict of interest.
Publisher’s note
All claims expressed in this article are solely those of the authors and do not necessarily represent those of their affiliated organizations, or those of the publisher, the editors and the reviewers. Any product that may be evaluated in this article, or claim that may be made by its manufacturer, is not guaranteed or endorsed by the publisher.
References
Bastola, N. R., Souliman, M. I., Zeiada, W., Helal, H. I., and Mohammad, Z. A. (2021a). Evaluating the structural capacity of flexible pavements at the network level using layered elastic analysis. Innov. Infrastruct. Solut. 6, 153. doi:10.1007/s41062-021-00514-z
Bastola, N. R., Souliman, M. I., and Dessouky, S. (2021b). “Utilization of finite element analysis towards the evaluation of the structural capacity of flexible pavements,” in International Airfield and Highway Pavements Conference.
Bryce, J., Flintsch, G., Katicha, S., and Diefenderfer, B. (2013). Developing a network-level structural capacity index for asphalt pavements. J. Transp. Eng. 139, 123–129. doi:10.1061/(asce)te.1943-5436.0000494
Chen, D., Bilyeu, H., Lin, J., and Murphy, M. (2000). Temperature correction on falling weight deflectometer measurements. Transp. Res. Rec. 1716, 30–39. doi:10.3141/1716-04
Federal Highway Administration (2020). Introduction to the LTPP information management system (IMS). Available at https://www.fhwa.dot.gov/publications/research/infrastructure/pavements/ltpp/reports/03088/01.cfm.
Hossain, A. M., and Zaniewski, J. P. (1991). Characterization of falling weight deflectometer deflection basin. Transp. Res. Rec.
Loganathan, K., Isied, M. M., Coca, A. M., Souliman, M. I., Romanoschi, S., and Dessouky, S. (2020). Estimated remaining fatigue life of flexible pavements based on the normalized comprehensive area ratio deflection parameter. Can. J. Civ. Eng. 47 (5), 546–555. doi:10.1139/cjce-2019-0023
Loganathan, K., Isied, M. M., Coca, A. M., Souliman, M., Romanoschi, S., and Dessouky, S. (2019). Development of comprehensive deflection parameters to evaluate the structural capacity of flexible pavements at the network level. Int. J. Pavement Res. Technol. 12, 347–355. doi:10.1007/s42947-019-0041-0
Saleh, M. (2016). A mechanistic-empirical approach for the evaluation of the structural capacity and remaining service life of flexible pavements at the network level. Ottawa, Canada: NRC Research Press.
Saleh, M. (2015). Utilization of the deflectograph data to evaluate pavement structural condition of the highway network.
Scullion, T. (1988). Incorporating a structural strength index into the Texas pavement evaluation system. College Station, Texas, USA: Texas Transportation Institute.
Smith, K. D., Bruinsma, J. E., Wade, M. J., Chatti, K., Vandenbossche, J. M., and Yu, H. T. (2017). Using falling weight deflectometer data with mechanistic-empirical design and analysis. Illinois: Final Applied Pavement Technology Inc.
Souliman, S., Romanoschi, S., Dessouky, S., Loganathan, K., and Isied, M. (2018). Simplified approach for structural evaluation of flexible pavements at the network level. Baton Rouge, Louisiana, USA: Transportation Consortium of South-Central States.
Vij, G., and Kumar, P. (2004). Non-destructive testing methods in highway engineering. New Delhi, India: Indian Road Congress.
Keywords: pavement structural health, pavement categorization, software simulations, deflection bowl, deflection parameters
Citation: Bastola NR, Souliman MI, Dessouky S and Daoud R (2022) Structural health assessment of pavement sections in the southern central United States using FWD parameters. Front. Built Environ. 8:1026469. doi: 10.3389/fbuil.2022.1026469
Received: 23 August 2022; Accepted: 10 October 2022;
Published: 24 October 2022.
Edited by:
Huayang Yu, South China University of Technology, ChinaReviewed by:
Xu Cai, Guangzhou University, ChinaWenke Huang, Guangzhou University, China
Xiaolong Sun, Guangdong University of Technology, China
Niya Dong, South China University of Technology, China
Copyright © 2022 Bastola, Souliman, Dessouky and Daoud. This is an open-access article distributed under the terms of the Creative Commons Attribution License (CC BY). The use, distribution or reproduction in other forums is permitted, provided the original author(s) and the copyright owner(s) are credited and that the original publication in this journal is cited, in accordance with accepted academic practice. No use, distribution or reproduction is permitted which does not comply with these terms.
*Correspondence: Mena I. Souliman, bXNvdWxpbWFuQHV0dHlsZXIuZWR1