 Jabulani Matsimbe
 Wisdom Mdolo3
- 1Centre for Applied Research and Innovation in the Built Environment (CARINBE), Faculty of Engineering and the Built Environment, University of Johannesburg, Johannesburg, South Africa
- 2Department of Civil Engineering Science, Faculty of Engineering and the Built Environment, University of Johannesburg, Johannesburg, South Africa
- 3Department of Mining Engineering, Malawi University of Business and Applied Sciences, Blantyre, Malawi
- 4Department of Land Surveying, Malawi University of Business and Applied Sciences, Blantyre, Malawi
Despite drones being successfully utilized for monitoring and detecting hazards in mines, there is limited research on their application for open-pit stockpile volumetric computation compared to traditional methods. Furthermore, time, cost, and safety have challenged the use of the traditional approach. Present study aims to fill the gaps by conducting a comparative analysis of stockpile volumetric computation utilizing a drone and traditional approach. A mapping framework is proposed to guide mine personnel on how to conduct open-pit stockpile volumetric computations. The methodology comprises using a drone and traditional survey approach to measure the volume of a known quarry stockpile. Drone-captured images are processed in Pix4D mapper software and geometric techniques are applied to the traditional survey approach. Findings show that the smaller the error of the checkpoints the more accurate the generated model making the measurements reliable. The generated Pix4D quality report showed a root mean square error of 0.019. The drone percentage error to the actual volume is 2.6% while the traditional approach is 1.3%. Both estimations are less than the maximum allowable percentage error of ± 3%. Therefore, compared to the traditional approach drone technology provides an accurate, cost-effective, fast, and safe working distance suitable for stockpile volumetric computations in open pit quarries.
1 Introduction
Unmanned airborne systems (UAS) have the potential to revolutionize the science and practice of remote sensing, and most particularly the utilization of Small-UAS enables a range of novel remote sensing capabilities (Lippitt and Zhang, 2018). Drone technology is significantly being used in the infrastructure industry to boost efficiency and productivity. Digital innovation technology is among the developmental drivers of the (4IR) fourth industrial revolution (Gambo and Musonda, 2021). Integration of drones and building information modeling technology supports industry 4.0 (Musonda and Pillay, 2019). Raphaelson (Raphaelson, 2019) utilized a drone for construction work inspection, safety monitoring, and hazard detection. Carvajal (Carvajal et al., 2012) characterized landslides on a road embankment using drone technology. Farhadmanesh et al. (Farhadmanesh et al., 2021), reviewed the applicability of LiDAR and photogrammetry in highway asset and pavement condition management. The findings showed the superiority of mobile LiDAR for highway asset inventorying and the possibility of having photogrammetry as a reliable alternative technology only in favorable illumination conditions. El Meouche (El Meouche et al., 2016) utilized a drone to develop a plan satisfactory with an error of 1cm–4 cm. Singh (Singh, 2018) used a drone to map a 100-ha site within 40–120 min, while traditional land surveying took hours for the same site. Their study justified the usage of drones for surveying and mapping in India due to cost-effectiveness, time-saving, risk reductions, access to remote locations, and improved data resolution. Figure 1 shows a schematic of a centralized remote operating center utilizing drone technology to monitor progress on various projects. By 2026, commercial drones are projected to contribute US$31 billion to US$46 billion to the US gross domestic product (Ficci, 2018). A compound annual growth rate of 18% is projected in the Indian drone market within 2017–2023.
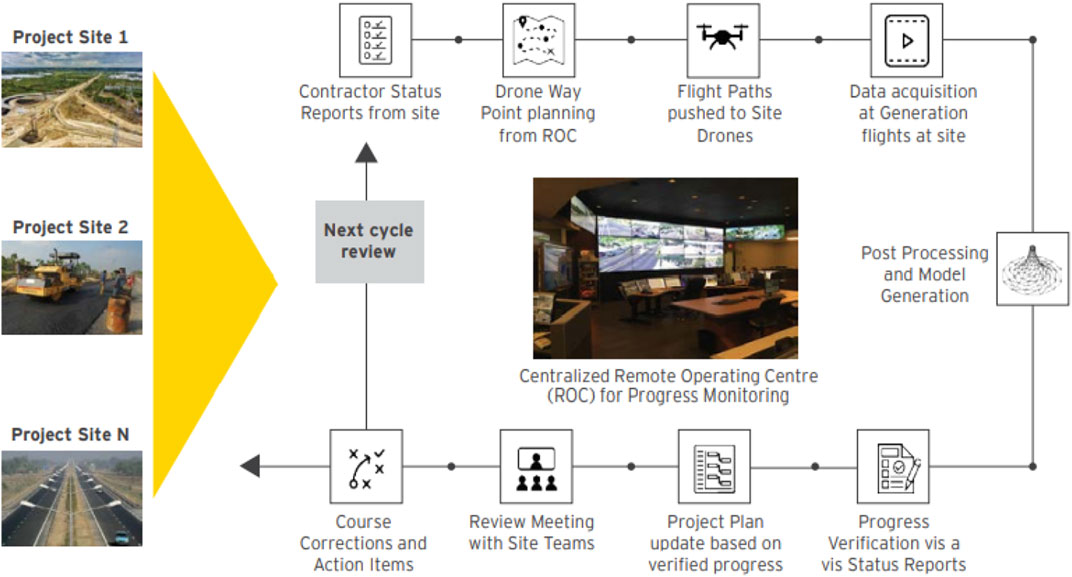
FIGURE 1. Schematic of a remote operating command center (Ficci, 2018).
In quarrying like any other mining activity, volumetric computation is an important aspect for payment purposes. The quantity of rock aggregates being produced helps in mine planning to meet targets and minimize delays (Matsimbe, 2020). The volume of the materials produced is the primary information needed by mine site managers to determine how much contractors should be paid on a material-moved basis, know how much more materials are needed to meet client needs, know the amount of space required for storage, and prepare land reclamation plans with respect to backfilling. Therefore, mining companies need to adopt a technologically fast and low-cost alternative for calculating aggregate stockpile volume. Geodesy utilizing GPS, GNSS, total station, aerial/terrestrial photogrammetry, laser scanning, and measuring tape are some of the traditional methods used to obtain surveying information on a mining site (Tucci et al., 2019). Most of these methods are time-consuming, expensive, and unsafe for surveyors (Stockpile, 2018). Mazhrakov (Mining Engineering, 2007) suggests the adoption of faster and more reliable methods for land surveying. Ref (Raeva et al., 2016). observed that traditional terrestrial methods present extremely precise measurements for volume calculations but are time-consuming, expensive, laborious, and unsafe in difficult terrain. Quarrying has greatly contributed to the production of rock aggregates which are essential construction materials for infrastructure development. Effective planning and management of quarry mines are essential to maximizing productivity (Raeva et al., 2016). The quarry business is usually driven by the volume of blasted aggregate quantities. Therefore, site managers need to know how much stockpile material is available and how much blasting is needed to meet aggregate demand. According to (Saba et al., 2021), material stockpiles assume different shapes that require a formula for volume computation. Nowadays, both terrestrial and satellite techniques are used for geodetic surveys (Stockpile, 2018). The disadvantage is that very precise terrestrial measurements are extremely time-consuming and unsafe (Patikova, 2004). Tacheometry is commonly used for volume calculation in surveying and involves the determination of a significant area and height at the survey surface (Remondino et al., 2006).
Remote sensing methods capture topographical data without physical contact with objects e.g., LiDAR, laser scanning, and photogrammetry (Francioni et al., 2018). A smartphone is another effective photogrammetric remote sensing tool for geotechnical mapping (Matsimbe, 2021). These remote methods quickly cover a wide area at a low cost and do not expose the working personnel to unsafe site conditions (Pérez et al., 2013); (Nex and Remondino, 2014); (Kardasz and Doskocz, 2016). It also has great potential in disaster and road traffic monitoring (San et al., 2008); (Austin, 2010). Mashhadi (Hassandokht Mashhadi et al., 2022) investigated the feasibility of using Nebulizer-Retrofitted UAVs (DJI Agras MG-1S drone) in controlling air pollution and reducing heat stress at construction sites. The findings showed that the average wet bulb globe temperature decreases by 1.7° during the flight phase compared to average values for the preflight and postflight phases. Figure 2 shows drones commonly utilized in the mining industry.
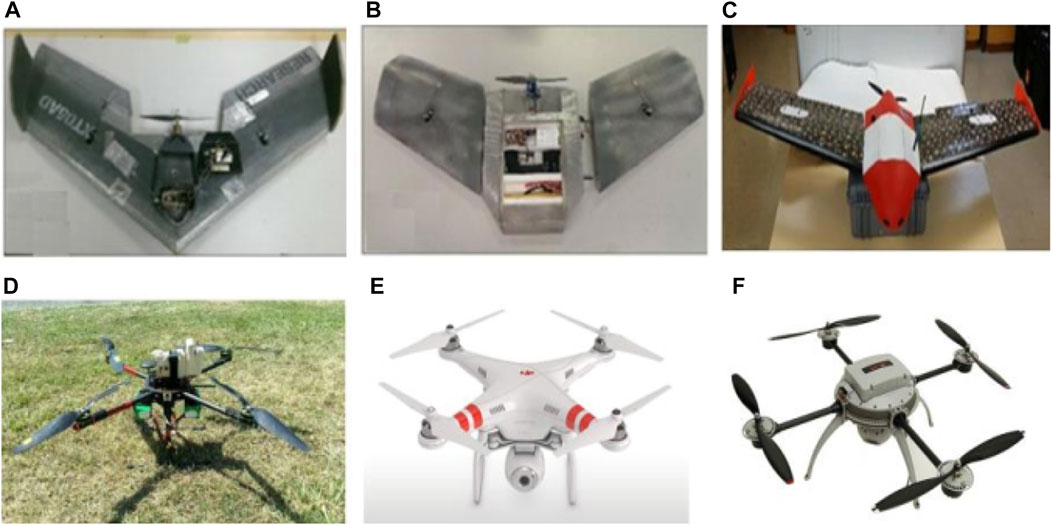
FIGURE 2. Drones commonly utilized in the mining industry (Esposito et al., 2017): (A) Teklite, (B) GoSurv, (C) Swamp fox, (D) Quadcopter, (E) Phantom 2 + Vision, (F) Aeryon Scout.
Photogrammetry derives the 3D shape of an object from the collected multiple 2D photographs (Esposito et al., 2017); (Luhmann et al., 2019). The commonly used photogrammetric software for volume calculation and three-dimensional modeling comprises Pix4D Mapper developed by Pix4D Swiss Software Company in Switzerland, DroneDeploy developed by Jono Millin, Michael Winn, and Nicholas Pilkington in the United States of America, Autodesk Recap Photo developed by Autodesk in the United States of America, Agisoft PhotoScan/Metashape developed by Agisoft LLC in Russia, RealityCapture developed by Capturing Reality in Slovakia, SimActive developed by SimActive Inc. in Canada, Blender developed by NeGeo in the Netherlands, 3DFlow developed by University of Verona in Italy, 3Dsurvey developed by 3Dsurvey Organization in Slovenia, and PrecisionHawk developed by Christopher Dean and Ernest Earon in Canada. Once the images are captured, they are loaded into the computer software programs for processing, and a 3D model is produced on which various measurements are done (Chen et al., 2020). Arango et al. (Arango and Morales, 2015), conducted a study to compare the volume calculated from a DJ Phantom 2 UAV to a Leica 2 total station. Raeva et al. (Raeva et al., 2016), conducted a study to compare the use of drones and GPS in measuring the volume of an open pit quarry stockpile. Tucci et al. (Tucci et al., 2019), conducted a study in Italy to compute the volume of stockpiles of waste materials using UAV photogrammetric surveying. The data was collected using a UAV, and the point clouds from a 3-dimensional model using a laser scanner.
Fitspatrick (Fitzpatrick, 2015) suggests that UAS-based surveys are time and cost-effective. The study compared traditional and UAS-based approaches. The results indicate that traditional approaches are time-consuming as opposed to UAS approaches. Further to that, the cost of utilizing UAS-based approaches is cheaper than traditional approaches. These findings are summarised in Table 1.
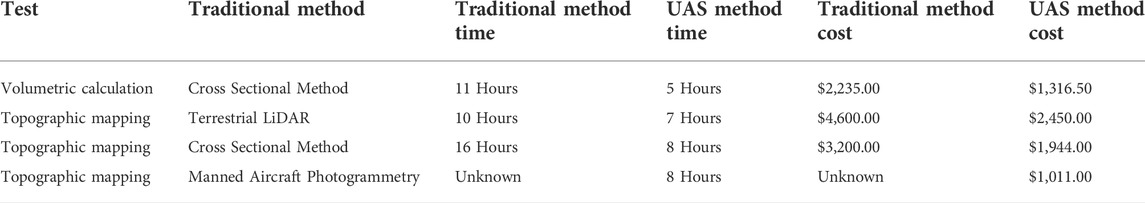
TABLE 1. Comparison of UAS and Traditional survey approaches (Fitzpatrick, 2015).
It should also be noted that the relative cost of a UAS used in the mining industry is lower than traditional instruments (DGPS, Total Station). For instance, a consumer-grade UAS can go as low as $1,500 whereas DGPS is more than $10,000. Even though this is the case, the cost and time effectiveness of a UAS is highly dependent on the scale of a survey. Thus, the benefits of the UAS can only be realized when dealing with relatively large areas.
Despite drones being successfully used for civil engineering applications, there is limited research done on the volumetric computation of open-pit quarry stockpiles using drone technology compared to traditional methods. In Malawi, the mining industry is yet to embrace the fourth industrial revolution and most open pit quarry mines still utilize the traditional terrestrial methods to capture geographical data for volumetric computations. To produce data, these traditional methods incur huge costs, labour, and time, and compromise the safety of workers. Drone technology can bring a positive impact on the mining industry considering its excellent manoeuvrability, low cost, and easy maintenance (Ranjan et al., 2018). In the reviewed literature, there is limited research on how drones can be used for open-pit stockpile volumetric computation. Therefore, this study aims to fill that gap by conducting a comparative analysis of stockpile volumetric computation utilizing a drone and traditional methods. Furthermore, a drone vs. traditional method mapping framework has been developed to guide mine personnel on how to conduct volumetric computations.
2 Methodology
2.1 Study area
The study area, shown in Figure 3, is an open pit quarry located in the Chiradzulu district of Malawi at Latitude 15° 42′ 23″ and Longitude 35° 07′ 05’’.
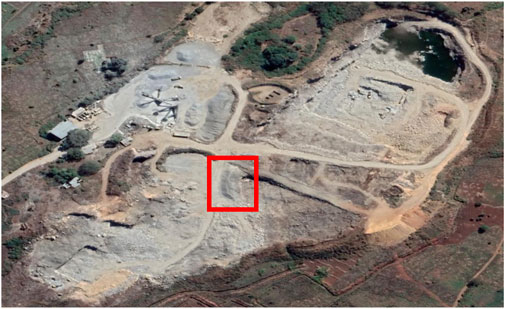
FIGURE 3. Google Earth image of the study area (Google Earth 2021).
2.2 Data acquisition and processing
Most of the UAS used for construction-related applications fall into the small unmanned aerial systems (S-UAS) category weighing less than 25 kg (Zhang et al., 2022). Thus, data capturing was done using a DJI Phantom 3 standard quadcopter (weighing 1.2 kg) shown in Figure 4. A similar approach was used by (Arango and Morales, 2015); (Fitzpatrick, 2015), and (Mantey and Aduah, 2021) who used DJI drones for data collection. A survey plan was pre-created using Pix4Dcapture. Data processing used Pix4D mapper 2.2 pro photogrammetric software to stitch up drone images and compute volume. Refs (Raeva et al., 2016) and (Ajayi and Ajulo, 2021) used a similar approach for data processing. Pix4D provides an automatic data process and the creation of a digital surface model and gets more contributions from wide baseline matches with an option to activate the error ellipsoid to generate an accurate DSM and orthomosaic (Pix4D, 2022).
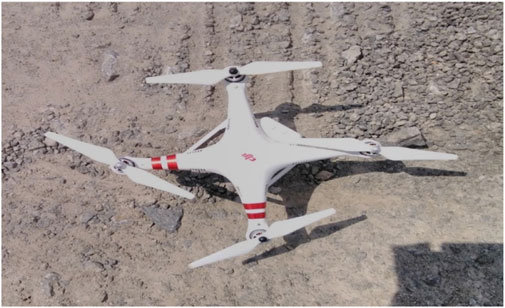
FIGURE 4. DJI Phantom 3 standard quadcopter.
A differential GPS (DGPS) was used in acquiring the coordinates for ground controls and elevation at different points on the stockpile. The DGPS comprised two receivers, a tripod stand, and a high-grade GPS. The DGPS was set to Arc 1950/UTM zone 36 S as the coordinate system. For comparison, a traditional 30 m long standardized steel Stanley Fatmax tape was used for stockpile measurements. The fieldwork led to the development of a drone vs. traditional approach framework (shown in Figure 5) starting from data capturing to comparative analysis in terms of accuracy, time, cost, and safety.
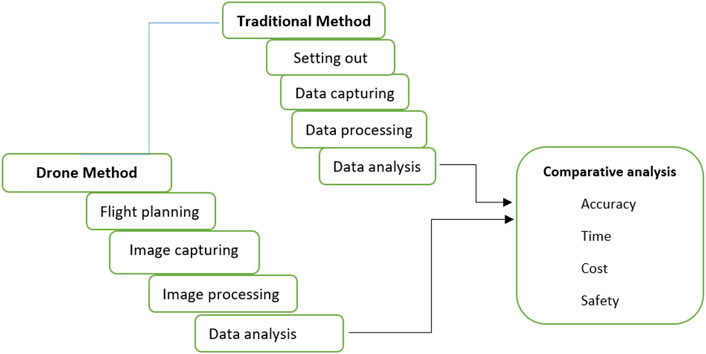
FIGURE 5. Drone vs. traditional approach framework.
Before the actual data acquisition process, several procedures were followed i.e., obtaining flight permission, safety, and ethical procedures. Permission to fly the drone at the quarry was obtained from a local aviation authority that regulates air flight. For ethics and awareness, relevant authorities were informed about the project operations that were to take place at the site. The community was made aware of the project operations through the village headman, and the police in the area. Risk assessment was done to identify and analyze situations that would cause harm to people and damage equipment in use. Power lines, network towers, trees, and hills/outcrops were thoroughly assessed. Risk assessment helped to identify the presence of a rock outcrop, about 20 m high that was very close to the study area (20 m away from the stockpile of interest). This helped to consider a flying height of 35 m high for the drone to not crush against the rock outcrop. The area was free from tall trees, power lines, and network towers.
The process of determining the ground controls was an involving traditional surveying process. A high-grade differential GPS was used to survey ground control points (GCP) that were evenly distributed all over the site surrounding the stockpile of interest as shown in Figure 6. One of the GPS receivers was first set on a high ground, known as a base point and the observation was done to that point. To ensure reliability, a known control point (CP) along the Blantyre-Zomba Road was used for calibration. Calibration was about marking and correlating the high ground point to the standard values. The accuracy of the calibration was checked by tracing another known survey control point along the same road about 1.3 km away using the same GPS and the calibration was checked to be successful. The other GPS receiver was moved to the pre-determined control points on the sketch-up around the site and used to survey and record the coordinates and elevation of each point. Establishing ground control points is important because the model is created on tie points with geo-referenced and improved relative orientation (Raeva et al., 2016).
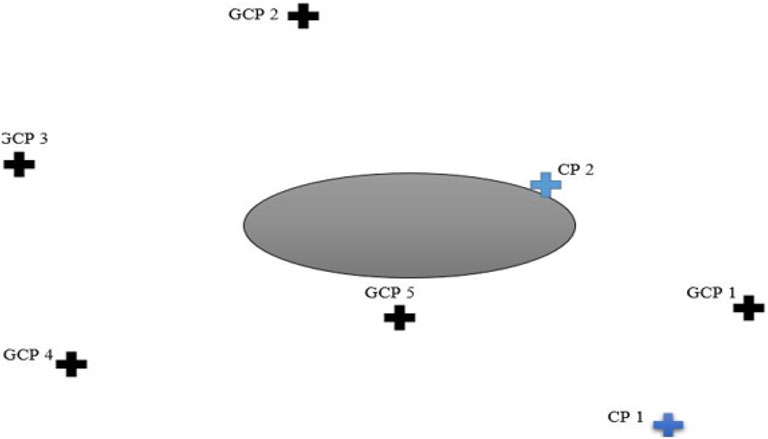
FIGURE 6. Ground control and Checkpoints sketch-up.
Using the GPS, stockpile elevations at different points were recorded as shown in Figures 7, 8. The elevation data was uploaded in GIS software to find the average elevation for use in stockpile volumetric computation.
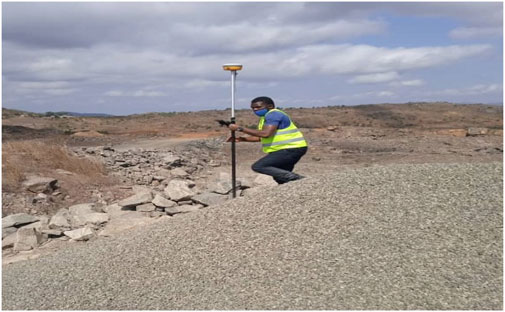
FIGURE 7. Recording elevation at different points of the stockpile.
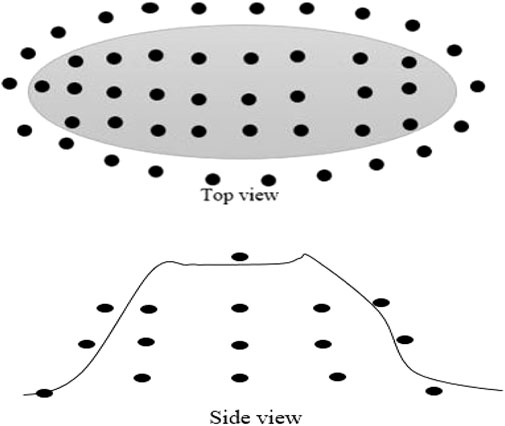
FIGURE 8. Elevation points distribution on a stockpile.
All GCPs were marked by a special reflecting paper visible from the air as shown in Figure 9.
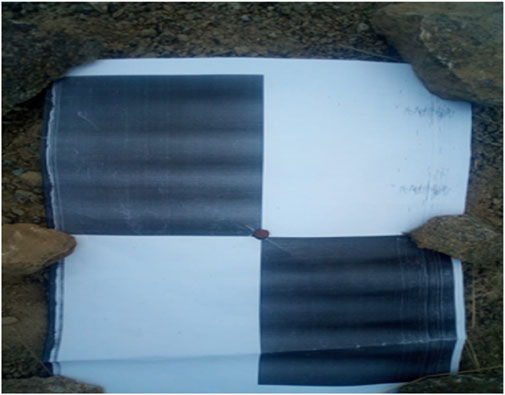
FIGURE 9. Target marks on a GCP and checkpoint.
The process of acquiring images of the site area started with planning the flight process (Table 2). A survey plan was pre-created with Pix4Dcapture software on an android phone. Several different parameters to be used during image capturing were defined on the app. The parameters included the type of path, flying height, tilt, and velocity. Furthermore, image spatial resolution and image overlap requirements should also be considered when estimating required flight time; lowering GSD or increasing image overlap requirements lead to proportional increases in flight time (Zhang et al., 2022).
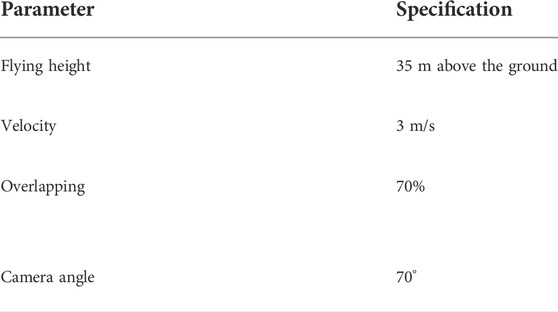
TABLE 2. Flight plan.
Pre-flight checks comprised checking the drone battery level to be fully charged and that the memory stick has sufficient storage space to capture the entire project of 32 Gigabytes. The drone was connected to the controller and phone. The mission was launched (Figure 10) by pressing the ‘start button’ on the smartphone. The drone started following a predefined flight path on the android App. After completing the flight path, the drone landed from where it took off.
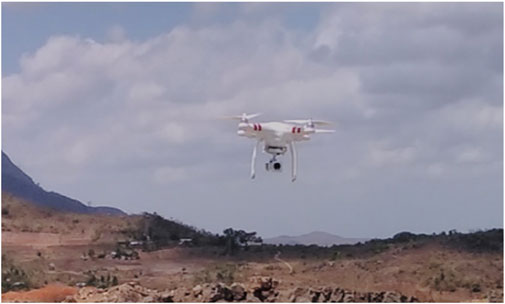
FIGURE 10. Drone taking off.
A standardized steel tape was used to manually measure the dimensions of the stockpile. The process is done manually and involved at least 4 people. The risky part of this process was that it involved climbing the stockpile, and in cases where volume measurement is done on a stockpile consisting of huge blocks of rocks, several injuries could be sustained. Data analysis as a process was done separately for each method. Images that were captured using a drone were examined and interpreted using Pix4Dmapper. The stockpile measurements were put in appropriate formulae. The results from each analysis were finally interpreted. Pix4Dmapper software can stitch together drone data converting it from images to the original 3D surface model on which several measurements can be done. The process went through 3 main stages. Firstly, during initial processing, the software identifies features and positions that appear in 2 or more images in a process called matching (Wu et al., 2013); (Smith et al., 2016). During this process, the software automatically detects and erases all features that remain unmatched thereafter. Secondly, point cloud and mesh creation are done (Figure 11). This is where the matched features/positions are adjusted, and a point cloud is generated in space.
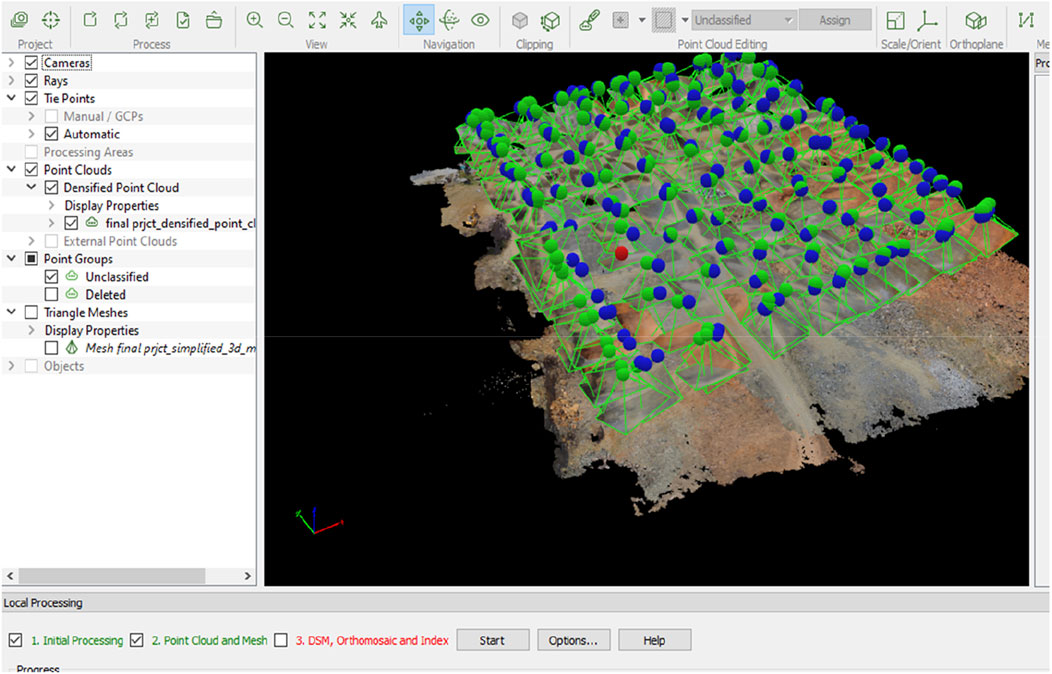
FIGURE 11. Point cloud and mesh generation in Pix4Dmapper.
Lastly, georeferencing (Figure 12) is done whereby images in the cloud are assigned a real coordinate system. The software situates the project on the earth with true coordinates. This eventually provides scale and orientation to the project and enables different measures to be done on the model to be produced. The project is then rematched and optimized. To calculate the volume of the known stockpile, click new volume. Then select the stockpile and click the option to update the measurements. Pix4D generates the volume.
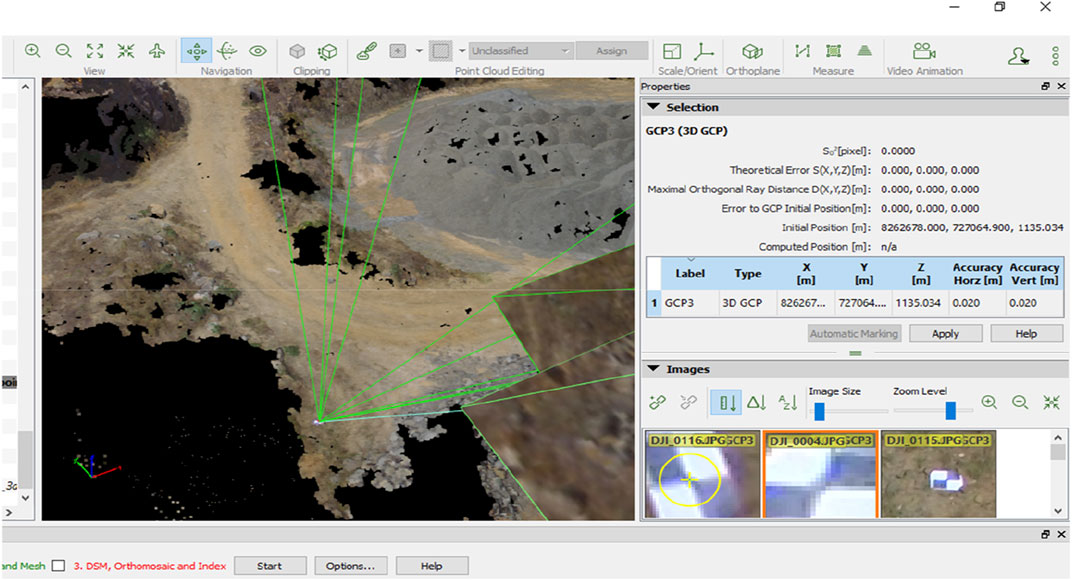
FIGURE 12. Georeferencing process.
Measurements from a steel tape were directly used in mathematical formulae to estimate the volume of the stockpile. The shape of the stockpile (Figure 13) made it difficult to directly apply a single formula as such mathematical principles involving shape were used in this case. The prismoidal method is useful when the ground is not uniform or significantly irregular between cross-sections (Mantey and Aduah, 2021). The volume is computed as a product of the area and the height.
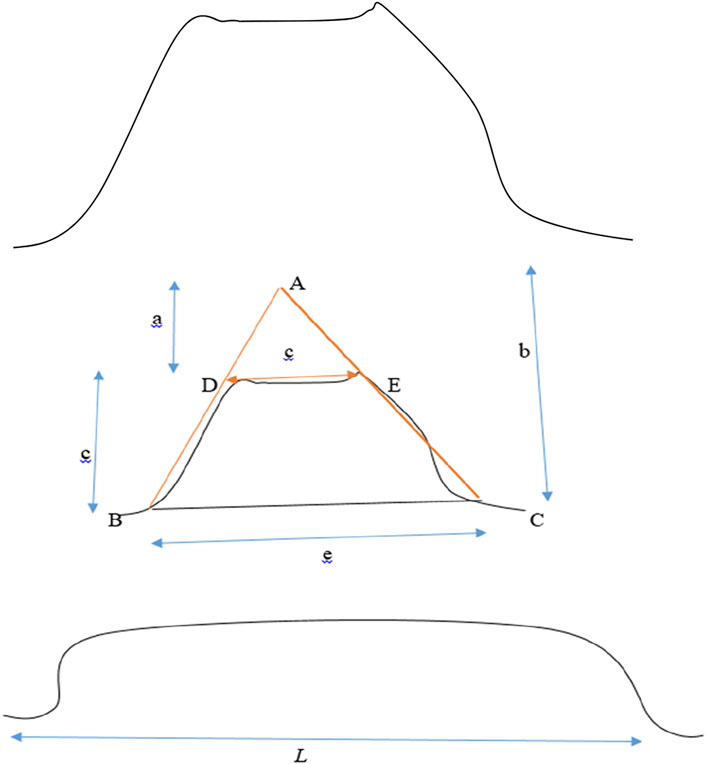
FIGURE 13. The shape of the stockpile inside (top) and front (down) views.
Along the length, L, of the stockpile elevation values measured varied from point to point. Mean elevation calculated is represented by dimension c. Using the GPS stand an arbitrary point, A, was found forming a triangular prism ABC and used for trigonometric calculations. The elevation data recorded by GPS is loaded and processed in GIS software (in CSV format). Hence, the stockpile volume is mathematically computed as follows:
3 Results
A total of five ground control points, GCPs (Figure 6 and Table 3) were established to fly the drone. GCP assist during image matching i.e., tying the images together according to their x and y positioning. To ensure reliability, a known control point (CP) along the Blantyre-Zomba Road was used for calibration. Calibration was about marking and correlating the high ground point to the standard values. Establishing ground control points is important because the model is created on tie points with geo-referenced and improved relative orientation (Raeva et al., 2016).
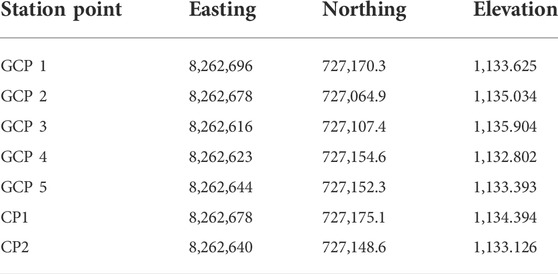
TABLE 3. Ground control and checkpoints coordinates.
The flight path pre-determined during flight planning is a double grid (Figure 14) generated by the software after completing the image-capturing process. To ensure sufficient overlap, remote pilots should use a grid flight path instead of a normal flight path (Ajayi and Ajulo, 2021).
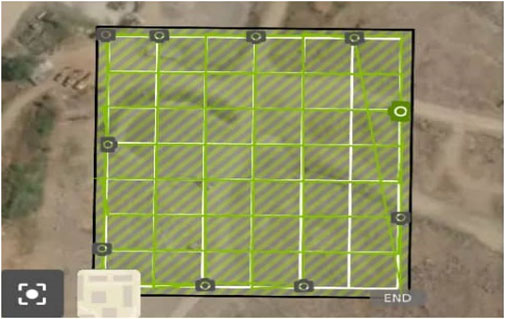
FIGURE 14. Double grid drone path.
The Phantom 3 drone had a camera angle of 70° (tilt), and a total of 164 images were captured with 70% image overlap. At an altitude of 35m, the total double grid flight path (136 m*147 m) cover was 2,192 m and took 9 min 58 s. The volume of the stockpile is then calculated as shown in Table 4. The drone yielded an estimated stockpile volume of 258.7 m3 from the difference in cut and fill values.
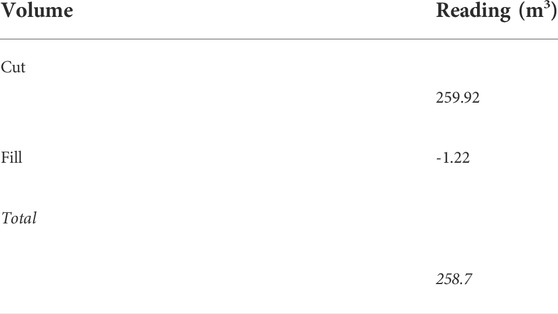
TABLE 4. The volume calculated in Pix4D mapper.
For the traditional tape measurements:
Arbitrary point A = 5 m from the ground (refer to Figure 13).
Mean stockpile elevation = 3.3 m.
The volume of prism ABC (refer to Figure 13).
The volume of prism ADE (refer to Figure 13).
Table 5 shows a summary of the stockpile volume estimated by traditional and drone methods. It also shows the actual stockpile volume used as a standard for statistical comparison with the volumes obtained from the drone and tape. The standard deviation for the drone and tape estimated volumes were ± 2.3 and ± 1.8 respectively. The drone yielded an estimated stockpile volume of 258.7 m3 while the traditional tape method yielded an estimated stockpile volume of 262.0 m3. The actual stockpile volume from the mill operator is 265.4 m3 and is used as a standard for the statistical comparative analysis. The degree of uncertainty between the actual stockpile volume and the drone estimated volume was 2.6% while that for tape estimated stockpile volume was 1.3%.
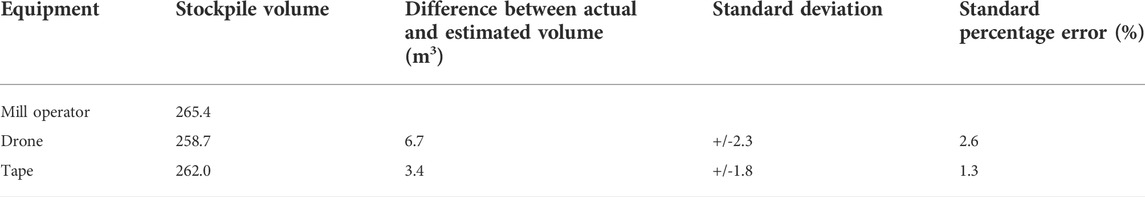
TABLE 5. Comparative analysis of tape and drone volumetric computation.
In addition to checking the accuracy of the volumetric computation, the difference in operation time between the drone and traditional tape method is determined as shown in Table 6.

TABLE 6. Comparative analysis of operation time (Minutes).
For validation, the result accuracy in Pix4D is dependent on the accuracy of the model generated. The root mean square (RMS) error is calculated by checking the accuracy of control points and finding/deleting inaccurate entries. The root mean square error in an accurate model should be less than or equal to pixel size. The average ground sampling distance (GSD) is 1.44 cm (0.014 m) which satisfies the pixel size recommendation by Ref. (UAV, 2022). To ensure a reduction in the accumulation of errors in image matching, ground control points (GCP) were placed at the ends and in the middle of the stockpile as shown in Figure 6. These GCPs are well spread out surrounding the stockpile of interest. The Pix4D mapper generated a quality report (Figure 15) showing an RMS of 0.019 which is almost negligible.
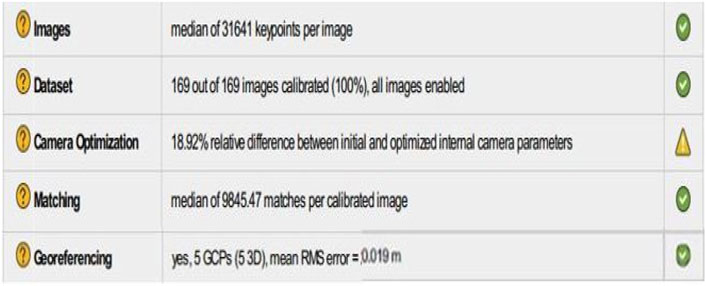
FIGURE 15. Reduction in RMS.
Table 7 shows the ground control points’ accuracy measured from the GPS measurements and the captured drone images thereby validating the matching process.
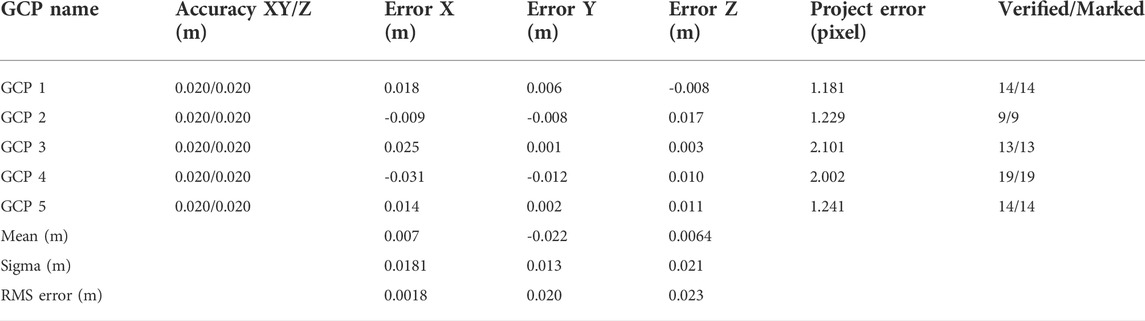
TABLE 7. Ground control points accuracy.
Checkpoints of known coordinates were selected around the stockpile. Table 8 extracted from the Pix4D quality report shows an RMS of about 0.02 which is negligible.
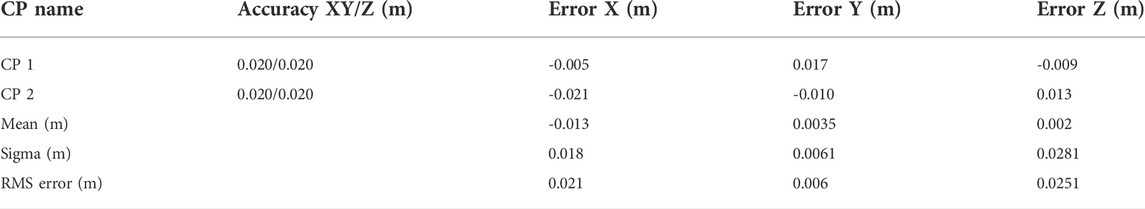
TABLE 8. RMS error of checkpoints.
4 Discussion
The drone method volumetric computation result has an accuracy of less than the maximum allowable degree of certainty ( ± 3%) and is time efficient showing the reliability of utilizing drone technology for volumetric computations in open pit quarries. The data included ground control coordinates with reference to existing survey benchmarks. Images were captured by programming the drone to follow a pre-determined path at a given ground sampling distance. After data capturing using Pix4D capture, data processing employed Pix4D mapper making the procedure time efficient. Data collection using the drone method took 35 min while the traditional tape method took 97 min. The uncertainty of volume determination emanates from the accuracy of the ground control points therefore a ground survey before material stockpiling should be done otherwise its base measurements will require interpolation or estimation. A total of five ground control points were established to fly the drone. Ground control points assist during image matching i.e., tying the images together according to their x and y positioning. To increase accuracy, a minimum of three and a maximum of eight ground control is recommended (Rahman et al., 2017). To ensure a reduction in the accumulation of errors in image matching, ground control points were placed at the ends and in the middle of the stockpile. These ground control points were well spread out surrounding the stockpile of interest. The Pix4D mapper generated a quality report having a root mean square error of 0.019 which is almost negligible. Determination of the ground control point’s root mean square error helps in showing the accuracy of marking the points (Raeva et al., 2016). Checkpoints are points of known coordinates selected around the stockpile. These points do not undergo georeferencing and optimization processes during model generation. Checkpoints indicate the accuracy of the model (Raeva et al., 2016). The smaller the error of the checkpoints the more accurate the generated model and therefore measurements from such a model become reliable. The generated Pix4D quality report showed a root mean square error of 0.019 which is negligible and therefore validates the accuracy of the stockpile model.
The drone’s percentage error to the actual volume is 2.6% while the traditional approach is 1.3%. Refs (Raeva et al., 2016) (Ajayi and Ajulo, 2021) recommend a maximum allowable percentage error (degree of uncertainty) of less than ± 3% for volumetric computations thereby validating the accuracy of the drone method used in the present study. Both estimations are less than the maximum allowable percentage error of ± 3%. The drone method accuracy is attributed to the quantity of captured images and ground control points which were 164 and five respectively. For increased accuracy, the recommended number of captured images ranges from 115 to 220 (Rahman et al., 2017). According to (Tucci et al., 2019), utmost attention should be given to setting fixed and stable reference bases and clear photogrammetric points boundaries to acquire a high-precision survey with greater accuracy. UAS (Drones) provide an accurate, cost-effective, fast, and safe working distance suitable for volumetric computations in open pit quarries. These findings agree with (Farhadmanesh et al., 2021), (Hassandokht Mashhadi et al., 2022) who found that UAS are cost-effective and reliable technology for civil engineering applications. In addition, Ref (Zhou and Gheisari, 2018). and (Rakha and Gorodetsky, 2018) observed that cost savings, time efficiency, and improved accessibility are the primary reasons for drone preference in the built environment.
The present study has demonstrated the comparative applicability of UAS in open-pit stockpile volumetric computations compared to the traditional approach. A systematic framework has been illustrated and can be applied in open pit quarries taking into consideration the scale and type of work conducted and the acceptable percentage error.
5 Future research areas
Future research work can determine the volumetric computation accuracy during nighttime and examine the application of drones in checking the availability and utilization of mining equipment. Furthermore, more than one stockpile and drone should be used for a comparative analysis of drone vs. traditional methods to check variability with respect to the number of muckpile and coverage area.
6 Limitation of the study
Despite the pros of using drone technology for volumetric computation, the common limitations comprised of limited battery usage time (approx. 20 min) affecting coverage area and flight duration, safety-related hazards when conducting a drone operation, and poor weather conditions affecting the visibility and normal functionality of the drone. Similar limitations were observed by (Hassandokht Mashhadi et al., 2022). The study utilized only one stockpile for the computation and hence a limited basis for comparison. Therefore, multiple stockpiles of various sizes would have been ideal. The present study is limited to volumetric computation during daytime working hours and thus there is a need to investigate the feasibility of night-time application.
7 Conclusion
The present study comparatively evaluated the utilization of drone technology vs. traditional methods in volumetric computations of open pit quarry stockpiles over traditional surveying techniques considering the accuracy, operation time, cost, and safety. A known volume stockpile at an open pit quarry is used as a case study. The drone’s percentage error to the actual volume is 2.6% while the traditional tape is 1.3%. Both estimations are less than the maximum allowable percentage error of ± 3% thereby validating the accuracy of the drone method. The drone method accuracy is attributed to the quantity of captured images and ground control points which were 164 and five respectively. To achieve greater accuracy, the GCPs, images, and checkpoints were marked on the wide-baseline pairs. The mining industry should consider the full adoption of drone technology (UAS) in calculating the volume of blasted quarry stockpiles because it is cost-effective, faster, accurate, and provides a safe working distance. Compared to Europe, Asia, or North America with advanced industrial drone applications, most African countries e.g., Malawi, are yet to adopt and implement UAS in open pit quarries for volumetric computations. The sub-Saharan African countries leading in drone technology for mining, agriculture, and healthcare-related applications consist of Rwanda, Ghana, South Africa, and Kenya. Therefore, there is a need for more research and development of UAS to fill the technology gaps in mining-related applications in sub-Saharan Africa.
Data availability statement
The datasets presented in this study can be found in online repositories. The names of the repository/repositories and accession number(s) can be found in the article/Supplementary Material.
Author contributions
Conceptualization, JM; methodology, JM, and WM; software, JM and WM; validation, JM, IM, and MD; investigation, JM and WM; writing—original draft preparation, JM and WM; writing—review and editing, IM and MD; project administration, IM All authors have read and agreed to the published version of the manuscript. CK under software & writing—review and editing.
Funding
This research is supported by the Intra-Africa Mobility Scheme of the European Union in partnership with the African Union in the framework of the project 624204-PANAF-1-2020-1-ZA-PANAF-MOBAF under the Africa Sustainable Infrastructure Mobility (ASIM) scheme. The work is part of collaborative research at the Centre of Applied Research and Innovation in the Built Environment (CARINBE).
Acknowledgments
The authors thank Terrastone Njuli Quarry for providing access to their site.
Conflict of interest
The authors declare that the research was conducted in the absence of any commercial or financial relationships that could be construed as a potential conflict of interest.
Publisher’s note
All claims expressed in this article are solely those of the authors and do not necessarily represent those of their affiliated organizations, or those of the publisher, the editors and the reviewers. Any product that may be evaluated in this article, or claim that may be made by its manufacturer, is not guaranteed or endorsed by the publisher.
References
Ajayi, O. G., and Ajulo, J. (2021). Investigating the applicability of unmanned aerial vehicles (UAV) photogrammetry for the estimation of the volume of stockpiles. Quaest. Geogr. 40 (1), 25–38. doi:10.2478/QUAGEO-2021-0002
Arango, C., and Morales, C. A. (2015). Comparison between multicopter UAV and total station for estimating stockpile volumes. Int. Arch. Photogramm. Remote Sens. Spat. Inf. Sci. 40 (4), 131–135. doi:10.5194/ISPRSARCHIVES-XL-1-W4-131-2015
Austin, R. (2010). Introduction to unmanned aircraft systems (UAS). Unmanned Aircr. Syst., 5, 1–15. doi:10.1002/9780470664797.ch1
Carvajal, F., Agüera, F., and Pérez, M. (2012). Surveying A landslide in A road embankment using unmanned aerial vehicle photogrammetry. Int. Arch. Photogramm. Remote Sens. Spat. Inf. Sci. 22, 201–206. doi:10.5194/ISPRSARCHIVES-XXXVIII-1-C22-201-2011
Chen, M., Feng, A., McAlinden, R., and Soibelman, L. (2020). Photogrammetric point cloud segmentation and object information extraction for creating virtual environments and simulations. J. Manage. Eng. 36 (2). 0000737. doi:10.1061/(ASCE)ME.1943-5479.0000737
El Meouche, R., Hijazi, I., Poncet, P. A., Abunemeh, M., and Rezoug, M. (2016). UAV photogrammetry implementation to enhance land surveying, comparisons and possibilities. Int. Arch. Photogramm. Remote Sens. Spat. Inf. Sci. 42 (2), 107–114. doi:10.5194/ISPRS-ARCHIVES-XLII-2-W2-107-2016
Esposito, G., Mastrorocco, G., Salvini, R., Oliveti, M., and Starita, P. (2017). Application of UAV photogrammetry for the multi-temporal estimation of surface extent and volumetric excavation in the Sa Pigada Bianca open-pit mine, Sardinia, Italy. Environ. Earth Sci. 76 (3), 103–116. doi:10.1007/s12665-017-6409-z
Farhadmanesh, M., Cross, C., Mashhadi, A. H., Rashidi, A., and Wempen, J. (2021). Highway asset and pavement condition management using mobile photogrammetry. Transp. Res. Rec. 2675 (9), 296–307. doi:10.1177/03611981211001855
Ficci (2018). Make in India for unmanned aircraft systems (UAS). Available at: https://ficci.in/past-event-page.asp?evid=23881 (Accessed May 02, 2022).
Fitzpatrick, B. (2015). Unmanned aerial systems for surveying and mapping: Cost comparison of UAS versus traditional methods of data acquisition,” master of science. Carolina: University of South Carolina.
Francioni, M., Salvini, R., Stead, D., and Coggan, J. (2018). Improvements in the integration of remote sensing and rock slope modelling. Nat. Hazards (Dordr). 90 (2), 975–1004. doi:10.1007/S11069-017-3116-8
Gambo, N., and Musonda, I. (2021). Effect of the fourth Industrial Revolution on road transport asset management practice in Nigeria. J. Constr. Dev. Ctries. 26 (1), 19–43. doi:10.21315/jcdc2021.26.1.2
Hassandokht Mashhadi, A., Handy, R., Farhadmanesh, M., Rashidi, A., Honda, T., Sleeth, D. K., et al. (2022). Feasibility study of using nebulizer-retrofitted UAVs at construction projects: The case study of residential jobsites in Utah. J. Constr. Eng. Manag. 148 (10). doi:10.1061/(ASCE)CO.1943-7862.0002368
Kardasz, P., and Doskocz, J. (2016). Drones and possibilities of their using. J. Civ. Environ. Eng. 6 (3). doi:10.4172/2165-784X.1000233
Lippitt, C. D., and Zhang, S. (2018). The impact of small unmanned airborne platforms on passive optical remote sensing: A conceptual perspective. Int. J. Remote Sens. 39 (15–16), 4852–4868, Aug. doi:10.1080/01431161.2018.1490504
Luhmann, T., Robson, S., Kyle, S., and Boehm, J. (2019). Close-range photogrammetry and 3D imaging” 3rd Edn. (Berlin, Boston: De Gruyter), 2–14. doi:10.1515/9783110607253
Mantey, S., and Aduah, M. S. (2021). Comparative analysis of stockpile volume estimation using UAV and GPS techniques. Ghana Min. J. 21 (1), 1–10. doi:10.4314/gm.v21i1.1
Matsimbe, J. (2021). Comparative application of photogrammetry, handmapping and android smartphone for geotechnical mapping and slope stability analysis. Open Geosci. 13 (1), 148–165. doi:10.1515/geo-2020-0213
Matsimbe, J. (2020). Optimization of shovel-truck productivity in quarries. Int. J. Res. Advent Technol. 8 (10), 1–9. doi:10.32622/IJRAT.810202008
Mining Engineering (2007). Mining engineering, borrow, and streaming : Internet archive. Available at: https://archive.org/details/sim_mining-engineering_2007-06_59_6 (Accessed May 02, 2022).
Musonda, I., and Pillay, N. (2019). Using UAV’s and BIM integration to improve infrastructure delivery – a case of. South Africa: Gauteng Department of Infrastructure Development, 922–928. doi:10.3311/CCC2019-127
Nex, F., and Remondino, F. (2014). UAV for 3D mapping applications: A review. Appl. Geomat. 6 (1), 1–15. doi:10.1007/s12518-013-0120-x
Patikova, A. (2004). Digital photogrammetry in the practice of open pit mining. Available at: https://www.bing.com/search?q=Patikova%2C+A.%2C+(2004).+Digital+Photogrammetry+in+the+Practice+of+Open+Pit+Mining.+Vol.+34%3A+ISPRS.&cvid=48b79baaa395430e929f729452ce2691&aqs=edge.0.69i59.4465j0j9&FORM=ANAB01&PC=U531 (Accessed May 02, 2022).
Pérez, M., Agüera, F., and Carvajal, F. (2013). Low cost surveying using an unmanned aerial vehicle. Int. Arch. Photogramm. Remote Sens. Spat. Inf. Sci., 2. 311–315. doi:10.5194/ISPRSARCHIVES-XL-1-W2-311-2013
Pix4D (2022). How Pix4Dmapper calculates the volume? Available at: https://www.bing.com/search?q=Pix4D.+(2022).+How+Pix4Dmapper+calculates+the+Volume%3F&cvid=bd67b4cea1bc475f9b916224695ecf20&aqs=edge.69i57.4756j0j9&FORM=ANAB01&PC=U531 (Accessed May 02, 2022).
Raeva, P. L., Filipova, S. L., and Filipov, D. G. (2016). Volume computation of A stockpile – a study case comparing gps and uav measurements in an open pit quarry. Int. Arch. Photogramm. Remote Sens. Spat. Inf. Sci. 1, 999–1004. doi:10.5194/ISPRS-ARCHIVES-XLI-B1-999-2016
Rahman, A. A., Maulud, K. N. A., Mohd, F. A., Jaafar, O., and Tahar, K. N. (2017). Volumetric calculation using low cost unmanned aerial vehicle (UAV) approach. IOP Conf. Ser. Mat. Sci. Eng. 270 (1), 012032. doi:10.1088/1757-899X/270/1/012032
Rakha, T., and Gorodetsky, A. (2018). Review of Unmanned Aerial System (UAS) applications in the built environment: Towards automated building inspection procedures using drones. Autom. Constr. 93, 252–264. doi:10.1016/j.autcon.2018.05.002
Ranjan, A., Panigrahi, B., Sahu, H. B., and Misra, P. (2018). “SkyHelp: UAV assisted emergency communication in deep open pit mines,” in Proceedings of the 2018 International Workshop on Internet of People, New York, NY, United States, 10 June 2018 (Assistive Robots and Things), 31–36. doi:10.1145/3215525.3215537
Raphaelson, H. (2019). Top 7 innovations that aim to improve construction site safety. Available at: https://www.manufacturing.net/article/2018/10/top-7-innovations-aim-improve-construction-site-safety (Accessed May 02, 2022).
Remondino, F., Fraser, C., and Remondino, F. (2006). Digital camera calibration methods. Int. Archives Photogrammetry, Remote Sens. Spatial Inf. Sci. 10 (5), 266–272. doi:10.3929/ETHZ-B-000158067
Saba, M., Fakhari-Tehrani, F., Michaud, P., Hajikarimi, P., and Absi, J. (2021). Experimental and numerical investigation of sodium- and potassium-based alkali activator on the mechanical properties of geopolymer-mortars using Lebanese kaolin. Int. J. Civ. Eng. 19 (9), 1007–1020. doi:10.1007/s40999-021-00627-7
San, K., Nakagawa, K., and Takagi, M. (2008). Accuracy evaluation of digital surface model using ALOS PRISM data for disaster monitoring. Available at: https://www.bing.com/search?q=O+San%2C+K%2C+Nakagawa%2C+K%2C+Takagi+M.+(2008).+Accuracy+evaluation+of+digital+surface+model+using+ALOS+PRISM+data+for+disaster+monitoring.+Int.+Arch.+Photogramm.+Remote+Sens.+Spatial+Inf.+Sci.%2C+Vol.+XXXVII.+Part+B4.+Beijing&cvid=76a3ad26176842409baae6529cdfe836&aqs=edge.69i57.9427j0j4&FORM=ANAB01&PC=U531 (Accessed May 02, 2022).
Singh, V. (2018). Drones are reshaping the surveying and mapping industry in India. Available at: https://yourstory.com/2018/11/drones-reshaping-surveying-mapping-industry-india/amp (Accessed May 02, 2022).
Smith, M. W., Carrivick, J. L., and Quincey, D. J. (2016). Structure from motion photogrammetry in physical geography. Prog. Phys. Geogr. Earth Environ. 40 (2), 247–275. doi:10.1177/0309133315615805
Stockpile (2018). eBook: Stockpile measurement and reports with drone surveying. Available at: https://get.propelleraero.com/stockpile-measurement-and-reporting-ebook (Accessed May 02, 2022).
Tucci, G., Gebbia, A., Conti, A., Fiorini, L., and Lubello, C. (2019). Monitoring and computation of the volumes of stockpiles of bulk material by means of UAV photogrammetric surveying. Remote Sens. (Basel). 11 (12), 1471. doi:10.3390/RS11121471
UAV (2022). How accurate are UAV surveying methods ? White paper : How accurate are UAV surveying methods ? Available at: https://www.semanticscholar.org/paper/How-accurate-are-UAV-surveying-methods-White-paper-Draeyer-Strecha/0dd71fdcaefbc22e54f2ba7f8bb0fa8af33edb4c (Accessed May 02, 2022).
Wu, C., Kong, Z., Duan, X., Zhu, H., and Zeng, S., (2013). Inhibition of PARP1 by small interfering RNA enhances docetaxel activity against human prostate cancer PC3 cells Biochem. Biophys. Res. Commun. 3, 127–132. doi:10.1016/j.bbrc.2013.11.027
Zhang, S., Bogus, S. M., Lippitt, C. D., Kamat, V., and Lee, S. (2022). Implementing remote-sensing methodologies for construction research: An unoccupied airborne system perspective. J. Constr. Eng. Manag. 148 (9). 0002347. doi:10.1061/(ASCE)CO.1943-7862.0002347
Keywords: land surveying, mining, 4IR, photogrammetry, point cloud, quarry
Citation: Matsimbe J, Mdolo W, Kapachika C, Musonda I and Dinka M (2022) Comparative utilization of drone technology vs. traditional methods in open pit stockpile volumetric computation: A case of njuli quarry, Malawi. Front. Built Environ. 8:1037487. doi: 10.3389/fbuil.2022.1037487
Received: 05 September 2022; Accepted: 19 October 2022;
Published: 03 November 2022.
Edited by:
Ke Chen, Huazhong University of Science and Technology, ChinaReviewed by:
Ali Hassandokht Mashhadi, The University of Utah, United StatesSu Zhang, University of New Mexico, United States
Copyright © 2022 Matsimbe, Mdolo, Kapachika, Musonda and Dinka. This is an open-access article distributed under the terms of the Creative Commons Attribution License (CC BY). The use, distribution or reproduction in other forums is permitted, provided the original author(s) and the copyright owner(s) are credited and that the original publication in this journal is cited, in accordance with accepted academic practice. No use, distribution or reproduction is permitted which does not comply with these terms.
*Correspondence: Jabulani Matsimbe, am1hdHNpbWJlQHBvbHkuYWMubXc=