 Khaula Alkaabi
 Mohsin Raza
- 1Associate Professor—Chief Innovation Officer, Geography and Urban Sustainability Department -CHSS, The United Arab Emirates University, Al Ain, United Arab Emirates
- 2Senior Research Analyst, Transport Planning and Management Sector, The Urban Unit Private Limited, Lahore, Pakistan
Revisiting the dynamics of the car cabin environment and its impact on driver comfort is essential, as these concepts have not been explored in recent years. Older methods of assessing driver comfort and cabin environments require elaborate experimental settings and prolonged engagement of study participants, making repeatability difficult. Therefore, this study develops a model for study models the car cabin environment based on temperature, humidity, and CO2 levels using a thermal imager, an air quality device, and open-source temperature and humidity data. This study also determines whether the impact of the cabin thermal environment on driver comfort (skin dryness, eye fatigue, body fatigue, and body heat) can be quantified based on driver perceptions. The study results showed that body fatigue decreased from 4.2 to 2.7 when the average relative humidity is reduced from 37.2% to 24.2%, and the temperature dropped from 41.8°C to 40.0°C. Notably, the impact of air temperature on the cabin thermal environment was 1.8 times stronger than that of the car skin temperature. Cabin temperature was found to be a better predictor of driver (dis)comfort than cabin humidity and CO2 levels. A 10 min exposure to summer heat in the UAE was found to have a significant effect on drivers’ perceptions of body fatigue, body heat, and eye fatigue. Overall, these findings have implications for car cabin ergonomics and future thermal comfort research.
1 Introduction
Studies concerning rising heat in urban areas seldom discuss its impact on car cabins and drivers (Joubert et al., 2011; Nakano and Tanabe, 2020; Marcotullio et al., 2022). For example, Nakano and Tanabe (2020) investigated the thermal impacts of air-conditioned (AC) and non-AC spaces on occupants, focusing exclusively on the heat characteristics of the built environment. Similar studies on the heat impacts of AC and non-AC car cabins on drivers have not been discussed in the relevant literature. This selective focus has led to the literature that proposes heat management strategies disconnected from driver needs. For example, one study presented how to determine optimal tree placement to mitigate urban heat (MacLachlan et al., 2021). Another study proposed enhancing basic services, infrastructure, awareness, and education among residents to enhance urban heat management practices (Adegun et al., 2022). A driver-centered approach to the impacts of urban heat is lacking in the literature.
Overheated vehicle cabins cause, on average, 37 child deaths per annum in the United States (Horak et al., 2017). High humidity in the car cabin can affect driver concentration, situation handling, eye comfort, and visual fatigue (Tsutsumi et al., 2007). Because CO2 concentration in the car cabin is associated with driver fatigue (Mathur, 2016), the in-cabin environment has implications for driver health and comfort, but studies have neglected this underlying relationship. Crizzle et al. (2017) searched several renowned databases (Pubmed, CINAHL, Scopus, and PsycINFO) for articles on the health and wellness of truck and bus drivers in Canada and the United States; their analysis of 33 peer-reviewed articles published between 2000 and 2017 revealed that smoking, obesity, hypertension, poor diet, lack of exercise, stress, and sleep were evaluated as major problems for drivers (Crizzle et al., 2017). This exclusion of the cabin environment impact from the literature on driver health and comfort could undermine the significance of regulating cabin environment. Policymakers, fleet managers, and drivers might disregard the cabin thermal profile and air quality.
Summertime temperatures in the UAE can reach 51°C, uncomfortable to remain outdoors. The effects of this heat level on workers in the construction and oil and gas industries have been well documented in the literature (Siddique et al., 2019). Comprehensive programs to reduce heat-related illness for workers in the UAE and other Middle Eastern countries exist (Joubert et al., 2011). However, the effects of heat on car drivers are typically disregarded based on the assumption that car ACs are sufficient to offer the appropriate degree of comfort. Instead, the focus is almost exclusively on ‘at risk’ workers, such as farmers, construction laborers, firefighters, miners, soldiers, and proletarians (Xiang et al., 2014). This neglect has resulted in a lack of engineering and administrative control measures to reduce drivers’ exposure to heat. The use of complex experimental settings in previous studies (Tsutsumi et al., 2007; Mathur, 2016) could have contributed to a lack of research on driver comfort and the cabin environment. For example, Tsutsumi et al. (2007) required study participants to sit in a climate chamber for 5 h to evaluate the impact of the cabin environment on their comfort levels. Finding volunteers to sit for that long in a controlled environment, even when it is pleasant, is difficult. Creating a climate chamber may also not be feasible in many cases. Thus, introducing simpler and more intuitive methods to profile the car cabin environment and its impact on driver health can encourage more scholars (or policymakers, for that matter) to participate in this research domain.
This exploratory study has two main goals: (i) to revisit the dynamics of the car cabin environment in the context of hot UAE summers, and (ii) to demonstrate the usefulness of a simpler, psychometric approach to evaluate the impact of cabin environment on driver comfort. The study assumes that the cabin environment can be modeled using external factors such as car skin temperature, air temperature, and air humidity. Thermal conditions (temperature and relative humidity) and air exchange (CO2 concentration) are considered the main attributes of the cabin environment (Croitoru et al., 2015; Szczurek and Maciejewska, 2016). The impact of these factors–temperature, relative humidity, and CO2 concentration–on driver comfort is evaluated using four constructs: body fatigue, eye fatigue, body heat, and skin dryness. These constructs are widely regarded as measures of driver comfort (Tsutsumi et al., 2007; Danca et al., 2016). This study is expected to contribute to the literature on car cabin thermal dynamics and associated driver comfort levels. This study is novel because it explores the impact of cabin thermal environments on driver comfort, which has remained unexplored in the context of the UAE, despite the country’s soaring levels of heat witnessed during the summers. The use of real field settings, as opposed to climate chambers to elicit more accurate driver responses is another innovative aspect of this study. The latter (climate chamber) methodology, used in most studies concerning cabin environment and driver comfort, does not mimic real-life situations wherein car users (while walking to the parking lot) face external environmental heat before experiencing the cabin thermal environment. This pre-exposure to heat might affect how drivers rate their cabin environment. Finally, this study simplifies existing research methods for assessing the drivers’ comfort level by employing fewer instruments and relying more on psychometric approaches based on statistical analysis to explore the relationship between cabin environment and driver comfort.
2 Materials and methods
The overall objective of this study is to measure the impact of external thermal conditions, including car skin temperature, on the cabin thermal profile, and relate it to driver comfort. The air conditions outside the cars are expected to affect the air conditions inside the cars, thereby affecting driver experience (level of comfort). Because car ACs can alter cabin conditions (temperature and humidity), drivers’ experiences before and after turning on the ACs are evaluated. Exposure to non-AC conditions would help simulate the external environment conditions that drivers face while walking to and from the car parking. While long-term (more than 15 min) exposure to high-temperature levels can induce heat stroke, little is known about the impact of short-term heat exposure.
This study included a car cabin and driver comfort monitoring experiment, conducted on 26 May 2022, at the UAE University visitors’ parking area located in Al Ain city, UAE. The experimental settings included ten white cars parked under different shading conditions: eight under an outdoor covered parking lot, one under a tree, and one in an indoor parking compound. Different shading conditions were meant to introduce random variation in the car cabin thermal environment. All cars had the same (white) color to rule out the reported impact of car color on the cabin thermal profile (Levinson et al., 2011). Because car materials can impact the cabin thermal environment (Marshall et al., 2019). Cars of similar make and model were used in this experiment to neutralize this effect. All cars were gulf variants of standard sedans of Japanese origin. At random periods during the day, the research team visited each car individually to monitor the car skin temperature and cabin air quality (temperature, humidity, and CO2 levels). A handheld thermal imager was used to photograph the cars (Figure 1). Because various components of the car body showed different temperatures, for the sake of consistency in recorded values, the temperature of the hottest part of the car skin was recorded.
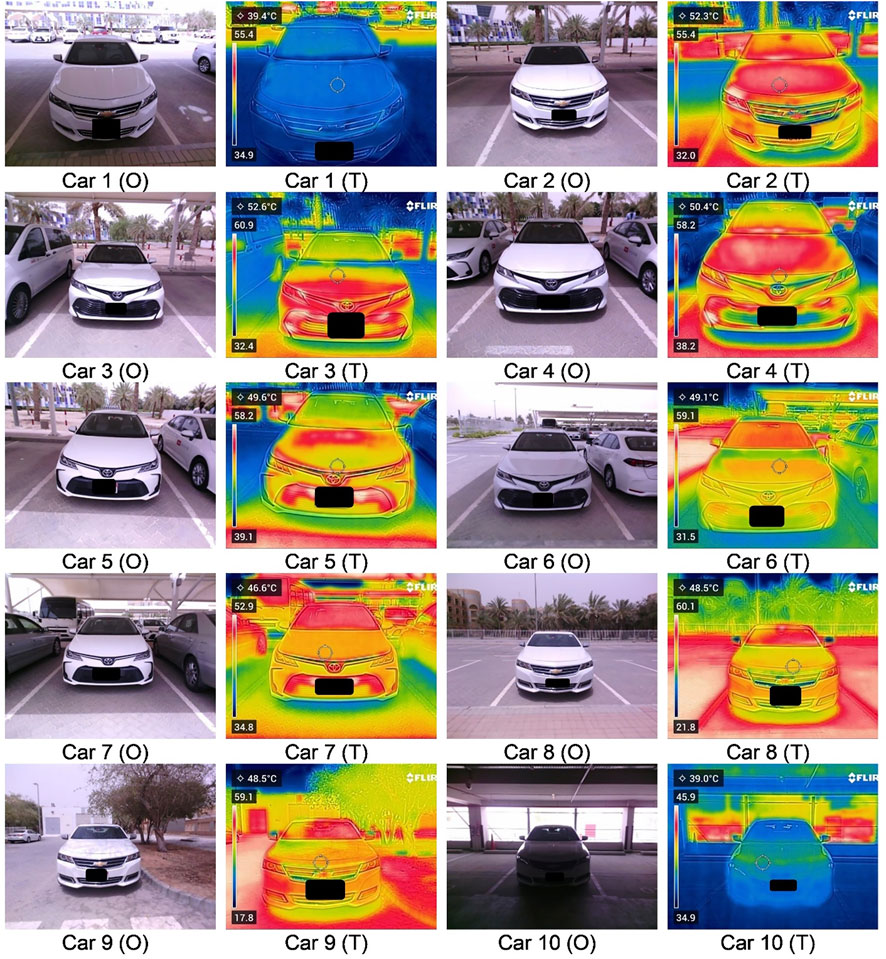
FIGURE 1. Optical and thermal images of cars parked under various shading conditions.
Car cabin temperature and humidity levels were measured using an off-the-shelf air quality monitor. The device could log temperature and humidity levels at 10 s intervals. The surrounding air temperature and humidity levels were retrieved from an open-source metrological data repository that records weather data at hourly resolution (Weatherspark, 2022). The temperature was assumed to remain constant throughout each hourly interval. Table 1 shows the thermal properties of the car skin, car cabin, and surrounding air. Note that the cabin humidity (HC) and cabin temperature (Tc) values show the averages of 5 minutes of data logged for each car (Table 1).
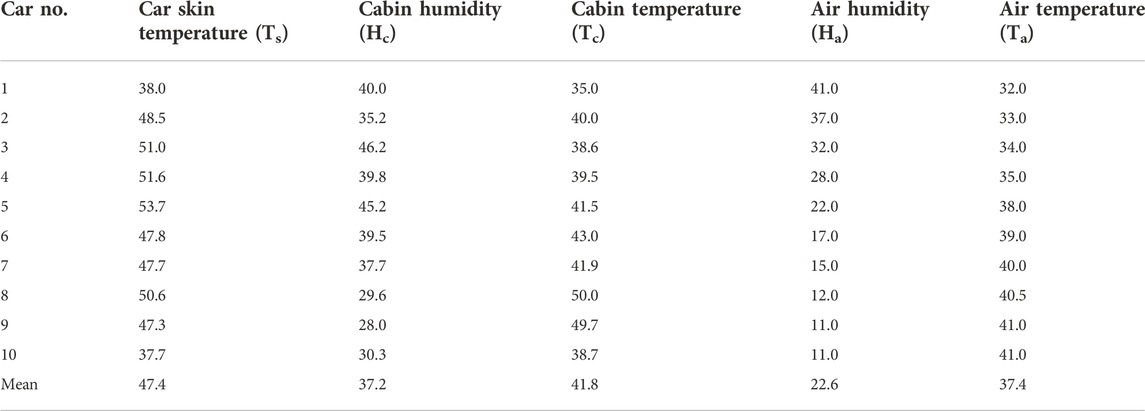
TABLE 1. Thermal profiling of car skin, car cabin, and the surrounding air.
To measure the impact of cabin air quality on driver experience, two study participants were assigned per car to sit in the front seats for 10 min. The car AC was kept off for the first 5 min and on for the last five. Moreover, the car windows were kept closed during the experiment. In total, 11 participants participated in the driver perception survey: ten respondents (one per car) and one surveyor (the same person for all ten cars). The reason for assigning a different participant each time was to ensure that the study participants did not face heat-related illnesses such as heat exhaustion, or worse heat stroke, which could set in after 10–15 min of exposure to the heat levels observed in the UAE. The surveyor, who had to successively sit in all ten cars, was protected from the heat by limiting his sitting time to that part of the experiment when car ACs were turned on. Notably, the participants were told that they could leave the car (or turn on the AC) at any point during the experiment, should the cabin environment start feeling too hot. The purpose was to record the impact of changing thermal conditions on driver comfort. Apart from Hc and Tc, the cabin-CO2 (CC) levels were also logged to understand the impact of CO2 concentration on driver comfort. The comfort level was measured in terms of body fatigue, eye fatigue, body heat, and skin dryness, using a five-point Likert scale where one meant the least impact and five meant the greatest.
Table 2 shows the passenger experience data under varying car cabin conditions. Each case includes 5-min average cabin air quality data with a corresponding passenger comfort rating. Humidity was measured in relative %, the temperature in °C, and CO2 in parts per million. In total, there were 20 cases, and data were collected at various times of the day.
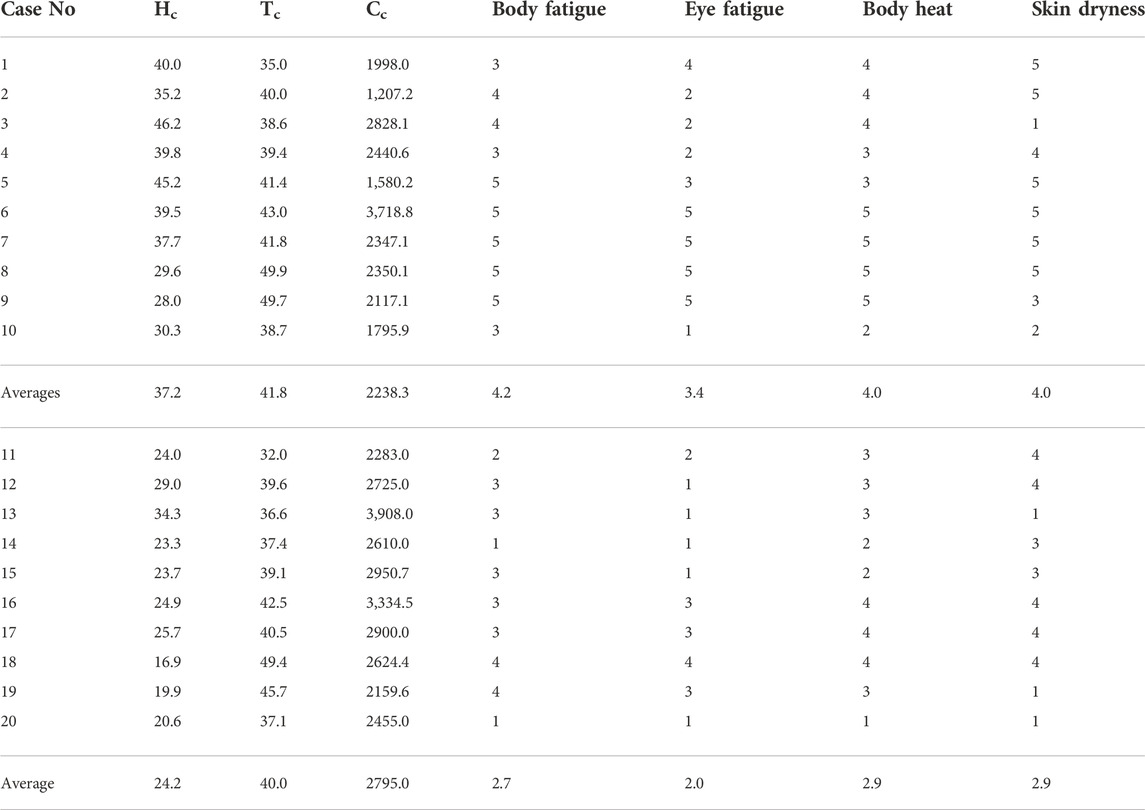
TABLE 2. Passenger experience under varying cabin thermal conditions.
3 Results
Data analysis (Table 1) shows that the mean car cabin temperature (41.797°C) exceeds the mean air temperature (37.350°C) but is lower than the mean car skin temperature (47.390). This occurred even though all cars were parked under shaded conditions. The car parked under a tree shade registered a cabin temperature of 50°C (nine units higher than the average cabin temperature of the sample cars). Because all cars used in the experiment were white, the impact of car color on cabin temperature could be ignored. The highest variation in temperature was observed in the car skin temperature (SD = 5.4206).
3.1 Car cabin temperature
Linear regression modeling assumptions were tested to model car cabin temperature as a dependent variable and air temperature and car skin temperature as predictors. Table 3 shows the correlations among the variables of interest. The correlation between air temperature and car skin temperature was 0.02 and was not significant. To alleviate multicollinearity concerns, the correlations between independent variables (air temperature and car skin temperature in this case) should not exceed 0.7 (Gregorich et al., 2021). Thus, multicollinearity is not a concern here. Another desirable condition is the correlation value between predictor variables and outcome variables should exceed 0.3 (Ratner, 2009). Table 3 shows that the correlation values between cabin temperature and air temperature and car-skin temperature were 0.7 and 0.405, respectively. These correlation values are desirable.
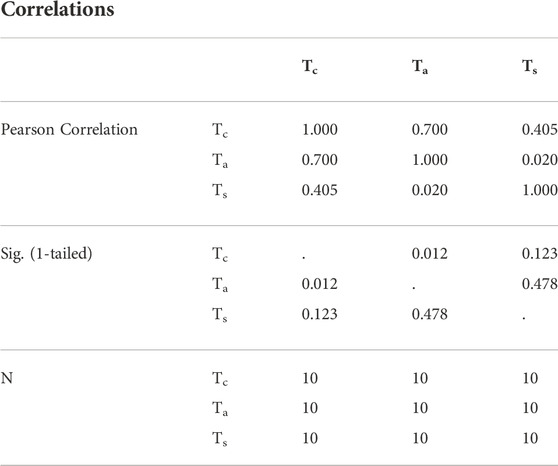
TABLE 3. Correlations between car cabin temperature, air temperature, and car-skin temperature.
The normal probability–probability (P-P) plot shows that the points follow a linear trend (Figure 2). Although the points deviate from the line slightly in the middle, overall, they follow a linear line, which is satisfactory. The scatterplot (Figure 2) shows point distribution as none exceeds +3 or −3 units (standard deviation) along either axis. This compactness may be attributed to the small sample size used in this study. For studies involving larger sample sizes, outliers are usually observed. Such points (outliers) may be removed from the analysis. Further discussion in this regard is beyond the scope of this article and interested readers might want to refer to the relevant literature (Terrin et al., 2005; Sarikaya and Gleicher, 2018).
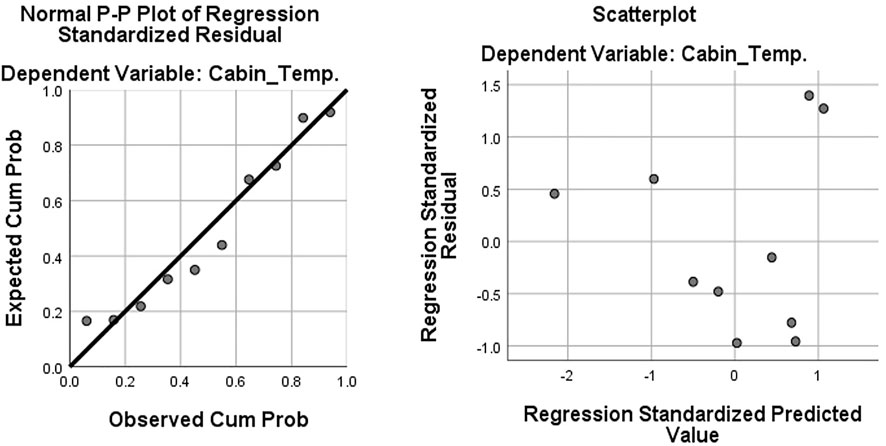
FIGURE 2. Normal P-P plot (left) and scatterplot (right).
Other parameters measured to test modeling assumptions included standard residual and Cook’s distance (Table 4). The standard residual values ranged from −0.971 to 1.397 which is well within the threshold limit (±3). Likewise, the average Cook’s Distances was 0.226; well below the threshold of 1.0 which shows that overall, data points do not exhibit peculiarities. However, the maximum Cook’s distance was 1.058 indicating the presence of at least one outlier (an influential term that can lead to a regression model presenting a distorted image). Identifying such influential terms requires finding the Cook’s distance value of the individual data points. Removing the outliers from the data set requires finding the impact of such removal on the least square estimates. Such detailed analysis might not be warranted for exploratory studies such as this one wherein the data points showed a reasonably low average value (of Cook’s distance). Studies featuring large sample sizes and aiming to establish the relationships, however, need to analyze the possibility of removing of outliers from the data points. For more insights into this topic, interested readers should refer to Cook (1977).
TABLE 4. Residual statistics.
The R-Square value for the model was 0.642, indicating that the predictor variables could predict 64% of the variation in the dependent variable (Table 5). However, given the small sample size in this study, adopting a conservative estimate of the R Square value (adjusted R-Square) seems reasonable. The adjusted R Square value of the model is 0.54. Usually, R-Square values of more than 0.3 indicate acceptable regression models. The analysis of variance (ANOVA) showed that the regression model was significant at a 95% confidence level i.e., the p-value was less than 0.05. More specific measures of multicollinearity include tolerance and variance inflation factors (VIF) (Miles, 2014). The tolerance describes how much variability of a predictor variable is not explained by other independent variables in the model. The desired value of tolerance should exceed 0.1. Likewise, the desired value of VIF should be below 3, though some scholars (O’brien, 2007) permit higher VIF values. Table 5 shows that the tolerance and VIF value for both predictor variables is one, satisfying multicollinearity assumptions.
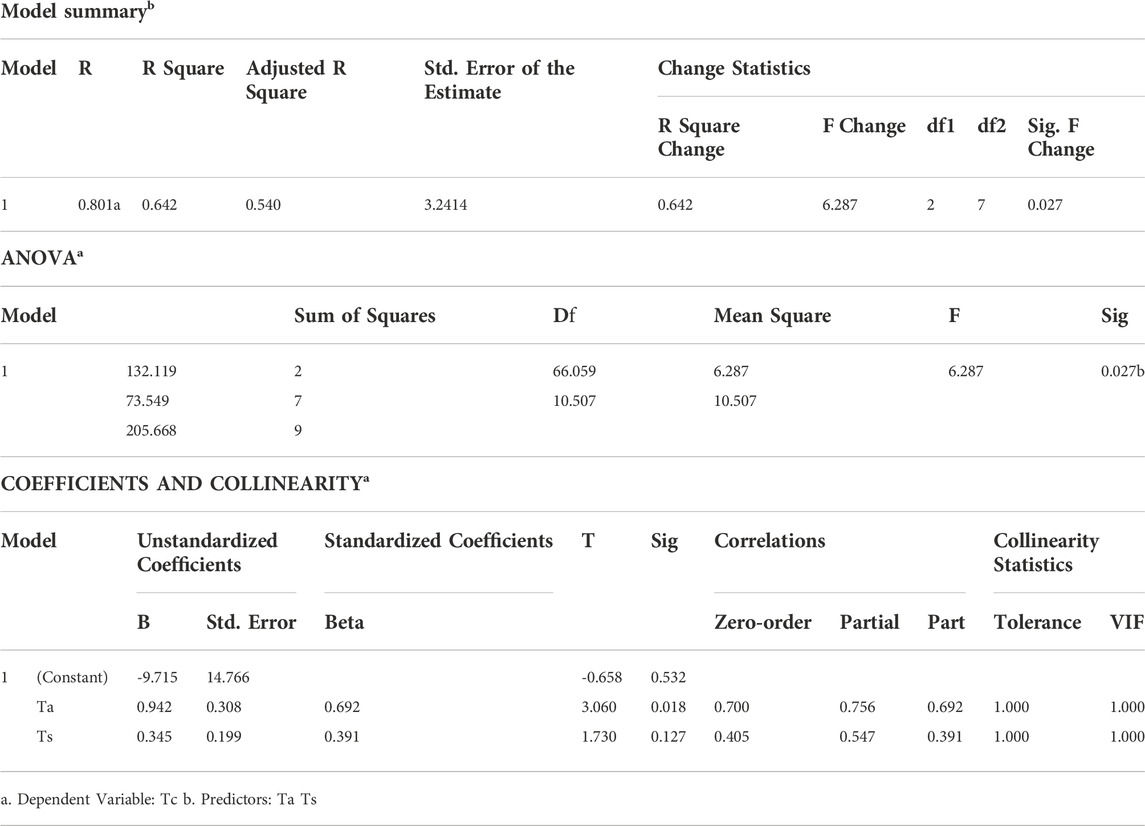
TABLE 5. Model summary, ANOVA, and coefficients of cabin temperature.
The air temperature variable has a standardized coefficient of 0.692 as compared to car skin temperature of 0.391, implying that more (nearly twice) variation in the outcome variable is explained by air temperature than car skin temperature. Notably, standardized coefficients offer a better comparison between the predicting power of independent variables compared to unstandardized coefficients. The unstandardized values of air temperature (0.942) and car skin temperature (0.345) are important from a modeling perspective. Thus, the car cabin thermal environment prediction model takes the following form based on the results of this study. Note that the air temperature is a significant predictor of the car cabin temperature (p < 0.05), but the car skin temperature is not (p > 0.05).
3.2 Passenger comfort evaluation
The impacts of cabin humidity, cabin temperature, and C O 2 concentration on the participants’ perception of body heat, body fatigue, eye fatigue, and skin dryness were measured (Table 2). The participants rated their experience under 20 varying conditions. Since the driver engagement was brief (15 min) and there were distinct boundary conditions and respondents for every car, it was deemed necessary to validate that the recorded measurements would adequately describe driver comfort levels. To this end, the internal consistency of the driver comfort data was measured using Cronbach’s α. A minimum α value of 0.7 is required to ensure internal consistency (Tavakol and Dennick, 2011). The α value for driver comfort data turned out to be 0.880 showing high internal consistency. To improve the validation, the analysis of the sensitivity of α value to the scale items was performed (Table 6). The analysis showed that the responses on skin dryness were not consistent, as α jumped to 0.913 upon removing skin dryness from driver comfort data. Therefore, skin dryness was excluded from subsequent regression modeling in this study. The statistical significance of the relationships was also tested. Thus, the overall reliability of the research method was ensured.
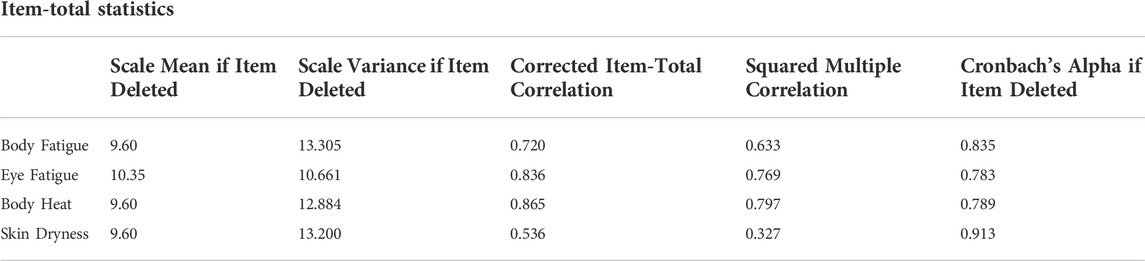
TABLE 6. Cronbach’s alpha: Item-total statistics.
To find if the skin dryness variable could be modeled using this data, a normal P-P plot of regression standardized residuals was plotted (Figure 3). The skin dryness rating data points did not satisfy the normality assumption. A non-linear regression or nonparametric statistical analysis was also unlikely to yield meaningful results because of the internal inconsistency of the measurement scale for skin dryness. Therefore, skin dryness was excluded from further analysis.
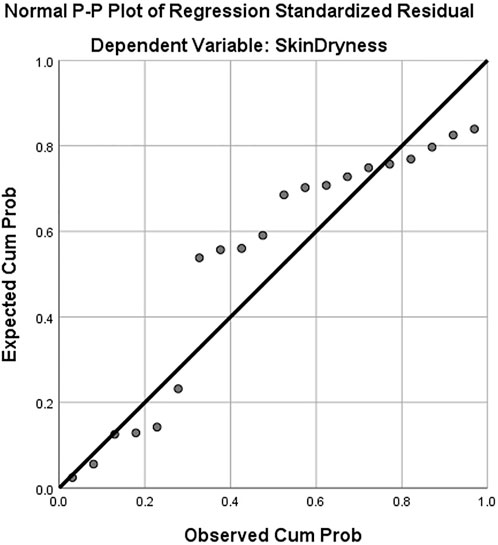
FIGURE 3. Normal P-P plot.
3.2.1 Perceived eye fatigue
Perceived eye fatigue was modeled as a function of Hc, Tc, and Cc levels. The correlations among predictor variables were less than 0.7, alleviating multicollinearity concerns. The correlation between cabin temperature and eye fatigue exceeded 0.3 indicating that temperature is a good predictor of eye fatigue. Humidity and CO2 show insignificant weak correlations (<0.3) with eye fatigue. Diagnostic plots revealed that the assumptions of normality and homoscedasticity were satisfied (Figure 4). Other assumptions of linear regression including independence and linearity, were also satisfied but were not discussed here considering the exploratory nature of the study and for the sake of brevity. Interested readers are referred to the relevant literature (James et al., 2021) for further diagnostics of the data used in the study (Table 2).
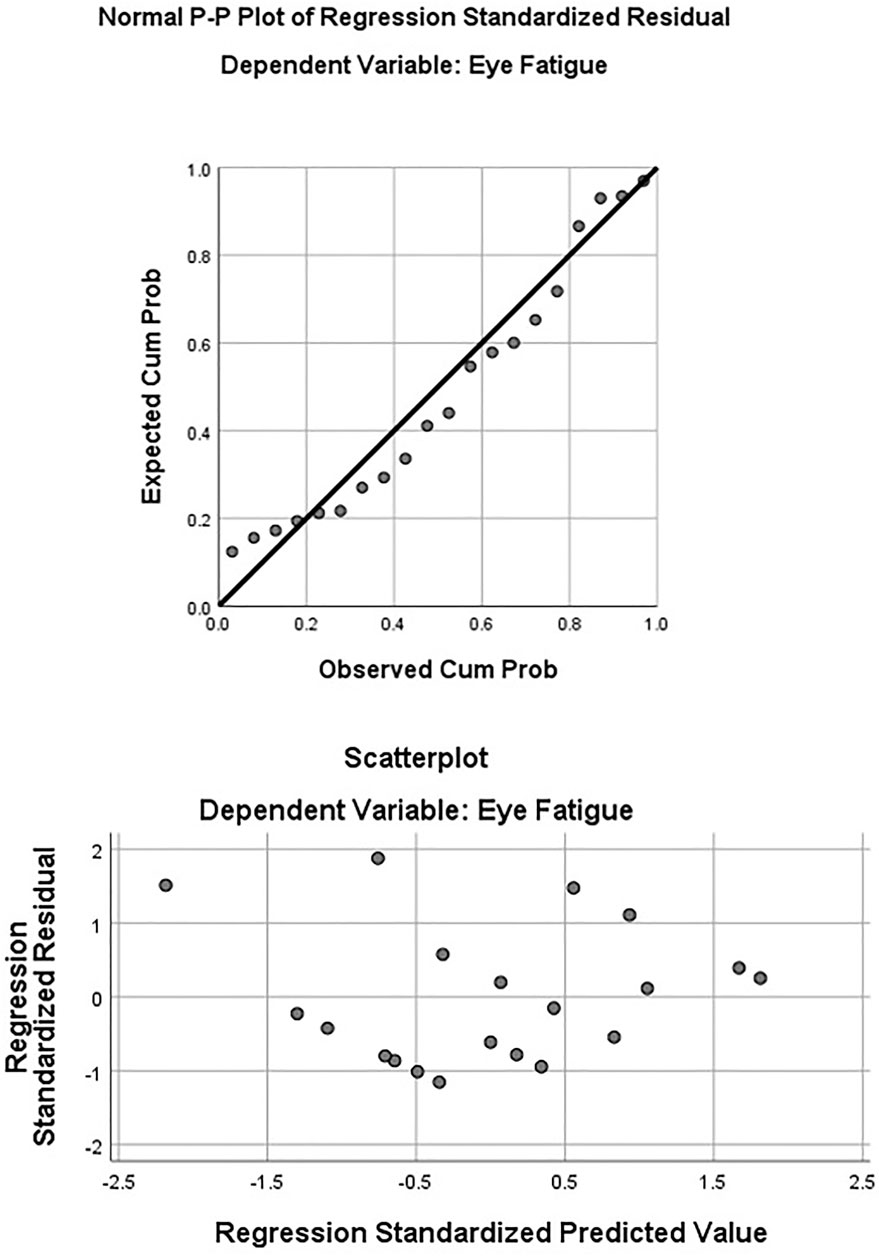
FIGURE 4. Diagnostic plots; eye fatigue.
The R-Square value for the model was 0.529, implying that the independent variables could predict a 52.9% variation in the dependent variable (Table 7). However, given the small sample size (n = 20), adopting a more conservative estimate of the R Square value (adjusted R Square) seems reasonable here. The adjusted R Square value for the model was 0.441 which is acceptable. The ANOVA results showed that the regression model was significant at a 95% confidence level i.e., the p-value is less than 0.05. The standardized coefficients of humidity, temperature, and CO2 were 0.321, 0.723, and 0.019, respectively, showing that cabin temperature explains more than twice the variation in eye fatigue as compared to cabin humidity. CO2 levels explained little to no variance in the outcome variable. Cabin temperature is a significant explanatory variable (p < 0.05), but humidity and CO2 levels were not. The collinearity statistics were satisfactory (tolerance >0.3 and VIF<3). Overall, the eye fatigue prediction model takes the following form.
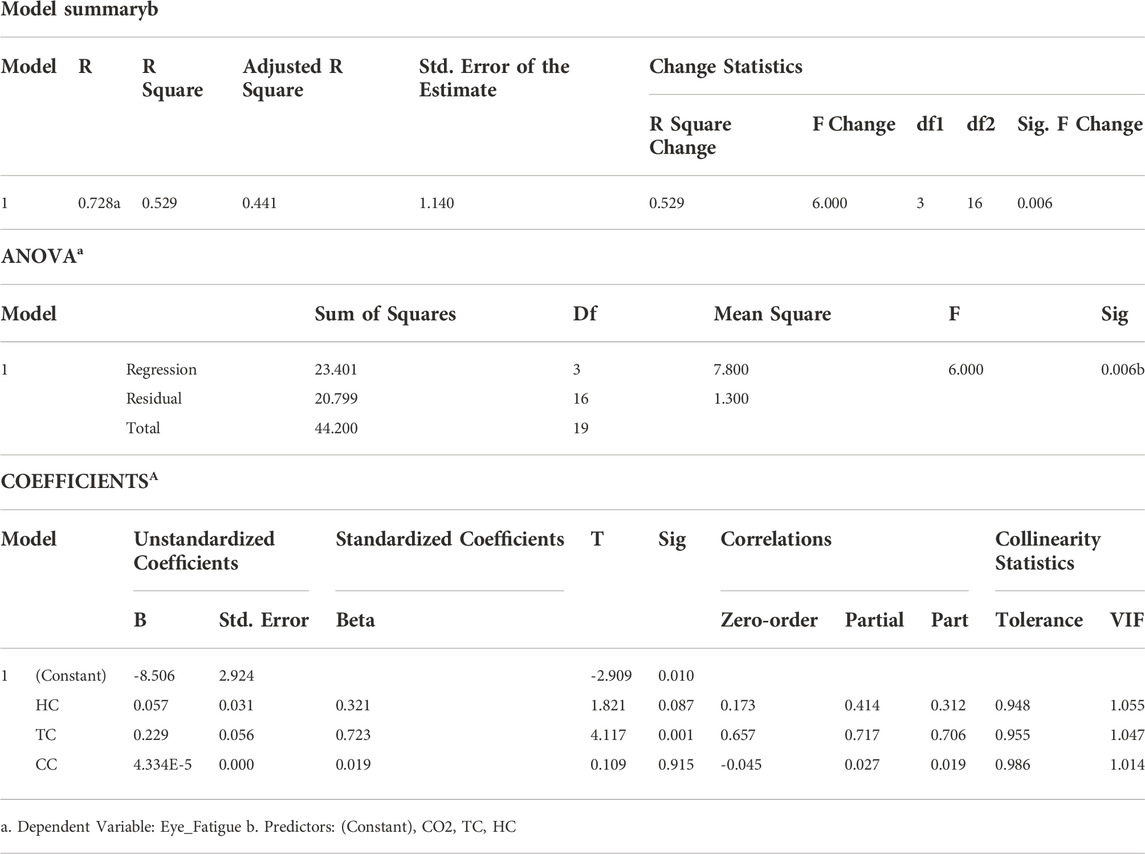
TABLE 7. Model summary, ANOVA, and coefficients of eye fatigue.
Because the impact of CO2 concentration was negligible (to the order of 10-5), it was excluded from the final model.
3.2.2 Body fatigue
Like eye fatigue, body fatigue was modeled as a function of Hc, Tc, and Cc levels. The correlation between body fatigue with predictors was more than 0.3 in the case of Hc and Tc and less in the case of Cc (Table 8). It implies that CO2 level might not be a strong predictor of body fatigue. The correlation of body fatigue is highest for Tc (0.680), as shown in Table 8. Notably, the correlations among predictor variables were less than 0.7, reducing the multicollinearity concerns. Diagnostic plots showed that the assumptions of normality and homoscedasticity were not violated (Figure 5).
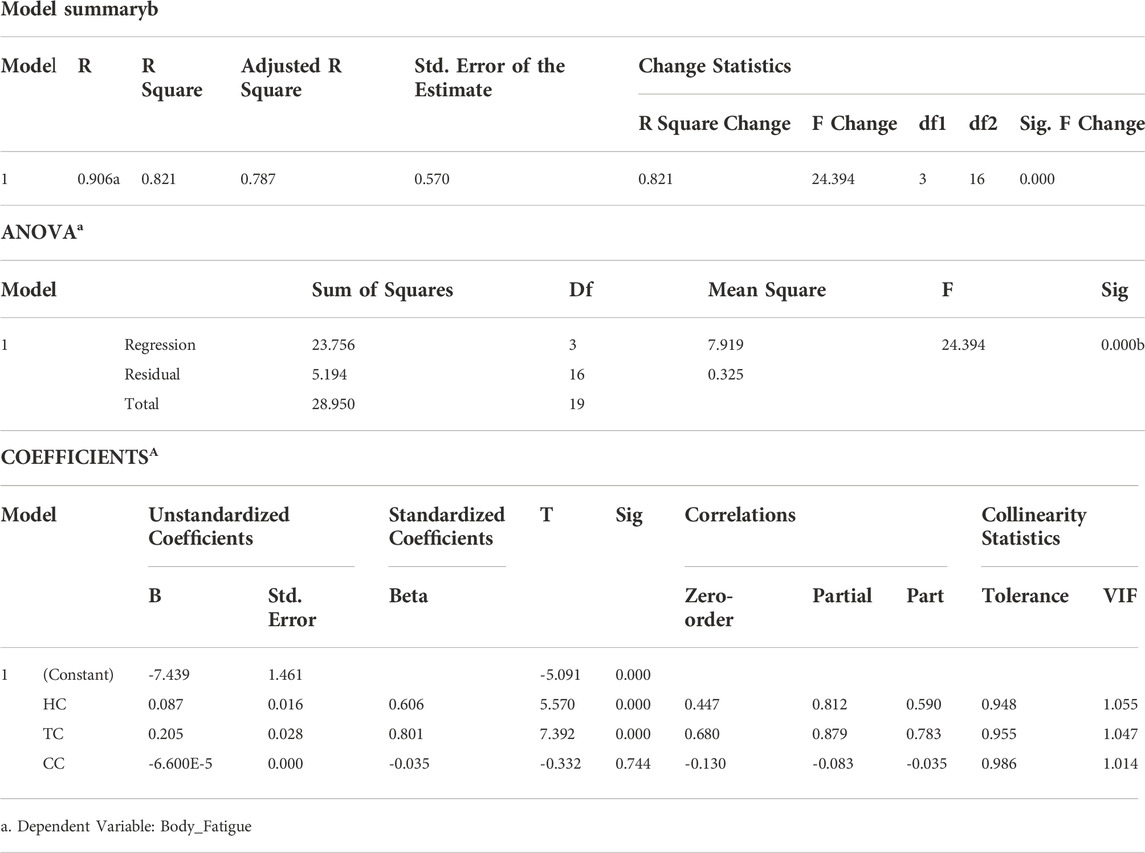
TABLE 8. Model summary, ANOVA, and coefficients of body fatigue.
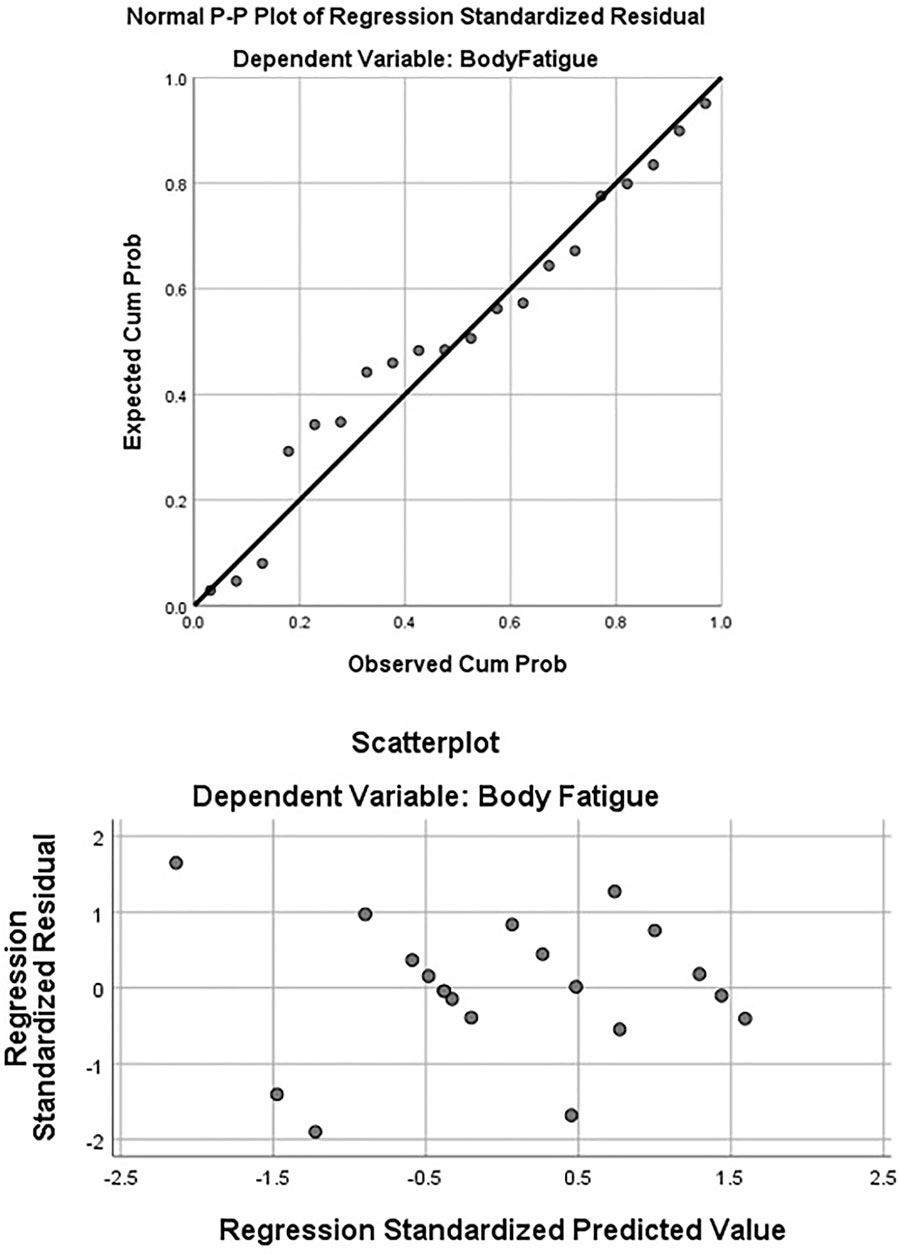
FIGURE 5. Diagnostic plots, body fatigue.
The adjusted-R Square value of the model was 0.787 which was significantly powerful, especially considering the small sample size (Table 8). Thus, the model could explain 78.7% of the variance of the body fatigue variable. The analysis of variance (ANOVA) showed that the regression model was significant at a 95% confidence level. The standardized coefficients of Hc and Tc were 0.606 and 0.801, respectively. It implied that the latter can explain 25% more variations in body fatigue than the former. On the other hand, the Cc level explained little to no variance in body fatigue (standardized coefficient = −0.035). Tc and Hc were statistically significant (p < 0.05), but Cc was not. The collinearity statistics are satisfactory (tolerance >0.3 and VIF<3). Overall, the body fatigue prediction model is written as follows:
Note that the impact of CO2 concentration on body fatigue was negligible (to the order of 10-5) and was thus excluded from the final model.
3.2.3 Body heat
Like body fatigue and eye fatigue, body heat was also modeled using Hc, Tc, and Cc as predictor variables. Table 9 showed that the correlation between body heat and Tc was the highest (0.551) was statistically significant (p < 0.05). The intercorrelations among predictor variables were less than 0.7, thereby reducing the multicollinearity concerns. The correlations of Tc and Hc with body heat are more than 0.3 indicating that these predictors were good candidates for the intended regression modeling. Cc, on the other hand, showed insignificant (p > 0.05) and weak (<0.3) correlations with the body heat rendering its candidacy as a predictor variable, questionable. Diagnostic plots showed that the assumptions of normality and homoscedasticity were valid (Figure 6).
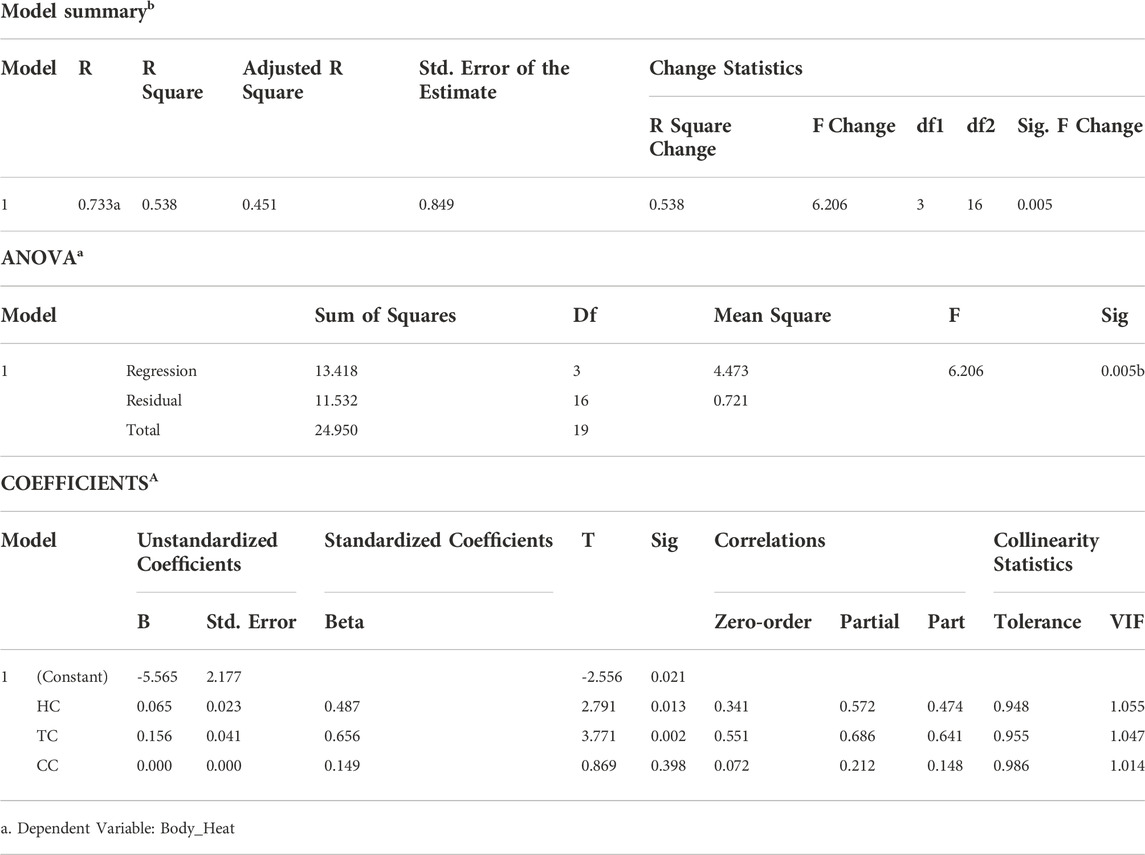
TABLE 9. Model summary, ANOVA, and coefficients of body heat.
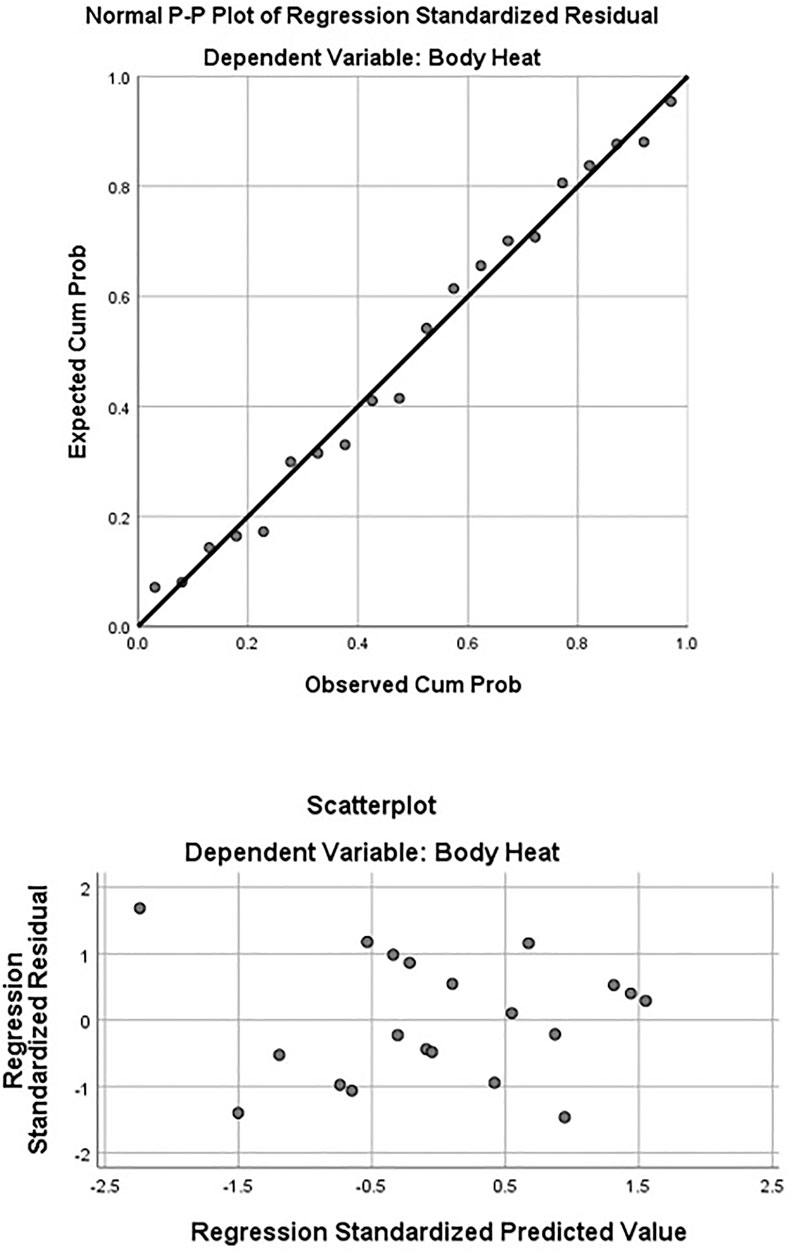
FIGURE 6. Diagnostic plots, body heat.
Given the small sample size, adopting the adjusted R Square value seemed reasonable, which was 0.451 (Table 9). Thus, the model can explain 45.1% of the variance in Body Heat. The ANOVA results showed that the regression model was significant at a 95% confidence level i.e., the p-value was less than 0.05. The standardized coefficients of humidity, temperature, and CO2 were 0.487, 0.656, and 0.149, showing that the cabin temperature explained the most variation in body heat. However, the CO2 level explained little to no variance in the outcome variable. Both Tc and Hc were significant explanatory variables (p < 0.05), but the Cc Level was not. The collinearity statistics were also satisfactory (tolerance >0.3 and VIF < 3). Overall, the body heat prediction model takes the following form based on the results of this study.
Note that the impact of CO2 concentration on body heat was not observed.
4 Discussions
The car cabin environment can be described in terms of thermal and air exchange parameters. The thermal factors used in this study were temperature and humidity and the air exchange factor was CO2, which is consistent with the literature (Szczurek and Maciejewska, 2016). Intuitively, cabin temperature and humidity can be associated with the surrounding air temperature and humidity. However, simultaneously modeling air temperature and humidity as predictors can be misleading in that the two are strongly correlated, raising multicollinearity concerns. In this study, the correlation between air humidity and the air temperature was found to be perfect (0.995). This is why the cabin environment was studied only as a function of air temperature and not air humidity.
The driver perception of comfort data measured using a five-point Likert scale in this study is ordinal scale data (or at best interval scale data). Still, during the analysis, it is treated as ratio scale data which is a higher-level data type than the ordinal and interval scales. Future studies should treat such data carefully. Before using the data for parametrical statistical analysis, the assumptions of normality, linearity, homoscedasticity, and independence should be tested using diagnostic plots. If any of these assumptions do not hold, scholars should be careful in their choice of analysis methodology. Alternate analysis techniques are available for data that do not follow a normal distribution. For more discussion on this topic, interested readers are referred to the relevant literature on nonparametric statistical techniques (Kraska-MIller, 2013).
The correlation between cabin temperature and the surrounding air temperature was found to be strong (0.7) and significant (p < 0.05). However, the correlation between car skin temperature and car cabin temperature was weak (0.02). This may be attributed to several factors including shading conditions and the car skin temperature measurement technique used in this study which targeted maximum skin temperature instead of the average skin temperature. Still, this finding warrants further investigation with a larger sample size. In the final regression model, the air temperature explained three times the variation in the car cabin temperature as compared to the car skin temperature. Thus, air temperature is a better predictor of the car cabin thermal environment than car skin temperature.
Passenger comfort was measured using three constructs: body heat, body fatigue, and eye fatigue. The attempt to evaluate the fourth construct (skin dryness) was not successful as the internal consistency of data was low and diagnostic plots showed skin dryness data did not follow a normal distribution. The impact of cabin temperature on eye fatigue was estimated to be 2.25 times more than the impact of humidity (Table 7). An increase in temperature and humidity translated into an increase in eye fatigue. Eyeblink suppression and ocular surface irritation are known sources of eye fatigue for drivers (Sullivan, 2008). While more studies are needed to specify the repercussions of visual fatigue on driving tasks, an already-known characteristic of eye fatigue is that it has no permanent effect and can be resolved by taking rest (Megaw, 1995). The amount of rest needed to recover from visual fatigue is unknown (Sullivan, 2008).
The participants also reported an increase in body fatigue at high cabin temperatures and high humidity levels. The impact of cabin temperature on body fatigue was 132% more than that of cabin humidity. Likewise, for body heat, the temperature impact was 134% more than the humidity effect. However, the impact of CO2 concentration on driver comfort (body fatigue, body heat, and eye fatigue) was negligible. This may be due to short-term exposure to the gas at low concentrations. The maximum level of CO2 reached during the experiment was 3,908 ppm (Table 2). Future studies might consider assessing the impact of higher concentrations of CO2 on driver fatigue.
One of the elements of novelty in this study is the use of real field settings to elicit drivers’ perceptions of comfort levels concerning the changing cabin thermal profile. Previous studies used lab-based design to evaluate the dynamics of the car cabin environment and related driver experience (Tsutsumi et al., 2007; Mathur, 2016). Moreover, the literature does not offer any study on the impact of cabin heat on the driver comfort level in the UAE, given that the country features one of the hottest summers in the world. Driver experience in everyday situations is a product of both the external (air) and the internal (cabin) thermal profiles which differ from the lab-based experimental where the study participants usually sit in an AC environment before entering the climate chambers for the experiment. Hence, this study is expected to evoke a more lifelike thermal experience among drivers and to gather more realistic data on their comfort levels than the previous studies.
Another contribution of this study is the use of simple instruments only a thermal camera and an air quality measuring device is used for the cabin environment modeling. Another remarkable feature is the brief engagement time for the study participants (around 15 min including 10 min of sitting in the car and 5 min of filling out the questionnaire). Fewer equipment needs and shorter study duration mean that more stakeholders can use this method to study the cabin environment and driver comfort. Moreover, a psychometric approach was employed to evaluate driver comfort, which was previously analyzed using elaborate experimental settings (Tsutsumi et al., 2007; Mathur, 2016). Besides health impacts, the cabin thermal environment affects fuel consumption (Mansour et al., 2018). Cabin heating issues are also linked with parking behavior (parking choice, duration, visiting hours, etc.). Therefore, this study is expected to attract a broad readership including transport and health policymakers, parking managers, and scholars.
This study’s findings can be applied to the assessment of comfort conditions and the design of car cabins according to comfort requirements. Driver comfort improved significantly and quickly (within 5 minutes) as in cabin thermal parameters were enhanced. For example, the average body fatigue reduced from 4.2 to 2.7 when the average relative humidity was reduced from 37.2% to 24.2%, and the temperature from 41.8°C to 40.0°C (Table 2). This finding corroborates the literature that asserts a quicker response to thermal stress in car cabins (Danca et al., 2016). Likewise, eye fatigue and body heat were also reduced from 3.4 to 4.0 to 2.0 and 2.9, respectively. However, note that these improvements in thermal comfort parameters are relative, and not absolute i.e., the study does not quantify thermal comfort levels. Future studies might want to consider differentiating thermal comfort from discomfort to strengthen this study’s findings toward improving the ergonomics of car cabin thermal environments.
The limited sample size is one one of this study’s limitations, which may have diminished the statistical analysis power. This also resulted in the lack of data required for model validation. Therefore, as the title suggests, this study should be treated as an exploratory study to guide future research in this domain. Another limitation is the direct measurement of constructs (body heat, body fatigue, and eye fatigue). Using Likert scale to measure complex constructs can be misleading. This limitation was addressed by ensuring an acceptable level of internal consistency in the employed scale (Table 6). Finally, the time of day when the reading is taken might affect body fatigue, eye fatigue, and body heat. For example, for the body fatigue readings taken in the afternoon, study participants might already be tired due to daylong activity which could affect their item rating on the Liker scale. Future research should consider accounting for the impact of such covariates.
5 Conclusion
This exploratory study demonstrated that modeling the car cabin thermal environment as a function of external air temperature and car skin temperature is feasible. Air temperature has a more pronounced impact on the cabin environment than car skin temperature. The cabin environment affects driver comfort level which can be measured using four constructs: body heat, body fatigue, eye fatigue, and skin dryness. The first three constructs might be measured psychometrically, but skin dryness might not be measured in the same way. Respondents could not describe their feelings of skin dryness in an internally consistent manner, that is, they could not employ the same scale to rate skin dryness. This finding has implications for future studies that measure skin dryness or other similar constructs. The level of comfort was shown to be more sensitive to cabin temperature than it is to the cabin humidity and CO2 levels. The CO2 concentration studied in this experiment was 3,908 ppm, and its impact on driver comfort was negligible. This corroborates with the literature which suggests no serious health impacts for CO2 levels below 5,000 ppm (Prill, 2000).
Car cabin environment modeling should be studied more often, focusing on passenger comfort. Simple research methods can facilitate various stakeholders in expanding the scope of this research domain. In this regard, methods requiring minimal instrumentation could facilitate relevant policymakers and practitioners in collecting empirical data for their specific needs. Thermal camera-based technologies are anticipated to become more widespread in near future; thanks in part to the advancement in drone-based thermal images. Aerial thermal photographs can help scan fleets of vehicles in parking lots and urban traffic revealing a wealth of information that was previously unavailable to parking managers and policymakers.
This study used only white cars to rule out the impact of car color on the cabin environment. Future studies might consider using different colored cars to gain more insight into the impact of car surfaces on the cabin environment. Moreover, the study used a small sample size that did not allow for evaluating the impact of shading conditions on the cabin environment. Future studies should consider increasing the sample size, that is, including more cars in the experiment, and allowing parking enough cars under different shading conditions to study and compare the impact of various parking types on the cabin environment and driver comfort. These findings would partly explain the choice, timing, and duration of parking, and would interest parking managers and urban transport planners whose businesses are sensitive to the dynamics of parking behavior. A large sample size will also allow for the validation of study findings.
Psychometric approaches to analyze constructs related to passenger comfort should be preferred over the other, more complex methods requiring instrumentation. This study demonstrated that reliable data on passenger comfort can be obtained and analyzed using effective parametric statistical techniques. Future studies should also consider using nonparametric statistical techniques, such as ordinal regression, should the assumptions of normality, homoscedasticity, independence, or linearity fail to hold. This, however, should be performed only on internally consistent data. In this regard, Cronbach’s alpha is a useful parameter. Clear explanations of study constructs to study participants may aid in improving data internal consistency. In this study, skin dryness could not be evaluated due to low internal consistency. Interested readers are referred to Tsutsumi et al. (2007) for alternative methods of measuring skin dryness.
Data availability statement
The raw data supporting the conclusion of this article will be made available by the authors, without undue reservation.
Author contributions
KA: designed the research study, purchase equipment, handle logistical arrangement for the car experiment, conducted car experiment and driver interview, contributed in the literature, data analysis, results, conclusion, review the overall manuscript. Eng. MR: contributed in the study design, literature, data analysis, results and discussion.
Funding
This work was supported by the United Arab Emirates University [SURE Grant Proposal # 2184, 2022].
Acknowledgments
The authors would like to acknowledge the support received by United Arab Emirates University in conducting this study, as well as all participating research assistant students.
Conflict of interest
Author MR was employed by The Urban Unit Private Limited.
The remaining author declares that the research was conducted in the absence of any commercial or financial relationships that could be construed as a potential conflict of interest.
The handling editor KG declared a shared affiliation with the author KA at the time of review.
Publisher’s note
All claims expressed in this article are solely those of the authors and do not necessarily represent those of their affiliated organizations, or those of the publisher, the editors and the reviewers. Any product that may be evaluated in this article, or claim that may be made by its manufacturer, is not guaranteed or endorsed by the publisher.
References
Adegun, O. B., Mbuya, E. C., and Njavike, E. (2022). Responses to heat stress within an unplanned settlement in dar Es salaam, Tanzania. Front. Built Environ. 8. doi:10.3389/fbuil.2022.874751
Cook, R. D. (1977). Detection of influential observation in linear regression. Technometrics 19, 15–18. doi:10.2307/1268249
Crizzle, A. M., Bigelow, P., Adams, D., Gooderham, S., Myers, A. M., and Thiffault, P. (2017). Health and wellness of long-haul truck and bus drivers: A systematic literature review and directions for future research. J. Transp. Health 7, 90–109. doi:10.1016/j.jth.2017.05.359
Croitoru, C., Nastase, I., Bode, F., Meslem, A., and Dogeanu, A. (2015). Thermal comfort models for indoor spaces and vehicles—current capabilities and future perspectives. Renew. Sustain. Energy Rev. 44, 304–318. doi:10.1016/j.rser.2014.10.105
Danca, P., Vartires, A., and Dogeanu, A. (2016). An overview of current methods for thermal comfort assessment in vehicle cabin. Energy Procedia 85, 162–169. doi:10.1016/j.egypro.2015.12.322
Gregorich, M., Strohmaier, S., Dunkler, D., and Heinze, G. (2021). Regression with highly correlated predictors: Variable omission is not the solution. Int. J. Environ. Res. Public Health 18, 4259. doi:10.3390/ijerph18084259
Horak, J., Schmerold, I., Wimmer, K., and Schauberger, G. (2017). Cabin air temperature of parked vehicles in summer conditions: Life-threatening environment for children and pets calculated by a dynamic model. Theor. Appl. Climatol. 130, 107–118. doi:10.1007/s00704-016-1861-3
James, G., Witten, D., Hastie, T., and Tibshirani, R. (2021). An introduction to statistical learning: With applications in R. (Springer Texts in Statistics). (2nd ed. 2021). Springer.
Joubert, D., Thomsen, J., and Harrison, O. (2011). Safety in the heat: A comprehensive program for prevention of heat illness among workers in abu dhabi, united Arab Emirates. Am. J. Public Health 101, 395–398. doi:10.2105/AJPH.2009.189563
Kraska-Miller, M. (2013). Nonparametric statistics for social and behavioral sciences. Boca Raton, FL/New York, NY: Chapman and Hall/CRC Press.
Levinson, R., Pan, H., Ban-Weiss, G., Rosado, P., Paolini, R., and Akbari, H. (2011). Potential benefits of solar reflective car shells: Cooler cabins, fuel savings and emission reductions. Appl. Energy 88, 4343–4357. doi:10.1016/j.apenergy.2011.05.006
MacLachlan, A., Biggs, E., Roberts, G., and Boruff, B. (2021). Sustainable city planning: A data-driven approach for mitigating urban heat. Front. Built Environ. 6, 519599. doi:10.3389/fbuil.2020.519599
Mansour, C., Bou Nader, W., Breque, F., Haddad, M., and Nemer, M. (2018). Assessing additional fuel consumption from cabin thermal comfort and auxiliary needs on the worldwide harmonized light vehicles test cycle. Transp. Res. Part D Transp. Environ. 62, 139–151. doi:10.1016/j.trd.2018.02.012
Marcotullio, P. J., Keßler, C., and Fekete, B. (2022). Global urban exposure projections to extreme heatwaves. Front. Built Environ. 233.
Mathur, G. (2016). Experimental investigation to determine influence of build-up of cabin carbon dioxide concentrations for occupants fatigue. SAE International. Technical Paper. doi:10.4271/2016-01-0254
Megaw, E. D. (1995). “The definition and measurement of visual fatigue,” in Eval. Hum. Work. Pract. Ergon. Methodol. 2nd Ed Lond. (UK Taylor Francis), 841–863.
Miles, J. (2014). “Tolerance and variance inflation factor,” in Wiley StatsRef: Statistics reference online (John Wiley & Sons). doi:10.1002/9781118445112.stat06593
Nakano, J., and Tanabe, S. (2020). Thermal adaptation and comfort zones in urban semi-outdoor environments. Front. Built Environ. 6, 34. doi:10.3389/fbuil.2020.00034
O’brien, R. M. (2007). A caution regarding rules of thumb for variance inflation factors. Qual. Quant. 41, 673–690. doi:10.1007/s11135-006-9018-6
Prill, R. (2000). Why measure carbon dioxide inside buildings? Washington State University Extension Energy Program. Available at: https://www.energy.wsu.edu/documents/co2inbuildings.pdf.
Ratner, B. (2009). The correlation coefficient: Its values range between +1/−1, or do they? J. Target. Meas. Anal. Mark. 17, 139–142. doi:10.1057/jt.2009.5
Sarikaya, A., and Gleicher, M. (2018). Scatterplots: Tasks, data, and designs. IEEE Trans. Vis. Comput. Graph. 24, 402–412. doi:10.1109/TVCG.2017.2744184
Siddique, A. H., Rodrigues, C., and Simmons, R. (2019). The impact of PV shades in reducing heat stress in the ONG drilling industry in the western region of the united Arab Emirates. OnePetro. doi:10.2118/197462-MS
Sullivan, J. M. (2008). Visual fatigue and the driver. The University of Michigan. Available at: https://deepblue.lib.umich.edu/bitstream/handle/2027.42/61186/100999.pdf?sequence=1.
Szczurek, A., and Maciejewska, M. (2016). Categorisation for air quality assessment in car cabin. Transp. Res. Part D Transp. Environ. 48, 161–170. doi:10.1016/j.trd.2016.08.015
Tavakol, M., and Dennick, R. (2011). Making sense of Cronbach’s alpha. Int. J. Med. Educ. 2, 53–55. doi:10.5116/ijme.4dfb.8dfd
Terrin, N., Schmid, C. H., and Lau, J. (2005). In an empirical evaluation of the funnel plot, researchers could not visually identify publication bias. J. Clin. Epidemiol. 58, 894–901. doi:10.1016/j.jclinepi.2005.01.006
Tsutsumi, H., Hoda, Y., Tanabe, S., and Arishiro, A. (2007). Effect of car cabin environment on driver’s comfort and fatigue. SAE Trans. 116, 335–346.
Weatherspark (2022). Al ain may 26, 2022 historical weather (united arab emirates) weather spark www document. weatherspark. URL Available at: https://weatherspark.com/h/d/105466/2022/5/26/Historical-Weather-on-Thursday-May-26-2022-in-Al-Ain-United-Arab-Emirates (accessed 8.21.22).
Keywords: cabin environment, driver comfort, thermal camera, likert scale, linear regression
Citation: Alkaabi K and Raza M (2022) Revisiting the dynamics of car cabin environment and driver comfort. Front. Built Environ. 8:1041305. doi: 10.3389/fbuil.2022.1041305
Received: 10 September 2022; Accepted: 14 November 2022;
Published: 07 December 2022.
Edited by:
Khaled Galal Ahmed, United Arab Emirates University, United Arab EmiratesReviewed by:
Haiguo Yin, Xi’an University of Architecture and Technology, ChinaCristina Piselli, University of Florence, Italy
Copyright © 2022 Alkaabi and Raza. This is an open-access article distributed under the terms of the Creative Commons Attribution License (CC BY). The use, distribution or reproduction in other forums is permitted, provided the original author(s) and the copyright owner(s) are credited and that the original publication in this journal is cited, in accordance with accepted academic practice. No use, distribution or reproduction is permitted which does not comply with these terms.
*Correspondence: Khaula Alkaabi, S2hhdWxhLmFsa2FhYmlAdWFldS5hYy5hZQ==