 Alexandra Scupin
 Radu Văcăreanu
- Reinforced Concrete Department, Technical University of Civil Engineering, Bucharest, Romania
Retrofitting the existing building stock is needed since it can cause significant losses as in case of a damaging earthquake, particularly in structures used for public services, such as schools. Effective and optimal seismic retrofitting measures applied to existing masonry constructions should arise from a strong understanding of the vulnerabilities associated with each structural typology and construction practice. Using representative structural configurations of the masonry buildings used in the education sector from Romania, the paper aims to evaluate the seismic risk associated to the existing buildings and to support informed decision-making for seismic retrofitting measures. Starting from a broad database of school masonry buildings, potential losses were evaluated considering two seismic hazard scenarios. For an earthquake having a 63% exceedance probability in 50 years, losses estimated for the education sector comprising masonry structures reached almost 240 mil. € and 2,500 potential casualties. For highlighting that investments in retrofitting masonry structures from the education sector lead to significant reductions of potential losses, prioritization criteria were proposed and cost–benefit analysis was carried out for about 15,000 buildings. Results are presented through graphs and maps that illustrate the distribution of annual failure probabilities at the national level. Therefore, the methodology proposed and the results presented in this paper can represent a valuable tool for substantiating public policies aiming at reducing the seismic risk, in particular for existing masonry structures.
1 Introduction
Almost 60% of the entire building stock of kindergartens, schools, and high schools in Romania consists in masonry structures used for classrooms and laboratories, according to the data collected in 2018–2019 for the national database of the Integrated Information System of Education in Romania (SIIIR). Considering that more than 20% of these are unreinforced masonry and more than half of them were built before 1920, their vulnerability is high and risk assessments should be focused on reducing seismic risk associated to them.
Previous studies regarding the effectiveness of strengthening interventions applied to similar typologies of masonry structures have been conducted in Europe (Penazzi, et al., 2001), (D’Ayala, et al., 1997), (Spence, et al., 2000), New Zealand (Ingham and Griffith, 2011), and South America (EERI Special Earthquake Report, 2007). Confined masonry structures, where the structural masonry walls have reinforced concrete elements on the border (tie beams and small columns), have proven to have a better behavior than the unreinforced masonry during seismic events, as confirmed by the experience from residential buildings in Chile (Moroni et al., 2004). Transforming existing unreinforced masonry structures into mixed systems with brick walls and reinforced concrete floors and frames, as well as reinforced concrete jacketing applied to masonry walls, represent retrofitting methods that have been extensively used in the last decades and continue to be applied in Romania (Scupin et al., 2020). However, these invasive traditional methods are strongly debated (Campos Pomba, 2007) since they might produce important variations in the global behavior of the structure in terms of stiffness and load-bearing capacity, potentially leading to inappropriate force distributions (Monteiro and Bento, 2012). Alternative retrofitting methods were also studied for the existing residential building stock from Romania, both in experimental campaigns (Lozinca et al., 2016) and through numerical models, in particular for a typical project of medium-rise apartment buildings retrofitted by means of fiber carbon sheets applied as an alternative to RC jacketing (Scupin et al., 2020). In literature, large-scale seismic risk assessments were performed by various methods, and the outcomes are presented in various ways, through risk maps or risk indicators such as the annual average loss ratio. However, one of the most important aspects related to seismic risk assessments performed at the regional or national scale is the data available in terms of exposure and vulnerability. Since the only extensive post-earthquake data collection was carried out after the 1977 Vrancea earthquake (around 12,500 masonry buildings inspected in Bucharest and 1800 in Iasi), it is difficult to employ empirically derived fragility functions (Vacareanu et al., 2012), as it is commonly carried out in seismic-prone countries [(Zuccaro and Cacace, 2015), (Vicente et al., 2014), (Lagomarsino and Giovinazzi, 2006)]. Partial use of large databases, such as the information collected as part of the census, is extremely useful in the residential sector, but there is always the need to complement available data with filed investigations and post-earthquake assessments. More than 250,000 residential buildings were assessed in Italy following the procedure proposed by Zuccaro (2015).
For planning the strengthening interventions on the existing building stock from the Alfama neighborhood in Lisbon, a loss assessment was carried out for the residential sector, and then retrofitting by means of adding steel ties was proposed (D’Ayala, et al., 1997). The efficiency of the retrofitting method proposed was analyzed by comparing damage probability matrix associated with the unstrengthened version and the strengthened version of the structures.
In order to assess the effectiveness and economic viability of investing in strengthening measures for reducing the risk associated to masonry buildings from Romania used in the education sector, cost–benefit analyses have been used. This type of analysis represents another way of assessing the feasibility of investing in large-scale seismic risk reduction through retrofitting. For the existing residential building stock from Lisbon, cost–benefit analyses were carried out in order to balance the technical and economical aspects involved in such a process. Alternative retrofitting methods were considered, such as using reinforced plastering, adding crown beams or bracing walls, and performing local strengthening works or even rebuilding, with appropriate average costs and then losses, and potential benefits were estimated for each retrofitting scenario (Marques et al., 2018).
2 Materials and methods
2.1 Seismic risk assessment
Seismic risk analyses for the entire building stock require information on exposure, in the form of inventories of people, buildings, and assets exposed. In order to assess the seismic vulnerability for large portfolios of buildings, the recommended approach involves establishing structural typologies that allow the initial filtering of a large number of buildings through objective criteria in order to estimate the expected structural response. The basic exposure and vulnerability parameters, such as number of pupils and teaching staff, number of shifts, structural system, year of construction, and surface or height regime, are available from the SIIIR database, along with the location of each school unit, which further provides data on the seismic hazard level on site. The data related to average annual exceedance rates of the seismic action which were used in the present paper comprise the results of the latest seismic hazard analysis carried out as part of the BIGSEES project (Pavel et al., 2016).
Fragility functions were assigned to the entire database of 15,084 masonry buildings, grouped in four types of structural systems presented in Table 1: URM_FF (unreinforced masonry structures with flexible floors), URM_RM (unreinforced masonry structures with rigid floors), CM (confined masonry), and CM_RM (retrofitted confined masonry). Confined masonry structures have reinforced concrete elements confining the masonry walls, such as tie beams, beams and columns, while the retrofitted version implies reinforced concrete jacketing of the masonry walls.
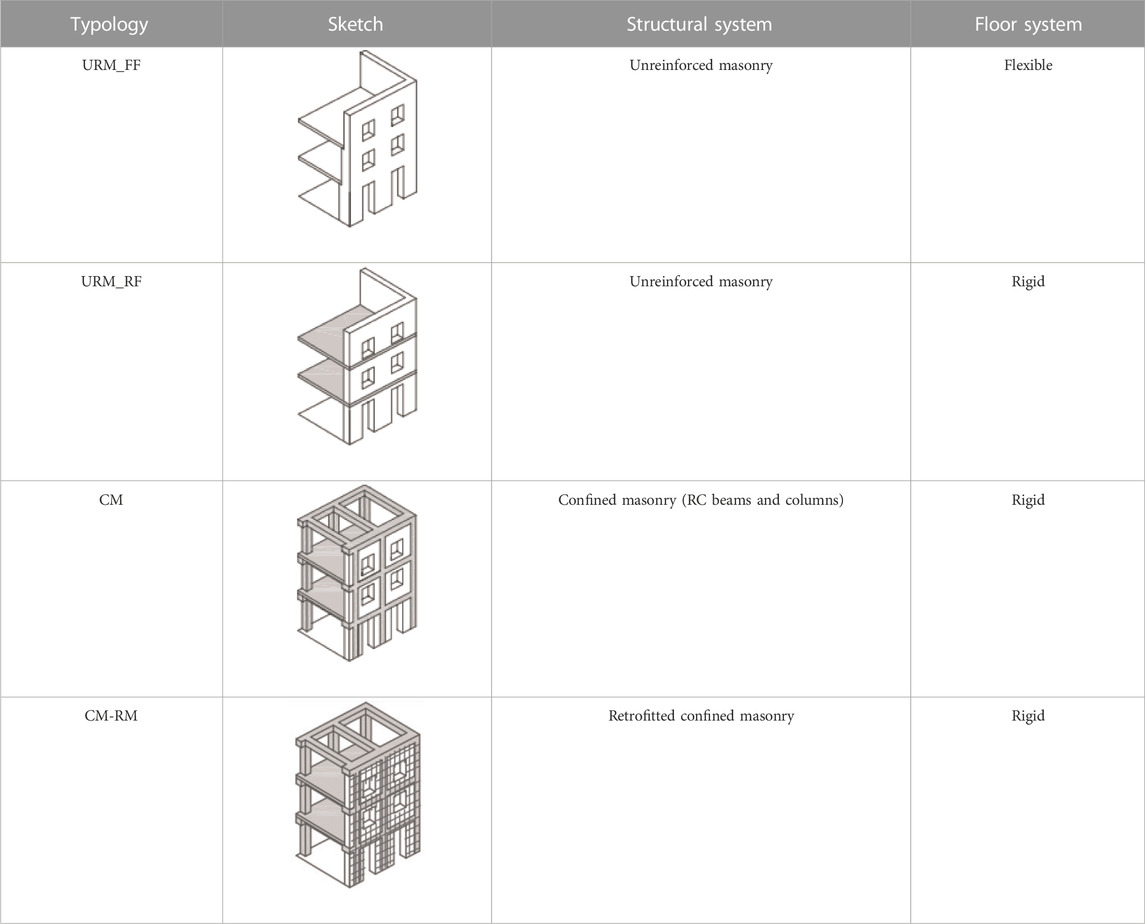
TABLE 1. Structural typologies used for the fragility assessment (adapted after Correia Lopes, et al., (2019).
These typologies are considered to be representative for the building stock of masonry structures from the education sector, where most of the structures hosting classrooms and laboratories are low-rise (less than three levels above ground). Figure 1 presents the distribution of these four structural typologies for the entire data sample used for the analysis.
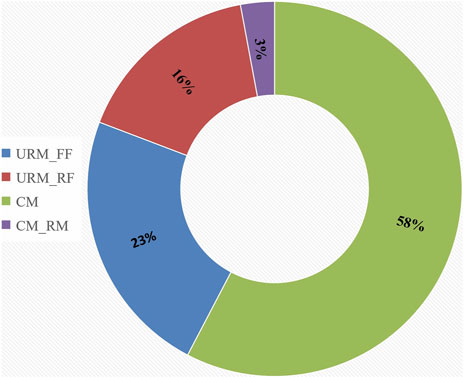
FIGURE 1. Masonry structure distribution for the education building stock (Romania).
Previous seismic risk assessments focused on masonry structures were performed for the existing residential building stock from Romania (Pavel et al., 2022) and for some massive heritage buildings (Scupin and Vacareanu, 2021). The seismic risk assessment employed in the present paper implies the convolution integral proposed by Kennedy that estimates the probability of exceeding a certain level of structural damage (failure probability PF) based on the fragility (PF|a) and the hazard (HA), namely, the annual rate of exceedance for a certain ground motion amplitude (Kennedy, 2011):
2.2 Structural fragility
In order to assess the fragility parameters for each of the typologies considered, numerical models were realized based on a school building from Bucharest that was initially built in 1884 as a two-story unreinforced masonry structure with flexible wooden floors, which passed during time through progressive structural changes aimed to improve its behavior. First, in the 1940s, the wooden floors were replaced by 12-cm-thick reinforced concrete slabs and then, after the 1977 Vrancea earthquake, a few reinforced concrete frames were added (beams and columns), transforming the structure into a confined masonry one. The latest retrofitting project aimed to align the structural behavior of the building to the latest safety regulations and thus proposed jacketing of most of the masonry walls (10-cm-thick shotcrete reinforced with ø10/15 × 15 cm), the addition of supplementary reinforced concrete columns and some local repairs. The plan view of the semi-basement level shown in Figure 2 presents the location of the initial RC columns, as well as the current strengthening measures proposed for the school building.
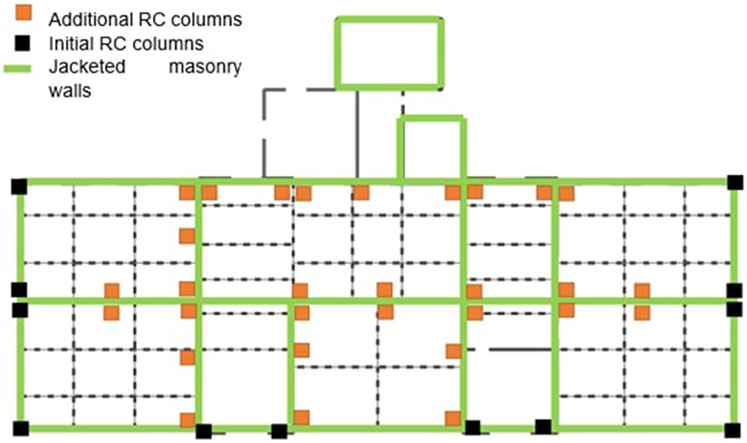
FIGURE 2. School plan view: evolution of retrofitting interventions.
TREMURI (Lagomarsino et al., 2013) and 3DMacro software were used for the non-linear static analyses of the structures, the first one for the unreinforced masonry systems and the last one for the mixed RC–masonry system, in order to properly model the interfaces between masonry panels and RC elements. The numerical models created using TREMURI use deformable macro-elements (piers and spandrels) connected by rigid nodes and allow capturing two failure mechanisms specific for masonry structures: yielding caused by shear in spandrels (diagonal cracking) and for piers and failure caused by combined bending and compression (Scupin et al., 2021). However, in order to capture the interaction between RC elements (beams and columns) and masonry walls, 3DMacro defines interface springs placed at the edges of masonry panels that work in compression-bending and shear (Formisano, 2014). Previous research in the field of assessing existing masonry structures by means of numerical models highlighted that both software are adequate for non-linear static analyses (Marques and Lourenço, 2014). In order to define the material characteristics for all the numerical models used, specific information collected as a part of the seismic evaluation report was used. The material properties defined for existing masonry structures from Romania were previously tested as part of experimental campaigns (Lozinca et al., 2016), and further on, numerical models of masonry walls were calibrated based on them (Scupin and Vacareanu, 2021).
Once capacity curves were obtained for each model, level II methodology from the RISK-UE project (Milutinovic and Trendafiloski, 2003) was used to establish thresholds for each damage level (minor, moderate, extensive, and complete) and then obtain fragility curves expressed function of median values of spectral displacements and standard deviations. Fragility curves obtained for the longitudinal direction of the building, the most vulnerable one, are shown in Figure 3 (URM-FF), Figure 4 (URM-RF), Figure 5 (CM), and Figure 6 (CM-RM). Comparing the expected damage level associated to the same values of spectral displacements, it can be observed that the highest exceedance probabilities are obtained for the structures having unreinforced masonry walls and flexible floors, with a significant improvement for the behavior of confined masonry and retrofitted masonry.
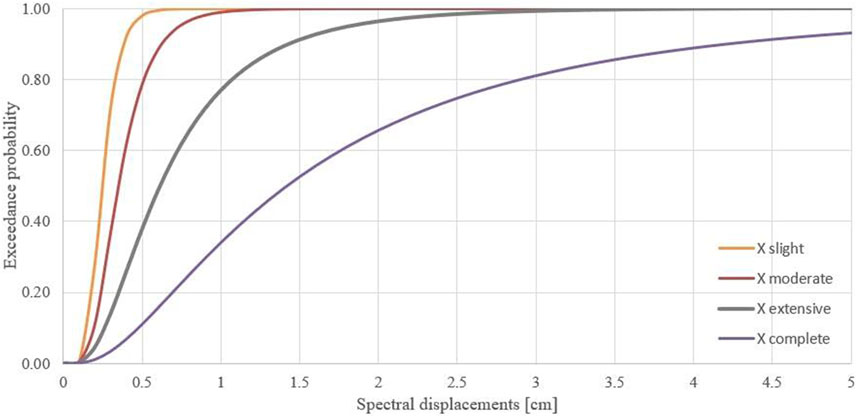
FIGURE 3. Fragility curves for URM-FF.
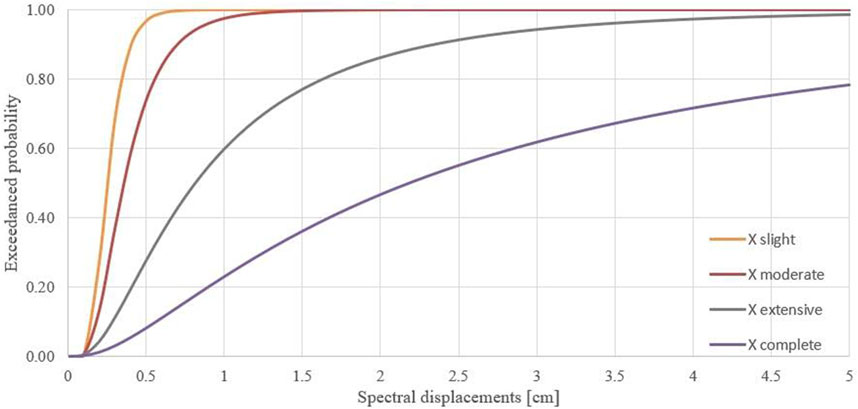
FIGURE 4. Fragility curves for URM-RF.
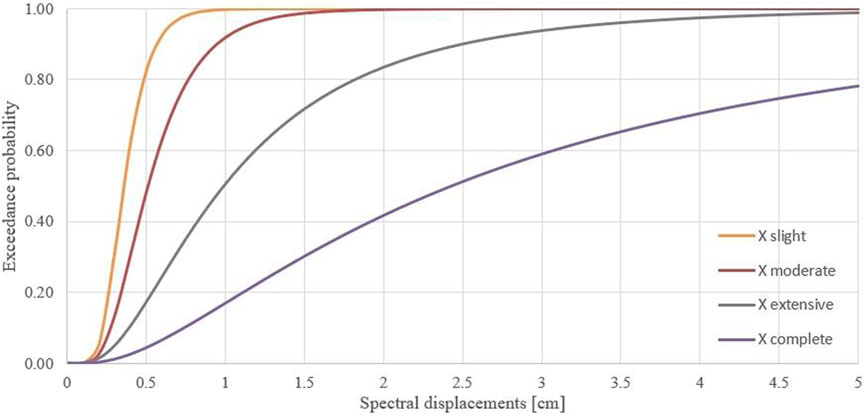
FIGURE 5. Fragility curves for CM.
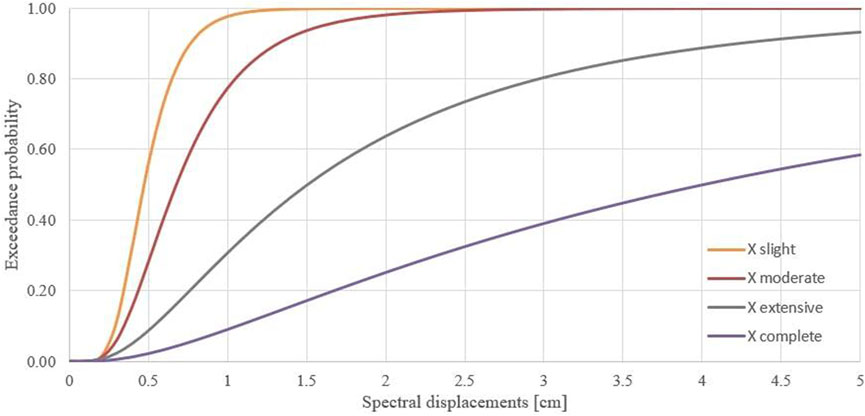
FIGURE 6. Fragility curves for CM-RM.
The fragility curves obtained from the numerical models of the school were compared to those of similar structural systems from relevant literature in the field of assessment of masonry structures. For the confined masonry structures, the ‘Placa’ structural systems from Lisbon, Portugal, were used since they are mixed masonry–RC buildings with rigid slabs, built in between the 1940s and 1960s, similar to the structures from Romania. Comparing the fragility curves proposed by Lamego et al. (2017) for medium-rise Placa buildings expressed in spectral displacement and standard deviations with the fragility curves obtained for the CM (see Figure 5) model of the school, good agreements were obtained for all the damage states.
2.3 Cost–benefit analysis
In order to estimate the efficiency of retrofitting existing masonry structures, the seismic risk calculations for the education sector are first carried out based on the seismic fragility of the structures as they are currently reported in the database and then compared with the risk estimates computed for retrofitted structures (CM-RM) that have different fragilities associated.
The tool used for evaluating the feasibility of investing in retrofitting the masonry school buildings from Romania is the cost–benefit analysis, which is an economic planning of the retrofitting expenditures and the estimated benefits from reducing the seismic risk through such actions.
The first step of the analysis is represented by the loss estimation for the portfolio considered. The losses are quantified for the existing situation and for the potentially retrofitted building stock following the HAZUS methodology (FEMA, 2015), which presents a method for establishing a link between the expected level of damage resulted from fragility curves and the direct losses or number of casualties and injured people during a seismic event. For each damage condition (slight damage, moderate damage, extensive damage, and complete damage), the handbook indicates casualty rates expressed in percentages that have to be multiplied with the corresponding probabilities of exceeding a certain damage state in order to determine the probability of casualties, for a specified number of persons exposed.
The input data are represented by the basic structural and exposure parameters from the national database of the education system in Romania (SIIIR), along with the locations that correlate each of the buildings in the portfolio with a certain level of seismic hazard, according to a certain earthquake scenario. For the present case, the PGA values considered for each location are obtained based on a probabilistic seismic hazard analysis for two earthquake scenarios: one having 63% exceedance probability (scenario 1) and another one with 39% exceedance probability (scenario 2) for a period of 50 years, the same as the design lifetime of regular buildings.
Once assigned structural systems, fragilities, and levels of seismic hazard for each entry in the database, the probabilities for exceeding a certain damage state were computed and further on combined with the casualty rates proposed in HAZUS for estimating the probability of having casualties with severity 4, meaning persons who are instantaneously killed or mortally injured (FEMA, 2015). In a similar manner, the HAZUS methodology proposes structural and non-structural (sensitive to acceleration or displacements) repair costs for education facilities, expressed as percentages of the total replacement cost, which was considered equal to 600 €/sq m. Based on cost estimates from past rehabilitation projects in the education sector in Romania, an average cost of 400 €/sq m was obtained, to which was added 200 €/sq m in order to account for the value of assets (furniture, equipment, and document ) inside the buildings.
In addition to the basic parameters needed for the input data related to the loss estimations, there are also several economic parameters that need to be established for the total cost estimates, such as the planning horizon of the investment, the discount rate, and the rhythm of interventions, meaning the amount of strengthening works able to be carried out yearly. Starting from these, the discounted benefits and the discounted costs can be determined for each year of the planning horizon and thus estimate the payback period, the benefit–cost ratio at the end of the investment, and the internal rate of return. Taking into account the amount of resources needed in order to retrofit such a large portfolio of buildings at the national scale, the planning horizon was considered to be 50 years and the investments were distributed in the first 15 years, with 1000 buildings/year and in average 8,00,000 sq m of built-up areas to retrofit each year.
To calculate the discount rate, a long-term growth rate of approximately 4.9 and a zero-utility discount rate were considered so that both benefits and costs are reduced over the entire investment planning period, namely, for 50 years. The Ramsey formula was applied for calculating the discount rate, yielding to a social discount rate equal to 5%.
The economic performance indicator called net present value is the difference between discounted benefits and costs. Consequently, the discount rate for which the net present value is 0 at the end of the planning horizon is called the internal economic rate of return. At the end of the planning horizon, the benefit–cost ratio is calculated as the ratio between the present value of the benefits and the costs. Benefit over cost values higher than 1 at the end of the planning horizon indicate a feasible investment from the economic point of view. However, financing risk reduction measures in the education sector, by reducing the risk of life losses and structural damage of such buildings, has additional social benefits not considered in the present analysis.
3 Results
3.1 Annual failure probabilities and risk maps
Seismic risk analysis involves estimating annual probabilities of failure, based on fragility functions and seismic hazard, considering permanent exposure of the building stock and of the users inside. The annual probabilities of failure are considered in this case the probabilities of exceeding the extensive damage state (DS3) and the complete damage state (DS4), the former implying a 10%–15% probability of collapse. According to the HAZUS methodology (FEMA, 2015), extensive structural damage recorded for URM walls implies extensive cracking and local failures, while complete structural damage of the walls, either in-plane or out-of-plane, might lead to the collapse of the structure, with a 15% collapse fraction. However, the reinforced masonry structural type, having also rigid diaphragms, has a slightly lower collapse fraction assigned in case of low-rise structures, namely, 13%.
Table 2 presents the comparison between seismic risk maps obtained for the exceedance of DS3 and DS4, where annual exceedance probabilities are shown for each masonry typology at the county level, according to the color legend. The lighter colors indicate the lower seismic risk levels, namely, the lower failure probabilities, while the darker ones illustrate the highest seismic risk. It can be observed that the Vrancea seismic source located in the eastern side of the country strongly influences the seismic hazard levels and consequently the seismic risk for all the structural typologies. However, the highest risk is recorded for the unreinforced masonry structures, where for URM_FF is estimated an annual exceedance probability of 1% for extensive damage in almost half of the country, while the rest has values between .01% and .1%. For the URM_FF typology, there are only four counties for which is estimated 1% probability of exceeding the complete damage state, while in the case of URM_RF, lower risk levels are reported, as expected due to the ability of RC slabs to prevent out-of-plane collapse of masonry walls.
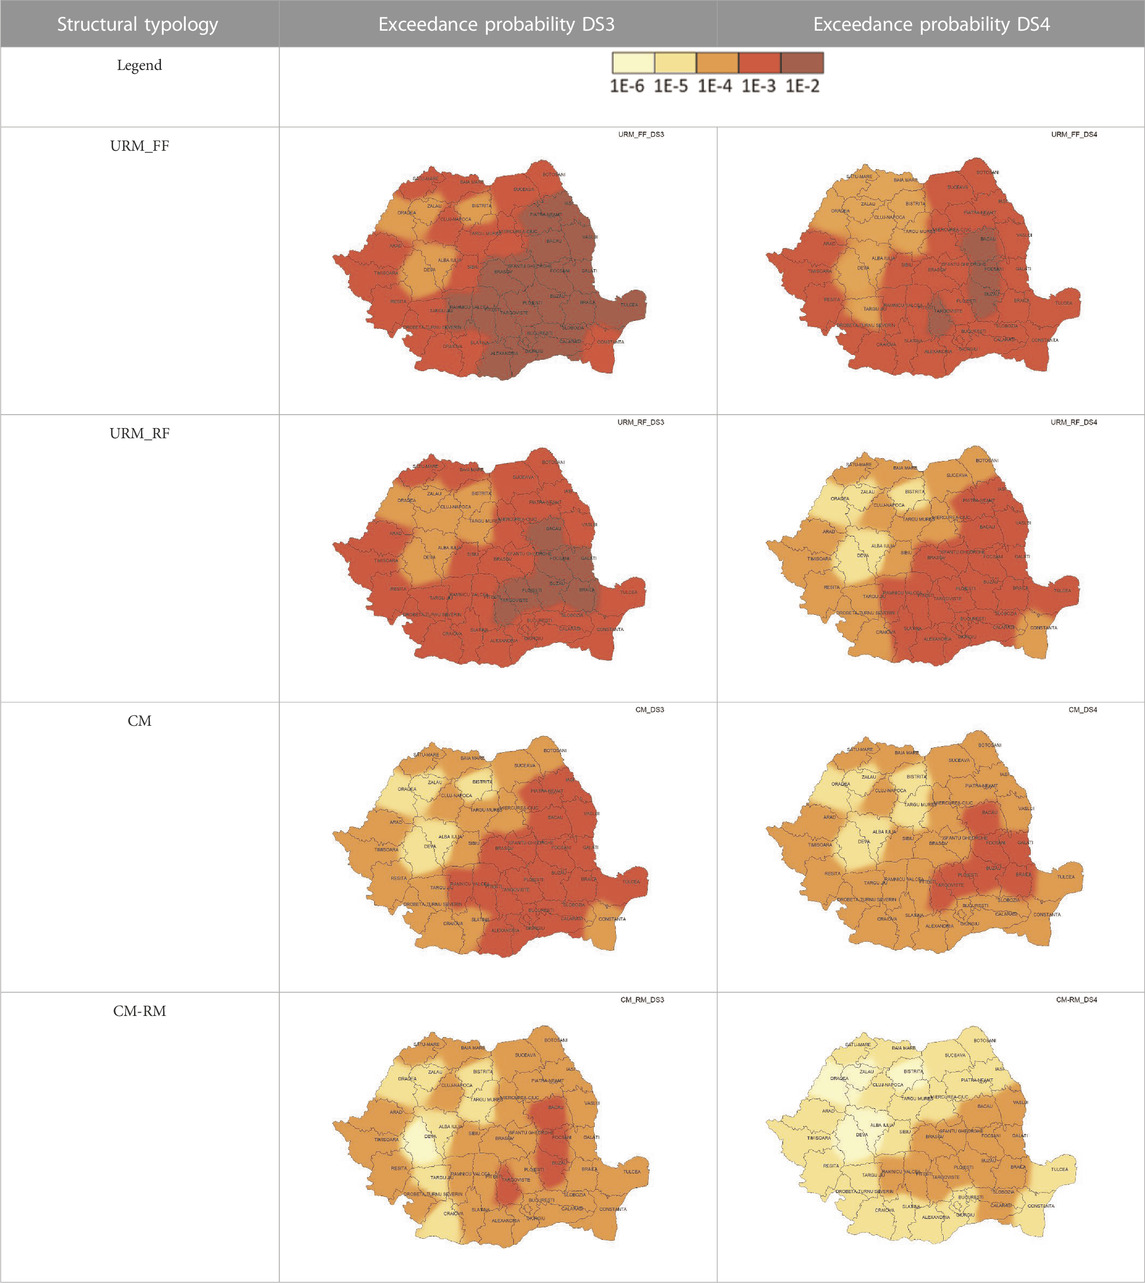
TABLE 2. Seismic risk maps: annual failure probabilities.
Comparing the masonry typologies from the database analyzed, the best behavior is observed for the retrofitted structures (CM-RM); however, there are only a few of them in the entire portfolio, namely, only 3%. Since the data available related to previous retrofitting interventions for schools are quite scarce, it is possible to have in reality more education units strengthened and with lower seismic risk than the ones included in the analysis. Most of the buildings included in the risk analysis are those of confined masonry (approximately 8,700), in which approximately 700,000 pupils have classes. Out of these, only 18% (buildings and students) are exposed to a high seismic risk, with an annual probability of exceeding DS4 of approximately .1%.
The situation of the most vulnerable structures, namely, unreinforced masonry with flexible floors, affects to a greater extent the building stock in the education sector. The analysis includes almost 3,500 such buildings, of which 70% have an exceedance probability for DS4 equal to .1% and another 7% have an exceedance probability of 1%. Nearly 1,90,000 pupils studying in schools with unreinforced masonry structures are exposed to this level of risk associated with a potential partial collapse of the structure.
3.2 Prioritization matrix for strengthening interventions
Starting from the list of input data at the building level taken from the database of buildings included in the education sector, four main parameters were chosen as being the most representative for a first-step filtering of the building list from the point of view of seismic risk. This step, prior to the actual loss assessment, allows the investment to be organized in an optimal way in terms of fund allocation in areas where potential losses are concentrated. Since seismic risk depends on seismic hazard, structural fragility, and exposure, the prioritization matrix from Table 3 was proposed, having four categories of values for each parameter. For each category, scores ranging from 1 to 4 are assigned, where 1 indicates the highest risk. For each building in the database, scores have to be assigned for each parameter (PGA on site, year of construction, structural system, and importance) and then the total weighted score, considering the weights in the matrix, should be computed. Since the year of construction and the structural system are considered to be partially correlated in terms of construction techniques and both refer to fragility characteristics, they were each assigned a .2 weight. The seismic hazard is expressed by means of PGA values characteristic for each location and has a weight of .30. The importance (exposure) parameter refers to the importance of the school estimated based on the number of students enrolled in the education unit, comparing schools across the entire country. Therefore, the fourth quartile includes the schools in the country having the largest number of enrolled pupils, namely, over 1740 students per building.
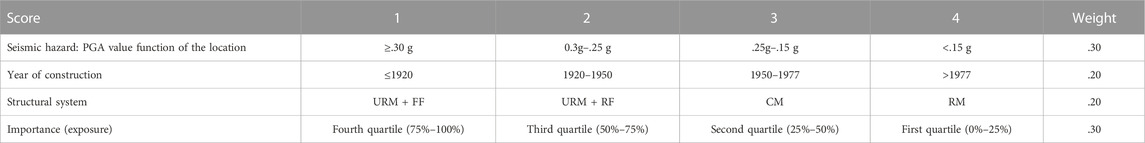
TABLE 3. Prioritization matrix for retrofitting investments.
Figure 7 presents the final distribution of scores ranging from 1 to 4 for the database of 15,084 buildings having masonry structure. As can be observed, the largest share is of the buildings having final scores between 2 and 3 (60% of the sample), but there is also an important part of highly vulnerable buildings with scores lower than 2, almost 25% of the entire sample considered.
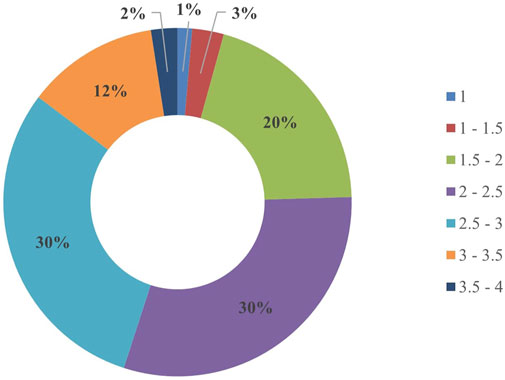
FIGURE 7. Distribution of scores for the database of masonry school buildings.
3.3 Results of the cost–benefit analyses
In order to estimate losses in economic terms, it is necessary to convert the probabilities of being in a certain damage state for building into equivalent values expressed in monetary units. Therefore, an average retrofitting cost has to be established and then correlated to the built-up area of the schools in need of strengthening measures. Considering that masonry structures usually require extensive strengthening works that imply costly procedures such as RC jacketing or addition of RC elements (tie beams, slabs, and shear walls), the retrofitting cost proposed was 350 €/sq m. However, since the portfolio contains buildings of different typologies, ages, and locations, retrofitting might be more or even less costly than the average value proposed. Retrofitting the entire built-up areas of masonry structures of the 15,084 buildings considered in the database leads to a final investment of about 4.3 mil. €. For a replacement cost of 600 €/sq m, the avoided direct damage referring to potential repairs of structural and non-structural damages caused by the scenario earthquakes reaches 388 mil. € in the first scenario and 544 mil € in the second one.
Based on the casualty rates assigned for each structural system and the total number of exposed people inside the buildings (pupils, teachers, and auxiliary staff), the estimated number of fatalities is determined for each scenario. Out of the total number of persons exposed, which is around 1.3 million, the first earthquake scenario (63% exceedance probability in 50 years) could cause 2,459 casualties, while the second earthquake scenario (39% exceedance probability in 50 years) might lead to 3,622 victims. Since retrofitting the entire portfolio of masonry buildings assumes increasing the safety and avoiding structural collapse, the potential casualties become lives saved by the investment. Therefore, once assigned a value of statistical life for the potential victims, the total value of lives saved is to be accounted as benefits in the economic analysis. The VSL (value of a statistical life) represents the amount the society is willing to pay for reducing the risk of dying, but because there is not enough reliable national data for VSL estimates, the “benefits transfer” method was applied (Cropper and Sahin, 2013). The formula given as follows was used to determine the VSL for Romania, which resulted in 700,018 € based on the reference value from of 9.7 mil. $ used in the United States by the Environmental Protection Agency and the GDP per capita (γ) adjustment with 2018 data, as well as an elasticity rate (E) of 1.5 to account for overestimation occurring when transferring VSL values from high-income countries to a lower-income one:
The 1.3 million pupils enrolled in the public education system, starting from kindergarten level and up to high school level, could benefit from the investment project in reducing the seismic risk associated with masonry buildings. Using the estimations previously explained, the total value of avoided life losses by retrofitting the education buildings considered in the analysis reaches 1721 mil. € for scenario 1 and 2,536 mil. € for scenario 2. Given that the total investment required to retrofit these buildings is 4,388 mil. euros, a value of approximately 1.2 mil. euros is associated with saving a life, compared to the statistical value of life estimated at .7 mil. euros. However, calculating the total investment in relation to the total number of beneficiaries, namely, 1.28 million students, results in an average cost of 3,400 euros/person.
In order to have a clearer picture of the spatial distribution of the expected number of victims in the case of the proposed earthquake scenarios, Figure 8 presents in parallel the results obtained, each green dot representing a potential victim. The cumulative number of points on the map on the left (scenario 1) is equal to 2,459, and for the map on the right (scenario 2) is 3,622, concentrated in both cases in the southern and eastern part of the country. Most of the expected victims are in the Bucharest–Ilfov area, Buzau, Prahova, Galati, and counties exposed to high seismic hazard. The ratio of the number of casualties obtained for an earthquake with an average return period of 50 years (scenario 1) to that of 100 years (scenario 2) is between 1.4 (counties with maximum PGA values) and 1.8 (counties with values PGA minimum).
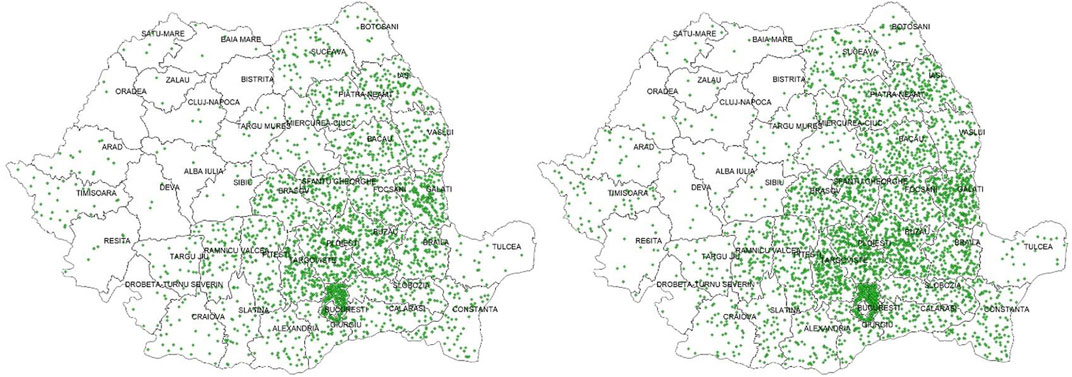
FIGURE 8. Spatial distribution of potential casualties.
The main outcomes of the cost–benefit analysis and the loss estimations in terms of direct damage and life losses are presented for the two earthquake scenarios in Figure 9. Since the second scenario considers a seismic event with a higher mean return period than the first one, namely, 100 years compared to 50 years, the expected losses are higher, and thus the payback period increases with about 20%, while the NPV and the benefit–cost ratio decrease with about 20% as well. The analysis considers the benefits weighted by the probability of exceedance associated with the ground motion, and since the first earthquake scenario has higher exceedance probabilities, even if the losses estimated for the second earthquake scenario are higher, the overall economic analysis yields better results for the first scenario.
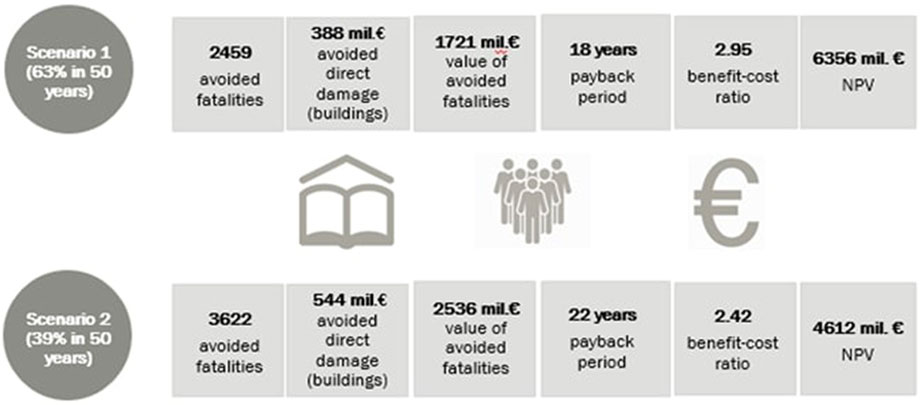
FIGURE 9. Cost–benefit analysis main results.
4 Discussion
4.1 Importance of the prioritization stage
The aforementioned results are based on the allocation of funds according to the priorities set by the prioritization methodology previously presented. Depending on the ranking established based on the final scores obtained during the prioritization stage, masonry buildings are progressively included in the list of investments. Thus, buildings with a minimum final score shall occupy a leading position in the list of priorities set to reduce seismic risk in education. If the allocated funds cannot cover the need for the entire portfolio of educational institutions, a threshold can be set in the established ranking in order to ensure that the investment is directed toward the objectives that maximize the resulting benefits.
In order to highlight the importance of directing funds to schools having the highest seismic risk, two different alternatives have been compared: random investment planning (without applying the ranking based on prioritization) and prioritized investment planning (whose results are already presented in Section 3.3). In terms of loss estimation, there are no differences between the two cases; thus, only the economic parameters of the cost–benefit analysis will be discussed. However, even if the potential losses are not changed by the prioritization process, the funds allocated toward investments where the greatest risk is estimated increase the number of lives saved in the first years of implementation, as it can be observed in the graph from Figure 10, for both earthquake scenarios. Thus, after 5 years of investments, in case of earthquake scenario 1, prioritizing investments based on the matrix presented before might lead to 2,230 potential casualties saved, instead of 850 obtained based on a random allocation of funds. Since retrofitting works were considered to finish after 15 years, starting with the 15th year of the planning horizon, the number of lives saved reached a maximum value of all potential casualties in the sector, and it remained constant until the end of the planning horizon.
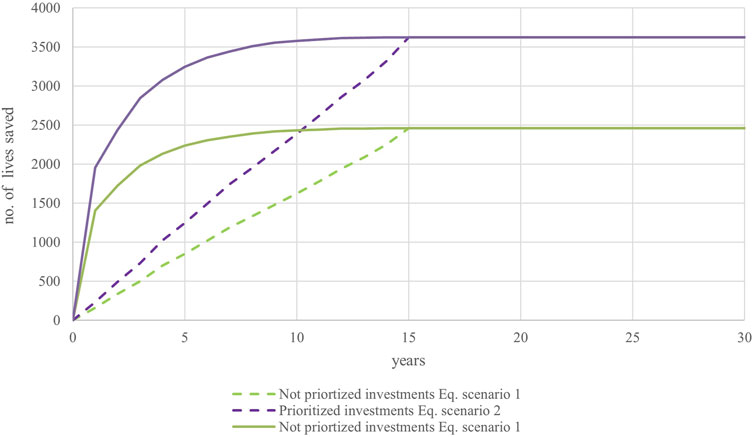
FIGURE 10. Impact of the prioritization process: potential lives saved.
The graphs in Figure 11 show the evolution of retrofitting costs and cumulative benefits over the 50-year planning period, for the first earthquake scenario only, in the case of prioritized investments (left side) and not prioritized investments (right side). The intersection point between the cumulative discounted costs and benefits on the first row of graphs marks the end of the payback period, namely, the year in which the benefit–cost ratio reaches a value equal to 1. Thus, in the case of a prioritization process, the payback period is reduced from 21 to 18 years. The second row of graphs also allows the comparison of the cumulative benefit values year by year, with a much faster growth recorded in the first 10 years of implementation for the prioritized investment option. On the other hand, costs are also increasing sharply at the beginning of the 15 years needed to retrofit the portfolio of masonry buildings, when funding is allocated to the most needed investments: large, vulnerable schools in high-seismic hazard regions.
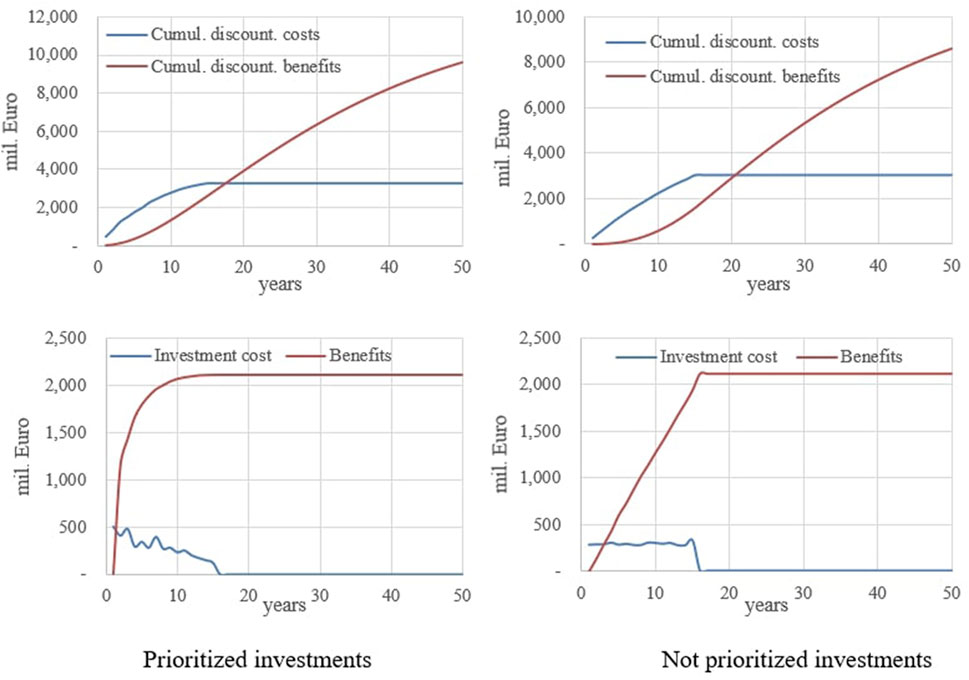
FIGURE 11. Impact of the prioritization process: distribution of costs and benefits along the planning.
4.2 Evaluation of past retrofitting programs
Although the version of the SIIIR database used in the present analysis comprised information about past rehabilitation works carried out for each school unit in the sample, there is no clear distinction between seismic strengthening and thermal rehabilitation works; thus, the information could not be considered reliable. However, the Schools Infrastructure Rehabilitation Project (P.R.I.S.) also targeted ensuring the safety of schools from Romania and included retrofitting works for part of the schools included in the program. A sample of 443 masonry buildings (unreinforced masonry and confined masonry) which were included in the program was analyzed in a separate analysis in order to highlight the benefits in reducing the seismic risk for these particular structures used in the education sector.
This analysis was performed only to compare the expected losses in the initial version of the masonry buildings with those resulting from retrofitting. Thus, for the 443 retrofitted buildings, the structural system was changed into CM-RM (by jacketing of walls and insertion of RC elements: tie beams, columns, and slabs). Past practice for retrofitting in Romania implies strengthening the structures by means of jacketing, even if applied only locally, as was the case for damages generated by the 1977 Vrancea earthquake (Pavel, et al., 2022). Therefore, most of the retrofitting works carried out imply the addition of RC elements that change the initially unreinforced masonry structure into a confined masonry structure with rigid floor and even jacketed masonry walls. The comparison made was based on an initial loss assessment conducted considering URM fragility curves (see Figure 3) and a post-retrofitting stage, for which losses were estimated based on CM-RM fragility curves (see Figure 6). Both stages (initial and post-retrofitting) were assessed in terms of losses following the HAZUS methodology (FEMA, 2015) according to the procedure described in Section 2.3 of the present paper.
The transition from unreinforced/confined masonry to retrofitted masonry implies significant differences in terms of expected losses, as can be seen in Figure 12. For scenario 1, the expected losses from the strengthening of the 443 buildings are about 30 times lower than for the initial structures. For the second scenario, the implemented strengthening projects indicate 20 times larger reductions in terms of expected losses. These results confirm the economic viability of the retrofitting investment dedicated to reducing the seismic risk for masonry buildings with educational function.
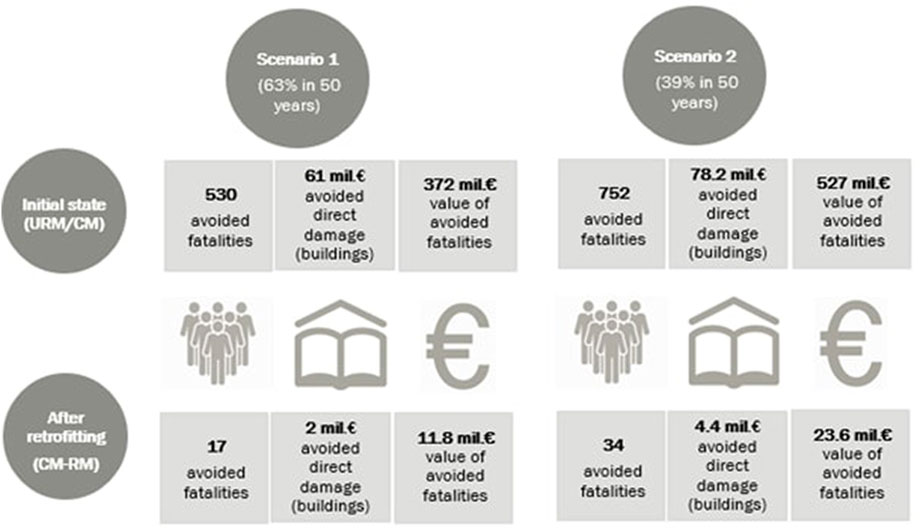
FIGURE 12. Loss estimation for masonry structures retrofitted in the School Infrastructure Rehabilitation Project (P.R.I.S.).
5 Conclusion
The importance of seismic risk analyses at the typological level is highlighted by the application of the proposed methodology in order to estimate the expected losses for masonry buildings in the education sector. Based on the information on the exposure and vulnerability of school buildings collected through the Integrated Information System of Education in Romania (SIIIR), the expected losses for masonry buildings were estimated and criteria for prioritizing retrofitting interventions were proposed.
The seismic risk assessment method employed in the present paper follows the procedures presented already in literature for large-scale evaluation of losses in case of a seismic event, for example, the RISK-UE project (Milutinovic and Trendafiloski, 2003). Furthermore, in order to have an economic evaluation of the investments needed for reducing the losses in the education sector, in particular for school masonry buildings, a similar approach as the one proposed for Lisbon by Lamego et al. (2017)was used. Two seismic scenarios were proposed and costs were assigned for the retrofitting interventions, after which casualties and direct losses were estimated using the HAZUS methodology.
Following the HAZUS methodology for loss assessments in case of a seismic event, the potential impact of such an event for the education section composed of masonry buildings was highlighted. Out of the total number of 1,285,275 students enrolled in the schools considered, .2% represent potential casualties in the first earthquake scenario, and the number of victims increases up to .28% for the second scenario. From the point of view of the costs associated to retrofitting interventions, by normalizing the total investment needed for ensuring the safety in the sector, an average cost of 3,400 €/student enrolled is estimated.
The analysis carried out for the sector also highlighted that the highest risk is recorded for the unreinforced masonry structures with flexible floors, having 1% annual probability of exceeding the extensive damage state for the regions exposed to high seismic hazard levels (eastern half of the country).
Such instruments can contribute to planning of necessary investments for actions aiming to reduce the seismic risk associated with the existing building stock from Romania. Taking into account the large share of masonry buildings used for accommodating public services and located in seismic-prone areas, comprehensive analyses are needed for a better characterization of their behavior and expected losses in case of seismic events. It is recommended to apply the method proposed in the present paper for analyzing also the feasibility of investing in seismic retrofitting of buildings from other sectors, such as residential or health, as well as buildings having different structural typologies. Moreover, for particular situations such as the one of heritage buildings, less invasive retrofitting methods are to be used. Therefore, in such cases, it is even more relevant to better investigate how much of the expected losses can be reduced when using only minimal strengthening methods.
Data availability statement
The datasets presented in this article are not readily available because they have sensitive data and they belong to the Ministry of Education from Romania. Requests to access the datasets should be directed to the Ministry of Education, SIIIR project (https://www.siiir.edu.ro/).
Author contributions
All authors listed have made a substantial, direct, and intellectual contribution to the work and approved it for publication.
Funding
Part of this research was financed by the World Bank for the preparatory phase of the Romania Safer, Inclusive, and Sustainable Schools Project–P175308 (The World Bank, 2021).
Acknowledgments
The authors would like to express their gratitude to the World Bank task team leaders Alanna Simpson and Alina Sava for the outstanding coordination of the preparatory phase of the Romania Safer, Inclusive, and Sustainable Schools Project (The World Bank, 2021) and to Daniel Bojte who facilitated the access to the Integrated Information System of Education in Romania (SIIIR).
Conflict of interest
The authors declare that the research was conducted in the absence of any commercial or financial relationships that could be construed as a potential conflict of interest.
Publisher’s note
All claims expressed in this article are solely those of the authors and do not necessarily represent those of their affiliated organizations, or those of the publisher, the editors, and the reviewers. Any product that may be evaluated in this article, or claim that may be made by its manufacturer, is not guaranteed or endorsed by the publisher.
References
Campos Pomba, F. J. (2007). Comportamento sismico de edificios de Pequeno Porte [disseration]. Lisboa, Portugal.
Correia Lopes, G., Romeu, V., and Tiago, M. (2019). Intervened URM buildings with RC elements: Typological chracterisation and associated challenges. Bull. Earthq. Eng., 1–33. 17,. doi:10.1007/s10518-019-00651-y
Cropper, M. L., and Sahin, S. (2013). Valuing mortality and morbidity in the context of disaster risks. World Bank Group eLibrary. https://elibrary.worldbank.org/doi/abs/10.1596/1813-9450-4832.
D'Ayala, D. F., Spence, R., Oliveira Sousa, C., and Pomonis, A. (1997). Earthquake loss estimation for europe's historic town centres. Earthq. Spectra 13 (4), 773–793. doi:10.1193/1.1585980
Eeri, (2007). EERI special earthquake report. Available at: https://www.eeri.org/lfe/pdf/peru_pisco_eeri_preliminary_reconnaissance.pdf.
Fema, (2015). Hazus-MH 2.1 Hazus earthquake model technical manual. Washington, DC, USA: Federal Emergency Management Agency.
Formisano, A. (2014). Seismic behaviour and retrofitting of a school masonry building subject to the 2012 Emilia-Romagna earthquake. Stirlingshire, Scotland: Civil-Comp Press.
Ingham, J., and Griffith, M. C. (2011). The performance of earthquake strengthened URM buildings in the Christchurch CBD in the 22 February 2011 Earthquake. Wellington, NZ: Canterbury Earthquakes Royal Commission.
Kennedy, R. P. (2011). Performance-goal based (risk informed) approach for establishing the SSE site specific response spectrum for future nuclear power plants. Nucl. Energy Des. 241 (3), 648–656. doi:10.1016/j.nucengdes.2010.08.001
Lagomarsino, S., and Giovinazzi, S. (2006). Macroseismic and mechanical models for the vulnerability and damage assessment of current buildings. Bull. Earthq. Eng. 4, 415–443. doi:10.1007/s10518-006-9024-z
Lagomarsino, S., Penna, A., Galasco, A., and Cattari, S. (2013). TREMURI Program: An equivalent frame model for the nonlinear seismic analysis of masonry buildings. Eng. Struct. 56, 1787–1799. doi:10.1016/j.engstruct.2013.08.002
Lamego, P., Lourenco, P. B., Sousa, M., and Marques, R. (2017). Seismic vulnerability and risk analysis of the old building stock at urban scale: Application to a neighbourhood in Lisbon. Bull. Earthq. Eng. 15, 2901–2937. doi:10.1007/s10518-016-0072-8
Lozinca, E., Popa, V., Cotofana, D., and Basarab Chesca, A. (2016). “Unidirectional cycllic behaviour of old masonry walls in Romania,” in The 1940 Vrancea earthquake. Issues, insights and lessons learnt (Cham, Switzerland: Springer International Publishing Switzerland), 351–361.
Marques, R., Lamego, P., Laurenco, P. B., and Sousa, M. (2018). Efficency and cost-benefit analysis of seismic streghthening techniques for old residential buildings in Lisbon. J. Earthq. Eng. 22, 1590, doi:10.1080/13632469.2017.1286616
Marques, R., and Lourenço, P. B. (2014). Unreinforced and confined masonry buildings in seismic regions: Validation of macro-element models and cost analysis. Eng. Fail. Anal. 64, 52–67. doi:10.1016/j.engstruct.2014.01.014
Milutinovic, Z. V., and Trendafiloski, G. S. (2003). WP4: Vulnerability of current buildings (RISK-UE. Vancouver, Canada: RISK-UE Project Handbook.
Moroni, M. O., Astroza, M., and Acevedo, C. (2004). Performance and seismic vulnerability of masonry housing types used in Chile. J. Perform. Constr. Facil. 18 (3), 173–179. doi:10.1061/(asce)0887-3828(2004)18:3(173)
Pavel, F., Scupin, A., and Radu, V. (2022). Analysis of the seismic risk of low-code masonry and large panels structures in Romania. Iran. J. Sci. Technol. Trans. Civ. Eng. 46, 1915–1928. doi:10.1007/s40996-021-00736-2
Pavel, F., Vacareanu, R., Douglas, J., Radulian, M., Cioflan, C., and Barbat, A. (2016). An updated probabilistic seismic hazard assessment for Romania and comparison with the approach and outcomes of the SHARE project. Pure Appl. Geophys. 173, 1881–1905. doi:10.1007/s00024-015-1223-6
Penazzi, D., Valluzzi, M. R., Saisi, A., Binda, L. A., and Moderna, C., (2001). Repair and strengthening of historic masonry buildings in seismic areas. In Proc. International Congress, More than two thousand years in the history of architecture safeguarding the structure of ourarchitectural heritage, Bethlehem (Palestine) 2 (5), 1–7.
Scupin, A., and Vacareanu, R. (2021). “Numerical simulation of the non-linear response of historic masonry,” in IEEE 10th International Conference on Energy and Environment, Bucharest, Romania.
Scupin, A., Vacareanu, R., and Pavel, F. (2020a). Evaluation of invasive retrofitting interventions on an unreinforced masonry heritage building. Barcelona, Spain: SAHC 2020.
Scupin, A., Vacareanu, R., and Pavel, F. (2021). “Seismic performance assessment based on displacement capacity of unreinforced masonry structures,” in IOP Conf. Series: Earth and Environmental Science, Bucharest, Romania.
Scupin, A., Vacareanu, R., and Pavel, F. (2020b). “Vulnerability assessment of masonry walls by using capacity curves obatined from experimental cyclic testing,” in Modern Technologies for the 3rd Millennium, Oradea, Romania.
Spence, R., (2000). “The performance of strengthened masonry buildings in recent European earthquakes,” in 12th World Conference of Earthquake Engineering, Auckland, New Zealand.
The World Bank (2021). Available at: https://projects.worldbank.org/en/projects-operations/project-detail/P175308.
Vacareanu, R., Lungu, D., and Arion, C. (2012). “Seismic fragility functions for masonry buildings in Romania,” in Proceedings of the 15th World Conference on Earthquake Engineering, Lisbon, Portugal.
Vicente, R., D′Ayala, D., Ferreira, T. M., Varum, H., Costa, A., da Silva, J. A. R. M., et al. (2014). Seismic vulnerability and risk assessment of historic masonry buildings. Structural Rehabilitation of Old Buildings, Springer Berlin Heidelberg, Heidelberg, Germany, 307–348. doi:10.1007/978-3-642-39686-1_11
Zuccaro, G., and Cacace, F. (2015). Seismic vulnerability assessment based on typological characteristics. The first level procedure 'SAVE. Soil Dyn. Earthq. Eng. 69, 262–269. doi:10.1016/j.soildyn.2014.11.003
Keywords: seismic risk, unreinforced masonry, retrofitted masonry, schools, cost–benefit analysis
Citation: Scupin A and Văcăreanu R (2023) Seismic risk reduction through retrofitting of school masonry buildings from Romania. Front. Built Environ. 8:1104234. doi: 10.3389/fbuil.2022.1104234
Received: 21 November 2022; Accepted: 20 December 2022;
Published: 09 January 2023.
Edited by:
Sarkar Noor E. Khuda, Central Queensland University, AustraliaReviewed by:
Tatheer Zahra, Queensland University of Technology, AustraliaJulian Thamboo, South Eastern University of Sri Lanka, Sri Lanka
Copyright © 2023 Scupin and Văcăreanu. This is an open-access article distributed under the terms of the Creative Commons Attribution License (CC BY). The use, distribution or reproduction in other forums is permitted, provided the original author(s) and the copyright owner(s) are credited and that the original publication in this journal is cited, in accordance with accepted academic practice. No use, distribution or reproduction is permitted which does not comply with these terms.
*Correspondence: Alexandra Scupin, YWxleGFuZHJhLnNjdXBpbkBwaGQudXRjYi5ybw==
†These authors have contributed equally to this work