 Bara’ W. Al-Mistarehi
 Ahmad H. Alomari
 Rana Imam
 Mohammad Mashaqba
- 1Department of Civil Engineering, Jordan University of Science & Technology (JUST), Irbid, Jordan
- 2Department of Civil Engineering, Yarmouk University (YU), Irbid, Jordan
- 3Department of Civil Engineering, The University of Jordan, Aljubeiha, Jordan
This study describes crash causes, conditions, and distribution of accident hot spots along with an analysis of the risk factors that significantly affect severity levels of crashes and their effects on pedestrian safety using machine learning (ML) techniques. Supervised ML algorithm–random forest and decision tree–based algorithm-AdaBoost algorithms are applied and compared to predict the severity level and future crashes based on road crash elements. Association rule, an unsupervised learning algorithm, is utilized to understand the association between driver characteristics, geometric elements of the highway, the environment, time, weather, and speed. Slight, medium, and severe injuries and fatalities in crashes are also considered to understand the behavior of road drivers, who are most likely to cause crashes. Fatalities and injuries are studied with spatial statistics analysis. The variables most affecting the severity of the crash are determined and discussed in detail. The results are checked for accuracy, sensitivity, specificity, recall, precision, and F1 score performance. The impact of drivers, vehicles, and road characteristics is investigated in traffic crashes. The random forest model was found to be the most suitable algorithm to predict crash severity levels.
Introduction
Road safety and reducing traffic accidents have been a major concern of transportation planners, engineers, and policymakers. Road accidents place a heavy burden on the world economy due to significant loss of life and property damage. The number of traffic accidents in Jordan is rising, and the consequences have a significant impact on people’s lives and on their social and emotional well-being (Al-Masaeid, 2009; Alomari and Taamneh, 2020). It is a complex behavioral problem due to the multiplicity of variables and factors affecting it such as driver, pedestrian, passenger behavior, vehicle, highway, and infrastructure characteristics. To develop effective countermeasures, a spatial and temporal analysis should be conducted using geographic information systems (GIS) and artificial intelligence (AI) in countries that have witnessed a decline in the numbers of injuries and deaths to identify and distinguish accidents and then classify them according to the time of their occurrence, type, location, severity, and causes.
Understanding the factors under which people are primarily harmed in car crashes could improve the general safety standards. Variables that influence the level of extended injury to passengers in a vehicle crash incorporate attributes of the individual, natural elements, highway conditions at the time of the incident, and intrinsic qualities of the vehicle itself. In this research, considerable accident information collection was utilized alongside learning techniques to reveal the connections between the number of accidents compared to various injury severity levels and accident-related factors.
The literature includes many studies carried out on traffic accidents and their seriousness. Labib et al. (2019) stated in their study that traffic accidents had become a significant problem in Bangladesh and the whole world. Their study used the following machine learning methods to analyze accident data: classified decision tree, k-nearest neighbors (KNN), naive Bayes, and AdaBoost. Radzuan et al. (2019) explained that the number of traffic accidents in Malaysia grows by 5% every year. It is essential to understand their occurrence to propose counter plans to reduce the number of severe injuries. The research used an artificial neural network method to predict the number of serious severe injuries by applying a time-series algorithm. The study by Al-Mamlook et al. (2019) compared different machine learning algorithm performance on predicting crash severity and found that the random forest algorithm outperformed logistic regression, naive Bayes, and AdaBoost algorithms.
Traffic accident data provided by the public authorities are essential in building a classification of these accidents based on their type and severity, which could later lead to developing a predictive model. These models help address and detect the severity of the injury in accidents and guide general road safety policies (Cuenca et al., 2018). In a study by Kumeda et al. (2019), machine learning algorithms were used to analyze the data to unlock invisible patterns and predict severity level. Their study applied six different machine learning techniques using the data from the United Kingdom: hierarchical LVQ, Fuzzy–FARCHD, random forest, multilayer perceptron, naive Bayes, and radial basis function network. The results revealed that the Fuzzy–FARCHD algorithm was the most effective method, with an accuracy of 85.94%. In another study by Cai et al. (2020), the locations of traffic accidents were analyzed and their relationships with the resulting behaviors based on vehicle OBD data. This research relied on the RTSE method implemented by the entropy weight method. Moreover, the method includes three factors: piecewise calculation of each index’s weight, optimization of the logarithm base, and processing of zero-value secondary indices. In addition, Hu et al. (2020) investigated clusters and injuries in pedestrian crashes using GIS in Changsha, China. This study did not just include standard traffic accident reports but also integrated these reports with the GIS to analyze 791 pedestrian accidents. The study concluded that casualties have a strong relationship with road isolation facilities, light conditions, time of the accident, and age of pedestrians. For example, casualty numbers were higher at night than during the day, and pedestrians of school age and the elderly made up the most significant share of the casualties. Moreover, Al-Omari et al. (2020) studied the prediction of traffic accident hot spots using fuzzy logic and the GIS in Irbid city, north of Jordan. The study applied the fuzzy overlay method (FOM) and the weighted overlay method (WOM) since these two methods are generally used in decision-making and alternative analysis. Eight hotspots were identified; three are road sections and five are major intersections, which were investigated to obtain accident-contributing factors.
Lee et al. (2017) built an accident prediction model using two ML methods: artificial neural networks (ANN) and k-nearest neighbor. Due to the complexity and variety of factors involved in traffic incidents, various data such as traffic data, weather conditions, light, and road geometry were included. The accident characteristics are important as well. Based on the comparison analysis, they concluded that the ANN outperformed the k-nearest neighbor and provided a helpful prediction with less than 30% error values. Achu et al. (2019) used geospatial technology to examine traffic accident temporal and spatial behaviors based on the collected data between 2013 and 2015. The study used multiple methods (kernel density functions, Moran’s-I, and Getis-Ord Gi hotspot analysis) for spatiotemporal behaviors of traffic accidents. Moreover, this research revealed that the results are helpful in terms of developing better safety policies for roads and highways in the accident hot spots. Al-Aamri et al. (2020) conducted their study in Muscat, Oman, based on 9,357 registered traffic accidents from 2010 to 2014 collected by the Royal Oman Police. The study used a combined analysis method based on the GIS and RTC data. In addition, this study used estimation techniques using kernel density estimation (KDE) for 1D and 2D space dimensions; network-based, forest algorithm, and K-function were used in the data analysis. In addition, the results of this study provided statistical evidence that proved the hypothesis of the study, which was that road junctions have a higher rate of causing RTCs than the rest of the road features. Moreover, the findings of the study identified the importance and influence of road- and traffic-related features in road crash spatial analysis.
Ando et al. (2018) investigated the links between traffic crashes and urban crime in Toyota City, Japan. They defined urban safety in terms of urban crime and traffic accidents using the GIS and statistical analysis. They found that there were some overlap and common factors, including narrow streets and medium-to-high rise residential buildings. Longer street segments tended to discourage both phenomena. A graphical modeling method for individual driving behavior and its application in driving safety analysis using GPS data was proposed by Chen et al. (2019). The study found that the different aspects of driving safety concerns originate from the skills and behaviors of drivers. The study applied a quantitative analysis method to evaluate the graphs extracted from the method mentioned previously. The study concluded that the graphical method could describe the individual features of a driver’s longitudinal acceleration behavior and distinguish differences among drivers. Another study by Özcan and Küçükönder (2020) identified the spatial density of traffic accidents and targeted the modifications of spatiotemporal elements in high-density areas in the city of Kahramanmaras, Turkey. The researchers developed their methodology based on kernel and hotspot estimation (KDE) methods to identify the spatial densities in the GIS, which successfully detect the high density of traffic accidents in the selected areas.
According to the World Health Organization (WHO), about 1.35 million people die annually due to road traffic accidents, making them the eighth leading cause of death for people of all ages. The cost of road traffic accidents in most countries is estimated at 3% of their GDP (WHO, 2018). Road traffic injuries remain an important public health problem at global, regional, and national levels; hence, improving traffic safety is a real challenge worldwide. As a result of the political and economic conditions surrounding it, Jordan has witnessed an increase in residents, vehicles, and accidents. In 2019, 161,511 traffic accidents occurred in Jordan, resulting in 17,013 accidents of human injuries; among them were 643 deaths, 792 seriously injured, 6062 medium injuries, and 10,159 slightly injured people; the financial cost is estimated to be $457 million. Jordan’s population reached 10,554 million, and the number of registered vehicles was 1,637,981, in addition to 767,614 foreign vehicles entering Jordan annually (PSD, 2018).
The main objective of this research is to develop a framework to identify and traffic accident hot spots in urban regions, with Zarqa City in Jordan as a case study. The methodology is based on combining the GIS, indicators of the severity of traffic accidents, artificial intelligence, and statistical methods. This framework defines crash causes, conditions, crash risk factors, and their impact on severity levels. In addition, it involves analyzing the factors that significantly affect each type of crash and forecast the risk factors affecting the level of traffic crashes using ML techniques. In addition, this study identifies and maps high-density black spots, fatality crashes, and pedestrian crash locations using the Optimized Hot Spot Analysis method. Finally, it recommends appropriate remedial measures to decrease traffic crashes and their severity levels and improve crash reduction factors.
Methodology
The study area comprised the minor arterials and collectors of Zarqa City, Jordan. According to the number of residents, Zarqa is the center of the Zarqa governorate and the third major city in Jordan after the capital (Amman) and Irbid (Alomari and Taamneh, 2020). Its population constitutes 14.3% of all Jordanians, reaching 1,534,577 inhabitants. It is also the third-highest city in accident frequency. It is located to the northeast of the country and has an area of over 4761 km2 with a road network of around 440 km2. The data set for pedestrian, run-off-road, and collision accidents that occurred in urban areas in Zarqa City was obtained from the Jordan Police Traffic Department (PTD). It includes nearly 97,900 accidents in Zarqa City during 2014–2018, as shown in Figure 1. The data consist of the numbers of vehicles and category; road properties, type, speed limit, surface, and lane design; driver’s gender, age, and mistakes; weather; light conditions; coordinates; accident type, time, day and date; severe, medium, and slight injuries; and fatalities.
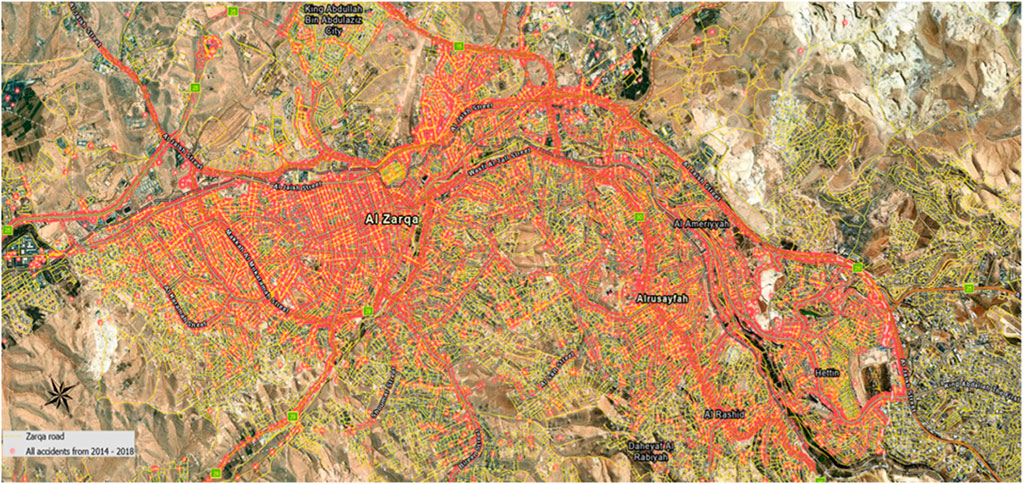
FIGURE 1. Traffic accidents from 2014 to –2018 occurred in Zarqa city.
Accident locations were defined using the projected coordinate system Universal Transverse Mercator (UTM), World Geodetic System (WGS 1984 Zone 36 North). X and Y coordinates were automatically calculated by the traffic cop using the GPS at each accident location. The time of crashes is also essential for accident analysis and finding the leading cause before giving suitable remedies. The time is required in three configurations: the time of day (morning, noon, and evening), the day of the accident (workday, holiday), and the time of the year (winter, spring, summer, or autumn). Several causes invariably characterize an accident. The alignment of the road is a significant impact factor: flat straight, upright straight, straight slope, flat curve, elevated curve, and slope curve. Other data groups that can represent independent variables and help in accident analysis study are as follows: weather conditions (clear, rainy, dusty, hazy), pavement surface conditions (dry, wet, glacier, sandy), light conditions (noon, sunrise, night, road lights are sufficient; night time and road lights are not enough; sunset; and dark), road type (flexible pavement, rigid pavement, soil road, gravel road), road lane (two-way with central island, two-way without central island, one way, parking, and public square), vehicle category (small passenger cars, shipping vehicles, joint transport, trailer, mid-size passenger cars, bus, construction vehicle, and particular purpose vehicle), road speed limit, driver gender, the number of cars involved in the accident, the type of accident, and driver mistakes).
The data were cleaned and preprocessed by looking for missing values and inspecting any outliers that could interfere with the learning process. Feature selection using ML was applied to find the most relevant and correlated attributes affecting the learning process. These datasets were studied using supervised learning to predict the class label according to the characteristics of drivers and road properties. Figure 2 shows the research methodology used in this study.
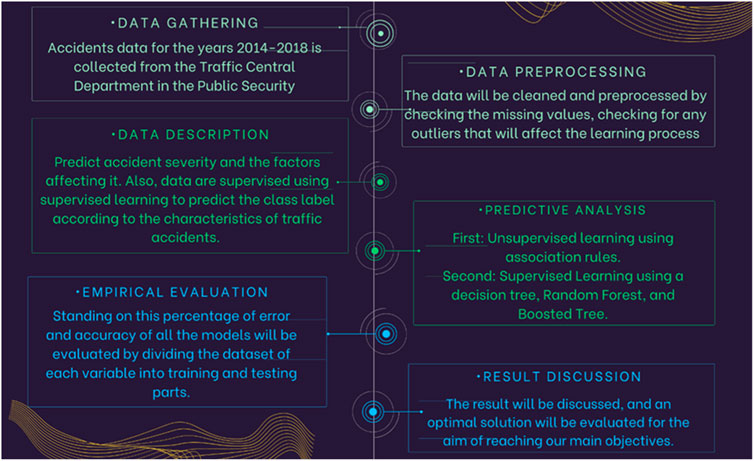
FIGURE 2. Research methodology.
Association Rules
Association rule learning is an unsupervised learning approach that detects the reliance of one database object on another and maps it appropriately to make it more lucrative. It applies various techniques to identify interesting relationships between variables in a database. They are used to find the relations between variables in the dataset.
The association rule can be defined as follows: if we let D = {t1, t2, . . ., tm} be a set of transactions that causes the accidents and let I = {i1, i2, . . ., in} be the set of all considered items in the possible factors, each transaction in D has a unique transaction ID and contains a subset of the items. A rule is defined as X ⇒ Y where X, Y ⊆ I and X ∩ Y = ∅. The sets of items (for short item sets) X and Y are called antecedent (left-hand-side or LHS) and consequent (right-hand side or RHS) of the rule. The rules are often restricted to only a single-item inconsequent. The association rules surpass the user-specified minimum support and confidence. The support, supp(X), of an itemset X is a measure of importance, defined as the proportion of transactions in the data set containing the itemset. The confidence of the rule is defined as conf (X ⇒ Y) = supp (X ∪ Y)/supp(X), measuring how likely it is to see Y in a transaction containing X. The association rule X ⇒ Y needs to satisfy supp (X ∪ Y) ≥ σ and conf (X ⇒ Y) ≥ δ, where σ and δ are the minimum support and minimum confidence thresholds, respectively.
This research will use association rules to find the relationship between variables. It will also check which variables affect slight injury, medium injury, severe injury, or fatalities. The association algorithm can be summarized as converting all variables to factors and fitting the model with an a priori algorithm. It also specifies which variable has the most significant impact on each type of injury (Galárraga et al., 2013).
Decision Tree
It is a supervised learning approach that may solve classification and regression issues. However, it is most often used to solve classification tasks. It is a tree-structured classifier in which internal nodes contain dataset characteristics, branches represent decision rules, and each leaf node represents the result. A decision tree has two nodes: the decision node and leaf node. Decision nodes judge and have numerous branches, whereas leaf nodes result from those selections and have no more branches. The judgments or assessments are based on the characteristics of the provided dataset. It is a graphical depiction of all potential answers to a problem/decision, given specific criteria. It is termed a decision tree because, like a tree, it begins with the root node and extends on subsequent branches to form a tree-like structure. The CART algorithm, which stands for classification and regression tree, creates a tree. A decision tree asks a question and divides the tree into subtrees based on the answer (yes/no).
The decision tree coding algorithm may be defined as follows. Two approaches are used: one with the class label (type of integer) and another with a class label (0 and 1), where zero indicates no injury and one indicates injuries. The data set is then divided into training and testing sets using the 70/30 technique and the (rpart) function for estimating the decision tree. The model’s effectiveness is then evaluated. The decision tree classification model uses the dataset to create a tree structure. A decision tree is created by breaking down a large dataset into smaller components. A decision tree node is split into two or more branches at each step-in algorithm until it reaches leaf nodes. The leaf nodes show the class labels or outcomes. Di Noia et al. (2020) stated that the decision tree picks a feature that best divides the data at each stage.
Ensemble Method
Bagging and boosting are two techniques that use the ensemble method. Both models can predict the result of the type of injury in a traffic accident. Bagging (random forest) is a well-known ML algorithm from the supervised learning approach. It may be applied to both classification and regression issues in machine learning. It is built on the idea of ensemble learning, which integrates several classifiers to resolve a complicated issue and enhance the model’s performance. It is a classifier that uses several decision trees on different subsets of a given dataset and averages them to enhance the prediction accuracy of that dataset. On the other hand, the boosting (AdaBoost) algorithm, short for adaptive boosting, is used in machine learning, adjusted to each instance, with increased weights applied to erroneously categorized instances. Boosting is used in supervised learning to minimize bias and variation. It is based on the progressive development of learners. The boosted methods are applied when there is a large amount of data to produce a forecast. It is used to transform weak optimization algorithms into strong learning algorithms. The boosted algorithm’s basic principle combines several weak classifiers to create a strong classification.
This study uses adaptive boosting (AdaBoost). It fits a series of weak classifiers to various weighted training data. It begins by predicting the original data set and then distributing it evenly to each observation. If the first learner’s prediction is incorrect, it rewards a greater score to the incorrectly predicted observation. As an iterative process, it continues to add trainees until the variety of models or accuracy is reached. AdaBoost combines multiple inadequate learners to create a more powerful model. The result is the weighted sum of the weak algorithms. Because it is a sequential model, a poor learner gets replaced at each phase in favor of misclassified data points in the preceding classifier. Weighting is used to train the first basic classifier, y1 (x). Every transaction is the same. The weighting will be increased in the following phases of reinforcement. For data, misclassified data point attributes increase and decrease. The points were correctly categorized. The epsilon value is the weighted error rate for each basic classifier. As a result, the weights provide alpha. A higher weight is assigned to a more successful classification (Mayr et al., 2014).
The Empirical Evaluation
This section explains the empirical evaluation. Because of the enormous data, the data have divided the model into 70% training data and 30% testing data. The following performance measurements used the confusion matrix, accuracy, recall, precision, sensitivity, F1 score, and errors. The confusion matrix is a matrix used to analyze the quality of classification models for a given set of test data. It can be determined only if the real values of the test data are given. The matrix itself is simple to grasp, but the associated terminology can be perplexing because it displays the model performance faults in a matrix. Figure 3 shows the confusion matrix table, where:
1) True positive: It is the number of correctly classified instances.
2) True negative: It is the number of correctly classified instances.
3) False negative: It is the number of incorrectly classified instances.
4) False positive: It is the number of incorrectly classified instances.
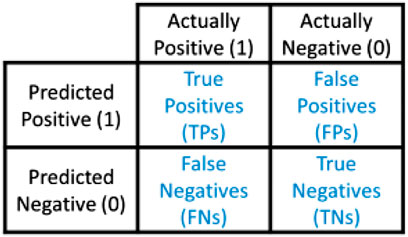
FIGURE 3. Confusion matrix (Draelos, 2019).
Accuracy is an essential metric in determining the accuracy of classification issues. It specifies how frequently the model predicts the proper outcome. Furthermore, it may be computed as the ratio of the classifier’s correct predictions to the total number of predictions produced by the classifiers. The error rate defines how frequently the model makes incorrect predictions. By dividing the number of wrong predictions by the total number of predictions made by the classifier, the error rate can be figured.
Recall is an essential metric for dealing with imbalanced data (where the number of observations per class is not equally distributed). It equals the true positive over the summation of true positive and false negative. The research team does not want to miss recording any injuries. Therefore, it makes the “false negative” as low as possible, so the recall should be high.
Precision isessential to using the essential metric for imbalanced data and very high accuracy. However, it is not a good model as the accuracy is misleading. It equals the true positive over the summation of true positives and false positives. In this research, the term “false positive” (which means we do not have an injury, but we predict having one).
F1 score is the harmonic mean of precision and recall. It takes both false positives and false negatives into account. This formula can be used on the imbalanced data to decide which one is better in terms of high precision and low recall.
Identification of Hazardous Locations Using Geographic Information Systems
Optimized Hot Spot Analysis uses parameters obtained from input data characteristics to run the Hot Spot Analysis (Getis-Ord Gi*) application. The Optimized Hot Spot Evaluation method interrogates data to obtain the settings that will produce optimum hot spot performance. The application can aggregate incident point data into weighted features if the dataset of input features includes incident point data. The tool can figure out how big an analysis can be based on the distribution of weighted features. Spatial autocorrelation hot spot analysis is one of the spatial statistics toolset of inferential spatial pattern analysis tools. Probability theory underpins inferential analysis. Probability is a measure of variance, and all mathematical analyses (directly or indirectly) are based on probability equations that evaluate the impact of chance on the study results. Nonspatial statistics often include working with a random sample and attempting to calculate the probability that the data collected is a successful approximation (is reflective) of the population. Like the spatial autocorrelation statistics mentioned above, many spatial statistics frequently deal with all accessible data for the research area (such as all crimes, disease cases, and attributes for every census block).
The null hypothesis is the starting point for most statistical experiments. Complete spatial randomness (CSR), regardless of the features directly or the attributes associated with those features, is the null hypothesis for the pattern analysis methods (analyzing patterns framework and mapping clusters toolset). The pattern analysis technique’s’ z-scores and p-values indicate whether to reject the null hypothesis or not. According to the pattern analysis framework, it is likely that a random sampling technique generated the detected spatial pattern. When the p-value is very low, it means that the observed spatial trend is very unlikely (low probability) to be the product of random processes, and the null hypothesis can be rejected. Z-scores are standard deviations.
Results and Discussion
Machine Learning Model Evaluation
The evaluation techniques used in this research are based on the results of the confusion matrix of each ML model. The performance of the model can be evaluated by checking accuracy, recall, precision, F1 score, error, and sensitivity. This research evaluates the rules to find the relations between variables. After applying ML algorithms, Tables 1–3 describe the results for accuracy for every type of injury. The comparison shows that the random forest model has the highest accuracy rate measurement in each database compared to the other ML models. The slight injury rate was 97.93%, the medium injury rate was 99.78%, the severe injury rate was 99.81%, and the fatality rate was 99.96%. The results are imbalanced, so the researchers will also check the recall, precision, and F1 score to check the injuries.
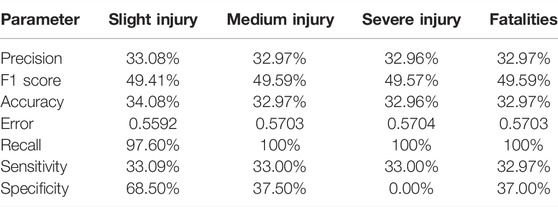
TABLE 1. Percentages of parameters in the result of the decision tree.
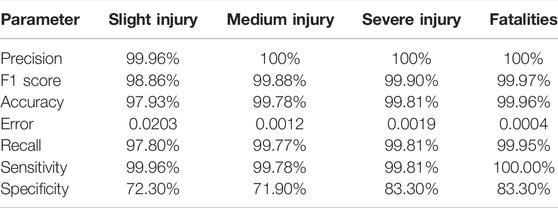
TABLE 2. Percentages of parameters in the result of random forest.
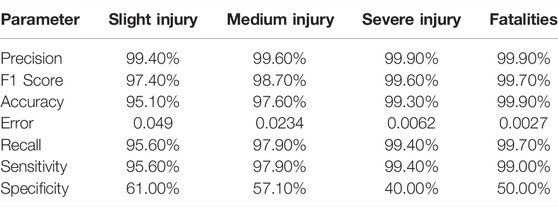
TABLE 3. Percentages of parameters in the result of AdaBoost.
In the recall part, the focus is on the false negative, trying to make it as low as possible to obtain the highest recall. Then, ML models were checked to see the highest recall. The comparison showed that the decision tree model has the highest recall for slight injuries at 99.2%, the random forest has the highest recall for medium injuries at 100%, the decision tree has the highest recall for severe injuries at 100%, and the random forest has the highest recall for fatalities at 100%. The precision matrix has been checked because of the imbalanced data. The focus was on the false positives. The comparison showed that the random forest model has the highest precision rate measurement in each database compared to the other ML models. The slight injury rate was 99.96%, the medium injury rate was 100%, the severe injury rate was 100%, and the fatality rate was 100%.
The precision and recall were checked. The emphasis was on both false-positive and false-negative results. The abovementioned comparison showed that the random forest model had the highest accuracy rate measurement in each database compared to the other ML models. The slight injury rate was 98.86%, the medium injury rate was 99.88%, the severe injury rate was 99.9%, and the fatality rate was 99.97%. Based on the confusion matrix F1-score, the test results showed that random forest seemed to perform better than other models. After applying the ML model, we get the following results for sensitivity and specificity. Sensitivity was used to evaluate the model’s ability to predict the true positive of each available class. Specificity was used to evaluate the model’s ability to predict the true negatives of each available class. In general, the results reported higher sensitivity and specificity for the random forest model. The lower the error rate measurement is, the better the performance of the ML model will be. On comparing the ML models used in this research, the random forest gives the lowest error rate when predicting every type of injury. The slight injury rate was 0.0203, the medium injury rate was 0.0012, the severe injury rate was 0.0019, and the fatality rate was 0.0004.
The results demonstrate that the best ML technique is the random forest model compared with other models. The random forest has excellent ability to resist the noise by randomly selecting variables and data to generate plenty of classification trees. It can also process discrete data and continuous data.
Evaluating Result for Association Rules
In this part, the research checks the relationship between variables and every type of injury (slight injury, medium injury, severe injury, and fatalities). It also specifies which variable has the most significant influence on each type of injury. After applying the inspect code, the results found several rules that strongly influence the slight injury; according to the following rules: road-properties = flat–straight; road-surface = dry; weather = clear; road-type = flexible-pavement; and crash-types = collision, as shown in Table 4.
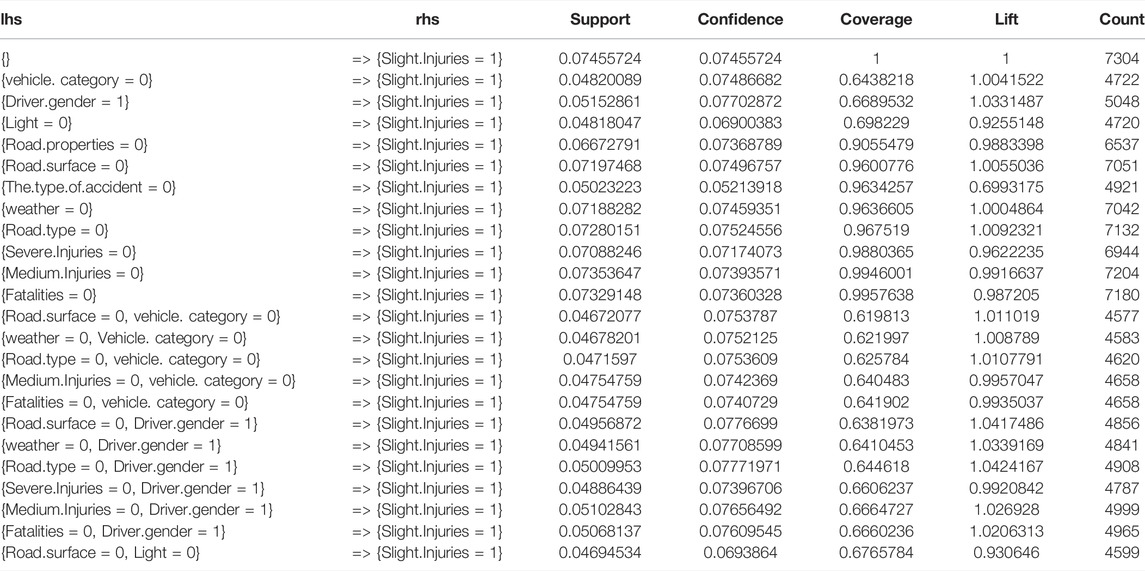
TABLE 4. Slight injury results.
After applying the inspect code, the results found several rules that strongly influence the medium injury; according to what they get, the road-properties=flat–straight; road-type=flexible-pavement; crash-types collision; and weather = clear, as shown in Table 5.
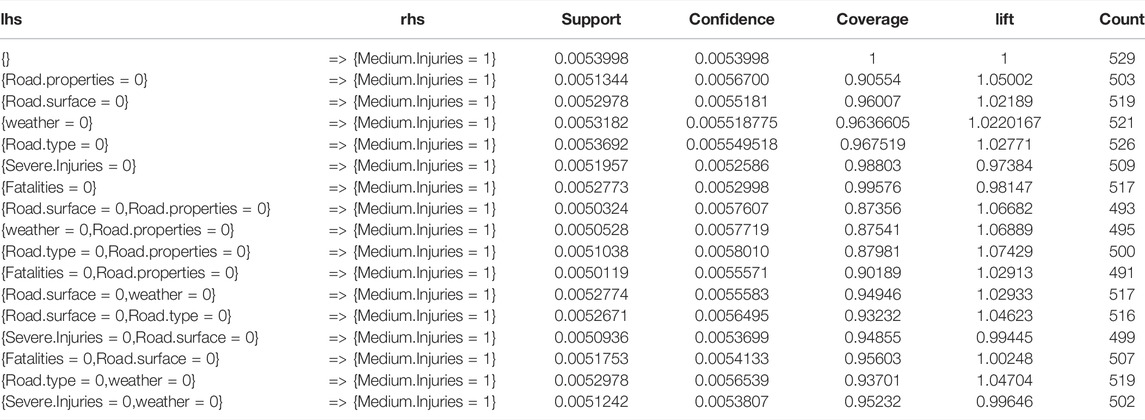
TABLE 5. Medium injury results.
After applying the inspect code, the results found several rules that strongly influence the severe injury; according to what they get, the road properties = flat-straight; road surface = dry; weather = clear; road type = flexible-pavement; and road surface = dry and clear weather, as shown in Table 6.
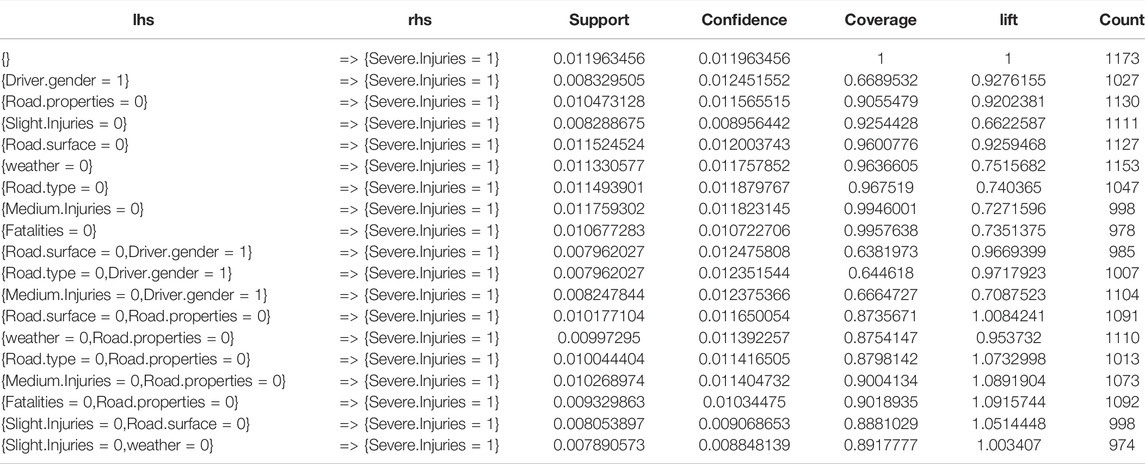
TABLE 6. Severe injury results.
After applying the inspect code, the results found several rules that strongly influence the occurrence of fatalities; according to what they get: the crash-types = collision; driver-mistakes = tailgating; driver-age = [25,32]; road-lanes = two-way (with central island); vehicle-category = small passenger-cars, as shown in Table 7.
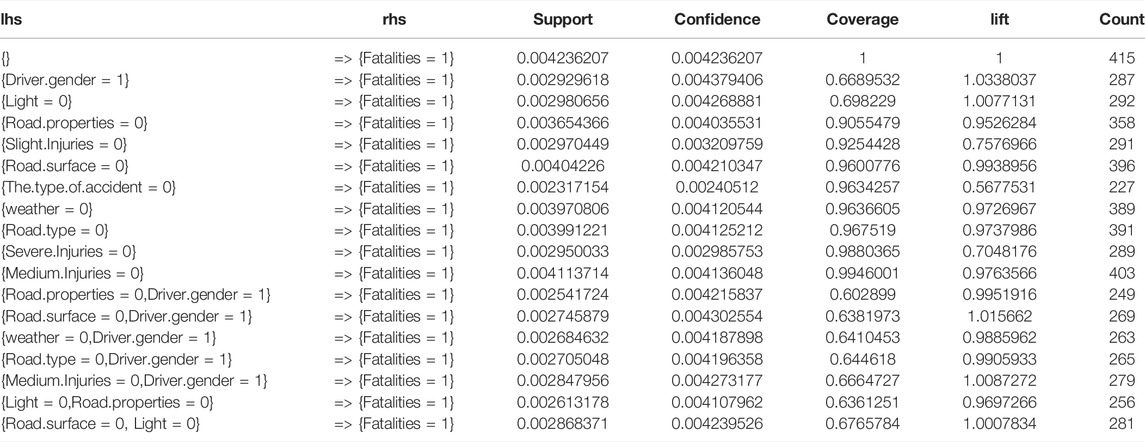
TABLE 7. Fatality results.
Generally, collision accidents on flat–straight roads and flexible pavement roads were more effective variables in the data set for every type of injury, with assigned support and confidence. According to the results, which confirm the support and confidence, it is confirmed that the road characteristics have more effect than the driver characteristics. However, the impact of driver characteristics on traffic accidents was investigated, as shown in Table 8. The data are split into two classes: 1) making an accident without injury and 2) making an accident with injury. Then, the researchers will study the association between driver characteristics and traffic accident variables.
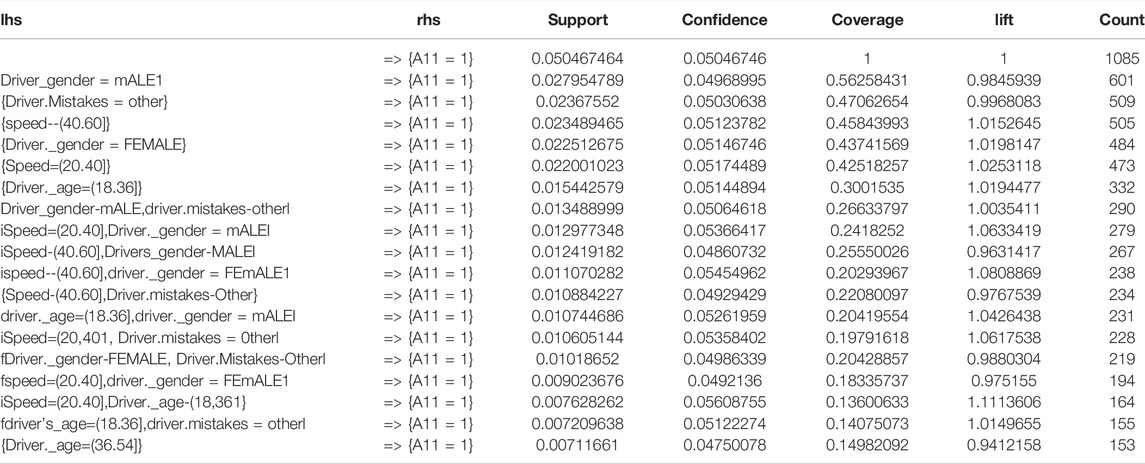
TABLE 8. Effect of driver characteristic on traffic accidents.
Hazardous Locations Based on Optimized Hot Spot Analysis
As explained in the Identification of Hazardous Locations Using Geographic Information Systems section, the optimized hot spot analysis application is run using parameters derived from the characteristics of the input data. The optimized hot spot evaluation method interrogates data to obtain the settings that will produce optimum hot spot performance. The tool can determine an effective scale of analysis based on the distribution of weighted features. Accident locations were defined according to the projected coordinate system, with X and Y coordinating automatically by the traffic policeman using the GPS at each crash location. Table 9 shows the descriptive statistics of 5 year accidents in Zarqa city.
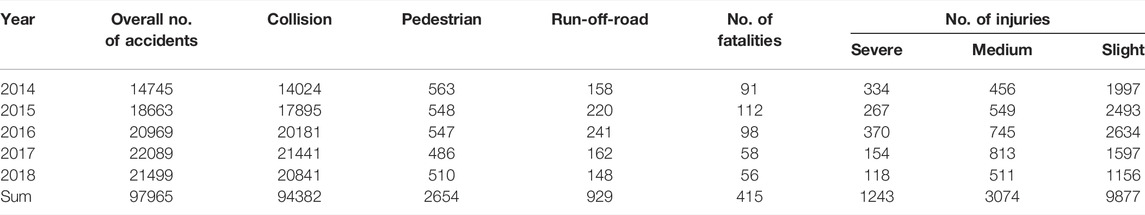
TABLE 9. Descriptive statistics of 5-year accidents in Zarqa City.
In 5 years, there were 9,877 slight injuries, 3,074 medium injuries, and 1,243 severe injuries accidents in Zarqa City. Around 2,654 (2.7%) of them were pedestrian accidents, 929 (0.9%) were run-off-road accidents, and 94,382 (96.4%) were collision accidents. Since the study area is an urban area, pedestrian accidents were expected due to the high pedestrian movements in such areas. Figure 4 shows the optimized hot spot analysis on each street from 2014 to 2018. Hot spots were distributed on the following streets: Al Jaish Street, Wasfi Al-Tall Street, Makkah Al- Mokaramah Street, King Al Hussein Bin Talal Street, King Abdullah II Bin al Hussein Street, the intersection of Bab Al Wad Street with King Talal Street, the intersection of Al Jaish Street with Al Shurtah Street, Abdullah Ghosheh Street, and King Talal Street. Figure 5 shows a sample of a detailed optimized hot spot analysis on King Al Hussein Bin Talal Street.
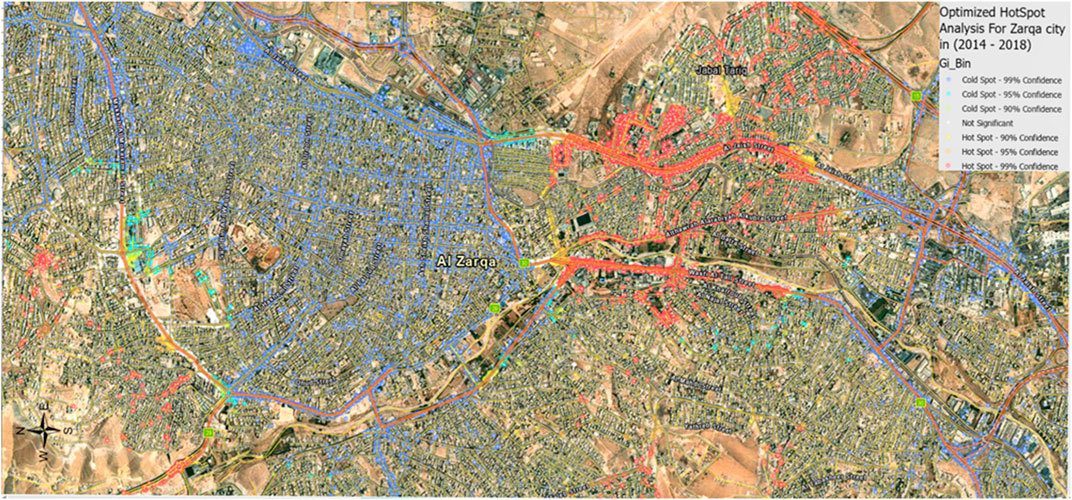
FIGURE 4. Optimized hot spot analysis for Zarqa City in 2014–2018.
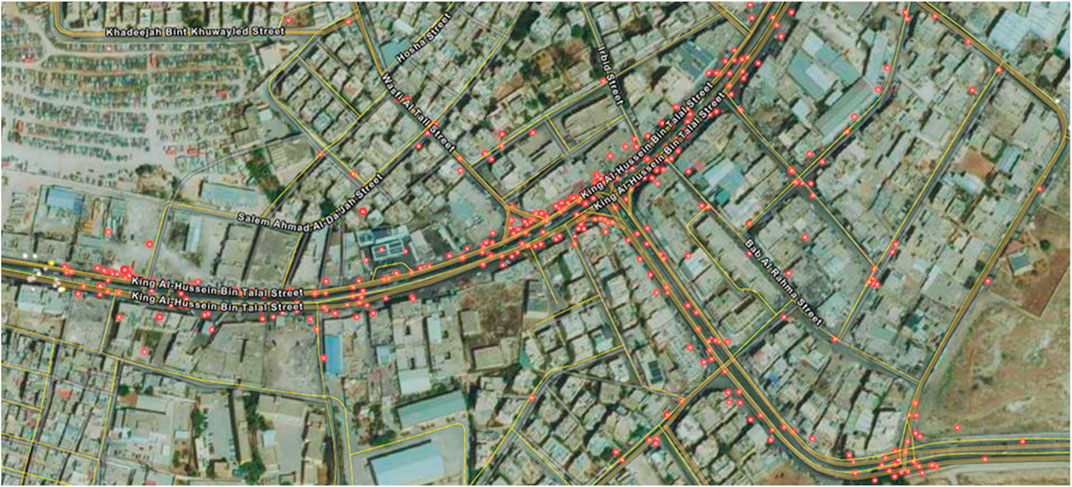
FIGURE 5. Detailed sample of Optimized Hot spot Analysis on King Al Hussein Bin Talal Street.
Fatality accidents have a lower frequency than injury accidents in general. The study area recorded 415 fatality accidents over 5 years. Figure 6 shows that fatality accidents are mainly distributed on the main streets with high traffic volumes and the outer border arterial roads of the city (outside the CBD). Fatalities were distributed on the following streets: Al Jaish Street, Wasfi Al-Tall Street, Makkah Al- Mokaramah Street, King Al Hussein Bin Talal Street, King Abdullah II Bin al Hussein Street, the intersection of Bab Al Wad Street with King Talal Street, and the intersection of Al Jaish Street with Al Shurtah Street. Traffic accidents resulting in injuries in the study area were more frequent than fatality accidents. As shown in Figures 7–9, there were slight, medium, and severe injury accidents in Zarqa City from 2014 to 2018. The most noticeable was the nature of locations, where most of these accidents occurred on high-speed corridors and pedestrian high-density areas.
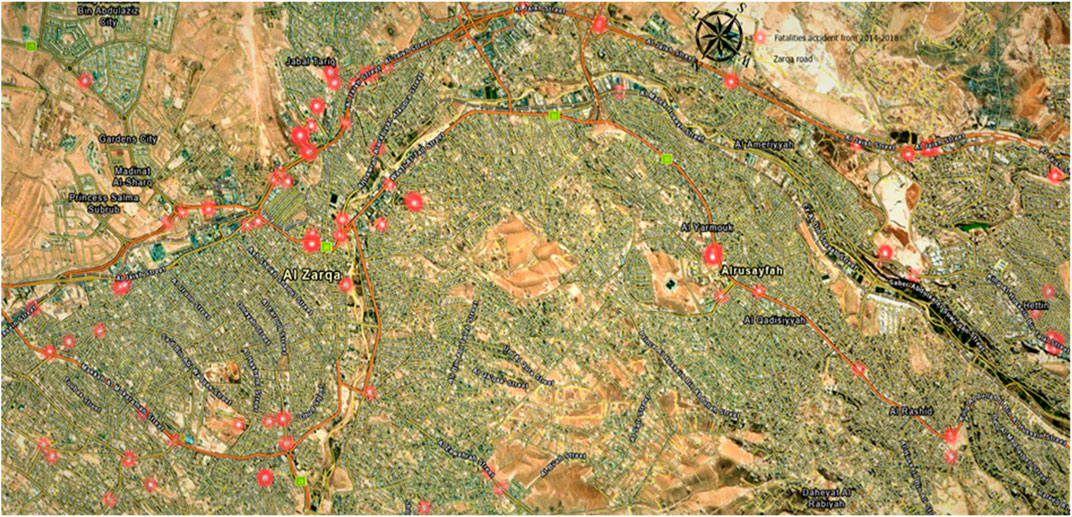
FIGURE 6. Fatality crashes for Zarqa City in 2014––2018.
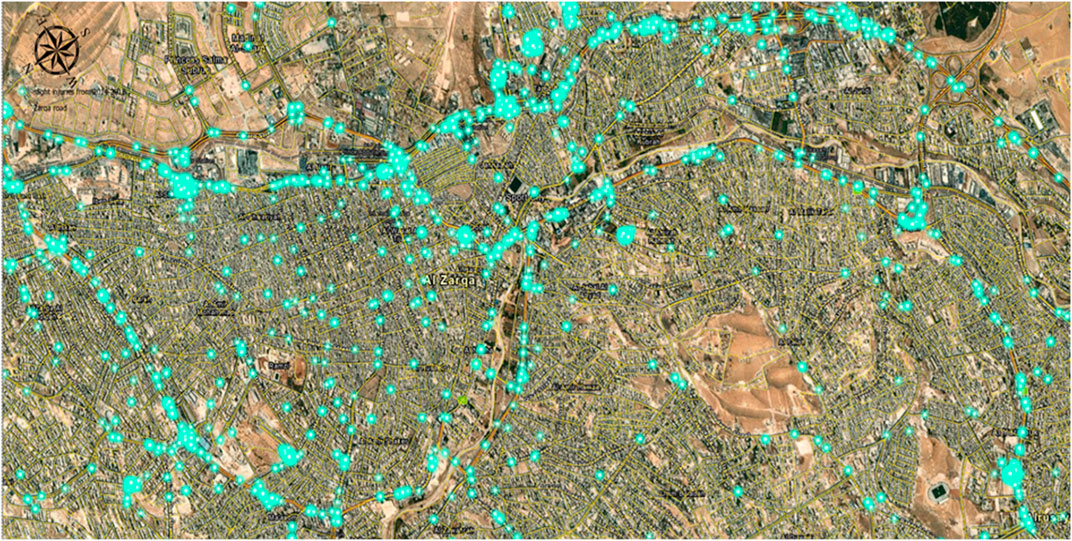
FIGURE 7. Slight injuries crashes for Zarqa City in 2014––2018.
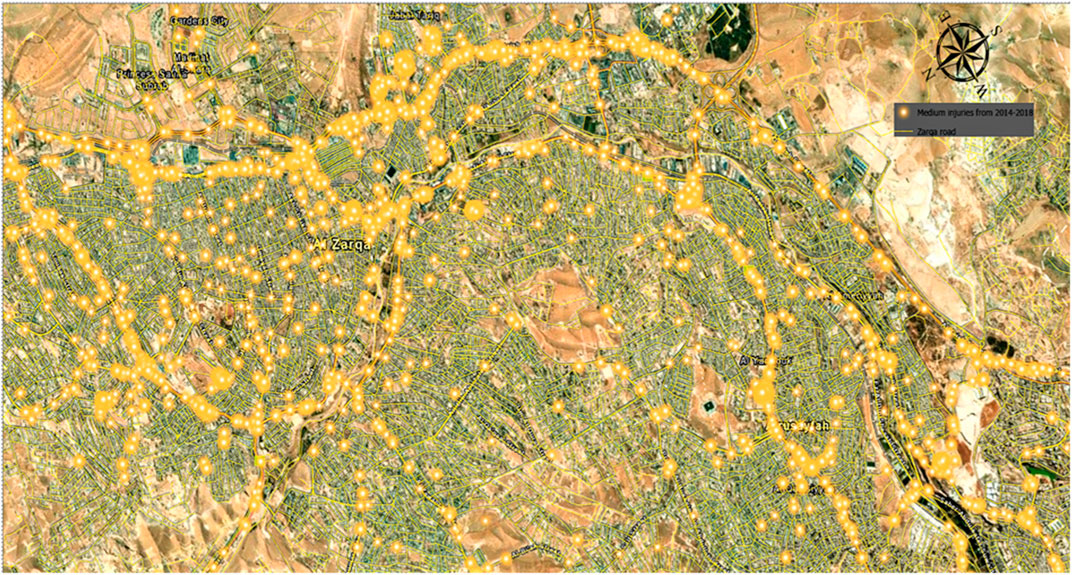
FIGURE 8. Medium injury crashes for Zarqa City in 2014–2018.
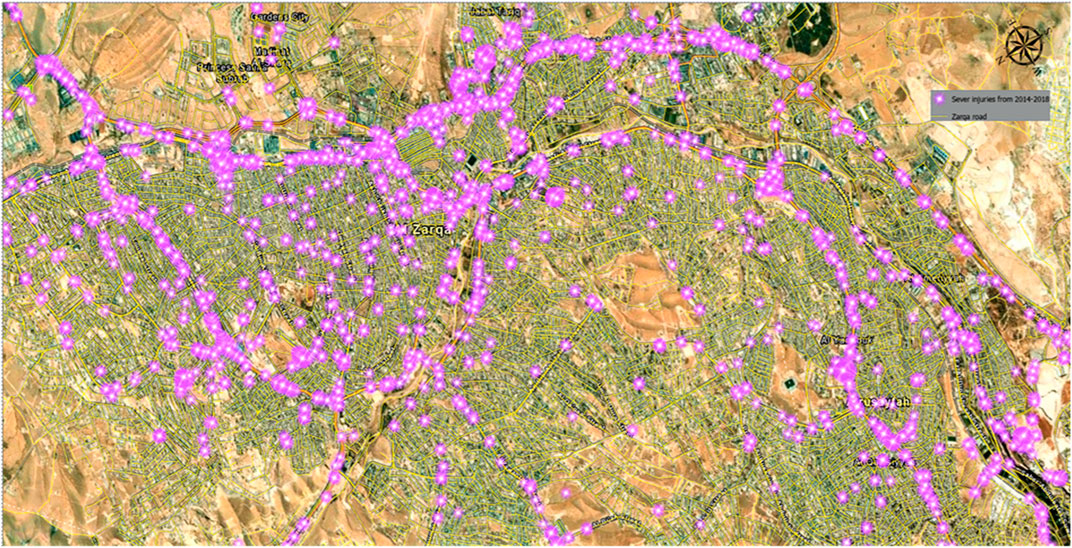
FIGURE 9. Severe injury crashes for Zarqa City in 2014–2018.
The study area recorded 2,654 pedestrian crashes over 5 years. There are many reasons for them such as excessive speed, inadequate light at nighttime, slippery pavement, high traffic volume, inadequate signing, dual parking, inadequate lane width, inadequate maintenance, a high percentage of heavy vehicles, and poor signing. Figure 10 shows the pedestrian crashes in each street from 2014 to 2018. Pedestrian crashes were distributed on the following streets: King Al Hussein Bin Talal Street, King Abdullah II Bin Al Hussein Street, King Talal Street, Al Hashemi Street, and the intersection of Al Jaish Street with Abdullah Ghosheh Street.
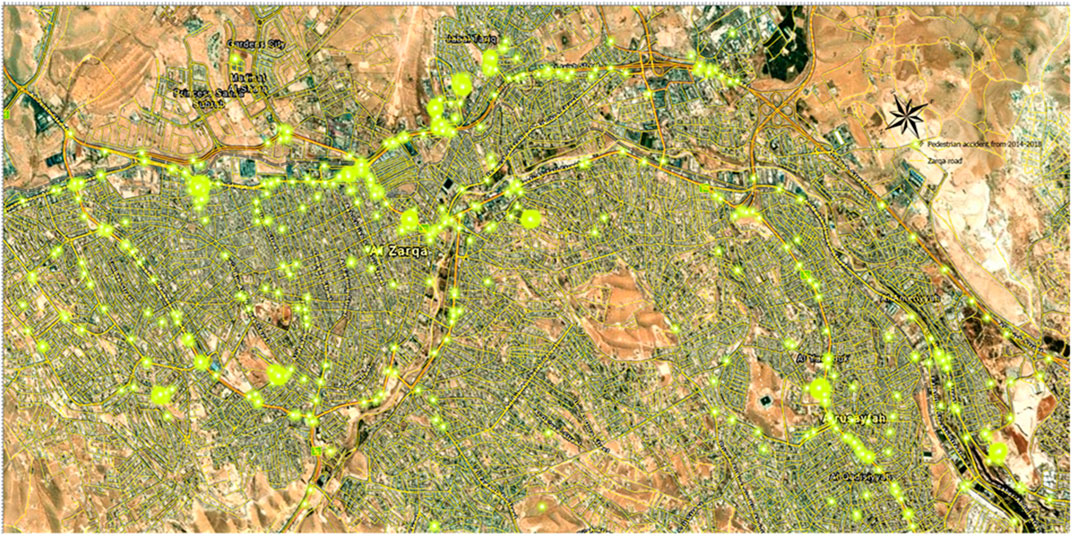
FIGURE 10. Pedestrian crashes for Zarqa City in 2014–2018.
Considering the studied crashes and their causes, several factors can be assessed to enhance traffic safety and reduce accidents in the studied urban areas, such as offering parking in the urban area and near the commercial centers, improving street light, prohibiting on-street parking on one side of the narrow-old roadway due to lack of typical street widths, and finally, introducing a public transport system along with high standards and specifications, including trip schedules and clear trip routes.
Conclusion
This research aims to identify the causes and conditions of crashes; distribution of hot spots; analyze the factors that significantly affect each crash severity level; forecast the risk factors that affect these levels; and the effect of all these factors on pedestrian safety using ML techniques. The results showed that the random forest model was the most suitable method to predict slight, medium, and severe injuries, considering the factors specific to the highway, vehicle, and environment. There were significant factors that caused different types of injuries and fatalities, including the type of crash (collision), road properties (flat straight), road type (flexible pavement), road surface (dry), road lanes (two ways with median), weather (clear), vehicle category (small passenger car), driver mistake (not taking necessary safety precautions while driving), light conditions (night with sufficient road light), day of the week (Thursday), range of speed limit (20 km/h to 60 km/h), and driver age (18–36 years). However, the time of the day was the most significant variable in traffic crashes.
Future work based on this research could involve analyzing data from all regions in Jordan to investigate crashes in other parts of the country. In addition, it is recommended for future studies to better understand the relationship between accident occurrence (hot spots), enforcement, and land use in urban areas such as residential, commercial, educational, industrial, etc. Furthermore, field visits to hazardous locations (hot spots) are recommended to understand the causes of crashes specific to each location to help in formulating strategic plans to reduce or prevent future crashes at these sites.
Data Availability Statement
The original contributions presented in the study are included in the article/Supplementary Materials, further inquiries can be directed to the corresponding author/s.
Author Contributions
All authors listed have made a substantial, direct, and intellectual contribution to the work and approved it for publication.
Conflict of Interest
The authors declare that the research was conducted in the absence of any commercial or financial relationships that could be construed as a potential conflict of interest.
Publisher’s Note
All claims expressed in this article are solely those of the authors and do not necessarily represent those of their affiliated organizations, or those of the publisher, the editors, and the reviewers. Any product that may be evaluated in this article, or claim that may be made by its manufacturer, is not guaranteed or endorsed by the publisher.
References
Achu, A. L., Aju, C. D., Suresh, V., Manoharan, T. P., and Reghunath, R. (2019). Spatio-temporal Analysis of Road Accident Incidents and Delineation of Hotspots Using Geospatial Tools in Thrissur District, Kerala, India. KN J. Cartogr. Geogr. Inf. 69 (4), 255–265. doi:10.1007/s42489-019-00031-1
Al Mamlook, R. E., Ali, A., Hasan, R. A., and Kazim, H. A. M. (2019). “Machine Learning to Predict the Freeway Traffic Accidents-Based Driving Simulation,” in 2019 IEEE National Aerospace and Electronics Conference (NAECON) (Dayton, OH: IEEE), 630–634. doi:10.1109/naecon46414.2019.9058268
Al-Aamri, A. K., Hornby, G., Zhang, L. C., Al-Maniri, A. A., and &Padmadas, S. S. (2020). Mapping Road Traffic Crash Hotspots Using GIS-Based Methods: A Case Study of Muscat Governorate in the Sultanate of Oman. Spat. Stat. 42, 100458. doi:10.1016/j.spasta.2020.100458
Al-Omari, A., Shatnawi, N., Khedaywi, T., and Miqdady, T. (2020). Prediction of Traffic Accidents Hot Spots Using Fuzzy Logic and GIS. Appl. Geomat 12 (2), 149–161. doi:10.1007/s12518-019-00290-7
Alomari, A. H., and Taamneh, M. M. (2020). Front-seat Seatbelt Compliance in Jordan: an Observational Study. Adv. transportation Stud. 2020 (52), 101–116. doi:10.4399/97888255370317
Ando, R., Higuchi, K., and Mimura, Y. (2018). Data Analysis on Traffic Accident and Urban Crime: A Case Study in Toyota City. Int. J. Transportation Sci. Techn. 7 (2), 103–113. doi:10.1016/j.ijtst.2018.01.002
Cai, X., Lei, C., Peng, B., Tang, X., and Gao, Z. (2020). Road Traffic Safety Risk Estimation Method Based on Vehicle Onboard Diagnostic Data. J. Adv. transportation 2020, 13. doi:10.1155/2020/3024101
Chen, C., Zhao, X., Zhang, Y., Rong, J., and Liu, X. (2019). A Graphical Modeling Method for Individual Driving Behavior and its Application in Driving Safety Analysis Using GPS Data. Transportation Res. F: traffic Psychol. Behav. 63, 118–134. doi:10.1016/j.trf.2019.03.017
Cuenca, L. G., Puertas, E., Aliane, N., and Andres, J. F. (2018). “Traffic Accidents Classification and Injury Severity Prediction,” in 2018 3rd IEEE International Conference on Intelligent Transportation Engineering (ICITE) (Singapore: IEEE), 52–57. doi:10.1109/icite.2018.8492545
Di Noia, A., Martino, A., Montanari, P., and Rizzi, A. (2020). Supervised Machine Learning Techniques and Genetic Optimization for Occupational Diseases Risk Prediction. Soft Comput. 24 (6), 4393–4406. doi:10.1007/s00500-019-04200-2
Draelos, R. (2019). Measuring Performance: The Confusion Matrix. Available at: https://towardsdatascience.com/measuring-performance-the-confusion-matrix-25c17b78e516 Accessed January 2022.
Galárraga, L. A., Teflioudi, C., Hose, K., and Suchanek, F. (2013). “AMIE: Association Rule Mining under Incomplete Evidence in Ontological Knowledge Bases,” in Proceedings of the 22nd international conference on World Wide Web, Rio de Janeiro, Brazil (New York, NY: Association for Computing Machinery), 413–422.
Hu, L., Wu, X., Huang, J., Peng, Y., and Liu, W. (2020). Investigation of Clusters and Injuries in Pedestrian Crashes Using GIS in Changsha, China. Saf. Sci. 127, 104710. doi:10.1016/j.ssci.2020.104710
Kumeda, B., Zhang, F., Zhou, F., Hussain, S., Almasri, A., and Assefa, M. (2019). “Classification of Road Traffic Accident Data Using Machine Learning Algorithms,” in 2019 IEEE 11th International Conference on Communication Software and Networks (ICCSN) (Chongqing, China: IEEE), 682–687. doi:10.1109/iccsn.2019.8905362
Labib, M. F., Rifat, A. S., Hossain, M. M., Das, A. K., and &Nawrine, F. (2019). “Road Accident Analysis and Prediction of Accident Severity by Using Machine Learning in Bangladesh,” in 2019 7th International Conference on Smart Computing & Communications (ICSCC) (Sarawak, Malaysia: IEEE), 1–5. doi:10.1109/icscc.2019.8843640
Lee, Y., Wei, C. H., and Chao, K. C. (2017). Non-parametric Machine Learning Methods for Evaluating the Effects of Traffic Accident Duration on Freeways. Arch. Transport 43, 91–104. doi:10.5604/01.3001.0010.4228
Mayr, A., Binder, H., Gefeller, O., and Schmid, M. (2014). The Evolution of Boosting Algorithms. From Machine Learning to Statistical Modelling. Methods Inf. Med. 53 (06), 419–427. doi:10.3414/ME13-01-0122
Özcan, M., and Küçükönder, M. (2020). Investigation of Spatiotemporal Changes in the Incidence of Traffic Accidents in Kahramanmaraş, Turkey, Using GIS-Based Density Analysis. J. Indian Soc. Remote Sensing 48 (7), 1045–1056. doi:10.1007/s12524-020-01137-0
PSD, Public Security Directorate of Jordan. (2018). Jordan Traffic Institute. Available at: https://www.psd.gov.jo/images/traffic/traffic2017.pdf Annual Reports (Accessed 29 November 2020).
Radzuan, N. Q., Hassan, M. H. A., Abdul Majeed, A. P. P., Musa, R. M., Mohd Razman, M. A., and Abu Kassim, K. A. (2019). “Predicting Serious Injuries Due to Road Traffic Accidents in Malaysia by Means of Artificial Neural Network,” in Symposium on Intelligent Manufacturing and Mechatronics (Singapore: Springer), 75–80. doi:10.1007/978-981-13-9539-0_8
WHO, World Health Organization. (2018). Global Status Report on Road Safety 2018: Summary.No.WHO/NMH/NVI/18.20. Available at: https://www.who.int/publications/i/item/9789241565684 (Accessed 29 November 2020).
Keywords: road safety, crashes, hot spots, machine learning, GIS
Citation: Al-Mistarehi BW, Alomari AH, Imam R and Mashaqba M (2022) Using Machine Learning Models to Forecast Severity Level of Traffic Crashes by R Studio and ArcGIS. Front. Built Environ. 8:860805. doi: 10.3389/fbuil.2022.860805
Received: 23 January 2022; Accepted: 14 March 2022;
Published: 20 April 2022.
Edited by:
Iftikhar Azim, Shanghai Jiao Tong University, ChinaReviewed by:
Muhammad Javed, COMSATS University, PakistanMuhammad Farjad Iqbal, Ghulam Ishaq Khan Institute of Engineering Sciences and Technology, Pakistan
Copyright © 2022 Al-Mistarehi, Alomari, Imam and Mashaqba. This is an open-access article distributed under the terms of the Creative Commons Attribution License (CC BY). The use, distribution or reproduction in other forums is permitted, provided the original author(s) and the copyright owner(s) are credited and that the original publication in this journal is cited, in accordance with accepted academic practice. No use, distribution or reproduction is permitted which does not comply with these terms.
*Correspondence: Bara’ W. Al-Mistarehi, YndtaXN0YXJlaGlAanVzdC5lZHUuam8=