 Shadi Hanandeh
 Ahmad Hanandeh2
- 1Civil Engineering Department, Al-Balqa Applied University, Al-Salt, Jordan
- 2MIS Department, Applied Science Private University, Amman, Jordan
- 3Consultation Office, Jordan University, Amman, Jordan
The pavement management system is recognized as an assertive discipline that works on pavement indices to predict the pavement performance condition. This study used soft computing methods such as genetic algorithms and artificial intelligence to propose a modern generation of pavement indices for road networks in Jordan. The datasets used in this study were collected from multiple roads in Jordan, and 128 data points were used in this study. The input variables are the pavement condition index (PCI) and the international roughness index (IRI) in the artificial neural network (ANN) and gene expression programming (GEP) models. The output variable is the pavement serviceability rate (PSR). The results show an efficient performance benefit of using these techniques. In addition, the ANN and GEP models were able to predict the output variable with a reasonable accuracy, where the ANN model has an R2 value of 0.95, 0.87, and 0.98 for the PCI, IRI, and PSR, respectively. The (R2) values of the GEP model are 0.94, 0.89, and 0.99 for PCI, IRI, and PSR, respectively.
Introduction
The pavement management system is determined by AASHTO and defined as a collection of instruments or techniques that can help decision makers in determining excellent approaches for implementing, assessing, and sustaining pavement layers in a practical situation over a specific time period. The maintenance and rehabilitation (M&R) can be designed for the different kinds of roads in pavement management systems. The pavement requires improvement and maintenance due to distress caused by traffic load and environmental conditions, so the first step to evaluate any road is performed by human measurement: this method has low efficiency and consumes a lot of time and labor. Moreover, modern tools were utilized to evaluate pavement distress by employing computerized programs to analyze data and inspect the pavement surface condition; although it is more efficient and faster, it is also difficult to automate the pavement rating. There are many pavement condition evaluation parameters used to measure and rate pavement distresses which reflect their overall condition. Some of these parameters are the pavement condition index (PCI), international roughness index (IRI), and pavement serviceability rate (PSR). Many studies proposed correlations between IRI and PCI as shown in Eq. 1.
where IRI is presented in m/km (Elhadidy et al., 2019).
The pavement condition index has been developed by the U.S. Army Corps of Engineers (1982). The PCI value indicates the type, quantity, and severity of the distress. This value can be used to identify the rate of deterioration, and it can be also be used to determine the appropriate time for maintenance and rehabilitation. The PCI value is a numerical value that ranges from 0 to 100, where the value equal to 100 represents the best pavement condition. The functional assessment of roads mostly involves the ride condition or surface texture of the road segment. The surface roughness reflects the longitudinal profile disturbances as the paving surface adversely affects car-driving quality, thus supplying the road users with this ease. Roughness is represented by calculating the international roughness index displayed in units of meters/kilometers. The present serviceability rate (PSR) measures the pavement serviceability which is the mean rating of each user panel rating for ride-ability; PSR ranges from 0 to 5, which 0 for very poor and 5 for very good. AASHTO recommended that 2.5 or more is acceptable for the highway segment.
Several studies have focused on the pavement management system (PMS) to obtain a correlation between PCI, PSR, and IRI. A powerful correlation that determines the relationship between PCI and IRI with a high value of the coefficient of determination (Dewan and Smith, 2002). This study found a reasonable relationship between IRI and PCI as presented in Eq. 1. The surface roughness can be conducted from the current roughness model when data are available on pavement surface distress; they created an equation between IRI and PCI for data given in this area. The limitation of this study is the absence of some distresses type and severity that may significantly influence the value of IRI; finally, the agencies provided recommendations to deal with the model and improve the proposed model, as shown in Eq. 2.
where IRI is presented in m/km.
Park et al. (2007) established the relationship between PCI (pavement surface distresses) and IRI (surface roughness). The surface roughness was investigated using Paver software for different North Atlantic highway pavement sections. They investigated another significant correlation between IRI and PCI for 63 data points from 20 pavement sections in different states of America. The collected data from nine states gave a poor model with R2 = 0.59.
However, a variance analysis shows that there is a close association between IRI and PCI. Arhin et al. (2015) studied the pavement in the District of Columbia to obtain the correlation between IRI and PCI. IRI was collected using advanced machines that measure the regularity of pavement; on the other hand, the PCI was obtained by the subjective rate for the pavement condition and observing the distresses in the pavement. This study utilized the historical data (using 895 data points) of IRI–PCI to develop the model that is based on regression analysis, the method of forecasting IRI based on PCI through practical and pavement grouping.
The findings of the model indicated that the composite pavement was better than asphalt pavement, followed by concrete pavement. The proposed model was intended to be statistically significant with a 5% significance level; The R2 amounts range between 56% and 82%. The presented equation is shown in Eq. 4.
where IRI is presented in miles).
Suprapto et al. (2017) studied another relationship between the international roughness index and structural numbers. They found that IRI is used for assessing the functional condition of the pavement, while the structural number (SN) is a parameter for assessing the structural condition of the pavement. The pavement condition data were observed using the Android application on smartphones; it is an efficient and low-cost application to collect the data. The main goal of this study is to determine the functional and structural conditions of the road. It was found that when the value of IRI was less than 4, the pavement is functionally in a good condition. Furthermore, when the value of structural number effective (SNeff) is less than the value of the structural number future (SNF), then the structural condition of the road segments has not been able to serve traffic with a design life of 20 years. The previous model will be used to determine the best road maintenance strategies for the pavement using an overlay material when the value of IRI exceeds 4. For structural road maintenance carried out in various scenarios, the phased construction, and direct construction, direct construction gives better results than the phased construction scenarios for the design life of 5–20 years and 10–20 years. Elhadidy et al. (2019) developed a simplified regression model using the long-term pavement performance (LTPP) database to make the relationship between IRI and PCI. They used a total of 1,208 sections with 10,868 data from seven countries (Dubai, Australia, Belarus, Hungary, Norway, Russia, and Slovakia) that were used for model development, while 240 sections with 1,876 data points were used for the model validation. They suggested predicting PCI based on IRI using different highly accurate databases (R2 = 0.995); the mean error for this model is very small with a small standard deviation.
where IRI is presented in m/km.
Al-Omari and Darter (1994) developed the relationship between IRI and presented serviceability rating. The main objectives of this research are to develop a predictive model for PSR as a function of profile IRI for composite, flexible, and rigid pavement. The second goal is to determine the level of rehabilitation based on the IRI and type of distress, derived from the long-term pavement performance (LTPP) database. This study was developed for each pavement type in the states of Louisiana, Michigan, New Jersey, New Mexico, Ohio, and Indiana, and all six states together. A nonlinear relationship between IRI and PSR was developed for all types of pavement with an R2 value = 0.97 by using the statistical analysis system (SAS) data set. In their model, they included IRI, PSR, and pavement type for every pavement section in each state as presented in Eq. 6.
where IRI is presented in mm/m.
They found that there were no significant differences between the models for different states and pavement types. Gulen et al. (1994) developed another relationship between IRI and present serviceability index rating (PSI); a specially equipped car was used to measure the IRI. This study was conducted for Taiwan highway; the analysis is based on a backpropagation neural network methodology that evaluates the applicability of IRI to represent the pavement performance. Moreover, IRI can be predicted from pavement distresses rating using video images, which are recorded by a camera, and this is what we call a backpropagation neural network. They developed a correlation between mean present serviceability index rating and IRI from data that was given by the Indiana Department of Transportation (INDOT) for 10 randomly selected sections in Indiana with 1mi for each section at three roughness levels for all types of pavement that are presented in Eqs 7–9.
where IRI is presented in m/km.
The neural networks are used as an agent for evaluating pavement conditions. They improved the ANN scheme for the measurement of pavements’ situation grade with regard to several cracks and distress. Neural network investigation confirms the ability to ascertain pavement evaluation indices (Eldin and Senouci, 1995). Lima et al. (2019) assessed the abilities of ANN in discovering the visual condition index of different types of pavements. Several studies recommended genetic algorithms (GA) and artificial neural network paradigms to estimate the pavement evaluation indices, pavement material characterization, and structural engineering fields such as prediction of layer modulus and other fields such as using ANN to estimate subgrade and base course stabilization (Gopalakrishnan et al., 2017; Hanandeh et al., 2020a, 2020b; You et al., 2020; Piryonesi and El-Diraby, 2021; Ye et al., 2021; Zuhair Murad, 2021; Al Bodour et al., 2022; Hanandeh, 2022).
Barzegaran et al. (2021) used IRI prediction models from pavement distresses which could be an alternative solution. In this study, 507 km of asphalt pavements in Kermanshah, Iran, were studied utilizing IRI and pavement surface and evaluation rating (PASER) as a quick and cost-effective index. PASER developed IRI prediction models utilizing regression (R2 = 0.66) and artificial neural networks (ANNs) (R2 = 0.69). The model development (R2 0.97) and validation (R2 = 0.85) findings suggested that the ANN model performed well.
Fakhri et al. (2021) used the laser crack measurement system (LCMS) to identify and measure surface distresses and roughness on 268 km of key highways in Iran. LCMS gives the highest detection and measurement accuracy when compared to manual surveys. The results show that the ANN outperforms the other models for the 100-m sections, with a coefficient of determination (R2) of 0.82. With a 0.94 correlation, the best case was utilizing ANN in 100-m chunks for places with a mild climate and medium traffic intensities.
Fakhri and Dezfoulian (2019) used artificial neural networks and regression models to develop a relationship between deflection bowl parameters derived from a falling weight deflectometer (FWD) and two pavement performance indices, the international roughness index (IRI) and pavement surface evaluation and rating index (PASER). Our model provides a satisfactory connection between IRI, PASER, and structural indices based on deflection measurements, as shown by the results. The superiority of ANN performance over non-intelligent models may be seen when comparing the outcomes of ANN with regression models. The results of this research show that combining the IRI and PASER indices results in a more accurate structural pavement evaluation.
This study studied maintenance and rehabilitation strategies for multilane roads in the Irbid governorate. Also, we developed proposed models using artificial neural networks and genetic algorithms to find the relationship between the parameters (PCI, IRI, and PSR) that measure the pavement performance, and this was achieved by using 61 section samples from different locations. These methods reduced the number of pavement tests; therefore, they saved cost and time. The pavement engineers can use one index to evaluate the pavement performance.
Data Collection Methods
The data were collected from different locations in Jordan by conducting field measurements for suburban and rural divided multilane highways located in the Irbid governorate road network (Abdulrahim, 2018). Many different types of equipment were used to develop 128 data points for 61 segments. These segments were selected at different locations in Jordan and then coordinated using the android GPS application called “share my GPS location.” The PAVER technique used visual inspection for 40–50 m for each section with an area ranging from 140 to 326 m2, based on the width of the corridor to assess distresses’ kind, amount, and severity. Before beginning the examination, the safety concerns were addressed by closing the part under investigation with reflective cones. The visual data were categorized on a specific PAVER sheet, and the density of each distress was calculated using Eq. 10.
The present serviceability rating was calculated on the identical sections using the method shown in Figure 1 and following the Federal Highway Administration’s (FHWA) instructions. To limit the difference between the evaluation groups, the average individual rating was obtained for each four-person evaluation panel. The data for the international roughness index were collected in the field for the same sections that were used to calculate PCI. The results were recorded in millimeters per meter (mm/m) using Roughometer III equipment with sensors mounted on a vehicle. IRI was calculated from an observed longitudinal road profile by multiplying the output of a quarter-car model by the length of the profile to yield a summary roughness index with units of slope.
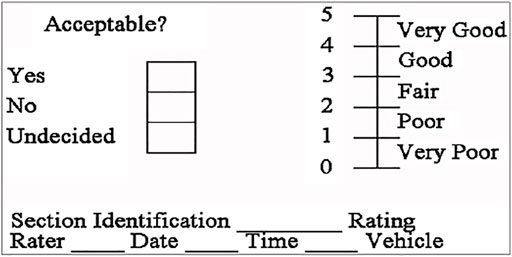
FIGURE 1. Individual present serviceability rating form.
A comprehensive statistical analysis was conducted on the variables of the models used in this work, including mean, standard deviation, average, maximum, and minimum values displayed in Table 1.
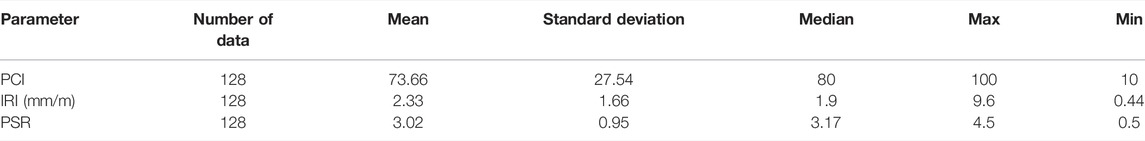
TABLE 1. Descriptive statistical analysis for three models’ parameters.
Location of Distresses
Using the coordinates collected during the field study, the maps for each street in the study area were prepared as shown in Figure 2.
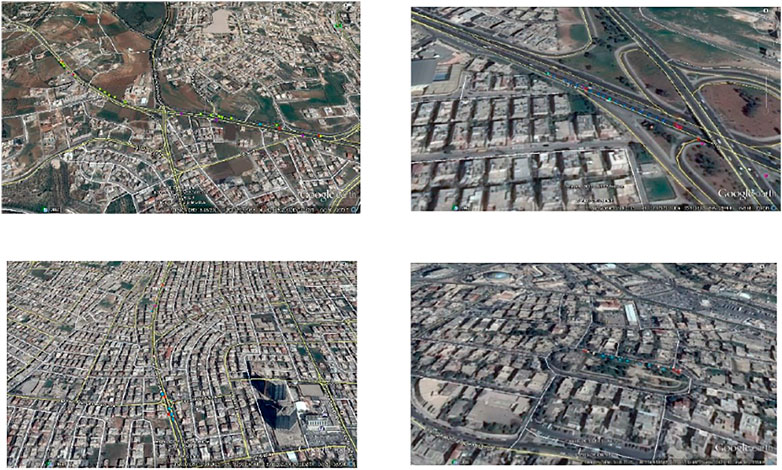
FIGURE 2. Different locations of the study area in Amman city.
Methodology
In this study, two machine learning methods were used to analyze the collected data genetic algorithm and an artificial neural network. A genetic algorithm is a theoretical algorithm that depends on historical information; it is based on a survival-of-the-fittest concept. This is used as a search point with improved performance. In the case of maintenance management, this technique shows high performance with problems that have huge variable characteristics. ANN is a high-performance model that is used to correlate the component of the system together using the numerical load that is turned based on input, processing, output, and experience. The ANN model is used by pavement engineers as a tool to solve and predict complex system problems and models. To maintain the ANN at an acceptable level and as a prospect for the future, it must be combined with engineering techniques. ANNs, like a human brain, use experience, examples, and practice to learn.
Genetic Algorithm
A genetic algorithm (GA) is a technique for search based on natural selection and genetics. GA is based on Darwin’s evolution theory, which simulates the fundamental method of evolution to reach the most optimal form of the objective function. The genetic algorithm has three processes that included selection, crossing, and mutations. The individual’s improvement by GA was shown by Holland (1975), generalized by his students, which allows a population composed to reach the maximum fitness under specified rules. GAs use historical information to solve problems and perform better solutions for the new generation (Goldberg and Holland, 1988). Gene expression programming (GEP) software is a branch of GP that develops software programs of different sizes and shapes encoded in linear chromosomes of fixed length. The chromosomes are built from many genes. Each gene is encoding a smaller subprogram; therefore, the two main parameters of GEP are the chromosomes and expression trees (ETs). Decoding information (from the chromosomes to the ETs) is called a translation process. In this research, GeneXpro5.0 software based on the Darwinian principle to solve problems was used for 86 data points to predict correlations between PCI, IRI, PSR, and the 42 data points for testing. There are five main steps to create the model on the software as follows:
1. Determine the fitness function.
2. Choose the number of terminals needed for the beats model (50,000 terminals were chosen in this research).
3. Determine the number of genes
4. Prepare to use gene expression programming by choosing the function length
5. Choose the set of genetic operations that cause variation and their rate.
After the trials arrived at 50,000 iterations, the run to get the optimum model has been stopped based on clear parameters (R2 value > 0.80), and the correlation coefficient was chosen and illustrated ETs that indicated a perfect solution with 3 generations as shown in Figures 2–4, respectively.
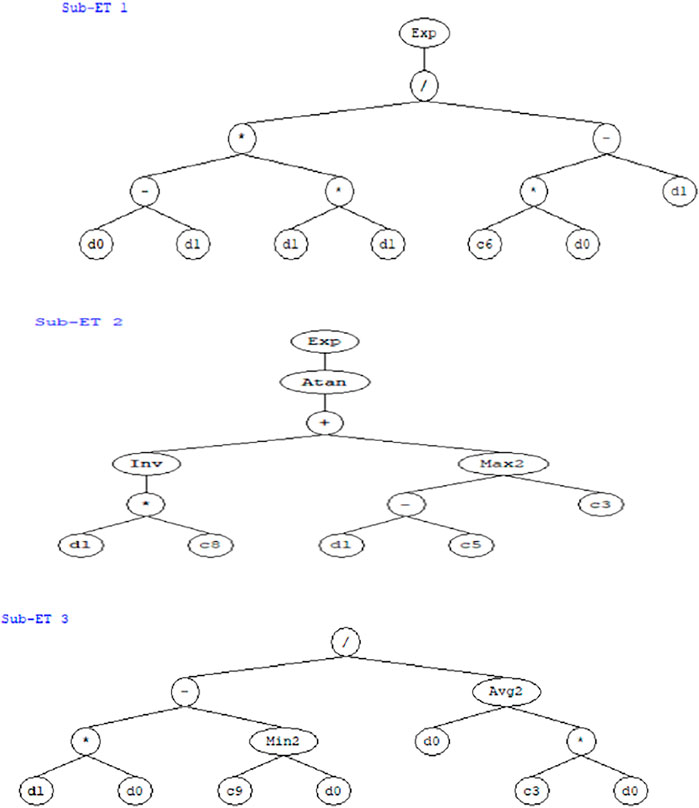
FIGURE 3. The expression tree of PSR was obtained from the genetic programing software Genexpro 5.0 (d1: IRI, d0: PCI).
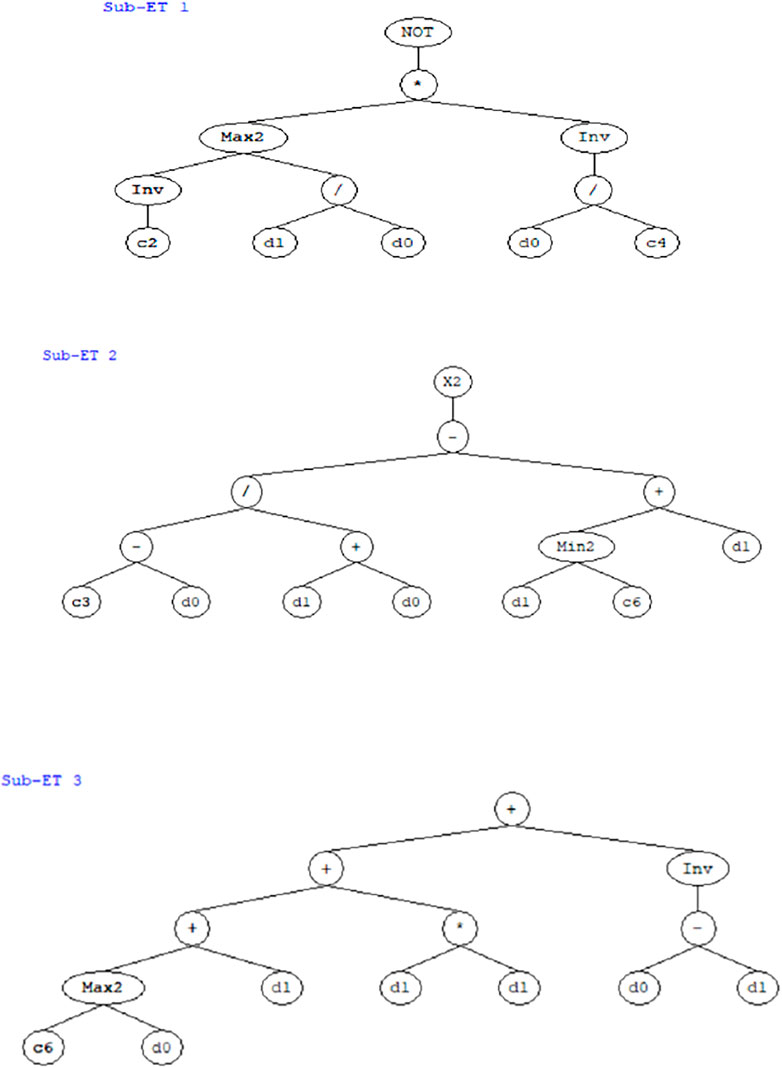
FIGURE 4. The expression tree of PCI was obtained from the genetic programing software Genexpro 5.0 (d1: PSR, d0: IRI).
Tree Mapping to Predict (PCI, IRI, and PSR) by Using GA
The chosen GEP model was generated utilizing three genes with addition as a connecting role. The GEP criterion for the three proposed models is presented in Table 2, and the expression trees for the three models were presented in Figures 3–5.
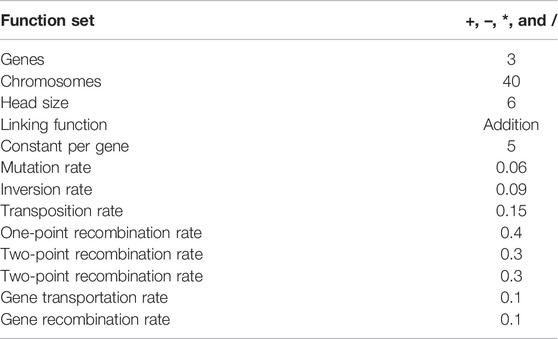
TABLE 2. GEP setting parameter.
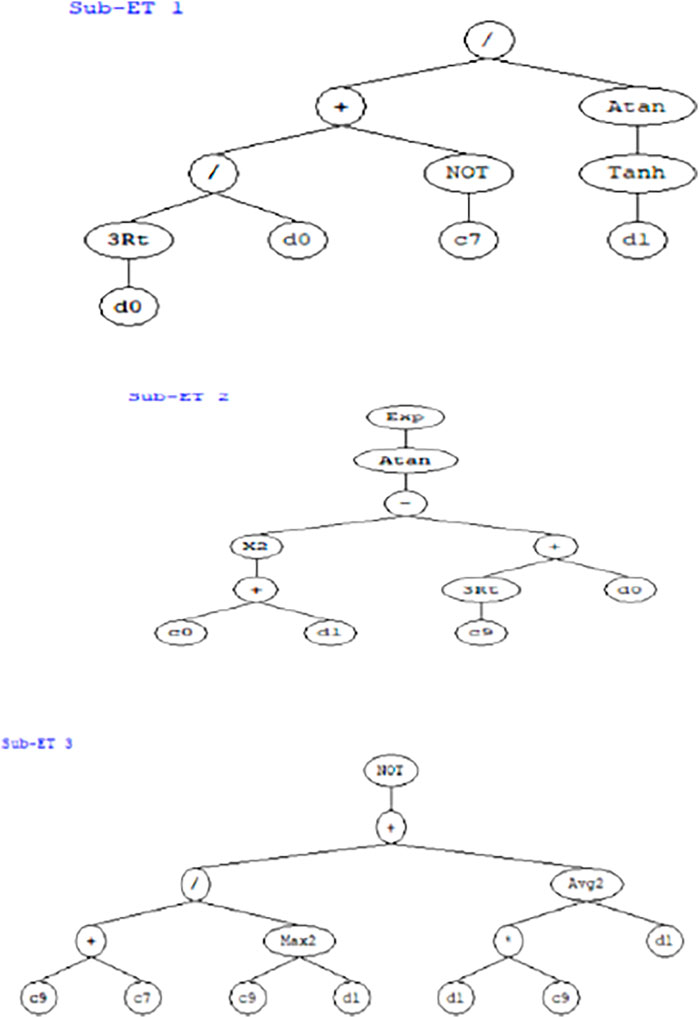
FIGURE 5. The expression tree of IRI was obtained from the genetic programing software Genexpro 5.0 (d1: PSR, d0: PCI).
The illustrated ETs in C++ language were translated to the mathematical equations stated in Eqs 10–12, respectively. The produced genetics algorithm pattern is performed in the manner of the representation tree as presented in Figures 2–4. Three sub-trees were developed (Sub-ET-1, 2, and, 3) and converted into a scientific equation model as given in Eqs 11–13, respectively.
Here,
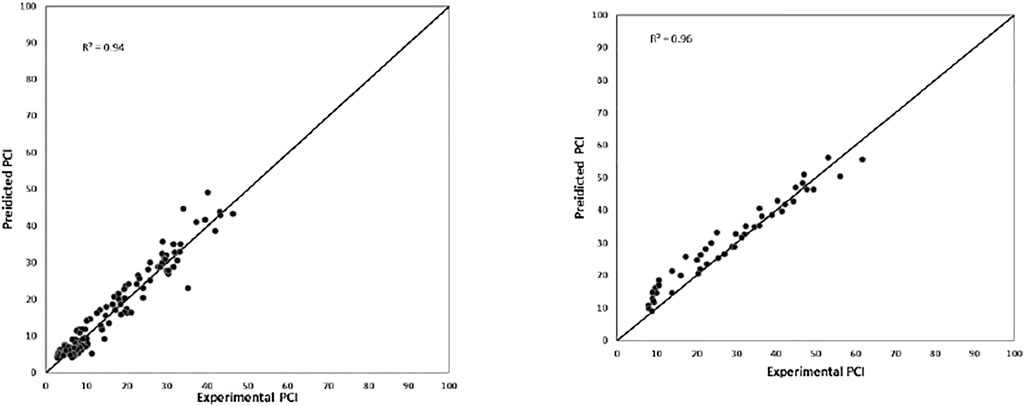
FIGURE 6. Correlation of the predicted PCI versus measured PCI for testing and training data.
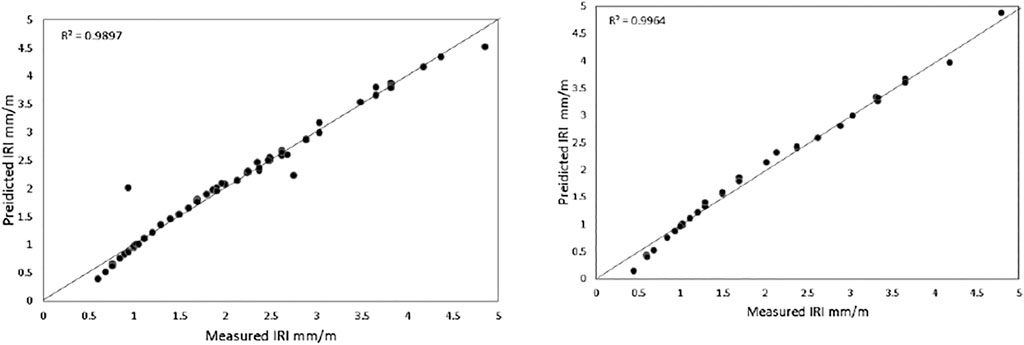
FIGURE 7. Correlation scheme of predicted IRI against IRI for training and testing data.
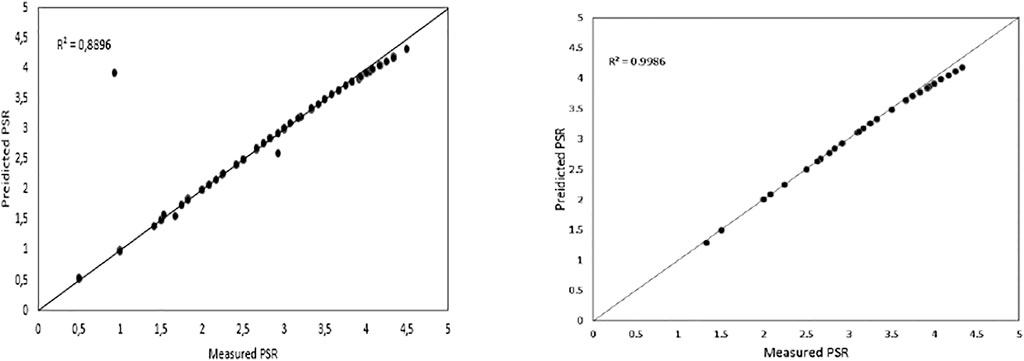
FIGURE 8. Correlation scheme of predicted PSR against PSR for training and testing data.
Artificial Neural Network
An artificial neural network is a valuable computational tool based on a mathematical simulation model, ANNs derive the output data by processing the information, and this is achieved by precisely training the network. Ceylan et al. (2002) used ANNs as pavement structural analysis tools for the rapid and accurate prediction of critical responses and deflection profiles of flexible pavements subjected to typical highway loadings. Solanki (2013) developed a database for stabilized subgrade soils in Oklahoma and developed artificial neural network (ANN) models to estimate the resilient modulus (Mr). ANNs consist of multiple layers of the analogous processing component; it also contains hidden layers connected to the adjacent layer that can be modified and improve the performance during training by changing the weighting factor according to the predetermined algorithm. ANNs treat the (input–output) data frequently, and they can be trained by repeating the process. Many types of algorithms can be used to train the network: the training algorithms can be divided into two types: supervised and unsupervised. The supervised algorithms adjust the weights and the thresholds using the input and target output values, while the unsupervised algorithms only use the input values. The supervised training algorithms include backpropagation which is the most popular algorithm for training ANNs. The backpropagation ANNs, developed by Meier, consisted of frequently processing training examples to the network. ANN contains several highly interconnected processing components known as “nodes.” The net input is identified using weighting value, input data, and bias value in the processing element. Thus, the input data will be converted to output data by providing a function of these net inputs. The structure of the ANN design consists of a collection of nodes, hidden layers, and output data. This study introduces ten nodes, two hidden layers, and one output variable data. The nodes of input data are acquired by field tests, and then these data will be transmitted to a hidden layer; in this layer, the data are treated and obtained as the output data. The trained neural network models will eventually enable pavement engineers to easily solve complex resource-intensive problems instead of using traditional techniques.
Figure 9 displays the arrangement of the neural network pattern, as noticed in several input parameters. By altering the number of hidden layers and achieving the most suitable model. In addition, the last layer called the output of the backpropagation process is shown, in Figure 10, to get a minimum error.
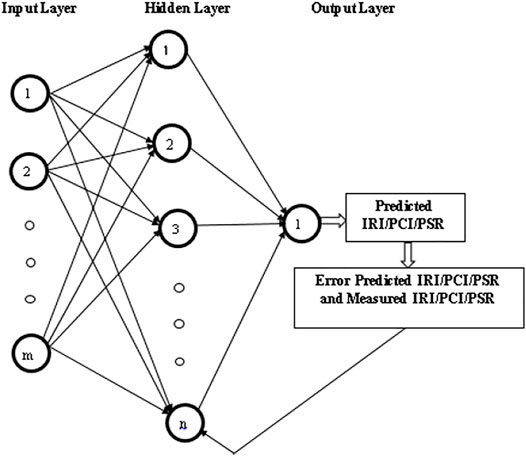
FIGURE 9. Structure of backpropagation neural network.
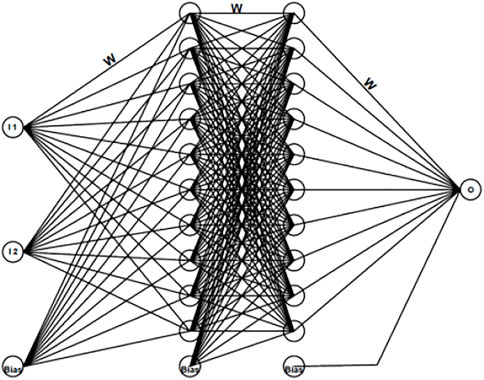
FIGURE 10. ANN structure.
There are five main steps to create the ANN model on software as follows: The dependent and independent data need to be determined for each model, as shown in Table 3. The inputs and outputs at each node in the first hidden layer need to be measured (H1 to H10).
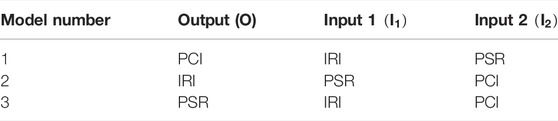
TABLE 3. Output and input for developed ANN model.
In this study, three models were developed by ANN as presented in Table 5. The structure of developed models contains one output (O) and two inputs (
Model to Predict PCI, IRI, and PSR by Using ANN
This model utilized IRI and PSR as the input parameters and the output is IRI; the model includes two hidden layers and each hidden layer includes 10 neurons as shown in Figures 11–13.
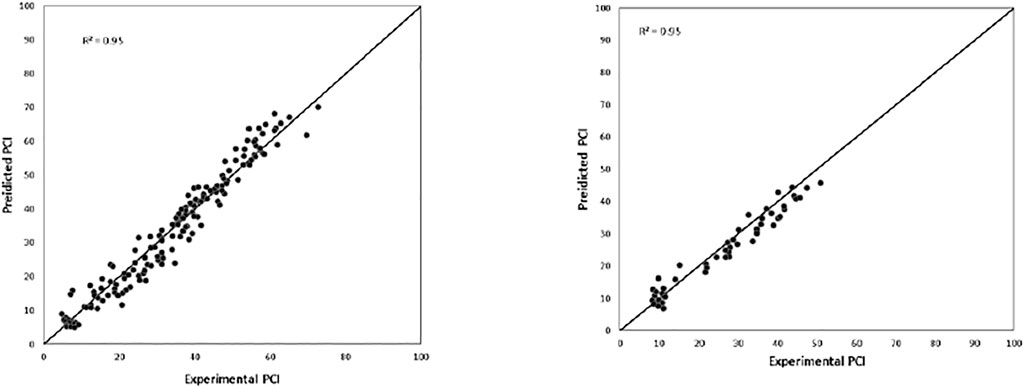
FIGURE 11. The regression plot of predicted model 1 PCI against experimental PCI for testing and training data.

FIGURE 12. The regression plot of predicted model 2 IRI against experimental IRI for testing and training data.
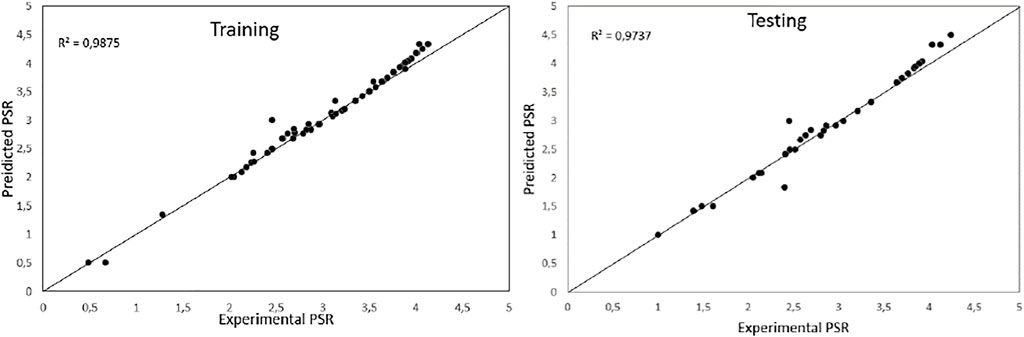
FIGURE 13. The regression plot of predicted model 3 PSR against experimental PSR for testing and training data.
Model Verification and Application
To confirm the three proposed models, obtained from the genetic algorithm method in this research, 52 sections were selected to confirm the efficiency of the proposed model PCI, PSR, and IRI in different locations in Jordan as shown in Figure 14. The genetic algorithm models generated in this study were employed to estimate the PCI, PSR, and IRI. The relative deviation, Eq. 14, was employed to discover the deviation within the measured and proposed model to verify the efficiency of the model.
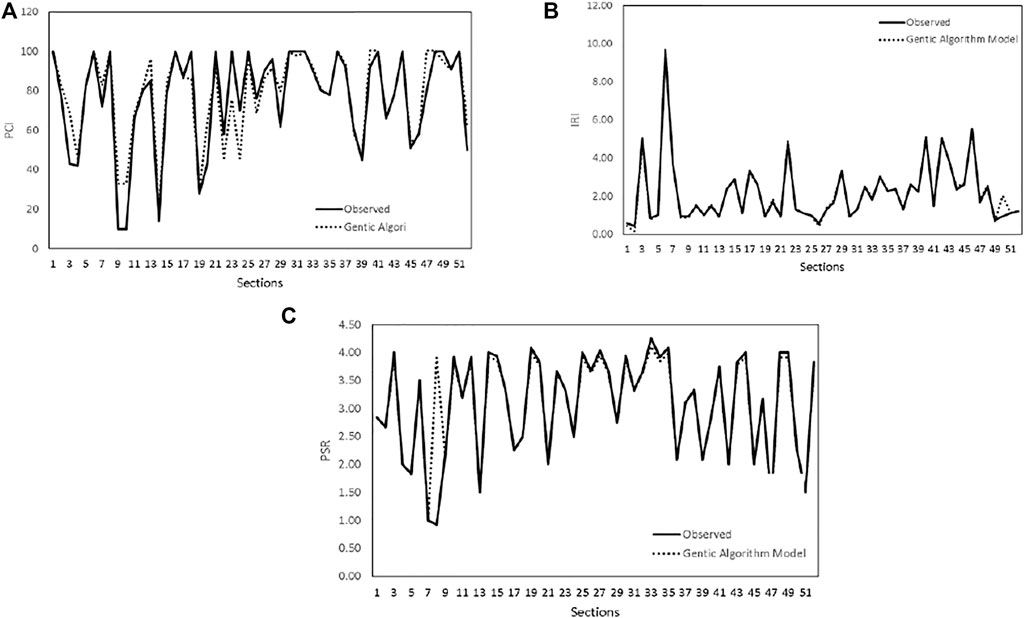
FIGURE 14. Predicted PCI (A), IRI (B), and PSR (C), respectively, using GEP.
Conclusion
This study proposed innovative methods to predict the pavement performance indices PSR, PCI, and IRI. Soft computing techniques were used to evaluate the pavement performance conditions. Two methods of machine learning artificial neural networks were employed to evaluate the pavement evaluation indices. Genetics algorithms and methods were performed to predict PSR/PCI and IRI values. The artificial neural network with two hidden and 10 nodes shows a reliable method to predict PSR/PCI and IRI. The model was simulated in Python software to decide their confidence; the coefficient of determination value was our standard in the diagnosis of the model performance. Using trial and error to achieve the most reliable hidden layer numbers for the best regression, the ANN has an adequate evaluation ability to determine the output PSR, PCI, and IRI, the value of PSR obtained by Python software for the first model was 0.98. On the other hand, the GN model developed better results than ANN and the generated equations from GA are applicable for practical use; it may also save the effort and cost for site inspection. In addition, additional measured data were used in this study to verify the proposed models.
Data Availability Statement
The original contributions presented in the study are included in the article/Supplementary Material; further inquiries can be directed to the corresponding author.
Author Contributions
SH, conceptualization, programming methodology, and writing—original draft. AH: methodology, form analysis, data analysis, and writing. SH: data collection and analysis. MA and MT: data interpretation and writing—style editing and formatting.
Conflict of Interest
The authors declare that the research was conducted in the absence of any commercial or financial relationships that could be construed as a potential conflict of interest.
The handling editor YM declared a shared affiliation with the authors MA, MT at the time of review.
Publisher’s Note
All claims expressed in this article are solely those of the authors and do not necessarily represent those of their affiliated organizations, or those of the publisher, the editors, and the reviewers. Any product that may be evaluated in this article, or claim that may be made by its manufacturer, is not guaranteed or endorsed by the publisher.
References
Abdulrahim, M. (2018). Estimation of Free Flow Speed at Suburban and Rural Divided Multilane Highways.
Al Bodour, W., Hanandeh, S., Hajij, M., and Murad, Y. (2022). Development of Evaluation Framework for the Unconfined Compressive Strength of Soils Based on the Fundamental Soil Parameters Using Gene Expression Programming and Deep Learning Methods. J. Mat. Civ. Eng. 34 (2), 4087. doi:10.1061/(ASCE)mt.1943-5533.0004087
Al-Omari, B., and Darter, M. I. (1994). Relationships between International Roughness Index and Present Serviceability Rating. Transp. Res. Rec. (1435).
Arhin, S. A., Williams, L. N., Ribbiso, A., and Anderson, M. F. (2015). Predicting Pavement Condition Index Using International Roughness Index in a Dense Urban Area. J. Civ. Eng. Res. 5 (1), 10–17. doi:10.5923/j.jce.20150501.02
Barzegaran, J., Shahni Dezfoulian, R., and Fakhri, M. (2021). Estimation of IRI from PASER Using ANN Based on K-Means and Fuzzy C-Means Clustering Techniques: a Case Study. Int. J. Pavement Eng., 1–15. doi:10.1080/10298436.2021.2000988
Dewan, S. A., and Smith, R. E. (2002). Estimating International Roughness Index from Pavement Distresses to Calculate Vehicle Operating Costs for the San Francisco Bay Area. Transp. Res. Rec. 1816, 65–72. doi:10.3141/1816-08
Eldin, N. N., and Senouci, A. B. (1995). A Pavement Condition-Rating Model Using Backpropagation Neural Networks. Comput. Civ. Infrastruct. Eng. 10, 433–441. doi:10.1111/j.1467-8667.1995.tb00303.x
Elhadidy, A. A., El-Badawy, S. M., and Elbeltagi, E. E. (2019). A Simplified Pavement Condition Index Regression Model for Pavement Evaluation. Int. J. Pavement Eng. 22, 643–652. doi:10.1080/10298436.2019.1633579
Fakhri, M., Karimi, S. M., and Barzegaran, J. (2021). Predicting International Roughness Index Based on Surface Distresses in Various Climate and Traffic Conditions Using Laser Crack Measurement System. Transp. Res. Rec. 2675, 397–412. doi:10.1177/03611981211017906
Fakhri, M., and Shahni Dezfoulian, R. (2019). Pavement Structural Evaluation Based on Roughness and Surface Distress Survey Using Neural Network Model. Constr. Build. Mater. 204, 768–780. doi:10.1016/j.conbuildmat.2019.01.142
Goldberg, D. E., and Holland, J. H. (1988). Guest Editorial Genetic Algorithms and Machine Learning. Mach. Learn 3, 95–99.
Gopalakrishnan, K., Khaitan, S. K., Choudhary, A., and Agrawal, A. (2017). Deep Convolutional Neural Networks with Transfer Learning for Computer Vision-Based Data-Driven Pavement Distress Detection. Constr. Build. Mater. 157, 322–330. doi:10.1016/j.conbuildmat.2017.09.110
Gulen, S., Woods, R., Weaver, J., and Anderson, V. L. (1994). Correlation of Present Serviceability Ratings with International Roughness Index. Transp. Res. Rec. 1435, 27.
Hanandeh, S., Alabdullah, S. F., Aldahwi, S., Obaidat, A., and Alqaseer, H. (2020a). Development of a Constitutive Model for Evaluation of Bearing Capacity from CPT and Theoretical Analysis Using Ann Techniques. Geomate 19, 229–235. doi:10.21660/2020.74.36965
Hanandeh, S., Ardah, A., and Abu-Farsakh, M. (2020b). Using Artificial Neural Network and Genetics Algorithm to Estimate the Resilient Modulus for Stabilized Subgrade and Propose New Empirical Formula. Transp. Geotech. 24, 100358. doi:10.1016/j.trgeo.2020.100358
Hanandeh, S. (2022). Introducing Mathematical Modeling to Estimate Pavement Quality Index of Flexible Pavements Based on Genetic Algorithm and Artificial Neural Networks. Case Stud. Constr. Mater. 16, e00991. doi:10.1016/j.cscm.2022.e00991
Holland, J. H. (1975). Adaptation in Natural and Artificial Systems : An Introductory Analysis with Applications to Biology, Control, and Artificial Intelligence.
Lima, D., Santos, B., and Almeida, P. (2019). Methodology to Assess Airport Pavement Condition Using GPS, Laser, Video Image and GIS. In Pavement and Asset Management. 301–307. doi:10.1201/9780429264702-36
Park, K., Thomas, N. E., and Lee, K. W. (2007). Applicability of the International Roughness Index as a Predictor of Asphalt Pavement Condition. J. Transp. Eng. 133 (12), 706–709. doi:10.1061/(ASCE)0733-947X(2007)133:12(706)
Piryonesi, S. M., and El-Diraby, T. E. (2021). Examining the Relationship between Two Road Performance Indicators: Pavement Condition Index and International Roughness Index. Transp. Geotech. 26, 100441. doi:10.1016/j.trgeo.2020.100441
Solanki, P. (2013). Artificial Neural Network Models to Estimate Resilient Modulus of Cementitiously Stabilized Subgrade Soils. Int. J. Pavement Res. Technol. 6 (3), 155–164. doi:10.6135/ijprt.org.tw/2013.6(3).155
Suprapto, M., and Setyawan, A. (2017). The Use of International Roughness Index and Structural Number for Rehabilitation and Maintenance Policy of Local Highway. In IOP Conf. Ser. Mat. Sci. Eng. 176 (1), 012031. doi:10.1088/1757-899X/176/1/012031
Ye, W., Jiang, W., Tong, Z., Yuan, D., and Xiao, J. (2021). Convolutional Neural Network for Pothole Detection in Asphalt Pavement. Road Mater. Pavement Des. 22, 42–58. doi:10.1080/14680629.2019.1615533
You, L., Yan, K., and Liu, N. (2020). Assessing Artificial Neural Network Performance for Predicting Interlayer Conditions and Layer Modulus of Multi-Layered Flexible Pavement. Front. Struct. Civ. Eng. 14, 487–500. doi:10.1007/s11709-020-0609-4
Keywords: pavement condition index, pavement management system, pavement serviceability rate, genetic algorithm, international roughness index, neural network
Citation: Hanandeh S, Hanandeh A, Alhiary M and Al Twaiqat M (2022) Application of Soft Computing for Estimation of Pavement Condition Indicators and Predictive Modeling. Front. Built Environ. 8:895210. doi: 10.3389/fbuil.2022.895210
Received: 13 March 2022; Accepted: 19 May 2022;
Published: 21 October 2022.
Edited by:
Yasmin Murad, The University of Jordan, JordanReviewed by:
Mansour Fakhri, K.N. Toosi University of Technology, IranAhmad N. Tarawneh, Hashemite University, Jordan
Copyright © 2022 Hanandeh, Hanandeh, Alhiary and Al Twaiqat. This is an open-access article distributed under the terms of the Creative Commons Attribution License (CC BY). The use, distribution or reproduction in other forums is permitted, provided the original author(s) and the copyright owner(s) are credited and that the original publication in this journal is cited, in accordance with accepted academic practice. No use, distribution or reproduction is permitted which does not comply with these terms.
*Correspondence: Shadi Hanandeh, aGFuYW5kZWhAYmF1LmVkdS5qbw==