 Pierino Lestuzzi
- Earthquake Engineering and Structural Dynamics Laboratory (EESD), School of Architecture, Civil and Environmental Engineering (ENAC), Swiss Federal Institute of Technology Lausanne (EPFL), Lausanne, Switzerland
This paper contains an investigation on the potential decrease of seismic vulnerability related to building replacements for the cities of Sion and Martigny in Switzerland. Those two cities were identified for the present research based on the accuracy of the corresponding available information. Seismic assessment at urban scale was recently achieved for both cities and new buildings are systematically indexed according to the construction regulation of the canton of Wallis (Valais). Sion and Martigny belong to the largest cities of the canton of Wallis and this region is characterized by the highest seismicity within Switzerland. The investigation focuses on a 4-year period between 2016 and 2019. Cases for which an existing building is demolished and replaced by a new one were identified and checked. Those cases do not represent general practice. The majority of new buildings are built on free land. Consequently, the building replacement rate is too low to lead to a significant decrease of the seismic vulnerability at urban scale. In addition to the systematic appropriate seismic design of new buildings, retrofitting of existing buildings therefore remains the adequate strategy for seismic vulnerability mitigation. In case of replacement, low-rise buildings are generally replaced by mid-rise buildings. Moreover, unreinforced masonry buildings are usually replaced by reinforced concrete shear-wall buildings. This slightly impacts the building stock distributions but the seismic vulnerability is not significantly changed, since the demolished buildings are not the most vulnerable ones. Nevertheless, few obvious isolated vulnerability decreases occurred with respect to the demolition of soft-story buildings for instance. By contrast, seismic vulnerability may also be increased in the case where a new building is built against an existing one with a different story level and without an adequate seismic separation joint.
Introduction
Adequate seismic-design methodologies will protect human life and minimize damage to new buildings. From a general point of view, the replacement of potentially vulnerable existing buildings by new buildings may be considered as a contribution to seismic vulnerability mitigation. Retrofitting of the vulnerable existing building stock requires enormous resources, especially in terms of financial means (Acito et al., 2020). It is thus questionable whether retrofitting may be substituted by building replacements to decrease seismic vulnerability at urban scale. Ideally, retrofitting could be superseded by building replacements if the related rate is large enough. Most of the building stock should be replaced within a time frame of approximately 100 years with a building replacement rate of approximately 1%. Compared to 500 years, the corresponding reference return period of seismic hazard in building codes, such a time delay may be considered as reasonable, at least in moderate seismicity regions. However, it is the current urban-development policies that govern the building replacement rate and consequently the related seismic vulnerability decrease. Real decrease only occurs when a vulnerable existing building is demolished and replaced by a new one adequately designed for seismic action. Due to different reasons (e.g. economical, administrative or demographical) new buildings are however often constructed on free land and do not replace any existing buildings. In such cases, the global seismic vulnerability is only slightly improved since the potential vulnerable existing buildings remain among the building stock.
In regions characterized by a moderate seismicity, such as in Switzerland, a vast majority of existing buildings have been built without appropriate earthquake resistant features. The first adequate seismic requirements in the Swiss building code were only proposed in 1989. The large majority of the Swiss building stock has been built without any seismic considerations. Therefore, retrofitting strategies should be applied to the existing building stock to mitigate the seismic risk. However, as resources are limited a different approach should be used for existing buildings than from new constructions. Since 2004, the Swiss standards propose an approach based on risk (Vogel and Kölz, 2005). According to the SIA 269/8 (2017) building code (SIA 269/8, 2017), the minimal security level is defined in relation to the acceptable individual risk. Seismic retrofitting is mandatory in the case of a compliance factor under a minimal threshold value (minimal security level). For a compliance factor larger than this threshold, an evaluation based on proportionality principles is performed. It allows deciding whether the retrofitting measures are adequate or should be discarded. Such an approach ensures that the limited resources are appropriately allocated with the best impact on seismic vulnerability mitigation. However, considering the replacement of existing buildings by new ones, an alternative and minimalist approach could be proposed: leaving out existing buildings and focusing the efforts on new buildings only. Such an approach may be reasonable only if the actual building replacement rate is large enough.
The issues addressed in this paper are related to the general framework of a more comprehensive research project dealing with the seismic vulnerability of the cities of Sion and Martigny in Switzerland. The seismic vulnerability at urban scale was already assessed for those cities which are the two main cities of the canton of Wallis (Valais). The Risk-UE methodology (e.g. Milutinovic and Trendafiloski, 2003; Risk-UE, 2003; Mouroux and Le Brun, 2006) was applied to both cities, considering the particularities of the Swiss territory in terms of seismicity and the specific features of the Swiss building stock (Lestuzzi et al., 2016; Lestuzzi et al., 2017). The reliability of the results was afterwards further improved by considering typological curves and accurate displacement demand prediction (Rota et al., 2008; Diana et al., 2018; Diana et al., 2021). The investigations were performed using building stock databases from 2015 surveys. The update of the databases for the subsequent 2016–2019 period provided the opportunity to study the building replacements and the related potential seismic vulnerability change. This paper focuses on common residential buildings for which accurate information is available within the considered period.
Features of the investigated cities
The city of Sion is the main city of the canton of Wallis with a population of about 35′000 inhabitants for a total of 3′600 buildings. Martigny is the second largest city with a population of about 20′000 inhabitants for a total of 2′500 buildings. The cities are approximately 30 km distant from each other.
Regarding seismic action, the earthquake hazard in Switzerland may be qualified as moderate compared to southern Europe. The largest peak ground acceleration specified in the building code is 1.6 m/s2 for reference 475-years return period. The most seismically exposed region is located in the South-West part of the country, mainly corresponding to the canton of Wallis. The cities of Sion and Martigny are both in this highest seismic zone of Switzerland, zone Z3b (Figure 1).
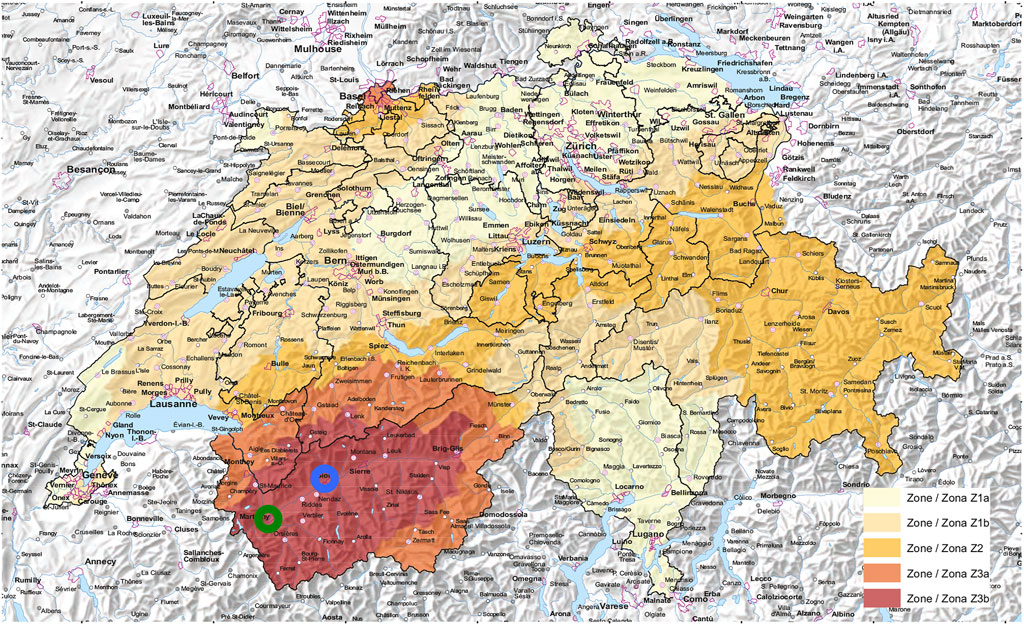
FIGURE 1. The five seismic zones in the Swiss building code (SIA, 2020) and the location of the investigated cities, Sion (blue circle) and Martigny (green circle).
Swiss construction and housing development
The construction and housing data for the country is collected and assessed by the Swiss Federal Statistical Office (FSO). According to FSO, Switzerland numbers around 1.8 million of residential buildings (Table 1). Specifically, 1.765 million was reported for 2020 (OFS, 2021). Over half this number are individual buildings. The construction of new residential buildings reaches annually about 12′000 buildings. The average annual value for the 4-year period from 2016 to 2019 reached 12′080 (OFS, 2021). According to those values, the annual rate for the construction of new residential buildings is about 0.7%. Moreover, about 4′000 buildings are demolished each year. If each demolished building is replaced by a new one, the building replacement rate is about 0.23% per year only. Therefore, the current urban development in Switzerland leads to a global building replacement rate clearly under 1% per year.
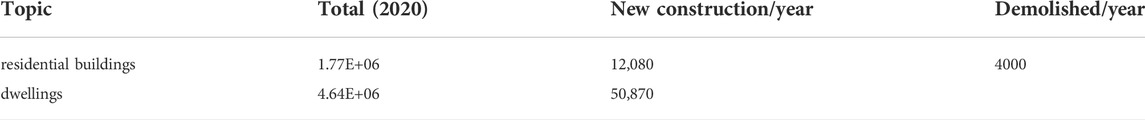
TABLE 1. Overall figures of buildings and dwellings in Switzerland (OFS, 2021). For new construction the values correspond to the average figures for the 4-year period from 2016 to 2019.
The figures indicated above are directly related to the general population development in Switzerland. The population in Switzerland is steadily growing since 1950. According to FSO, the Swiss population reached about 8.67 million inhabitants in 2020 (OFS, 2020). The population has nearly doubled since 1950 and this growing corresponds to an average annual rate of about 1% per year. This rate is larger than the one related to the construction of new residential buildings which is about 0.7% (see section above). However, this value should be compared with the annual rate for construction of new dwellings. According to FSO, Switzerland numbers around 4.64 million dwellings (OFS, 2021). The construction of new dwellings reaches annually about 50′870 dwellings (average annual value for the 4-year period from 2016 to 2019, OFS, 2021). Consequently, the annual rate for construction of new dwellings reaches 1.1% and compares well with the annual population growth rate. Those figures also indicate that the current general trend of urban development in Switzerland is mainly focused on the construction of mid-rise buildings containing several dwellings, which also corresponds to current concerns regarding sustainable development.
The Swiss building stock is mostly composed of low-rise and mid-rise buildings. Masonry and reinforced concrete are the predominant construction materials (Badoux, 2001). Reinforced or confined masonry do not belong to the construction practice and therefore, in Switzerland, masonry buildings are solely unreinforced. The masonry buildings are subdivided into stone-masonry buildings with flexible floors and brick-masonry buildings with rigid floors. Reinforced concrete buildings are essentially shear-wall buildings with low reinforcement ratios (Greifenhagen and Lestuzzi, 2005). A specific feature in Switzerland is the wide spread construction of thick reinforced concrete basements required for atomic shelters.
Building surveys of Sion and Martigny
Within the framework of a comprehensive research project dealing with the seismic vulnerability assessment at urban scale, the building stock of the cities of Sion and Martigny was surveyed to determine their main structural features (Lestuzzi et al., 2016). The main parameters of the building stock (i.e. construction date, number of stories, load-bearing structure, rigid or flexible floors, in-plan and elevation regularities, roof shape) collected during the survey were stored in databases. The field surveys of Sion and Martigny were completed in 2015.
Building stocks
The surveys of Sion and Martigny focused on common residential and administrative buildings. The survey of the city of Sion concerns around 3′200 buildings and the survey of the city of Martigny concerns about 1′600 buildings. Figure 2 shows the distribution for the city of Sion and Figure 3 shows the distribution for the city of Martigny (Lestuzzi et al., 2016).
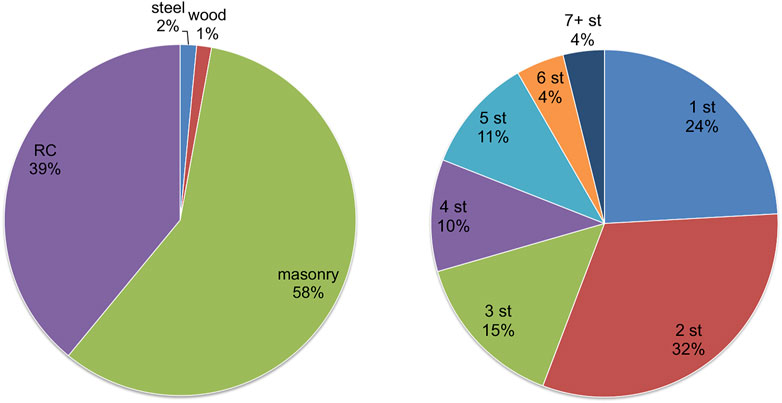
FIGURE 2. Overall distribution of building material (left) and building height (right) for Sion (Lestuzzi et al., 2016)
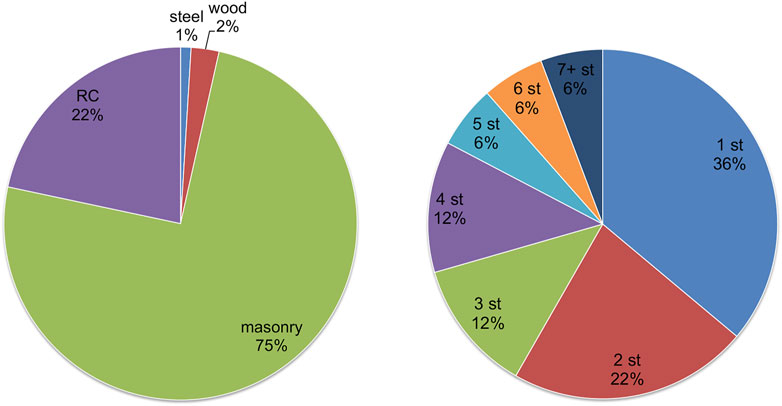
FIGURE 3. Overall distribution of building material (left) and building height (right) for Martigny (Lestuzzi et al., 2016)
Distributions of building types are similar for both cities and correspond well to the usual distribution of typical Swiss cities. Unreinforced-masonry (URM) buildings represent more than half of the building stock. The building stock of Martigny constitutes an upper bound, with URM buildings reaching three quarters of the whole stock. The remaining building stock is composed of reinforced-concrete (RC) buildings, essentially RC shear-wall buildings. The distributions of the number of stories are similar for both cities and correspond to the typical Swiss building stock. Low-rise buildings, up to three stories high, represent 70% of the building stock. Taller buildings, seven stories and over, are uncommon and correspond to less than 6% of the building stock.
Building typology
A specific typology valid for typical Swiss buildings with stiff floors was developed within the framework of the research project dealing with the seismic vulnerability assessment of the cities of Sion and Martigny. The specific typology is based on a detailed survey involving the construction drawings collected in the city archives for a limited number of buildings. Five new building types were defined (Diana et al., 2021): A1, A2, B2, C and D2 (Figure 4). Type A1 corresponds to unreinforced masonry (URM) buildings with a reinforced concrete (RC) basement floor. Type A2 is for buildings with mixed URM-RC along the height. Type B2 is related to buildings with RC pillars in the base floor. Type C is for buildings with RC shear walls and type D2 is for buildings with URM shear walls.
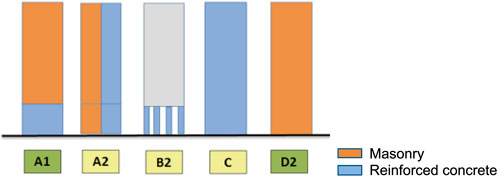
FIGURE 4. Specific typology for typical Swiss buildings (Lestuzzi et al., 2017)
An important part of the building stock of both cities, around 25%, could be characterized by the specific Swiss typology (i.e. 845 buildings for Sion and 391 buildings for Martigny). The related distributions are plotted in Figure 5. The distribution is different for both cities. For Sion types C and A2 are dominant instead type D2 is largely predominant for Martigny (Diana et al., 2021).
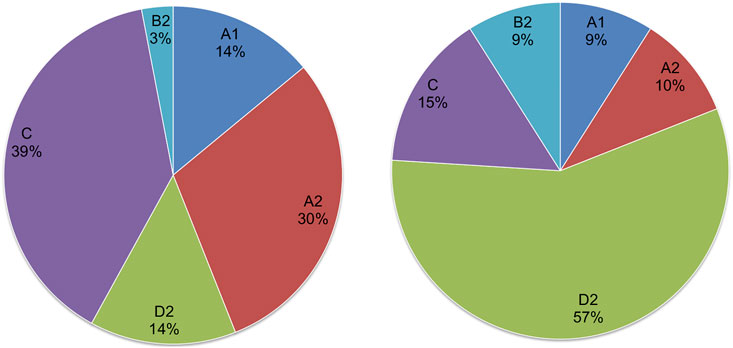
FIGURE 5. Distributions for the 845 buildings of Sion (left) and the 391 buildings of Martigny (right) in the specific Swiss typology (Diana et al., 2021)
New buildings construction for the 2016–2019 period
In Switzerland, construction regulation is specified at the cantonal level. Therefore, building regulation is different from one canton to the other. Since 2004, in the canton of Wallis, the building construction permit is delivered only if an adequate seismic design can be established. The related systematic verification is requested for every building from three stories and over. For low-rise buildings up to two stories, adequate seismic design is mandatory but without specific checking. This distinction is based on the general consideration that mid-rise and relatively high-rise buildings are more seismically vulnerable than low-rise buildings.
The information concerning new building construction for the 2016–2019 period is available in the cantonal archives of Wallis where the requests for building construction permits are stored. Additionally, the information was checked trough a rapid visual survey, to confirm actual construction of the building. In some cases, the project was abandoned after the building construction permit request due, for instance, to an objection procedure. Such an issue may especially arise in case of building replacement.
Building replacements in Sion
The main figures of the recorded building constructions for the city of Sion are summarized in Table 2. During the 2016–2019 period, 116 new building constructions were identified. Considering the total amount of buildings (3′200), the average of 29 new buildings per year corresponds to an annual construction rate of 0.91%. Among the 116 new buildings, only 16 correspond to actual building replacements. The related average number of four building-replacements per year corresponds to an annual replacement rate of about 0.13%.
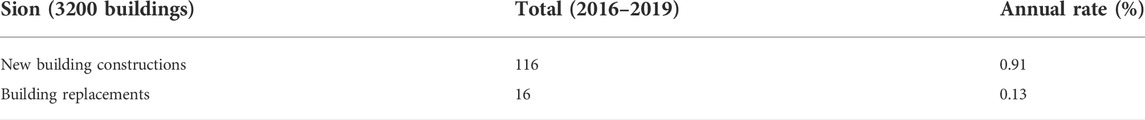
TABLE 2. Building constructions and actual building replacements in Sion.
Selected examples of building replacements in Sion are shown in Figure 6 to Figure 9. Pictures of the demolished buildings could often be extracted from Google Street View. The recorded items contain different replacement configurations. In most cases an isolated building is replaced by a new isolated building (Figures 6, 7). In one case the new building is inserted into the empty space between the two adjacent buildings resulting in a row of three buildings (Figure 8). In a few cases several neighbouring buildings are replaced by a single larger building (Figure 9).
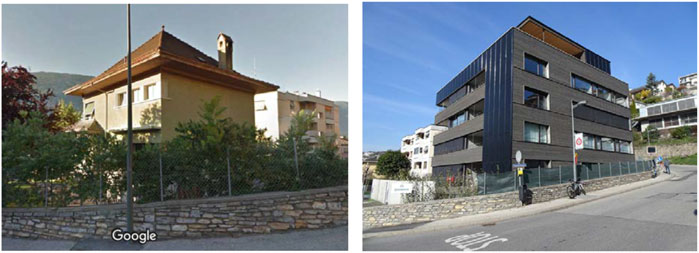
FIGURE 6. Sion, low-rise URM building demolished and replaced by a mid-rise RC building.
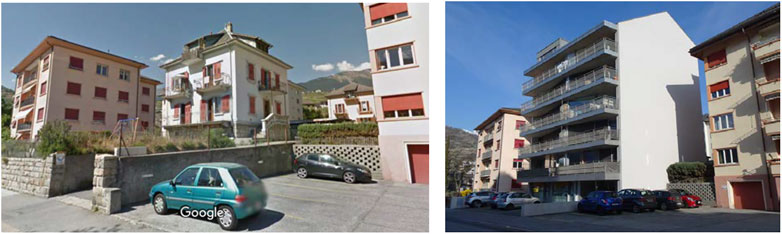
FIGURE 7. Sion, low-rise URM building demolished and replaced by a mid-rise RC building.
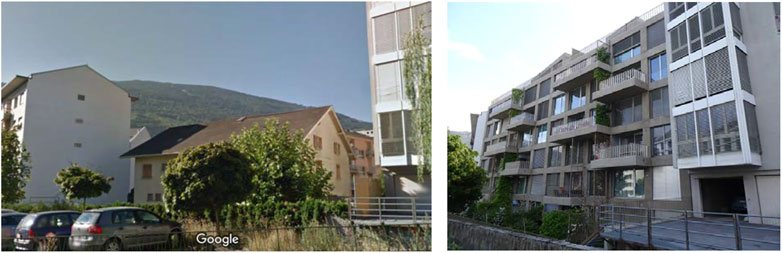
FIGURE 8. Sion, low-rise URM building demolished and replaced by a mid-rise RC building inserted between two adjacent buildings.
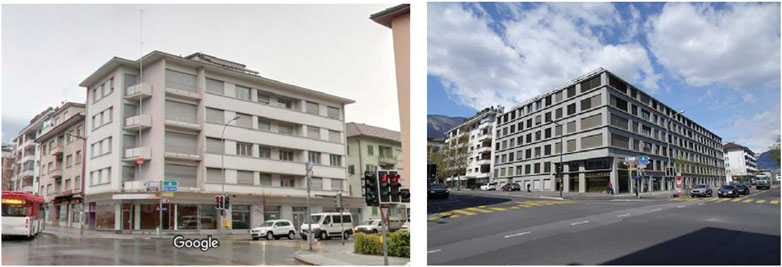
FIGURE 9. Sion, three URM and RC buildings demolished and replaced by a single large mid-rise RC. building with a “U” plan shape.
Building replacements in Martigny
The main figures of the recorded building constructions for the city of Martigny are summarized in Table 3. During the 2016–2019 period, 73 new building constructions were identified for the city of Martigny. Considering the total amount of buildings (1′600), the related average of about 18 new buildings per year corresponds to an annual rate of 1.14%. Among the 73 new buildings, 20 cases correspond to actual building replacements. The related average number of five building replacements per year corresponds to an annual rate of about 0.31%.
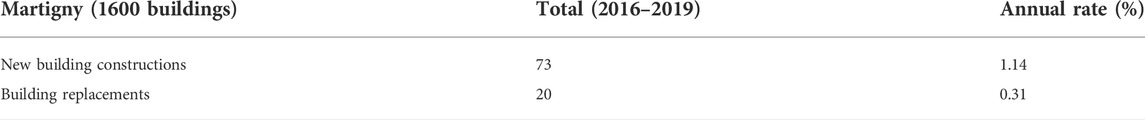
TABLE 3. Building constructions and actual building replacements in Martigny.
Selected examples of building replacements in Martigny are shown in Figures 10–13. Like in Sion, in most cases an isolated building is replaced by a new isolated building (Figures 10, 11). A case in which two URM buildings were demolished and replaced by a complex of two large high-rise RC buildings is shown in (Figure 12). However, compared to Sion there are several cases of duplicate identical mid-rise and high-rise building constructions in Martigny (Figure 13).
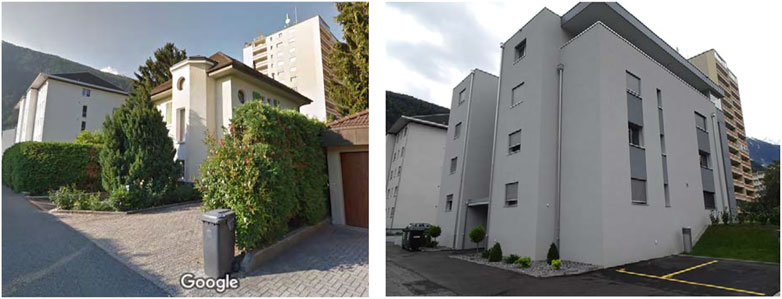
FIGURE 10. Martigny, low-rise URM building demolished and replaced by a mid-rise RC building.
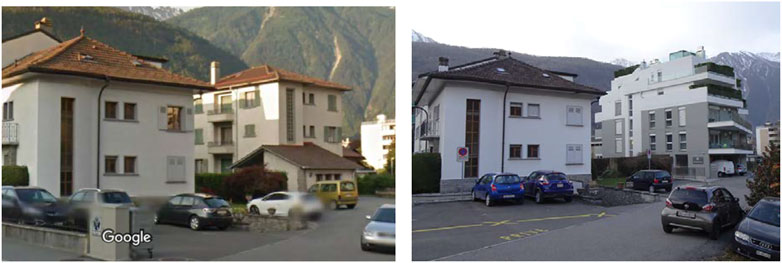
FIGURE 11. Martigny, low-rise URM building (in the background) demolished and replaced by a mid-rise. RC building.
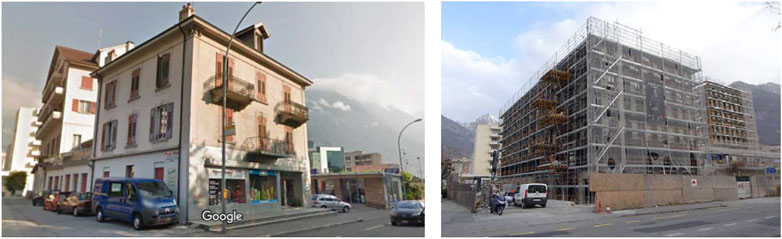
FIGURE 12. Martigny, two URM buildings demolished and replaced by a complex of two large high-rise RC buildings connected at their base by shared parking areas.
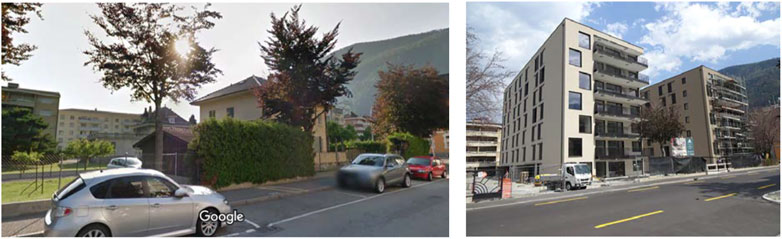
FIGURE 13. Martigny, two low-rise URM buildings demolished and replaced by a group of three identical. mid-rise RC buildings (only two of them are visible on the right picture).
Assessment and findings
The recorded building constructions for the cities of Sion and Martigny during the 2016–2019 period show that the annual rate of new building constructions reached approximately 1% (see Tables 2 and 3). This value is slightly larger than the global one for Switzerland (0.7%, see section 1.2) and should be related to the current dynamic urban development of both cities. However, the actual building replacement annual rate is much lower and ranges from 0.13% for Sion to 0.31% for Martigny (Tables 2 and 3). The corresponding average value almost matches the global rate for Switzerland (0.23%, see section 1.2). Furthermore, ongoing studies on other Swiss cities (Visp (Burjánek, et al., 2012), Lausanne, Yverdon-les-Bains) show very similar trends. The building replacement rate shows large variation, due to specific urban development conditions. However, it remains largely under 1% per year.
The actual building replacements in Sion and Martigny mainly concern the demolition of low-rise URM buildings and their substitution by mid-rise RC buildings. This impacts slightly the building stock distributions of the cities. The proportion of RC buildings increased by 3% for Sion and by 4% for Martigny (Figure 14 to be compared with the left plots of Figures 2, 3). Obviously, the proportion of URM buildings decreased by the same values. Note that all the demolitions are only related to economic issues and not to potential seismic lack.

FIGURE 14. Overall updated distributions of building material for Sion (left) and Martigny (right).
However, from the seismic vulnerability point of view, the demolished buildings do not belong to the most vulnerable ones (Rosti et al., 2018). Consequently, even if the new buildings are all adequately designed for seismic action, the seismic vulnerability at urban scale is not significantly affected. The distribution of the overall updated building stock of both cities into the predicted damage grades (DG) is listed in Table 4. The lowest damage grades are assigned to the new buildings (50% into DG1 and 50% into DG2) because the cantonal construction regulation in Wallis ensures that new buildings fully satisfy the seismic prescriptions according to the latest Swiss standard. The demolished buildings are obviously removed from the data base. However, those buildings correspond to low-rise URM masonry buildings and are therefore essentially related to DG2. Compared to the most reliable results obtained with the original databases (Diana et al., 2021), the update only has a marginal impact on the related percentages. The variations are highlighted in bold in Table 4. The differences do not exceed 1% and are mainly due to the increasing number of buildings and to rounding effects. Compared to the other uncertainties associated to the investigations at the urban scale, such limited variations are not significant and may be neglected.
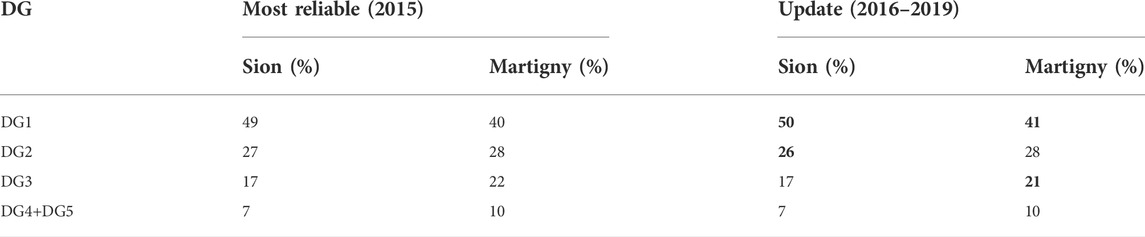
TABLE 4. Distributions of the overall building stocks into the damage grades (DG) for both cities. The update of the databases has a marginal impact (bolded values).
In a few cases, local obvious vulnerability decreases were recorded. This may occur when buildings affected by typical seismic resistance deficiencies are demolished. Figure 15A shows one case in Sion in which a typical soft-story building was demolished and replaced by a RC building with adequate seismic design. By contrast, seismic vulnerability may also be occasionally increased. This is principally the case in which a new building is built against an existing one with a different story level and without an adequate seismic separation joint. Figure 15B shows one of those cases in Sion.
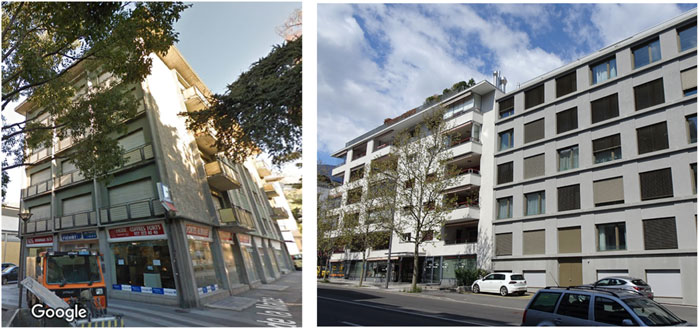
FIGURE 15. Seismic vulnerability may locally be impacted: decreased when a typical soft-story building is demolished (A) or increased when a seismic separation joint is lacking between adjacent buildings with different story levels (B).
Conclusion
The building stock of the cities of Sion and Martigny in Switzerland has been updated since the initial 2015 survey. This survey was performed to assess the seismic vulnerability at the urban scale. The update of the databases for the subsequent 2016–2019 period provided the opportunity to study the building replacements and the related potential seismic vulnerability change. The cases for which an existing building is demolished and replaced by a new one were identified and checked. Those cases do not represent the general practice. The building replacement annual rate ranges from 0.13% for Sion to 0.31% for Martigny and remains largely under 1%. The majority of the new buildings are constructed on free land and do not replace any existing buildings. The potential vulnerable existing buildings remain in the building stock. Moreover, in case of replacement, low-rise unreinforced masonry buildings are generally replaced by mid-rise reinforced concrete shear walls buildings. This issue slightly impacts the building stock distributions, but the seismic vulnerability is not significantly changed since the demolished buildings do not belong to the most vulnerable ones. It should also be pointed out that all the demolitions were only related to economic issues and not to potential seismic lack.
Nevertheless, local obvious vulnerability decreases were recorded. In a few cases, typical soft-story buildings were demolished and replaced by RC buildings with adequate seismic design. By contrast, seismic vulnerability has also been occasionally increased. This occurs when a new building is built against an existing one with a different story number and without an adequate seismic separation joint.
Consequently, at least for the current Swiss construction framework, the current building replacement rate is too low to lead to a significant decrease of the seismic vulnerability at urban scale. Even for moderate seismic hazard conditions such as in Switzerland, retrofitting of existing buildings remains the adequate strategy for seismic vulnerability mitigation in addition to the systematic appropriate seismic design of new buildings.
Data availability statement
The raw data supporting the conclusions of this article may be obtained by request to the authors.
Author contributions
PL wrote the paper, checked the actual building replacements in Sion and Martigny and performed the related statistical analysis. PL achieved the assessment of the seismic vulnerability at the urban scale according to the updated databases.
Funding
Open access funding provided by École Polytechnique Fédérale de Lausanne.
Acknowledgments
The investigations are based on the information available in the cantonal archives provided by the canton of Valais. The cantonal archives survey and the update of the databases were performed by Nicole Widmer and Sarah Voirin during their semester project at EPFL.
Conflict of interest
The author declares that the research was conducted in the absence of any commercial or financial relationships that could be construed as a potential conflict of interest.
Publisher’s note
All claims expressed in this article are solely those of the authors and do not necessarily represent those of their affiliated organizations, or those of the publisher, the editors and the reviewers. Any product that may be evaluated in this article, or claim that may be made by its manufacturer, is not guaranteed or endorsed by the publisher.
References
Acito, M., Magrinelli, E., Milani, G., and Tiberti, S. (2020). Seismic vulnerability of masonry buildings: Numerical insight on damage causes for residential buildings by the 2016 central Italy seismic sequence and evaluation of strengthening techniques. J. Build. Eng. 28, 101081. doi:10.1016/j.jobe.2019.101081
Badoux, M. (2001). Vulnérabilité sismique du bâti existant suisse. IAS Bull. Tech. de Suisse Romande – Société suisse des Ingénieurs des Archit. 12, 222–227. (in French).
Burjánek, J., Donat, F., and Clotaire, M. (2012). Proceedings of the 15th world conference on earthquake engineering.Earthquake damage scenario in visp (Switzerland): From active fault to building damage. Paper No 5472, Lisbon, Portugal, 24-28 September
Diana, L., Lestuzzi, P., Podestà, S., and Luchini, C. (2021). Improved urban seismic vulnerability assessment using typological curves and accurate displacement demand prediction. J. Earthq. Eng. 25 (9), 1709–1731. doi:10.1080/13632469.2019.1597784
Diana, L., Manno, A., Lestuzzi, P., Podestà, S., and Luchini, C. (2018). Impact of displacement demand reliability for seismic vulnerability assessment at an urban scale. Soil Dyn. Earthq. Eng. 112, 35–52. doi:10.1016/j.soildyn.2018.05.002
Greifenhagen, C., and Lestuzzi, P. (2005). Static-cyclic tests on lightly reinforced concrete shear walls. Eng. Struct. 27/11, 1703–1712. doi:10.1016/j.engstruct.2005.06.008
Lestuzzi, P., Podestà, S., Luchini, C., Garofano, A., Kazantzidou-Firtinidou, D., Bozzano, C., et al. (2016). Seismic vulnerability assessment at urban scale for two typical Swiss cities using Risk-UE methodology. Nat. Hazards (Dordr). 84/1, 249–269. doi:10.1007/s11069-016-2420-z
Lestuzzi, P., Podestà, S., Luchini, C., Garofano, A., Kazantzidou-Firtinidou, D., Bozzano, C., et al. (2017). Validation and improvement of Risk-UE LM2 capacity curves for URM buildings with stiff floors and RC shear walls buildings. Bull. Earthq. Eng. 15/3, 1111–1134. doi:10.1007/s10518-016-9981-9
Milutinovic, Z. M., and Trendafiloski, G. S. (2003). An advanced approach for earthquake risk scenarios with applications to different European towns. WP-4: Vulnerability of current buildings. European Commission: Risk-UE Project.
Mouroux, P., and Le Brun, B. (2006). Presentation of RISK-UE project. Bull. Earthq. Eng. 4, 323–339. doi:10.1007/s10518-006-9020-3
OFS, (2021). Construction and housing. Buildings. [Online]. Available: https://www.bfs.admin.ch/bfs/en/home/statistics/construction-housing/buildings.html.Statistical office
OFS, (2020). Population. Switzerland’s population in 2020. FSO number: 1155-2000. Neuchâtel: FSO.Federal statistical office
Risk-UE, (2003). An advanced approach to earthquake risk scenarios with applications to different European towns. Europe: Projet européen. EVK4-CT-2000-00014.
Rosti, A., Rota, M., and Penna, A. (2018). Damage classification and derivation of damage probability matrices from L’Aquila (2009) post-earthquake survey data. Bull. Earthq. Eng. 16, 3687–3720. doi:10.1007/s10518-018-0352-6
Rota, M., Penna, A., and Strobbia, C. L. (2008). Processing Italian damage data to derive typological fragility curves. Soil Dyn. Earthq. Eng. 28, 933–947. doi:10.1016/j.soildyn.2007.10.010
SIA 261 (2020). Swiss standard, Actions on structures. Zurich: Swiss Society of Engineers and Architects SIA.
SIA 269/8 (2017). Swiss standard, Existing structures – Earthquakes. Zurich: Swiss Society of Engineers and Architects SIA. (in French and German).
Keywords: building replacement, seismic-vulnerability assessment, existing structures, seismic risk mitigation, urban seismic risk, seismic retrofitting
Citation: Lestuzzi P (2022) Could building replacements significantly contribute to seismic vulnerability mitigation at urban scale? Case studies of two typical swiss cities. Front. Built Environ. 8:906023. doi: 10.3389/fbuil.2022.906023
Received: 28 March 2022; Accepted: 08 July 2022;
Published: 12 August 2022.
Edited by:
Antonio Formisano, University of Naples Federico II, ItalyReviewed by:
Nicola Chieffo, University of Minho, PortugalGabriele Milani, Politecnico di Milano, Italy
Copyright © 2022 Lestuzzi. This is an open-access article distributed under the terms of the Creative Commons Attribution License (CC BY). The use, distribution or reproduction in other forums is permitted, provided the original author(s) and the copyright owner(s) are credited and that the original publication in this journal is cited, in accordance with accepted academic practice. No use, distribution or reproduction is permitted which does not comply with these terms.
*Correspondence: Pierino Lestuzzi, cGllcmluby5sZXN0dXp6aUBlcGZsLmNo