 Erica C. Fischer
 Amit H. Varma
 James A. Gordon3
- 1School of Civil and Construction Engineering, Oregon State University, Corvallis, OR, United States
- 2Lyles School of Civil Engineering, Purdue University, West Lafayette, IN, United States
- 3School of Civil and Construction Engineering, Oregon State University, Corvallis, OR, United States
Many studies and observations of large building fires show that in large compartments, fires do not burn uniformly. Rather, fires will burn locally and move across a floor plate as fuel is consumed. Currently fire engineering practice assumes uniformly burning fires within a compartment and the fire design methodologies are based upon small compartment fire scenarios. Traveling fire modeling that accounts for fire dynamics is essential for performance-based fire engineering. This paper reviews two traveling fire models presented in literature and implements both models on a steel-frame building. An advanced analysis of the building is performed and the fire performance of the building in these travel fire scenarios are compared to the fire performance of the building when subjected to conventional fire exposure scenarios (full story fires or compartment fires). The authors then illustrate the use of structural fire engineering methodologies to improve the fire resistance of the building.
1 Introduction
Major fires and large-scale compartment fire tests have demonstrated that fire travels throughout a building rather than burning in a limited area for a given period of time. Fire traveled throughout the buildings during fires in the World Trade Centers 1, 2, and 7, Windsor Tower, Faculty of Architecture Building at TU Delft, and One Meridian Plaza. Documentation of these fires demonstrated that not only did the fire travel horizontally across the floor plate, but vertically from floor-to-floor. In addition, the duration of these major fires were well in excess of the time associated with the fire resistance rating (FRR) on each of the structural members. Previous experimental tests of large building fires such as the Cardington Tests (Kirby et al., 1994) and the Dalmarnock Fire Tests (Rein et al., 2007) also demonstrated the traveling nature of fires. These experiments provided the foundation for the traveling fire methodology developed at the University of Edinburgh.
Researchers have developed numerical models to quantify the gas time-temperature curve for traveling fires in a large open-floor plan. Traveling fires do not uniformly heat the structure, and the effects of fire dynamics can have a considerable impact on the performance of the structure in a traveling fire. The final burning location of a fire will experience the longest heating duration due to elevated smoke temperatures, and therefore may be the most critical location. Bailey et al. (1996) used a simplistic representation of a traveling fire, which divided the floor plan into several areas and then subjected each area to a fire time-temperature curve individually and sequentially. This simplified model (Bailey et al., 1996) does not consider the effects of fire dynamics or elevated smoke temperature in a large open-floor plan. Stern-Gottfried and Rein (2012a) developed a numerical model to simulate the gas temperatures of traveling fires in large open-floor plans. This model is adapted from Albert’s correlation (1972) to use far field smoke temperatures and assumes a uniform target temperature in the near field. Dai et al. (2016a), Dai et al. (2016b) further developed a traveling model that considers a smoke layer in compartments away from the fire and uses Hasemi’s localized fire model when the fire is heating the compartment or area directly. However, this traveling fire model is very complex and unrealistic for the use by structural engineering designers. Rackauskaite et al. (2017) further developed the work by Stern-Gottfried and Rein (2012b) to allow for a range of fire sizes. This model accounts for non-uniform temperature distributions within a compartment and long-fire durations that support the observations of real building fires. The research and analysis performed by Rackauskaite et al. (2017) occurred on a two-dimensional (2D) moment-frame that was designed to previous US codes (ASCE 7-02). The extended traveling fire methodology (ETFM) developed by Dai et al. (2016a), Dai et al. (2016b) was further refined by Dai et al. (2020) to include the FIRM zone model that considers smoke accumulation under the ceiling, which can affect gas temperatures within the compartment. In addition, the ETFM considers energy and mass conservation within the modeling framework. Charlier et al. (2021) note that Hasemi’s localized fire model, which the ETFM model, developed by Dai et al. (2016a), Dai et al. (2016b) and Dai et al. (2020), is only applicable if the fire impacts the ceiling. Therefore, Charlier et al. (2021) developed a traveling fire model that has the capability of evaluating the fire geometry and position within the compartment. The model then calculates flame temperature, heat flux, and temperature of steel structural members within the compartment. Gamba and Franssen (2021) implemented a traveling fire model within the software GoZone to analyze large compartments under traveling fire scenarios.
Gernay and Khorasani (2019) used a simplified traveling model similar to the Bailey et al. (1996) fire model to demonstrate the use of multiple fire scenarios in Performance Based Fire Design. The work by Gernay and Khorasani (2019) highlighted the importance of using a three-dimensional (3D) building model to analyze the effects of fire spread and the inherent ductility of steel-frame buildings in fires. Gernay and Khorasani (2019) demonstrated that fire has 3D effects on a structure and the force redistribution occurs through continuity of slab reinforcement and catenary action of the slab. However, Gernay and Khorasani (2019) used simplified approaches to a traveling fire and did not consider the effects of smoke temperatures throughout the compartment.
1.1 Current State of Practice
Current guidelines for structural fire engineering within the US (SFPE 2011; NFPA 2016, LaMalva 2018) only considers fires burning within limited areas bounded by fire-rated construction for a structural design fire. Both NFPA (2016) and SFPE (2011) specify that fire exposures for structural design shall be taken as either the entire floor or a portion of the floor. However, this is contrary to observations from real building fires. In addition, modern-day architecture consists of complex structures and large open-floor plans that fall outside of the limits of traditional methods for quantifying fire exposures, such as the Eurocode (CEN 2002) parametric T-t curve. This particular curve is valid for small fire compartments (<500 m2) only with a maximum compartment length of 4 m (13 ft). The ASCE Manual of Practice (MoP), Structural Fire Engineering, cautions engineers to use conservatism when analyzing a structure for traveling fires. The guidance within these published standards and guidelines are not consistent with the behavior observed during real building fires; therefore, they may underestimate the severity of building fire impacts on structural systems.
1.2 Paper Objectives
The objective of this paper is to demonstrate that traveling fires can have a unique impact on the thermal loading and consequently the structural performance of a building. Over simplifying approximations of traveling fires may underestimate fire intensity leading to unconservative designs. Structural fire engineering approaches can be employed to improve the design and distribution of fire protection leading to adequate performance.
To accomplish this objective, this paper will evaluate the performance of a structure subjected to three different fire exposures to demonstrate the limitations of the guidance provided by NFPA (2016) and SFPE (2011). These three fire exposures will consist of: 1) a full story fire, 2) a simplified traveling fire model per Bailey et al. (1996), and 3) a more complex traveling fire model per Stern-Gottfried and Rein (2012a), which will be referred to as the Travelling Fire Model (TFM). The structural performance will be evaluated, and guidance will be provided for engineers to use structural fire engineering approaches on steel-frame buildings subjected to traveling fires. The primary assumption of this paper is that a traveling fire is plausible within the reference building. The plausibility of a traveling fire versus other fire scenarios is outside of the scope of this study.
2 Design and Modeling of a Ten-Story Office Building
2.1 Structural Design
A ten-story, steel-frame office building located in Chicago, IL was designed using US. building codes and standards (AISC 2016; ASCE 2016; ICC 2021). The building uses perimeter moment-resisting frames (MRF) to resist lateral demands, and wide-flange steel columns along with composite steel beams for the gravity floor framing. The floor systems consist of 75 mm (3 in) metal deck with 65 mm (2.5 in) lightweight concrete on top. This decking system was chosen because it did not need to be shored during construction. In addition, 65 mm (2.5 in) of concrete slab on metal deck provides a 1 h FRR, thereby eliminating the need for additional fire protection on the metal deck. The steel beams are composite with the concrete slab through 12.7 mm (0.5 in) diameter shear studs. The concrete slab is reinforced with welded wire reinforcement 152 mm × 152 mm MW10.
The building is designed using the recommended dead, live, wind, and earthquake loads from (ASCE 2016). The dead and live loads for a typical office building are 3.1 kN/m2 (65 psf) and 2.4 kN/m2 (50 psf), respectively. The perimeter MRFs are designed to resist flexural demands without composite action. All gravity connections within the building are shear-tab connections and all MRF connections are moment connections. At the corner columns, the beams of the MRFs in the east-west direction use pinned connections to eliminate biaxial bending imposed on the corner MRF column. Gravity columns are designed with pinned base conditions. Figure 1 shows the elevation of the gravity framing on grid lines B, C, D, and E and Figure 2 shows the floor framing plan for the fifth story of the building. The details of the horizontal structural framing are summarized in Table 1. All steel beams, girders, and columns are grade ASTM A992 steel.
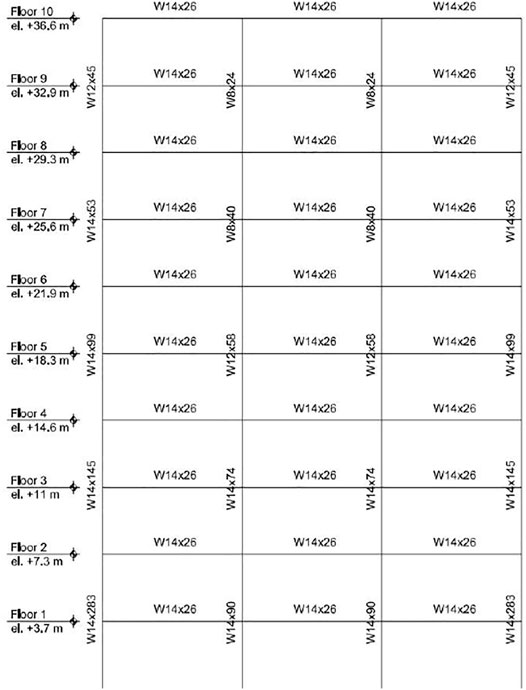
FIGURE 1. Elevation of gravity framing members on grid lines B, C, D, and E.
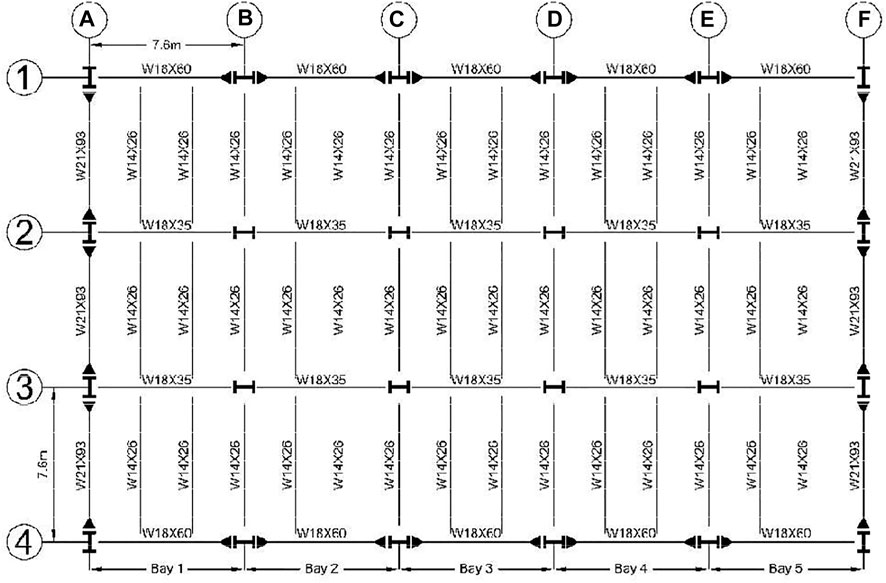
FIGURE 2. Fifth floor framing with beam sizes.
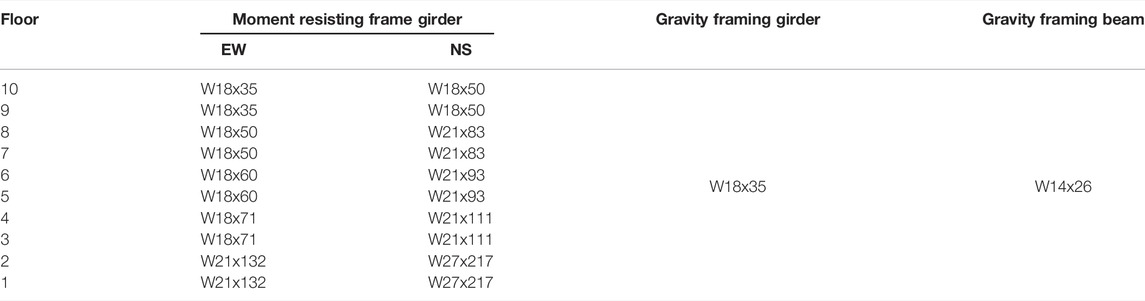
TABLE 1. Summary of framing members.
2.2 Load Combinations
Equation 1 shows the load combination provided by ASCE 7–16 and AISC Specification Appendix 4 for extreme loading conditions. To account for potential imperfections in the structural members, AISC Specification Appendix 4 requires a 0.2% notional load. Each of the floors in the model were assigned the gravity load combination shown in Eq. 1 and each story was offset 0.2% from the story below to account for the imperfections. This load combination also accounts for the imposed loads and effects due to the thermal loading (AT). These effects are inherently considered within the model by simulating the entire building framing system.
2.3 Fire Protection Design
Buildings with businesses are categorized as occupancy (B) and must meet the requirements of Type IB buildings (ICC 2021). These requirements correspond to 2 h FRR on all framing members. However, when a high-rise building’s sprinkler system has control valves equipped with supervisory initiating devices and water-flow initiating devices for each floor, a reduction in FRR of building elements is allowed. The building reduces from a Type IB (primary structural members have 2 h FRR) to Type IIA (primary structural members have 1 h FRR) building. The building discussed within this paper uses 1 h FRR on all structural framing members. The fire protection was Isolatek Type-D C/F Spray-Applied Fire Resistive Material (SFRM). Using the UL Directory: 1) 1 h FRR for the W14x26 floor beams, 15 mm (9/16in) is required; 2) for W18x35 floor beams, 13 mm (1/2in) is required; and 3) for W12x58 columns, 15 mm (9/16in) is required.
2.4 Numerical Modeling Techniques
Each building model simulation contains two parts. The first part is a heat transfer analysis to obtain temperature distributions through the cross-section. The second part is a structural analysis (or stress-based analysis) to model the stability and failure of the structure when subjected to thermal loads. The structural analysis utilizes temperatures from the heat transfer analysis step as thermal load effects, incorporates temperature-dependent material properties, incorporates concrete material models that account for concrete crushing in compression and concrete cracking in tension, incorporates steel material models that account for plasticity, utilizes connection constitutive models that account for nonlinear failure behavior of shear tab connections, and simulates the structural response of a building after initial failure. Abaqus/Standard (2019) is a commercially available finite element modeling (FEM) software that can successfully implement these two sequential steps. This method of heat transfer analysis has been validated by Agarwal et al. (2014a) and Fischer and Varma (2015). The validation of this study is not presented within this paper for brevity. The analysis steps are described more in detail in Fischer et al. (2019).
2.4.1 Material Modeling
Eurocode (CEN 2005a) is used for the temperature-dependent steel material model. This includes temperature-dependent σ-ε relationships for the mechanical and thermal behavior of structural steel. These relationships are used to model the beams, columns, and connections within the building. Eurocode (CEN 2005b) is used for the temperature-dependent lightweight concrete material and thermal properties. The thermal conductivity, mass density, and specific heat of SFRM from AISC Design Guide 19 (Ruddy et al., 2003).
2.4.2 Structural Modeling
The beams and columns in the building are modeled using beam elements (B31) within ABAQUS. The composite deck is modeled using shell (S4R) elements. Wire mesh was embedded as reinforcement within the concrete deck. The shear tab connections were modeled using wire connector elements that simulated the axial force (P) – axial displacement (δ) – moment (M) – rotation (θ) – temperature (T) relationship of the specific geometry of the connection. This relationship is based on the spring model developed by Sarraj (2007) and further refined by Agarwal et al. (2014b). The component model considers failure mechanisms within the connection: bolt shear fracture, bolt bearing on beam web and shear-tab. This model was benchmarked against experimental bolt shear and plate bearing tests (Sarraj 2007; Fischer et al., 2017). A nonlinear gap element spring considers the behavior between the beam bottom flange and the connecting element closing and the potential for beam bottom flange local buckling. More details of the structural modeling techniques are presented in Agarwal and Varma (2014), Agarwal et al. (2014a), and Fischer et al. (2019).
2.4.3 Modeling Limitations
The modeling approach discussed in Sections 3.1–3.3 was performed under the following assumptions and limitations. The composite action between the slab and the beam was modeled using rigid connectors spaced evenly along the length of the beam. This modeling technique does not consider the temperature-dependent force-slip behavior of the shear studs, nor the failure of the shear studs. Selden (2014) showed that composite beams with over 80% composite action had negligible slip, therefore a rigid connection is an appropriate assumption.
Each of the compartments was assumed to consist of a full bay, and only post-flashover fires were considered. Therefore, non-uniform heating of the columns was not considered within the models. The effect of non-uniform heating on the buckling capacity of gravity columns was studied extensively by Agarwal (2011), Agarwal et al. (2014b), and Choe et al. (2016). These studies concluded that only when a column is classified as slender by AISC Specifications Chapter B non-uniform heating of the column will influence the buckling capacity during a fire. All of the columns within the prototype building are classified as non-slender by AISC Specifications Chapter B. Therefore, for simplicity within the modeling, the authors did not consider non-uniform heating of the columns in a traveling fire.
3 Fire Scenarios
The goal of this study is to compare the structural performance of a building subjected to traveling fires with the structural performance of a building subjected to the fire exposures recommended by the current standards (SFPE 2011; NFPA 2016). Each fire case took place on the fifth floor of the building. The fifth floor is representative of a typical story within the building. The gravity column utilization ratio is about 0.46, which is approximately the same as the gravity column utilization ratios on other floors of the building. The fifth floor is also outside of the application of typical firefighting efforts.
3.1 Fire Scenario #1
Fire Scenario #1 is the full story fire. The full story fire T-t was generated using the Eurocode parametric T-t curves (CEN 2002). This fire curve simulates both the heating and cooling portions of the fire. The heating portion of the T-t fire curve was generated using parameters typical to a commercial office building. The opening factor (O) and design fuel load density (qf,d) are 0.032 m1/2 and 570 MJ/m2, respectively. The fuel load density corresponds to the 80th percentile fuel load density for an office building provided by Eurocode (CEN 2002) in Annex E. The gas temperatures experienced in all bays during Fire Scenario #1 are shown in Figure 3. The full story fire is heating from 0 to 62 min. After 62 min, the gas temperatures cool until they return to ambient temperature at 183 min.
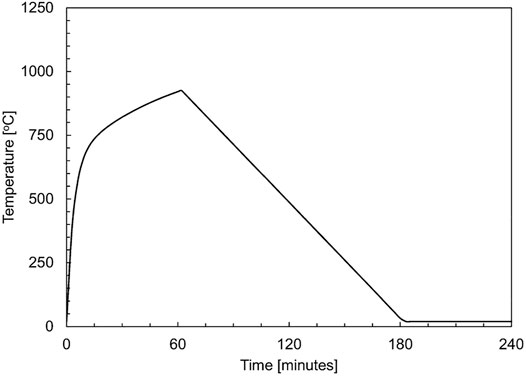
FIGURE 3. Gas temperatures in all bays for Fire Scenario #1.
3.2 Fire Scenario #2
Fire Scenario #2 is represented by the traveling fire model presented by Bailey et al. (1996). In Bailey et al. (1996) a large compartment was divided into smaller design areas and each area was subjected to the same T-t curve individually and sequentially. Using this fire model, a fire in one bay does not influence the gas temperature in the neighbouring bays, therefore, not including the effects of fire dynamics or elevated smoke temperatures into the fire model. The fire was defined by a T-t curve that represented a “natural” fire. When the T-t curve in the first bay reached its peak, the fire in the subsequent bay began, and so on down the length of the building.
For this study, the fire T-t curve developed for the full story fire was used for Fire Scenario #2 as shown in Figure 4A. The fire begins in Bay 1 and moves horizontally to Bay 5. The bay designations are shown on the floor plan in Figure 2. The same design parameters were used (opening factor and fuel load density) as the full-story fire to generate the fire curves shown in Figure 4A. Unlike the fire model described in Bailey et al. (1996), the spread rate (m/s) of the fire in this study was calculated per Stern-Gottfried and Rein (2012a) and assumed to be constant throughout the entire duration of the fire. The spread rate (s) is the length the fire (Lf) divided by the time of the burning of the fire (tb). For the fire models to be compared to one another directly, the spread rate for the two traveling fire scenarios (Fire Scenarios #2 and #3) are the same.
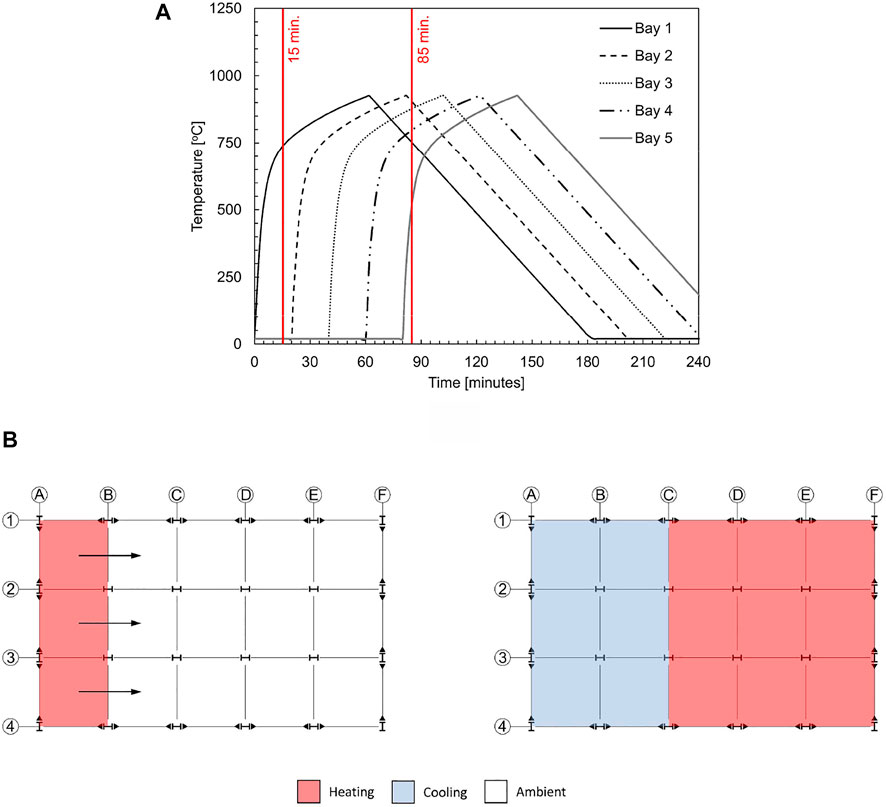
FIGURE 4. (A) Temperature-time curves for Fire Scenario #2 and (B) gas temperature classifications for Fire Scenario #2 at 15 min (left) and 85 min (right).
As the fire moves along the floor plate of the building, the fires start sequentially and independently of one another. The fire in Bay 1 is initiated at a time of 0 min and subsequent bays are heated 20 min after the ignition of their preceding bay. Times of 15 and 85 min are indicated in Figure 4A. As will be discussed in Section 4.2.1, columns D-2 and D-3 fail at 85 min. These times (15 and 85 min) correspond to the visual representation of bay fire phases presented in Figure 4B. At a time of 15 min, Bay 1 is being heated while all other bays remain at ambient temperature (20°C). At a time of 85 min fires in Bay 1 and Bay 2 are in the cooling phase, while fires in all other bays are in the heating phase.
3.3 Fire Scenario #3
Fire Scenario #3 represents the TFM fire. The TFM accounts for the spatial and temporal evolution of the temperature field throughout the floor plate where the traveling fire is occurring (Stern-Gottfried and Rein 2012a; Stern-Gottfried and Rein 2012b). The thermal field is divided into two regions: 1) near field, and 2) far field. The near field is defined where the structural elements are directly heated by the fire itself, and the far field is defined as where the structural elements are heated due to hot combustion gases (e.g., smoke) rather than direct flames.
The TFM assumes a uniform fuel load along the path of the fire and that the fire burns at a constant heat release rate. When the fire is in the near field, the gas temperatures surrounding the elements will be the maximum temperature of the fire. When the fire is in the far field, gas temperatures are calculated using traditional heat transfer and fire dynamic methods.
For the TFM model used within this study, the heat release rate of the fire per unit area was 500 kW/m2. This is a typical heat release rate per unit area for densely furnished spaces. The local burning time of the fire (tb) over area (Af) is calculated as the fuel load density (qf,d) divided by the heat release rate per unit area. The fuel load density used for this building is 570 MJ/m2 (see Section 3.1), and therefore, tb is 19 min.
Typically, for the TFM, near field temperature is 1200°C and the far field temperatures are calculated using typical engineering tools that provide temperature distributions away from the fire. This study used the Albert (1972) model that was developed for ceiling jet correlation. The far field moves with the fire in a quasi-state form. As the fire consumes the available fuel and ignites new material in its path, the fire will move across the floor plate. The gas temperature next to any of the structural members will change as the fire travels both closer and further away from the member.
To implement the far field model, the floor is discretized into nodes with a fixed width of Δx. Each node has a single far field temperature at a given time. The more nodes that are used, the more refined the far field temperature is. Figure 5A shows the T-t curves for the gas temperatures in each of the bays. These curves look quite different from the curves shown in Figure 4A for Fire Scenario #2. Figure 5B shows the floor plate at times of 15 and 74 min. As will be discussed in Section 4.3.1, columns D-2 and D-3 fail at 74 min. These times (15 and 74 min) correspond to the visual representation of bay fire phases presented in Figure 5B.
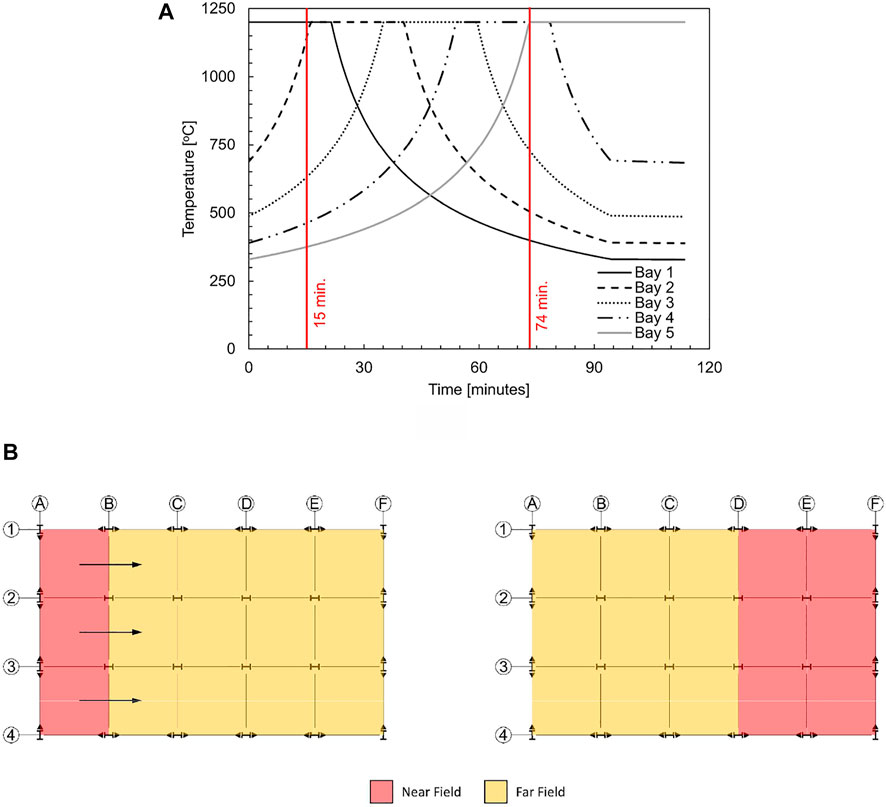
FIGURE 5. (A) Temperature-time curves for Fire Scenario #3 and (B) gas temperature classifications for Fire Scenario #2 at 15 min (left) and 74 min (right).
At time of 15 min, the gas temperature is in the near field in Bay 1 and the gas temperature equals the maximum temperature of the fire (1,200°C). At this time (15 min), due to fire dynamics and elevated smoke temperature, the gas temperature in Bay 5 is 375°C. In contrast, at time of 15 min for Fire Scenario #2, the temperature in Bays 2–5 is ambient temperature (20°C) and Bay 5 remains at this temperature until about 80 min after the fire ignites in Bay 1. At a time of 74 min in the TFM fire, Bay 4 and Bay 5 are in the near field and all other bays are in the far field.
4 Analysis Results
The results of the analyses presented in this section are for three different fire scenarios discussed in Section 3. In all fire scenarios, the gravity columns were the first structural framing member to fail; however, the time and temperature at which the failure occurred differed based on the fire scenario. In this study, failure is defined as loss of load carrying capacity. For gravity columns the time of failure is defined as the time when 90% of the required load carrying capacity is lost. After gravity column failure, force redistribution is dependent on the capacity of the floor framing. The capacities of the simple connections are calculated as function of temperature in accordance with AISC (2016).
4.1 Fire Scenario #1: Full Story Fire
4.1.1 Behavior of Gravity Columns
All gravity columns supporting the fifth floor buckle at 82.5 min of the full story fire. Since all gravity columns fail at the same time, load redistribution to the surrounding MRF columns is not possible and the building collapses. The gravity column temperature at failure is 564°C. At this temperature, steel retains 43% of its ambient yield stress (Fy) and 59% of its ambient stiffness (E) (AISC 2016). Figure 6 shows the axial force (P-t) and temperature histories (T-t) of the gravity columns. This plot shows that the gravity columns lose their load carrying capacity at approximately 82.5 min.
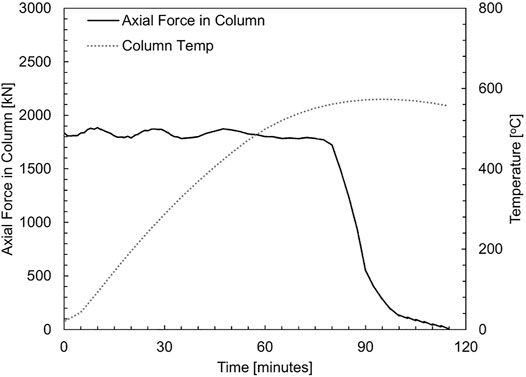
FIGURE 6. Axial load history and temperature history for gravity columns.
4.1.2 Behavior of Simple Connections
As the beams and girders are heated by the full story fire they expand and large compressive forces develop in the ends of the beams and girders. When the gravity columns buckle, they displace downwards, inducing tension into the beams and girders connected to the gravity columns. The tensile and compressive loads resulting from heating and column failure are transferred through the beam and girder connections. The shear tab connections in the floor framing system are not designed to withstand these large axial forces.
Axial force histories for the girders and beams spanning between MRF and gravity columns are presented in Figure 7A and the corresponding temperatures histories for the fifth floor beams and girders are presented in Figure 8. The black and grey solid lines in Figure 7A represent the axial forces transferred through beams and girders on the fifth floor while black and grey dashed lines represent the axial forces transferred through the sixth floor beams and girders. To compare the axial force demands on the shear tab connections to connection capacities, the fifth floor connection capacities, calculated per AISC Specification Chapter J and Appendix 4 (AISC 2016), are also presented in Figure 7A by red lines. Between times of 40 and 72.5 min, large compressive forces develop in the fifth-floor beams and girders as they are directly heated by the full story fire. The compressive forces shown in Figure 7 are transferred through the shear tab connections and at times of 57.5 and 47.5 min, the connections attaching the beams and girders, respectively, on the fifth floor to the gravity columns exceed their bolt shear capacity. At times of 110 and 107 min there is a sudden loss of axial force in the beams and girders on the fifth floor, signifying a loss of load carrying capacity and connection failure.
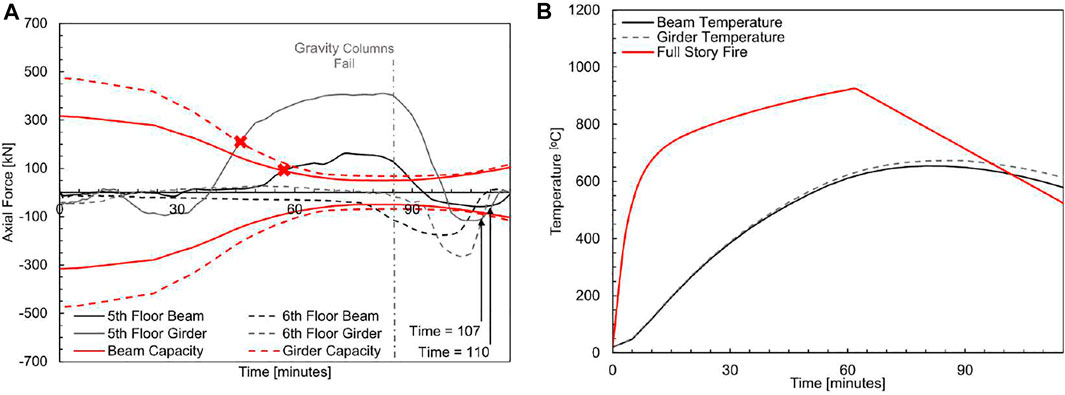
FIGURE 7. (A) Axial force histories for beams and girders and (B) temperature histories of beams and girders in Fire Scenario #1.
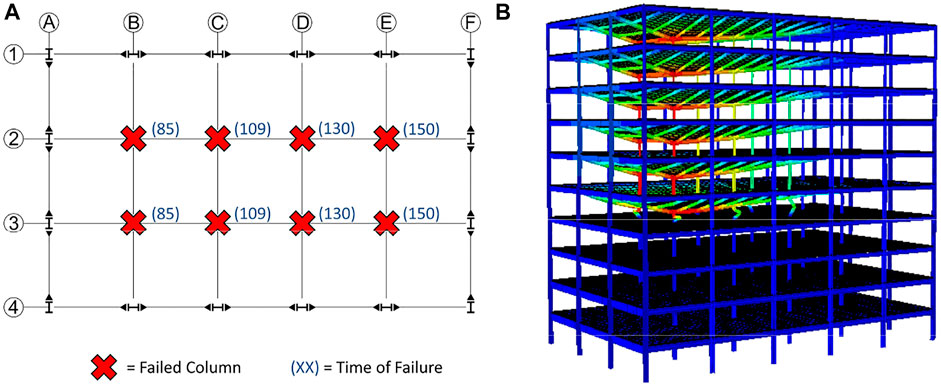
FIGURE 8. (A) Column failure summary for Fire Scenario #2 (B) the deformed shape of the structure at 150 min.
The beam-to-column and girder-to-column connections on the sixth floor do not exceed their axial compressive capacities because they are not directly heated by the fire and therefore do not expand significantly. However, large tensile forces develop in the sixth-story beams and girders after the gravity columns fail and begin to displace downwards at a time of 85 min. The sixth-story beam and girder tensile forces shown in Figure 7 (black and grey dashed lines) are transferred through the connections attaching the beams and girders to the gravity columns. At times of 102 and 105 min there is a sudden loss of axial force in the sixth floor beams and girders, respectively, signifying a loss of load carrying capacity and connection failure. This failure indicates that buckling and failure of the fifth story columns causes complete building collapse.
4.2 Fire Scenario #2: Simplified Traveling Fire
4.2.1 Behavior of Gravity Columns
When the fifth floor is subjected to a traveling fire using Fire Scenario #2, the gravity columns fail sequentially from grid line B to grid line E as the fire moves sequentially from Bay 1 to Bay 5. The times of the gravity column failures are shown pictorially in Figure 8A.
The axial force histories in Figure 9 (black lines) show the system level behavior of the building subject to Fire Scenario #2 and the temperature histories in Figure 9 (faded red lines) highlight the correlation between the sequential heating of the columns and the column failure sequence. The gravity columns had an axial load of approximately 1850 kN from a time of 0–80 min. After a time of 81 min, the magnitude of axial forces in gravity columns on grid line B begin to decrease. At 85 min, there is inelastic buckling of the columns on grid line B. Load redistribution from columns on grid line B to columns on grid line C is represented in Figure 9 by an increase of axial force (2.5% of the columns required load carrying capacity) in column C-2 between times of 98 and 107 min. The columns on grid line C fail at 109 min. Load is redistributed from failed columns on grid line C to gravity columns on grid line D from 118 to 127 min. The gravity columns on grid line D then fail at 130 min. After the gravity columns on grid line D fail at 130 min load is redistributed from failed columns on grid line D to gravity columns on grid line E from 139 to 148 min. The gravity columns on grid line E fail at 150 min and the deformed shape at this time is shown in Figure 8B.
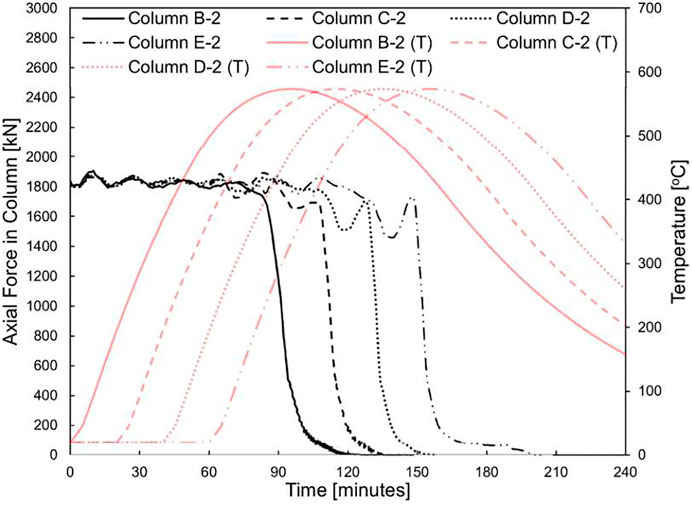
FIGURE 9. Axial force history of gravity columns in Fire Scenario #2.
As gravity columns fail, load is redistributed to the gravity columns in the next bay and MRF columns along the perimeter of the building. Load redistribution is accomplished through the horizontal floor framing and is reliant on the performance of the beams, girders, concrete deck, and connections. Similar to the load redistribution to adjacent gravity columns presented in Figure 9, load redistribution to perimeter columns is seen through the change of axial force transferred through the perimeter columns. Figure 10 presents the change in the axial forces in all sixteen perimeter columns, normalized by the initial load carried by all eight gravity columns. The total load transferred from the failed gravity columns to the MRF columns (taken at a time of 240 min) is less than 20% of the load initially carried by all eight gravity columns. Because only a small portion of gravity load is transferred from the gravity columns to the MRF columns, the building is unstable and collapses with the failure of gravity columns.
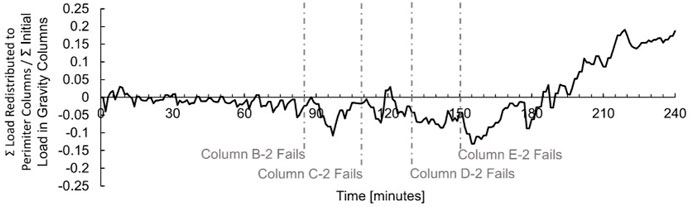
FIGURE 10. The sum of force redistributed to the perimeter columns normalized by the initial load carried by all eight gravity columns in Fire Scenario #2.
4.2.2 Behavior of Simple Connections
The column axial force history for Fire Scenario #2 shows that the columns fail sequentially along the floor plan of the building, and the connection rotation history and beam axial force history demonstrate similar behavior for the horizontal floor framing. The axial force demands in each connection depends on the heating scenario and column buckling. To compare the axial force demands on the shear tab connections to connection capacities, Figures 11A,B present the axial force histories (in black and grey lines) at the ends of floor framing elements attached to column C-2 and their connection capacities (in red lines) calculated per AISC Specification Chapter J and Appendix 4 (AISC 2016). The point at which beam and girder axial forces exceed connection capacities is highlighted in Figures 11A,B with a red “x”. The naming convention of the beams and girders in Figure 11 is shown in the pictorial presentation of the behavior of framing elements around column C-2 given in Figure 12. Beam 1 and Beam 2 are heated with Bay 3 and have similar behavior to the other beams in those bays. Connection capacities shown in Figures 11A,B consider bolt shear, bolt bearing on the shear tab and bolt bearing on the beam and girder webs. The serviceability limit state of excessive bolt hole deformation was not considered because it does not indicate loss of load bearing capacity for the connection. If this limit state was to be considered the beams would exceed that criteria due to tensile load before exceeding limit states due to compressive force.
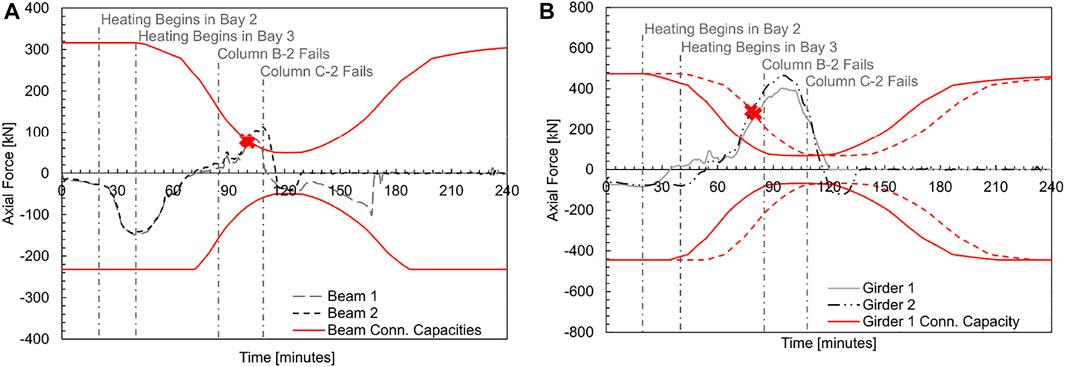
FIGURE 11. Axial force histories and connection capacities for (A) beams and (B) girders connecting to column C-2 for Fire Scenario #2.
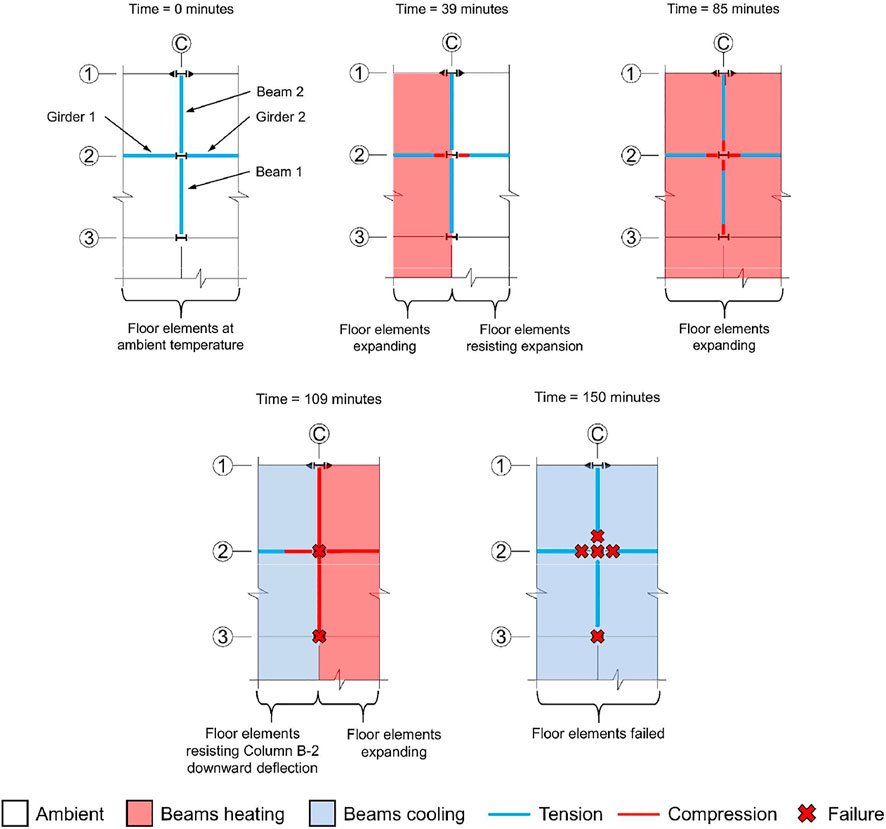
FIGURE 12. Axial force behavior for floor framing elements around column C-2 in Fire Scenario #2.
Before Fire Scenario #2 begins, all floor framing elements are in tension. Before the beams on grid line C are heated, the beams in the preceding bay (Bay 2) are heated and expand. The secondary beams in the unheated bay (Bay 3) resists this expansion and subsequently, there is an increase in tensile load in the beams. The increase in tensile load in Beams 1 and 2 is shown in Figure 11A as a large decrease in axial load between times of 20 and 40 min. The maximum tensile force in beams on grid line C is approximately 148 kN and occurs at a time of 39 min. The connection does not fail at this time (39 min) because the connection capacity is about the same as the ambient connection capacity. The behavior of floor framing elements at 39 min is shown pictorially in Figure 12. When heating begins in Bay 3 at a time of 40 min, compressive forces develop at the ends of the beams in Bay 3 and propagate inward as the beams expands. Figures 11A,B show the expansion of the beams and girders as an increase of axial force starting at a time of 40 min.
At times of 102 and 100 min, the forces at the ends of Beams 1 and 2, respectively, exceed the beam-to-column connection bolt shear capacity calculated per AISC Specification (AISC 2016). Although the connections have exceeded their calculated capacities, they do not fail and the compressive force continues to increase in the floor framing elements. The maximum compressive forces in Beams 1 and 2 are 113 and 81 kN at times of 108 and 105 min when the beams are 637 and 630°C, respectively.
Before the beams reach their maximum temperature, column C-2 fails at 109 min. At this time (109 min), Figure 12 shows that there are compressive forces at the ends of all floor elements framing into the column and the secondary beams in Bay 2 are resisting the downward deflection of Column B-2. After Column C-2 buckles, the floor framing elements attached to it resist the downward column deflection and tensile forces are quickly developed in the beams and girders. As Column C-2 continues to deflect downward, the floor framing connections fail due to the imposed tensile loading. This failure is shown in Figure 11 as a loss of axial load.
The girder-to-column connections on the fifth floor behave similarly to the secondary beam connections but do not develop significant tensile force at the beginning of the fire scenario. Figure 11B shows that between times of 20 and 40 min, when Bay 2 is being heated, there is little increase of the axial force in the girders. While the expansion of beams on the fifth floor is largely resisted by beams in the adjacent bay, the expansion of girders is largely resisted by the girders on the floors above and below the fifth floor. When heating begins in Bays 1 and 2 (times of 20 and 40 min), compressive forces develop in the girders in those bays. As highlighted by the red “x” in Figure 11, Girder 1 and Girder 2 connections exceed their calculated bolt shear capacities at times of 74 and 79 min.
When Column B-2 fails at a time of 85 min, the floor elements in Bays 2 and 3 are expanding and the ends of the beams and girders are in compression as shown in Figure 12. After Column B-2 fails (at a time of 85 min), the increase in compressive force begins to lessen as Girder 1 is pulled into tension by the downward deflection of Column B-2 (see Figure 11). The maximum compressive forces in Girders 1 and 2 both occur at 95 min and were 404 and 466 kN, respectively. The axial force in the girders continues to decrease as Column C-2 fails at 109 min. At a time of 137 min both girders failed in tension.
The impact of the gas time-temperature curves on the structural response and behaviour is most clearly seen in the axial force histories of the beams spanning between MRF and gravity columns on grid lines B, C, D and E (Figure 13). These axial force histories (in Figure 13) show that the times of maximum tensile and compressive loading in the beams are offset by approximately 20 min, corresponding to the travel time of the fire.
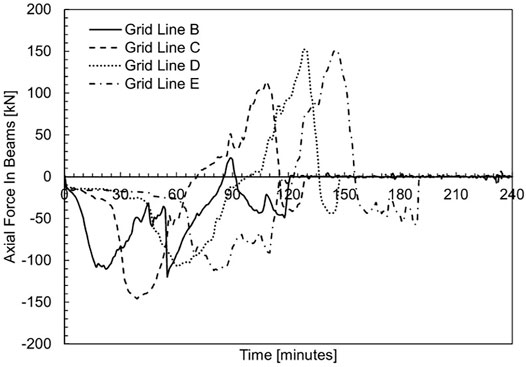
FIGURE 13. Axial force histories of secondary beams spanning between MRF and gravity columns in Fire Scenario #2.
The connections fail sequentially along the floor plan of the building. The axial forces on grid lines D and E are similar to the axial force histories described previously for the beam on grid line C. Unlike the axial force histories for beams on grid lines C, D, and E, the axial force in the beam on grid line B suddenly decreases, at a time of 55 min, during heating. This sudden increase in tensile demand in the beams on grid line B occurs due to sudden expansion of the beams in Bay 3 at a time of 55 min. After a time of 55 min, the beam on grid line B continues to expand and develop compressive axial force demands.
The maximum tensile force in the beams on grid lines B, C, D, and E occurred in the beam on grid line C with a magnitude of 145 kN when the beam was at ambient temperature. The maximum compressive force in the beams on grid lines B, C, D, and E occurred in the beams on grid line D with a magnitude of 152 kN when the beam was 638°C.
4.3 Fire Scenario #3: TFM Fire
4.3.1 Behavior of Gravity Columns
When the fifth floor is subjected to Fire Scenario #3 (TFM fire), the gravity columns on grid line D buckle first, followed by the gravity columns on grid line E, and then grid line C, which ultimately causes the collapse of the building. The order of column failure is shown pictorially in Figure 14A and the axial force histories in Figure 15 show the system level behavior of the building subject to Fire Scenario #3. The temperature histories of the gravity columns are also presented in Figure 15 (with faded red lines) to highlight the effects of the TFM fire model on column behavior and failure sequence. At a time of 70 min, the axial forces in Columns D-2 and E-2 begin to decrease until they fail at times of 74 and 85 min, respectively. After column E-2 fails, at a time of 85 min, the axial force histories in Figure 15 show an increase of axial force in column C-2, signifying load redistribution from the failed columns. At a time of 102 min, the axial force in Column C-2 begins to rapidly decrease signifying the initiation of column buckling. At a time of 106 min, Column C-2 fails. The deformed shape at the time of Column C-2 failure (106 min) is shown in Figure 14B. As Column C-2 continues to lose load bearing capacity after their time of failure (106 min), load is redistributed to gravity columns on grid line B and the MRF columns starting at a time of 115 min. Load redistribution from the failed gravity columns (on grid line C) to the gravity columns on grid line B is represented graphically in Figure 15 as an increase in axial load in Column B-2 beginning at a time of 115 min.
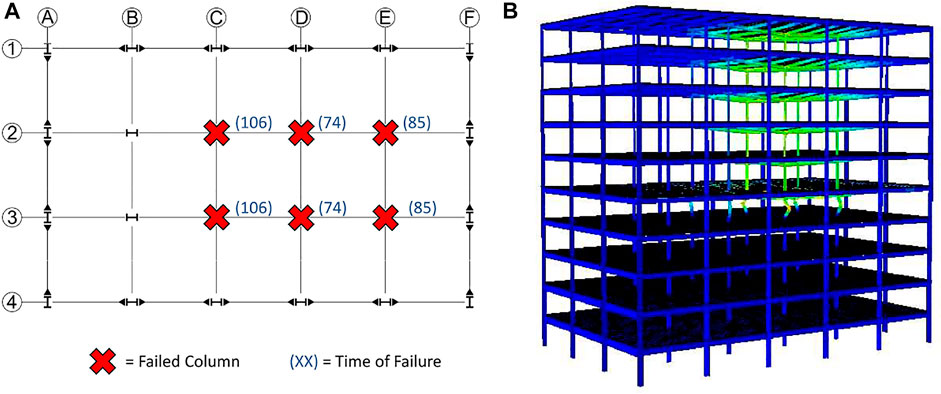
FIGURE 14. (A) Column failure summary for Fire Scenario #3 and (B) the deformed shape of the structure at 150 min.
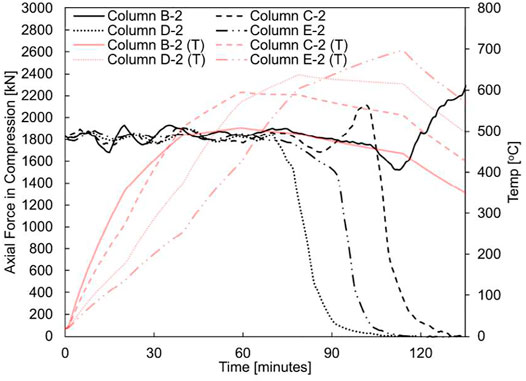
FIGURE 15. Axial force history of gravity columns in Fire Scenario #3.
Unlike when the floor was subjected to Fire Scenario #2, when the floor is subjected to Fire Scenario #3 the gravity columns do not fail sequentially with the path of the traveling fire. In Fire Scenario #3 the gravity columns exposed to the near field first (columns on grid line B) did not fail. After the gravity columns on grid lines C, D, and E buckle, the building becomes unstable and collapses.
4.3.2 Behavior of Simple Connections
Beam-to-column and girder-to-column connection rotations increase in all bays when the fire begins in Bay 1. The temperature of the beams in all bays increases with increasing gas temperatures (either near field or far field).
To compare the axial force demands on the shear tab connections to their connection capacities, Figures 16A,B present the axial force and calculated connection capacities of the beams and girders framing into Column C-2. These axial force histories in Figures 16A,B are similar to those presented in Figures 11A,B for Fire Scenario #2. The main differences between Figure 16 and Figure 11 are the times at which axial forces exceed the connection capacities and the magnitude of maximum compressive forces. The location of the floor framing elements named in Figure 16B are shown in Figure 12. Beam-to-column connections for Beams 1 and 2 both exceed their calculated bolt shear capacities at time of 53 min and a maximum compressive force of 108 kN. Girder 1 and Girder 2 exceed their calculated bolt shear capacities at times of 34 and 35 min with axial forces of 196 and 285 kN, respectively. The maximum compressive forces in Beams 1 and 2 are 158 and 183 kN and the maximum compressive forces in Girders 1 and 2 are 465 and 500 kN.
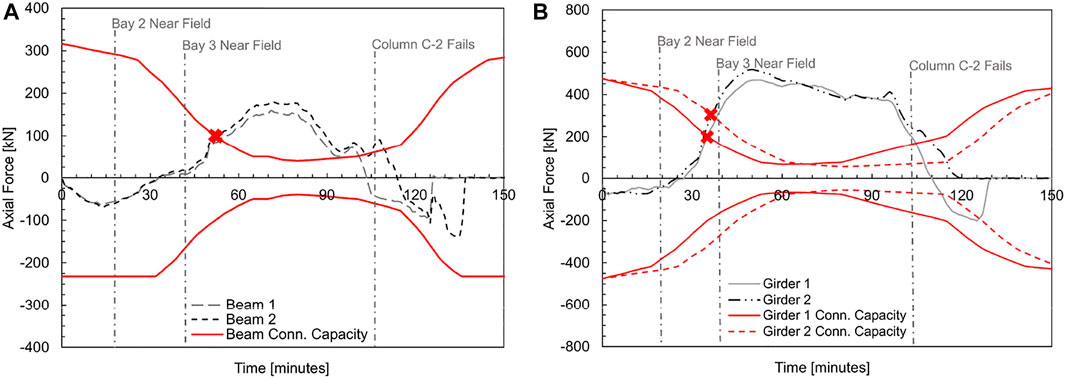
FIGURE 16. Axial force histories and connection capacities for (A) beams and (B) girders connecting to column C-2 for Fire Scenario #3.
The axial force histories of the beams that span between gravity columns and MRF columns on grid lines B, C, D and E are shown in Figure 17. The axial forces for the beams subjected to the TFM are similar to the beam axial force histories presented in Section 4.2.2. At a time of 0 min, the gas temperatures are highest in Bay 1 because it is in the near field. At this time (0 min), all other bays are in the far field. The near field heating in Bay 1 at a time of 0 min causes the beams in Bay 1 to expand more than all other bays. Initially, the beams in Bays 2–5 resist the expansion of beams in Bay 1. Large tensile forces develop in the beams in Bay 3 as they resist expansion in Bays 1 and 2. The tensile forces for beams on grid lines B, C, D and E are shown in Figure 17 as a negative axial force in each beam starting at a time of 0 min. The tensile forces developed in the beams in Bays 2, 4, and 5, due to the resistance of expansion in adjacent bays, are significantly less than the tensile forces developed in the corresponding beams subjected to Fire Scenario #2. The maximum tensile force in the beam on grid line C (Bay 3) is 180 kN which is approximately 18% greater than the maximum tensile force developed in the secondary beams presented in Section 4.2.2 for Fire Scenario #2.
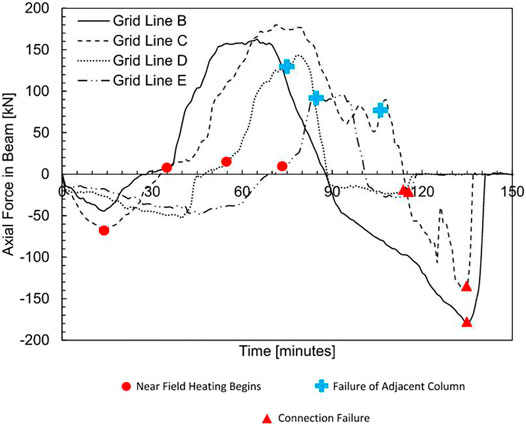
FIGURE 17. Axial force histories of secondary beams spanning between MRF and gravity columns in Fire Scenario #3.
As shown in Figure 17, as the fire moves across the floor plan of the building the axial force in the beams increase sequentially starting with the beams on grid line B. When each beam is heated in the near field (highlighted with a red dot in Figure 17) the axial force in the beam begins to increase at a much greater rate. Because Column B-2 does not fail and the beam on grid line C reaches a maximum compressive force before Column C-2 fails (highlighted with a blue cross in Figure 17), the compressive axial forces in beams on grid lines B and C are not limited by column failure, as they were in Fire Scenario #2. Instead, maximum compressive forces in the beam-to-column connections on grid lines B and C are dependent on the maximum temperatures of the beams. The maximum compression force in the beams on grid lines B and C occur at times of 61 and 71 min, respectively. At a time of 61 min, the compression force in the beams on grid line B is 164 kN at a temperature of 666°C. At a time of 79 min, the compression force in the beams on grid line C is 180 kN at a temperature of 696°C.
As the beams on grid line B cool, tensile forces develop within the beam. At a time of approximately 115 min, load is redistributed from the portions of the fifth floor located above the failing gravity columns to the beams on grid line B. Load redistribution to the beams on grid line B can be seen in Figure 17 as a sudden increase in the rate of axial force decrease at a time of 115 min. This time (115 min) also corresponds to the time when load redistribution is initiated from the failed gravity columns to the gravity columns on grid line B as discussed in the previous section. At a time of 135 min, the connection of column B-2 and the beam on grid line B is subject to a maximum tensile force of 181 kN and at a time of 135 min the beam-to-column connection on grid line B fails in tension. The failure of the beams on grid line B is highlighted with a red triangle in Figure 16 at a time of 138 min, after which there is a sudden loss of load.
Unlike the axial forces of beams on grid lines B and C, the maximum compressive forces in the beams on grid lines D and E are limited by gravity column failure. While the beams on grid line D and E are heating columns D-2 and E-2 fail. When columns D-2 and E-2 fail, at times of 74 and 85 min, respectively, they deflect downwards, causing tensile demands in the beams. As the tensile demand in beams on grid line D and E increases, their connections fail and load is no longer transferred through the beams.
4.3.3 Behavior of Gravity Beams
As shown in Figure 18, the behavior of the beams on Grid Lines D and E exceeded the BS 476 (BS 1987) deflection limits, represented by the dashed red line, for floors exposed to fire conditions indicating runaway deflection of the floors. The beams on Grid Line B behaved elastically recovering 23% of the deflection of the beams after 2 h of the traveling fire exposure on the floor plate. The beams on Grid Line C begin to recover the deflection; however, due to the failure of the column adjacent to the beam, the deflection is not recovered, and the beam continues to deflect downward.
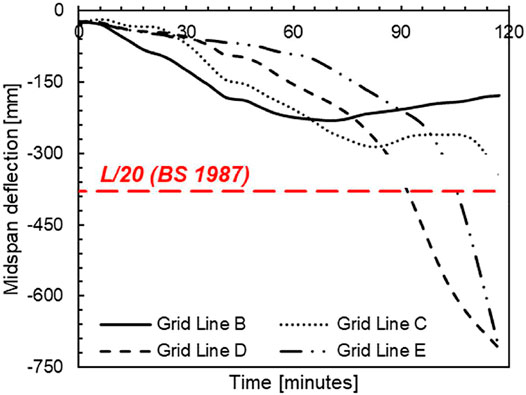
FIGURE 18. Midspan deflection histories of secondary beams spanning between MRF and gravity columns in Fire Scenario #3.
5 Structural Fire Engineering
The previous section describes the behavior of a steel-frame building subjected to three different fire exposures. The building was designed using prescriptive fire protection design (ICC 2021) and corresponds to a 1 h FRR on all the structural components (columns, girders, and floor beam). The governing failure of the building was inelastic buckling of the gravity columns in each fire scenario. This governing failure corresponds to the same failure mode observed in compartment fires (Fischer et al., 2019). Following column failure, the shear tab connections failed due to the effects of heating and column failure. These shear tab connections were essential to force redistribution after column failure.
Structural Fire Engineering consists of designing the structural components and frames of a building to maintain their load carrying capacity and satisfy other performance objectives specified for building occupancy during a fire event (AISC 2016). To ensure that structural elements maintain their load carrying capacity and improve the fire performance of a building beyond the prescriptive code-based performance, the capacity of the structural elements must increase. This increase in capacity can occur in one of two ways: 1) the size of the member can increase, or 2) the thickness of fire protection can increase, thereby limiting the temperature of the members and increasing the FRR. This section will take the second approach to structural fire engineering on the building when subjected to Fire Scenario #3 (TFM model) to improve the fire resistance of the steel building when subjected to a traveling fire by increasing the thickness of fire protection design on the gravity columns to an equivalent thickness of 2 h FRR.
5.1 Structural Fire Engineering Results
Inelastic column buckling was not observed in the SFE model. Because the gravity columns did not fail, building collapse was prevented. Additionally, beam-to-column and girder-to-column connection performances were not dependent on column buckling but instead were only dependent on the heating scenario. To compare the axial force demands in the simple connections to their calculated capacities, Figure 19 shows the axial force histories and connection capacities for the floor framing elements connected to Column C-2. The axial forces in Figure 19 (SFE model) are very similar to those shown in Figure 16 (base model) for the corresponding framing elements. Beam-to-column connections on grid line C exceed their calculated bolt shear capacity at a time of 60 min (highlighted by a red “x” in Figure 16). For comparison, when columns were protected with 1 h FRR, the same connections exceeded their calculated bolt shear capacity at 53 min. Similarly, the girder-to-column connections exceed their calculated bolt shear capacity at times of 35 and 37 min which is the same time at which the same connections exceed their calculated capacity in the base model. The time at which connections exceed their calculated connection capacity is not dependent on column buckling because exceedance in both TFM models occurs during the heating phase of the beam, before any columns have buckled.
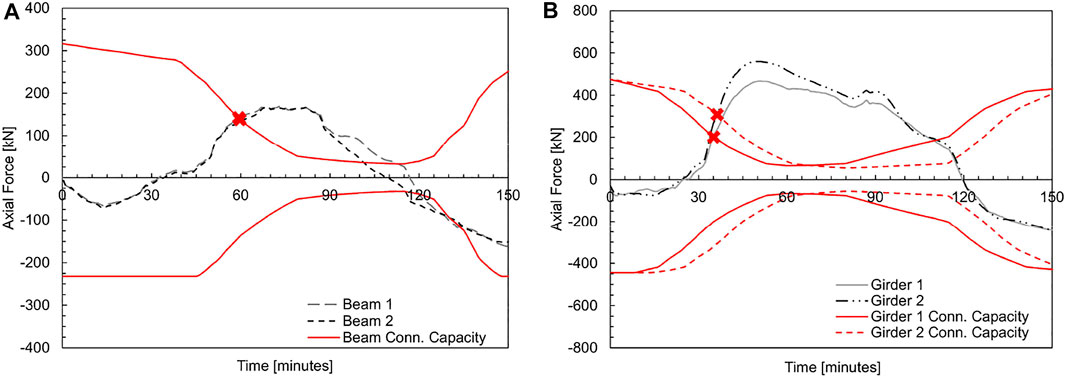
FIGURE 19. Axial force histories and connection capacities for (A) beams and (B) girders connecting to column C-2 for Fire Scenario #3 (SFE model).
The axial behavior of the beam-to-column connections is demonstrated in the axial force histories presented in Figure 20. The axial force histories in Figure 20 are for the beams spanning between MRF and gravity columns on grid lines B-E (corresponding to the same beam axial forces presented in Sections 4.2.2 and 4.3.2). The axial forces in Figure 20 (SFE model) are similar to the forces in Figure 17 (Base Model). At the beginning of the fire, tensile force is transferred through the connections as the beams in Bays 2–5 resist the expansion of the beams in Bay 1. When the beams in each bay are in the near field, compressive forces develop within the beams. The beams on grid lines B and C begin to cool at times of 60 and 80 min, respectively. Because around this same time (60 min) high compressive forces are developing in the beams in Bay 3 due to near field heating, tensile force develops in the cooling beams (in Bay 2) to resist the expansion of beams in Bay 3. The drop of axial force in Figure 20 at times of 68 and 82 min shows that as the beams cool they resist the expansion of beams in heating bays. The beam-to-column connections on grid lines B and C do not fail and are able to withstand their maximum tensile loads of 182 and 153 kN, respectively. However, the beams on grid lines D and E fail in compression during heating. The beams on grid lines D and E experience higher temperatures than the beams on grid lines B and C due to the presence of elevated smoke temperatures (far field heating). Therefore, these beams (on grid lines D and E) fail in compression. Figure 20 shows the failure of connections on grid lines D and E as a sudden decrease of axial force at times of 115 min, after which axial force is no longer transferred through the connections. The temperatures of the beams, on grid lines D and E, at this time (115 min) was 729 and 710°C, respectively. The same trend can be seen in the beam deflections on grid lines B, C, D, and E. Whereas the beams on grid lines D and E had runaway deflection when all structural members were protected for a 1 h FRR, these beams began to recover their deflection in the SFE model, regardless if there is failure in the beams. The beams on grid lines B, C, D, and E recovery 62, 59, 49, and 43%, respectively, throughout the fire.
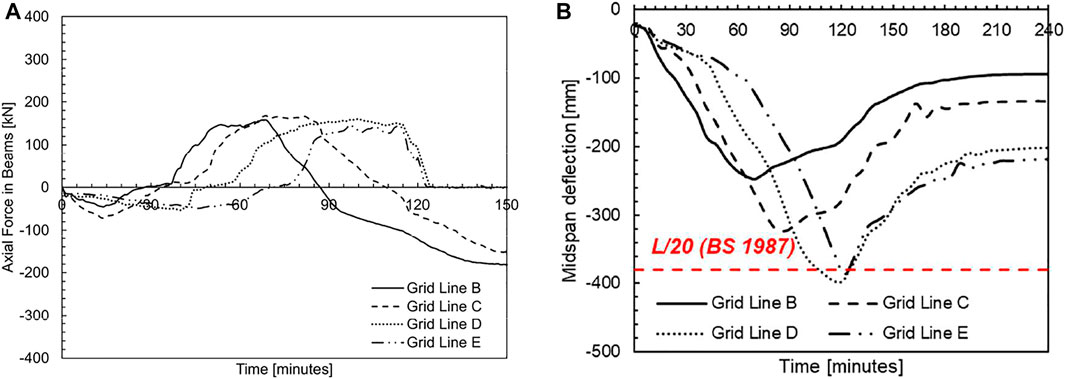
FIGURE 20. Behavior of secondary beams spanning between MRF and gravity columns in Fire Scenario #3 (SFE Model) (A) axial force histories and (B) midspan deflection histories.
Similar to the beam-to-column connections, girder-to-column connections in the bays closest to the starting point of the fire did not fail. The only girder-to-column connection failure occurred in the connections in Bay 5. After the beams on grid line E failed, at a time of 121 min, additional force was transferred to the girders in Bay 5. Because at this time (121 min) the girders in Bay five were at a temperature of 715°C they could not withstand the additional imposed load and failed.
6 Discussion of Results
The results of the analysis presented in Sections 4 and 5 showed that the fire scenario and thickness of fire protection on structural members had a large influence on the structural response of the building. In addition, when the floor framing failed, load redistribution through the horizontal floor framing was dependent on the performance of the beam and girder shear tab connections.
6.1 Traveling Fire Effects on Columns
Failure of the gravity columns precipitated building instability and collapse for each fire scenario. The rate of heating was highest for Fire Scenario #3. This increased rate of heating was caused by elevated smoke temperatures and the inclusion of fire dynamics within the TFM model. The increased rate of heating also resulted in columns having a smaller fire survival time than the other two fire scenarios.
The number of failed columns and the sequence of column failure differed between the three different fire scenarios. For a full story fire (Fire Scenario #1), all columns failed at the same time, but for Fire Scenarios #2 and #3, column failures were staggered at times corresponding to the fire spread rate (20 min). Fire Scenario #2 resulted in sequential column failure that followed the same pattern of the fire path. Because Fire Scenario #3 included elevated gas temperatures, the gravity columns further from the fire source were heated more intensely and failed first. Additionally, the gravity columns that were exposed to the near field first in Fire Scenario #3 did not fail.
When the level of fire protection on the columns is increased to correspond with a 2 h FRR, column failure was not observed. The lack of column failure also prevented global instability and collapse of the building.
6.2 Traveling Fire Effects on Floor Framing
The axial forces in girder-to-column and beam-to-column connections exceeded their calculated capacities in all three fire scenarios when the fire protection thickness on the structural members was designed using prescriptive design approaches (1 h FRR). The connections exceeded their calculated bolt shear capacity in compression during the heating phases of the fires but did not fail. When column failure occurred, the gravity connections on the fifth and sixth floors failed in tension due to the buckling and downward deflection of gravity columns supporting the fifth floor. These gravity connections failed in a shorter time period in Fire Scenario #3 as compared with Fire Scenario #2 demonstrating that accounting for the traveling nature of fire and the presence of elevated gas temperatures yielded the worst-case scenario for the floor framing system. In Fire Scenario #1 all beam-to-column and girder-to-column connections for beam and girders spanning between the MRF and gravity columns failed at approximately the same time.
In Fire Scenario #2 compressive forces in the connections were limited by column failure. However, in Fire Scenario #3 the compressive forces in the connections on grid lines B and C were dependent on beam and girder temperatures and were not limited by column failure. In all fire scenarios, large tensile forces were transferred through the shear tab connections during load redistribution (after column failure) but did not cause connection failure. The maximum compressive and tensile forces are listed for each fire scenario in Table 2.
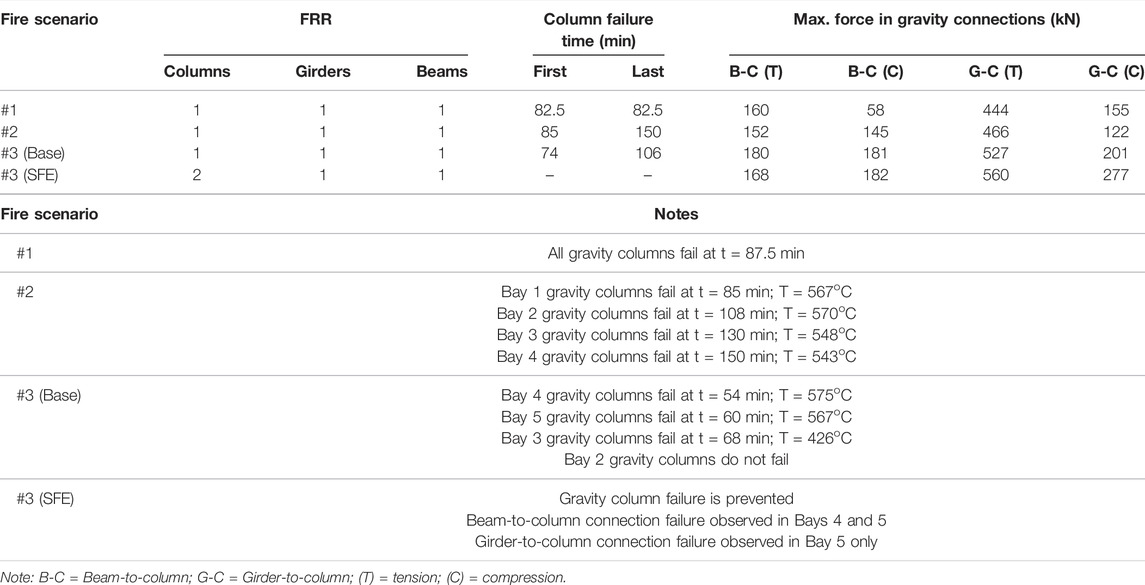
TABLE 2. Summary of Building behavior in fire scenarios.
When gravity column buckling was prevented by increasing the thickness of fire protection, large axial forces did not develop in the gravity connections on floors above the fifth floor, because there was no column failure, thus connection failure on these floors was prevented. Connections on the fifth floor that were located furthest from the starting point of the fire were heated more severely and failed in compression, but that did not precipitate any additional failure or instability of the structure.
7 Summary and Conclusion
The research in this paper compared the structural response of a steel-frame building to standard-prescribed fire exposure (SFPE 2011; NFPA 2016) and traveling fire exposures (Bailey et al., 1996; Stern-Gottfried and Rein 2012a; Stern-Gottfried and Rein 2012b). In each scenario, gravity columns were the first structural elements to fail, followed by the failure of gravity connections in the horizontal floor framing. The differences in column failure times and axial demands on gravity connections was due to the difference in fire intensities approximated by the fire models. These results demonstrate that simplistic approximations of traveling fires that do not consider the effects of elevated smoke temperature underestimate the fire intensity that structural elements will be exposed to. Therefore, the simplified traveling fire models should not be relied upon to solely demonstrate structural fire engineering approaches in steel-frame structures.
When the thickness of fire protection on the columns was increased to correspond to a 2-h FRR in the SFE model, column buckling and building collapse during the TFM fire (Fire Scenario #3) was prevented. Gravity connection failure still occurred but was limited to the bays that were most intensely heated by the fire. The results from the SFE model demonstrate how structural fire engineering can be used with traveling fire models that incorporate elevated gas temperatures and fire dynamics to ensure the structural integrity of steel-framed buildings during a fire event.
Data Availability Statement
The raw data supporting the conclusions of this article will be made available by the authors, without undue reservation.
Author Contributions
Research Concept, Methodology, Organization, and Writing—EF Research Concept, Methodology, Review, and Editing—AV Analysis, Execution, Writing, and Addressing Internal Comments—JG.
Conflict of Interest
The authors declare that the research was conducted in the absence of any commercial or financial relationships that could be construed as a potential conflict of interest.
Publisher’s Note
All claims expressed in this article are solely those of the authors and do not necessarily represent those of their affiliated organizations, or those of the publisher, the editors and the reviewers. Any product that may be evaluated in this article, or claim that may be made by its manufacturer, is not guaranteed or endorsed by the publisher.
References
Agarwal, A., Choe, L., and Varma, A. H. (2014b). Fire Design of Steel Columns: Effects of Thermal Gradients. J. Constr. Steel Res. 93, 107–118. doi:10.1016/j.jcsr.2013.10.023
Agarwal, A., Selden, K., and Varma, A. (2014a). Stability Behavior of Steel Building Structures in Fire Conditions: Role of Composite Floor System with Shear-Tab Connections. J. Struct. Fire Eng. 5(2), 77–96. doi:10.1260/2040-2317.5.2.77
Agarwal, A. (2011). Stability Behavior of Steel Building Structures in Fire Conditions. West Lafayette, IN: Purdue University.
Agarwal, A., and Varma, A. H. (2011). Design of Steel Columns at Elevated Temperatures Due to Fire: Effects of Rotational Restraints. Eng. J. 48, 297–314.
Agarwal, A., and Varma, A. H. (2014). Fire Induced Progressive Collapse of Steel Building Structures: The Role of Interior Gravity Columns. Eng. Struct. 58, 129–140. doi:10.1016/j.engstruct.2013.09.020
Albert, R. L. (1972). Calculation of Response Time of Ceiling-Mounted Fire Detectors. Fire Technol. 8, 181–195.
Bailey, C. G., Burgess, I. W., and Plank, R. J. (1996). Analyses of the Effects of Cooling and Fire Spread on Steel-Framed Buildings. Fire Saf. J. 26, 273–293. doi:10.1016/s0379-7112(96)00027-6
BS (1987). Fire Tests on Building Materials and structuresMethod for Determination of the Fire Resistance of Elements of Construction (General Principles). London, UK: BS. 476-20.
CEN (2002). Eurocode 1: Actions on Structures – Part 1-2: General Actions – Actions on Structures Exposed to Fire. Brussels: European standard EN. 1991-1-1.
CEN (2005a). Eurocode 3: Design of Steel Structures – Part 1-2: General Rules – Structural Fire Design. Brussels: European standard EN. 1993-1-2.
CEN (2005b). Eurocode 4: Design of Composite Steel and Concrete Structures – Part 1-2: General Rules – Structural Fire Design. Brussels: European standard EN. 1994-1-1.
Charlier, M., Franssen, J.-M., Franssen, J.-M., Dumont, F., Nadjai, A., and Vassart, O. (2021). Development of an Analytical Model to Determine the Heat Fluxes to a Structural Element Due to a Travelling Fire. Appl. Sci. 11 (19), 9263. doi:10.3390/app11199263
Choe, L., Agarwal, A., and Varma, A. H. (2016). Steel Columns Subjected to Thermal Gradients from Fire Loading: Experimental Evaluation. J. Struct. Eng. 142 (7), 04016037. doi:10.1061/(asce)st.1943-541x.0001500
Dai, X., Jiang, L., Maclean, J., Welch, S., and Usmani, A. (2016a). “A Conceptual Framework for a Design Travelling Fire for Large Compartments with Fire Resistant Islands,” in Proceedings of the 14th International Interflam Conference. London, UK: Interscience Communications, 1039–1050.
Dai, X., Jiang, L., Maclean, J., Welch, S., and Usmani, A. (2016b). “Implementation of a New Design Travelling Fire Model for Global Structural Analysis,” in Proceedings of the 9th International Conference on Structures in Fire. Princeton, NJ: Princeton University, 959–966.
Dai, X., Welch, S., VassartCábová, O. K., Cábová, K., Jiang, L., Maclean, J., et al. (2020). An Extended Travelling Fire Method Framework for Performance‐based Structural Design. Fire Mater. 44, 437–457. doi:10.1002/fam.2810
Fischer, E. C., Varma, A. H., and Agarwal, A. (2019). Performance-Based Structural Fire Engineering of Steel Building Structures: Design-Basis Compartment Fires. J. Struct. Eng. 145, 04019090. doi:10.1061/(asce)st.1943-541x.0002370
Fischer, E. C., and Varma, A. H. (2015). Fire Behavior of Composite Beams with Simple Connections: Benchmarking of Numerical Models. J. Constr. Steel Res. 111, 112–125. doi:10.1016/j.jcsr.2015.03.013
Fischer, E. C., Varma, A. H., and Zhu, Q. (2017). Experimental Evaluation of Single-Bolted Lap Joints at Elevated Temperatures. J. Struct. Eng. 144 (1), 1–13. doi:10.1061/(ASCE)ST.1943-541X.0001911
Gamba, A., and Franssen, J.-M. (20212021). GoZone: A Numerical Model for Travelling Fires Based on Cellular Automata Concept. Appl. Sci. 11 (22), 10679. doi:10.3390/app112210679
Gernay, T., and Khorasani, N. E. (2019). Recommendations for Performance-Based Fire Design of Composite Steel Buildings Using Computational Analysis. J. Constr. Steel Res. 166, 105906. doi:10.1016/j.jcsr.2019.105906
Kirby, B. R., Waiman, D. E., Tomlinson, L. N., Kay, T. R., and Peacock, B. N. (1994). Natural Fires in Large Scale Compartments,” British Steel Technical, Fire Research Station Collaborative Project Report. Rotherham, U.K: British Steel Technical Swinden Laboratories.
Lamalva, K. (2018). Structural fire engineering (Manual of Practice 138). Reston, VA: American Society of Civil Engineers (ASCE).
NFPA (2016). Standard for Determination of Fire Loads for Use in Structural Fire Protection Design. Quincy, MA: NFPA, 557.
Rackauskaite, E., Kotsovinos, P., and Rein, G. (2017). Structural response of a steel-frame building to horizontal and vertical travelling fires in multiple floors. Fire Saf. J. 11, 542–552. doi:10.1016/j.firesaf.2017.04.018
Rein, G., Zhang, X., Williams, P., Hume, B., Heise, A., Jowsey, A., et al. (2007). “Multi-storey Fire Analysis for High-Rise Buildings,” in Proc. 11th Int. Interflam Conf. (London, UK, 605–616.
Ruddy, J. L., Marlo, J. P., Ioannides, S. A., and Alfawakhiri, F. (2003). Design Guide 19: Fire Resistance of Structural Steel Framing. Chicago, IL: AISC.
Sarraj, M. (2007). The Behavior of Steel Fin Plate Connections in Fire. Sheffield, UK: The University of Sheffield.
Selden, K. L. (2014). Structural Behavior and Design of Composite Beams Subjected to Fire. West Lafayette, IN: Purdue University.
SFPE (2011). SFPE S.01: Engineering Standard on Calculating Fire Exposures to Structures. Gaithersburg, MD: Society of Fire Protection Engineers.
Stern-Gottfried, J., and Rein, G. (2012a). Travelling Fires for Structural Design-Part I: Literature Review. Fire Saf. J. 54, 74–85. doi:10.1016/j.firesaf.2012.06.003
Keywords: fire, building, performance - based design, analysis, structural engineering, fire design
Citation: Fischer EC, Varma AH and Gordon JA (2022) Performance-Based Structural Fire Engineering of Steel Building Structures: Traveling Fires. Front. Built Environ. 8:907237. doi: 10.3389/fbuil.2022.907237
Received: 29 March 2022; Accepted: 05 May 2022;
Published: 14 June 2022.
Edited by:
Zhong Tao, Western Sydney University, AustraliaReviewed by:
Ali Nadjai, Ulster University FireSERT, United KingdomZhaohui Huang, Xi’an University of Architecture and Technology, China
Yong Wang, China University of Mining and Technology, China
Copyright © 2022 Fischer, Varma and Gordon. This is an open-access article distributed under the terms of the Creative Commons Attribution License (CC BY). The use, distribution or reproduction in other forums is permitted, provided the original author(s) and the copyright owner(s) are credited and that the original publication in this journal is cited, in accordance with accepted academic practice. No use, distribution or reproduction is permitted which does not comply with these terms.
*Correspondence: Amit H. Varma, YWh2YXJtYUBwdXJkdWUuZWR1