 Yong Adilah Shamsul Harumain
 Suhana Koting1
- 1Center for Transportation Research, Department of Civil Engineering, Faculty of Engineering, University of Malaya, Kuala Lumpur, Malaysia
- 2Department of Urban and Regional Planning, Kuala Lumpur, Malaysia
An essential element for promoting sustainable urban transport is active transportation. Many factors are associated with walkability, such as individual characteristics, sociodemography, and distance. This research presents findings on active transportation use relating to sociodemographic background. Using a questionnaire survey as an instrument, the study was performed in Bangsar and Shah Alam, Malaysia, via stratified random sampling. The binomial logistic regression model and analysis of variance (ANOVA) were used for statistically analyzing the data from 325 respondents. ANOVA demonstrated that education level and occupational status statistically influenced the home–public transportation station distance. The study outcomes could benefit many sectors, such as urban planning, transportation, health, and education. An enhanced understanding of the findings could contribute to decision-making among the relevant authorities for facilitating active transportation.
1 Introduction
In Malaysia, the modes of transportation are divided into motorized and non-motorized. According to the Ministry of Transport Malaysia, 32,378,174 road motor vehicles were registered in Malaysia in 2020 (Ministry of Transport Malaysia, 2020). This statistic demonstrates the high dependency of Malaysians on motorized vehicles. Being one of the countries in Asia with highest percentage of private vehicle ownership, it is a concern for the government toward achieving sustainable development goals and efforts to shift the transportation mode from private vehicles to public transportation in the near future. In ensuring that this goal is achieved, the government must ensure that active transportation is able to support its people using public transportation, such as in ensuring connectivity, accessibility, and mobility. However, it is a struggle to ensure that people use active transportation as a culture, due to several obvious concerns. Behavior is related to people’s everyday actions, which can be influenced by what is around them, such as what encourages them to walk. This includes how people select modes of transportation: public transportation or private vehicles. One of the main concerns is the availability of facilities to support active transportation, such as pathways, pathway connectivities, and access, regardless of the type of residential development. Looking at the current residential situation, the basic facilities are already in place, but there is evidence that facilities are better planned in high-income development areas to boost the price of the developments, compared to lower-income residential areas. Typically, these facilities come with a “price”, thus reflecting the imbalance of encouraging active transportation in all segments of society. It also proves that there are sociodemographic background influences on active transportation which can be caused by an imbalance in the provision of facilities. This study focuses on two developments which comprise all sociodemographic backgrounds with proper neighborhood planning and facilities. In a non-biased and neutral urban planning setting, this study seeks evidence for sociodemographic background influences on active transportation.
Active transportation, also known as non-motorized transportation, is activated by human energy, such as walking, cycling, wheelchairs, and skateboards. Active transportation enables users to choose more environmentally friendly, safe, comfortable, and economical modes of transportation; hence, it is an alternative means of achieving a sustainable transportation system. Built environment elements influence walkability, where pedestrians experience active transportation supported by the provision of pedestrian facilities in surrounding areas (Arshad et al., 2016; Williams et al., 2017; Papageorgiou et al., 2018; Kim et al., 2020). Therefore, a crucial factor in promoting active transportation is a walkable environment.
A walkable environment is an important factor in promoting active travel. Some studies have demonstrated that walkability patterns and active transportation usage are associated with sociodemographic factors (Loo et al., 2015; Williams et al., 2017; Kim et al., 2020). Studies like those by Lyu and Forsyth (2021) and Seong et al. (2021) noted that non-working people, including students and housewives, are more likely to use active transportation. The association between active transportation and occupational status has been debated in the literature, where some have argued that employed people tend to use active transportation (Hilland et al., 2020; Rišová and Madajová, 2020). Previous studies have demonstrated on the one hand that employment background significantly contributes toward users’ travel patterns, which includes their choice of transportation mode (Saelens et al., 2003; Heinen et al., 2013; Yazid et al., 2017). On the other hand, Yazid et al. (2017) and Williams et al. (2017) have noted that those most active in walking and cycling are early adolescents aged between 10 and 15 years.
Built environment factors also influence the decision to use active transportation such as distance (Arshad et al., 2016; Yazid et al., 2017; Sarker et al., 2019; Kim et al., 2020), facilities (Daniels and Mulley, 2011; Jensen et al., 2014; Sarker et al., 2019; Kim et al., 2020), and weather (Saelens et al., 2003; Daniels and Mulley, 2011; Papageorgiou et al., 2018). A shorter distance is the most important indicator for users to commute by either walking or cycling (Arshad et al., 2016; Yazid et al., 2017; Sarker et al., 2019; Kim et al., 2020). As most trips are for leisure and shopping, this encourages active travel within a shorter distance (Arshad et al., 2016; Kim et al., 2020). On the other hand, safety also plays a major role in determining active travel. According to Daniels and Mulley (2011) and Jensen et al. (2014), most pedestrians are likely to use active transportation when they feel safe from traffic and crime. In considering the provision of pedestrian facilities, walking can be promoted by wide pedestrian roads and safer pathways in the built environment (Kim et al., 2020). Nonetheless, pedestrians tend to use public transport for safety and comfort (Papageorgiou et al., 2018). There are many benefits in active travel. It is found that active transportation increases physical activity, promoting a healthy lifestyle, which accommodates current concerns regarding good health (Daniels and Mulley, 2011; Jensen et al., 2017).
A key element in promoting clean urban transport is active transportation. It can develop into a common mode of transport, particularly for relatively short distances. Active transportation is popular in developed countries as it promotes a healthy lifestyle that can subsequently improve long-term health (Saelens et al., 2003; Yazid et al., 2017; Sarker et al., 2019). These countries include the Netherlands, Japan, and China (Heinen et al., 2011; Loo et al., 2015), which have adapted their transportation policies to support active transportation users and which encourage the community to live a healthier and more active life. If performed regularly, walking and cycling can be considered physical activities beneficial to health (Saelens et al., 2003; Daniels and Mulley, 2011; Heinen et al., 2011; Jensen et al., 2017; Kim et al., 2020). Furthermore, active transportation can help reduce motor vehicle pollution (González et al., 2017; Yazid et al., 2017; Papageorgiou et al., 2018; González et al., 2020). Hence, active transportation leads to reduced motor vehicle travel, which confers obvious economic, social, and environmental benefits to the community.
Similar to other modes of transportation, active transportation also faces some challenges. Pedestrian safety is an issue that affects walkability (Daniels and Mulley, 2011; Lubans et al., 2011; Jensen et al., 2017; Papageorgiou et al., 2018; Sarker et al., 2019) and has arisen from the increasing number of pedestrians involved in road accidents. According to the national police force, 32,674 road accidents were reported in 2020, 4,297 of which were fatal (Polis Di-Raja Malaysia, 2020). As vulnerable road users, pedestrians are always at risk during daily travel where risk is present, as pedestrians and motor vehicle users share the same roadway. This is unlike transportation in sustainable cities, specifically in the Netherlands, where many pedestrian facilities are available, including separate pedestrian infrastructure (Heinen et al., 2011).
In Malaysia, active transportation remains a new means of travel that has not been explored and implemented in the local context. Compared to motorized transportation, active transportation is unpopular due to inappropriate pedestrian facilities, safety concerns, and unpredictable weather, which could impede efforts toward promoting active transportation. These issues, especially those involving pedestrians and motor vehicles, should be resolved. Hence, proper strategies involving safety measures and policies must be undertaken to reduce accident risk among pedestrians (González et al., 2020; Tirachini and Cats, 2020). Local authorities should also provide sufficient and proper pedestrian facilities and infrastructure to encourage walking and cycling in the community. Nevertheless, most urban areas are not pedestrian-friendly. Pedestrian walkways in the cities are inefficiently designed and not well maintained, and demonstrate poor accessibility and linkage. Generally, the lack of pedestrian facilities interferes with the walking experience and could discourage willingness to walk. Currently, pedestrian facilities and infrastructures are generally unsatisfactory (Saelens et al., 2003; Papageorgiou et al., 2018; González et al., 2020), with pedestrian facilities not designed to support and accommodate walking activity (Saelens et al., 2003; Jensen et al., 2017). Regarding cycling, most users only cycle for leisure and sport.
2 Literature Review
2.1 Active Transportation
In a developing country, social and economic status has an important role in the sociodemography of society and in everyday behavior. Segregation of status is noted, including in residential planning and development, and even in provision of facilities, where better facilities are seen in higher-income residential areas. Ironically, the facilities are seen as a tool to boost competitive residential markets, especially for the high-end buyers and high-price property residential areas. This includes facilities related to promoting active transportation, like walking pathways, streetscapes, and landscapes, even when the majority of higher-income earners are able to own and drive their own private vehicles. This is unlike lower-income earners, many of whom suffer from the need to for good transportation to travel to work, but are rarely enabled to do this with proper facilities to promote active transportation. This reflects the public transportation service, which also relates to issues of connectivity, accessibility, and mobility in the residential areas for lower-income earners. This is the case in Bangsar and Shah Alam, where urban planning is paramount and the neighborhoods overall are provided with good pathways, streetscapes, and landscapes. Both developments were sensibly planned for “car-oriented” development as well as being provided with good walking facilities, such as pathways, small parks, and playgrounds, and connections between commercial areas and residential areas within walking distance. Regardless of social and economic status, both developments provide facilities to all levels of society. Thus, the purpose of this study is to understand whether active transportation is achieved in a neutral area where there is no discrimination of facilities in any types of residential development. Therefore, we are able to analyze if there are differences between sociodemographic status implications and differences in active transportation in a neutral setting of residential developments.
Active transportation or non-motorized transportation refers to human-powered transportation (Sallis et al., 2004; Chillón et al., 2011; Rabl and De Nazelle, 2012; Carlson et al., 2014; Yazid et al., 2017; Kim et al., 2020). Other built environment studies on sustainable transportation consider active transportation as an integral physical activity (Lubans et al., 2011; McCormack and Shiell, 2011; Larouche et al., 2014; Gul et al., 2018). Built environment factors, consisting of the surroundings that provide the setting for physical activity, can influence behavior toward active transportation (Williams et al., 2017). As walking and cycling do not require special skills, they are deemed convenient for all age groups, where people manage the intensity of their movements themselves (Kim et al., 2020). In this article, the term “active transportation” refers to walking and cycling.
2.2 Active Transportation and the Built Environment
Walkability is created by connecting built environment elements, such as housing, transportation, recreational parks, and green spaces. Active transportation has been defined as a multifaceted concept that includes several built environment elements (Adkins et al., 2012). Users walk and cycle because of the aesthetic aspects of the surrounding environment. An area perceived as demonstrating good aesthetics persuades pedestrians to use active transportation (Daniels and Mulley, 2011; Jensen et al., 2017). This can be achieved through a range of activities that includes constructing pedestrian facilities and infrastructures within a pedestrian-oriented development. Typically, built environment quality influences the walkability of a city; therefore, the elements of a built environment should be designed aesthetically based on planning standards and guidelines to provide a pleasant travel experience for active transportation users (Arshad et al., 2016). Indeed, planning a walkable city involves the effective use of skill and knowledge by relevant authorities in the field of built environment.
2.3 Factors Influencing Active Transportation
Generally, two fundamental concepts of urban form affect travel choice: land use density and connectivity between complementary activities, such as working, shopping, and playing. In sustainable transportation, connectivity is associated with how the modes of transport are linked, especially in public transportation. Most users are willing to use active transportation for shorter distances (Lubans et al., 2011; Yazid et al., 2017). Although shorter distances promote walking or cycling, users are nevertheless inclined to avoid using active transportation for safety reasons. Most people tend to walk and cycle if they feel safe in their surroundings (Arshad et al., 2016; Jensen et al., 2017; Williams et al., 2017; Papageorgiou et al., 2018; Sarker et al., 2019). Therefore, built environment features that lead to traffic hazards should be eliminated to create walkability. Comfort level also contributes to the pleasantness of active transportation (Jensen et al., 2017; Papageorgiou et al., 2018). Furthermore, connectivity and distance are associated with each other, with both being important for creating a walkable city (Papageorgiou et al., 2018; Sarker et al., 2019). Therefore, the built environment can enhance active transportation infrastructure.
Other researchers have suggested that sociodemographic characteristics affect active transportation use. Sociodemographic factors such as gender, age, household income level, and education level have been associated with user behavior toward active transportation usage (Larouche et al., 2014; Arshad et al., 2016; Williams et al., 2017; Yazid et al., 2017; González et al., 2020; Kim et al., 2020). Users from different races or ethnic groups may have specific opinions on walking and cycling (Grasser et al., 2013; Papageorgiou et al., 2018). Age is an attribute of travel behavior, where it has been suggested that older people use active transportation less frequently than younger people (Marquet et al., 2017; Papageorgiou et al., 2018; Rišová and Madajová, 2020). Contrary to this, Lyu and Forsyth (2021) reported that older people are more likely to walk. Middle-aged and older adults tend to be reflective during long-distance walks (Mau et al., 2021), describing walking as a strenuous, simple, solitary, and calming activity.
Gender significantly affected pedestrian behavior toward walkability (Daniels and Mulley, 2011; Grasser et al., 2013; Larouche et al., 2014; Arshad et al., 2016; Marquet et al., 2017; Papageorgiou et al., 2018; Kim et al., 2020). Nevertheless, Larouche et al. (2014) mentioned that many studies have reported inconsistent results between genders. Arshad et al. (2016) supported those findings, stating that both men and women profess quite similar opinions on pedestrian walkways. Even so, some researchers believe that gender plays a significant role in determining the choice of transportation mode. Rišová and Madajová (2020) reported significant gender differences in safety perception toward walking. Women tend to feel unsafe when walking, while men are less concerned about feeling safe. Due to the issue of safety, women choose to drive rather than walk for travel purposes (Seong et al., 2021).
The findings on the association of income and active transportation use are varied. According to Jamal and Mohiuddin (2020) and Seong et al. (2021), the low-income group comprises the primary walkers and cyclists, whereas the high-income group prefer driving for daily trips. This is due to a higher household income being associated with higher car ownership, discouraging walking (Jamal and Mohiuddin, 2020). Nonetheless, Young et al. (2020) noted that low-income households demonstrate a low frequency of active transportation opportunities. Furthermore, Hilland et al. (2020) reported no significant association between income and active transportation use. There is some association between employment status and active transportation usage. Employed people engage in a high level of walking as they are expected to walk consistently during their occupational activities (Hilland et al., 2020; Rišová and Madajová, 2020). In contrast, Lyu and Forsyth (2021) reported that non-working people are more likely to walk during daily travel.
3 Research Data
In this study, data were collected using a quantitative approach, which involved the systematic investigation of social phenomena using statistical methods or numerical data. The data were used to test the hypotheses, answer the research questions, and identify the significant relationships between variables. Stratified random sampling, a probability sampling method, was used in this study. This study involved a total of 325 respondents. In compliance with research ethics, the confidentiality of all information in this study was maintained.
3.1 Case Study Areas
Based on the factors of built environment facilities and population density, two sites with 1-km radius coverage from the selected points of interest at each site were selected for this study. This radius was established based on the valid active transportation distance which includes bus stop, commercial areas, parks, and also the light railway station (LRT), which involved 400 m of walking and 1,000 m of cycling. The case study areas were Bangsar in Kuala Lumpur and Shah Alam in Selangor. The selection criteria were socioeconomic factors such as income level, ethnicity, age group, and demography.
An urban neighborhood, Bangsar is approximately 4 km southwest of the Kuala Lumpur central business district (Figure 1). The total area of Bangsar is 4.93 km2. Public transport options are accessible and well thought-out, with strategic bus stops. KL Sentral, the largest transit hub in Malaysia, is one stop away via light rail transit (LRT).

FIGURE 1. Map of Bangsar (Source: Environmental Systems Research Institute [ESRI], 2021). Map Figure is from ArcGIS Online map hosted by Esri. We would like to assure the images is retrieved from ESRI free platform and we have go through the disclaimer and notification details at https://doc.arcgis.com/en/arcgis-online/reference/display-copyrights.htm.
Shah Alam is the capital city of Selangor State and is approximately 25 km west of Kuala Lumpur (Figure 2). Shah Alam consists of 56 sections and spans 290.3 km2. Shah Alam is well connected to other main cities in the Klang Valley via a major highway network, namely the Federal Highway, New Klang Valley Expressway, Shah Alam Expressway, Guthrie Corridor Expressway, North–South Expressway Central Link, and the newest highway Kemuning–Shah Alam Highway.
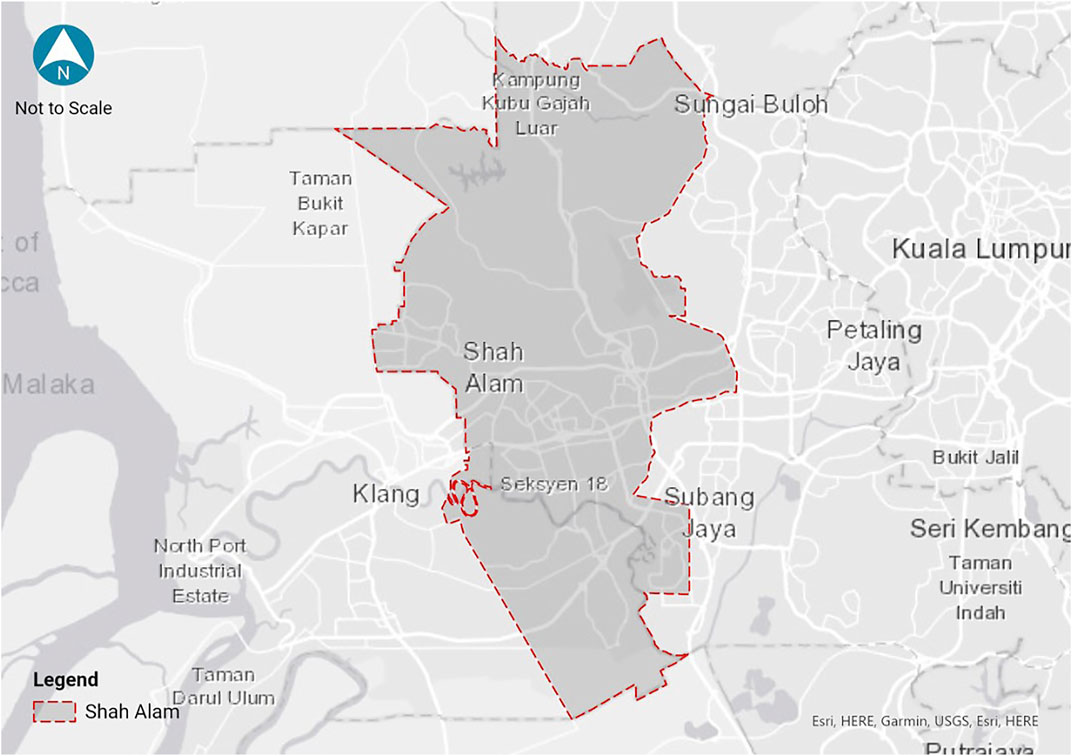
FIGURE 2. Map of Shah Alam (Source: ESRI, 2021). Map Figure is from ArcGIS Online map hosted by Esri. We would like to assure the images is retrieved from ESRI free platform and we have go through the disclaimer and notification details at https://doc.arcgis.com/en/arcgis-online/reference/display-copyrights.htm.
3.2 Methodology
Data were obtained using a questionnaire survey. The questionnaire was specifically designed to obtain facts and perceptions from the respondents. Due to the COVID-19 pandemic, the data were collected both on-site and online. For the on-site survey, the questionnaire was distributed by the person in charge of each case study area. Online, the questionnaire was disseminated over WhatsApp and Google Forms. The data were collected over 10 months from October 12, 2020 to August 31, 2021.
The main focus of a questionnaire is to survey the sample using specific questions (Marczyk et al., 2005). Therefore, it is very important that the questionnaire is well structured and designed with appropriate content. In this study, the questionnaire contained both multiple-choice and open-ended questions.
The questionnaire comprised four sections. Section A was related to the respondents’ sociodemographic background. Here, the respondents were categorized as independent or determinant variables. Section B consisted of questions relating to housing information. Section C contained questions on active transportation and public transportation usage, and was used for identifying respondents’ behavior patterns on public transport modes and active transportation. Section D consisted of questions on the respondents’ behavior toward active transportation and for determining their criteria for active transportation.
4 Results
4.1 Sociodemographics
The sociodemographic factors were identified as the independent variables, which have all been demonstrated to influence active transportation use (Larouche et al., 2014; Arshad et al., 2016; Williams et al., 2017; Yazid et al., 2017; González et al., 2020; Kim et al., 2020). The sociodemographic factors were gender, age, ethnicity, religion, marital status, education level, occupational status, occupational sector, and monthly income (see Table 1).
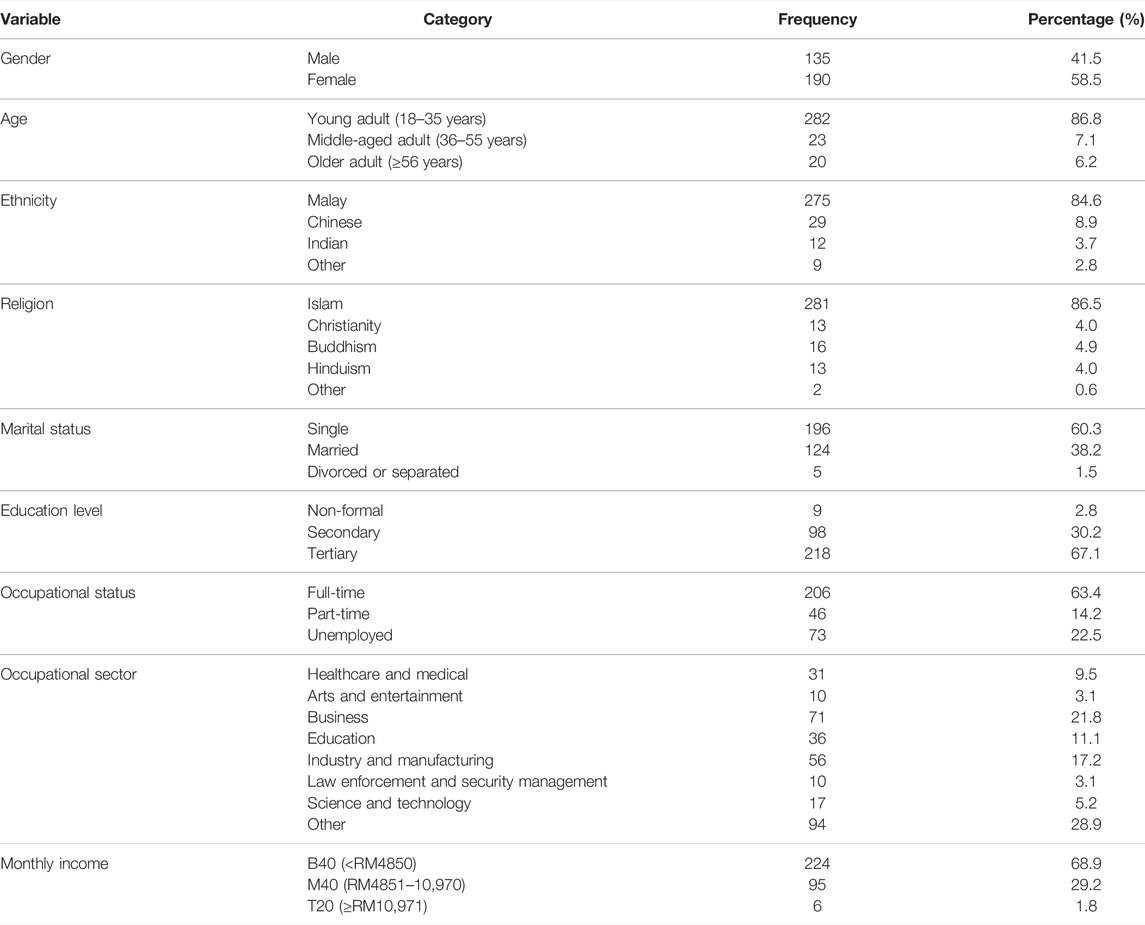
TABLE 1. Respondents’ sociodemographic background.
According to gender, 58.5% of the respondents were female and 41.5% were male. Young adults aged between 18 and 35 years comprised the largest age group (86.8%). Most respondents were Malay (84.6%), Muslim (86.5%), and single (60.3%). More than half of the respondents (67.1%) had tertiary-level education. Most respondents worked full time (63.4%) and were from various occupational sectors. The majority of the respondents earned salaries below RM4850 (68.9%), falling under the B40 income group.
4.2 Housing Information
Housing data are important as a key economic indicator and determine the respondents’ perspective about active transportation. Table 2 demonstrates that most respondents were from Shah Alam (68.6%), while 31.4% were Bangsar residents. House owners comprised 46.5% of the respondents, whereas 53.5% were renters. Most respondents (69.5%) had >3 households. Up to 48.6% of the respondents had lived for ≤5 years in their current house, while 51.4% had lived for >6 years in their house. Up to 38.8% of the respondents lived in apartments or flats, while 38.5% lived in terraced houses.
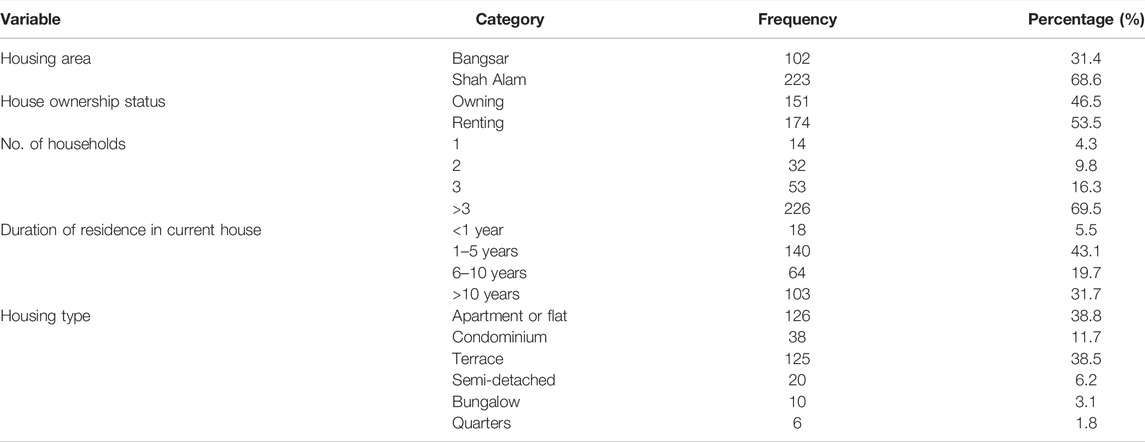
TABLE 2. Respondents’ housing information.
4.3 Public Transportation Usage
Public transportation is a mode of sustainable transportation typically associated with active transportation. This section covers the use of public transportation, private vehicles, and active transportation. In addition, the money spent on daily travel and the distance on daily trips was assessed. Table 3 summarizes the use of the various modes of transportation.
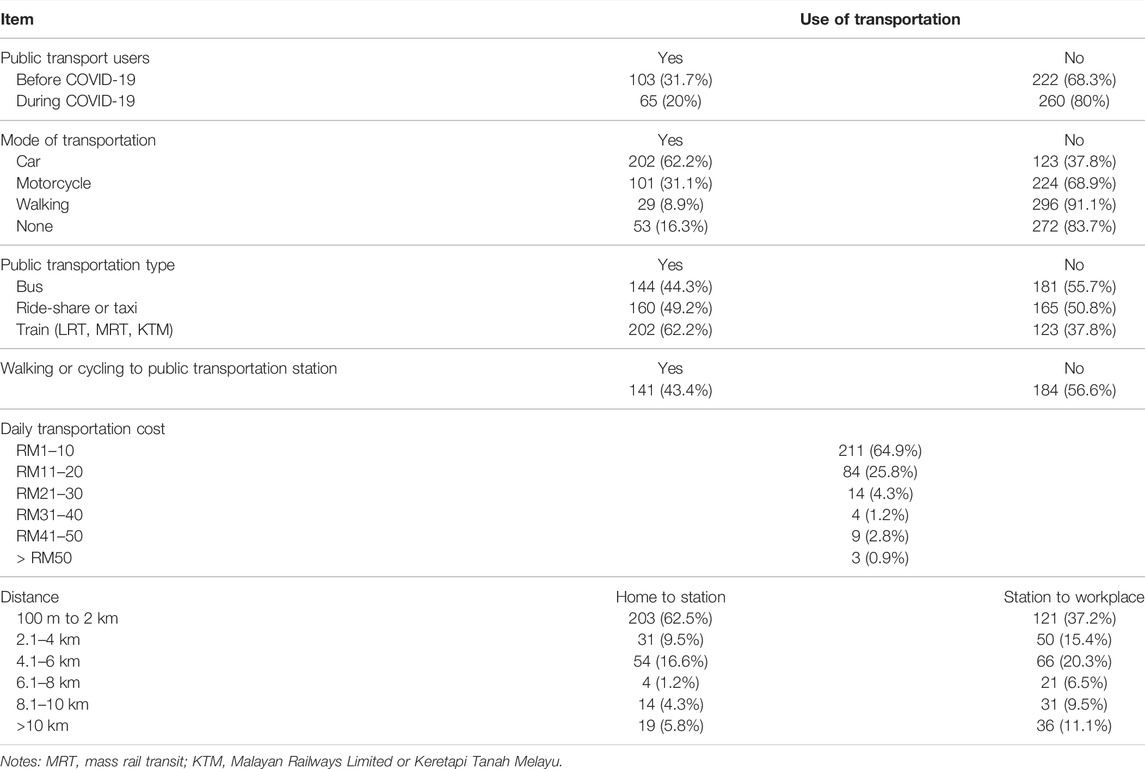
TABLE 3. Use of the various modes of transportation.
The COVID-19 pandemic affected the public transportation system. Predictably, public transportation usage declined during the pandemic due to public concern about infection risk. In this study, however, the comparison of usage trends before and during the pandemic determined that most respondents did not use public transportation either before or during the pandemic. Up to 31.7% of the respondents used public transportation before the pandemic, but only 20% did so during the pandemic. The United Nations (2021) has stated that countries and cities should provide options for accessible, safe, reliable, and sustainable public transport systems integrated with walking and cycling paths to encourage active transportation use.
Here, the respondents tended to use cars and motorcycles. Up to 8.9% of the respondents traveled daily on foot, while 16.3% of the respondents had no options other than public transport. More than half of the respondents (62.2%) drove cars, followed by motorcycle users (31.1%), and walkers (8.9%). Meanwhile, up to 16.3% of the respondents did not own a private vehicle.
The respondents used several types of public transportation, namely buses, ride-sharing or taxis, and trains. Most respondents (62.2%) used trains, including LRT, MRT (mass rail transit), and KTM (Malayan Railways Limited or Keretapi Tanah Melayu) daily. As active transportation is associated with public transportation, the respondents were asked whether they walked or cycled to the public transportation station. Overall, 43.4% of the respondents used active transportation to the public transportation station. In comparison, 56.6% walked or cycled to the station.
Overall, RM1 was the lowest daily transportation cost while the maximum daily transportation cost was RM150. The mean daily transportation cost was RM12.74. The findings demonstrated that the majority (64.9%) of the respondents spent RM1–10 daily on transportation. Overall, only 4.9% of the respondents spent more than RM31 on transportation daily.
The survey demonstrated that the shortest home–public transportation station distance was 100 m, while the furthest distance was 20 km. The mean average of home–public transportation station distance was 3.11 km. The majority of respondents (62.5%) traveled 100 m to 2 km from their home to the public transportation station. Only 5.8% of the respondents traveled >10 km from their home to the station. The mean average of public transportation station–workplace or institution distance was 5.5 km. Up to 37.2% of the respondents traveled 100 m to 2 km from the station to workplace or institution, followed by those who traveled 4.1–6 km (20.3%), while 11.1% of the respondents traveled >10 km.
4.4 Behavior Toward Active Transportation
This section analyses the respondents’ opinions on active transportation-related statements. The respondents were also asked to identify the most influential criteria for using active transportation.
4.4.1 Respondents’ Opinions on Active Transportation
The respondents were asked about their behavior toward active transportation. The possible answers for the statements given were strongly disagree, disagree, neutral, agree, and strongly agree. Table 4 summarizes the respondents’ behavior toward active transportation.
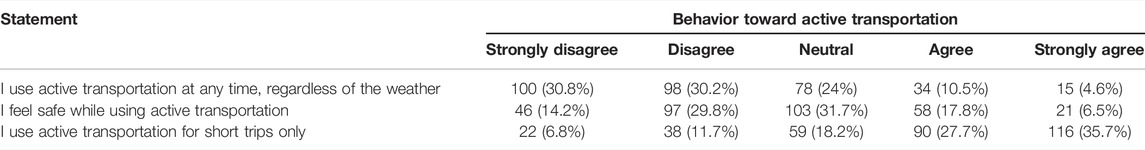
TABLE 4. Behavior toward active transportation.
Most of the respondents (61%) disagreed with using active transportation at any time, regardless of the weather. Up to 44% of the respondents felt unsafe using active transportation while 63.4% of the respondents used active transportation for short trips only.
4.4.2 Respondents’ Criteria of Active Transportation
The respondents were required to answer “yes” or “no” to statements based on the general criteria of active transportation. Table 5 summarizes the respondents’ behavior toward the criteria of active transportation.
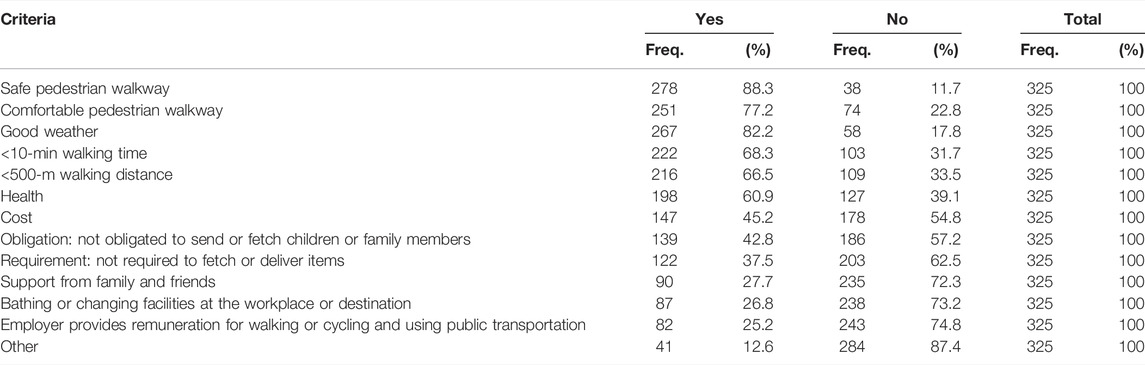
TABLE 5. Behavior toward criteria of active transportation.
Table 5 demonstrates that most of the respondents (88.3%) acknowledged the importance of pedestrian walkway safety. Up to 77.2% of the respondents wanted to feel comfortable with the pedestrian walkways provided. In terms of distance, 66.5% of the respondents preferred to walk <500 m to the public transportation station. This result is quite similar to that for active transportation walking time, where 68.3% of the respondents were willing to walk for <10 min. Most respondents (82.2%) cited good weather as the reason for walking or cycling to the public transportation station. A further 60.9% of the respondents cited health as their reason for adopting active transportation. All the criteria above were the most important in influencing the respondents’ decisions to walk and cycle. Fewer than 50% of the respondents answered “yes” to other criteria such as support from family and friends, provision of bathing and changing facilities, remuneration by the employer, cost, and obligation. To conclude, such criteria (support from family and friends, provision of bathing and changing facilities, remuneration by the employer, cost, and obligation) were less important to the respondents when choosing active transportation.
4.5 Sociodemographic Background and Active Transportation Usage
The respondents’ willingness to use active transportation daily depends on various factors. The relationship between active transportation use and the sociodemographic variables was investigated using the binomial logistic regression model with control variables. The independent variables (sociodemographic factors) were gender, age, race, religion, marital status, education level, occupational status, occupational sector, and income level. The dependent variable was the respondents’ active transportation use to the public transportation station. The maximum likelihood method was used for the estimation, and Table 6 presents the logistic regression model of the predictors of active transportation use. The hypotheses are as follows:
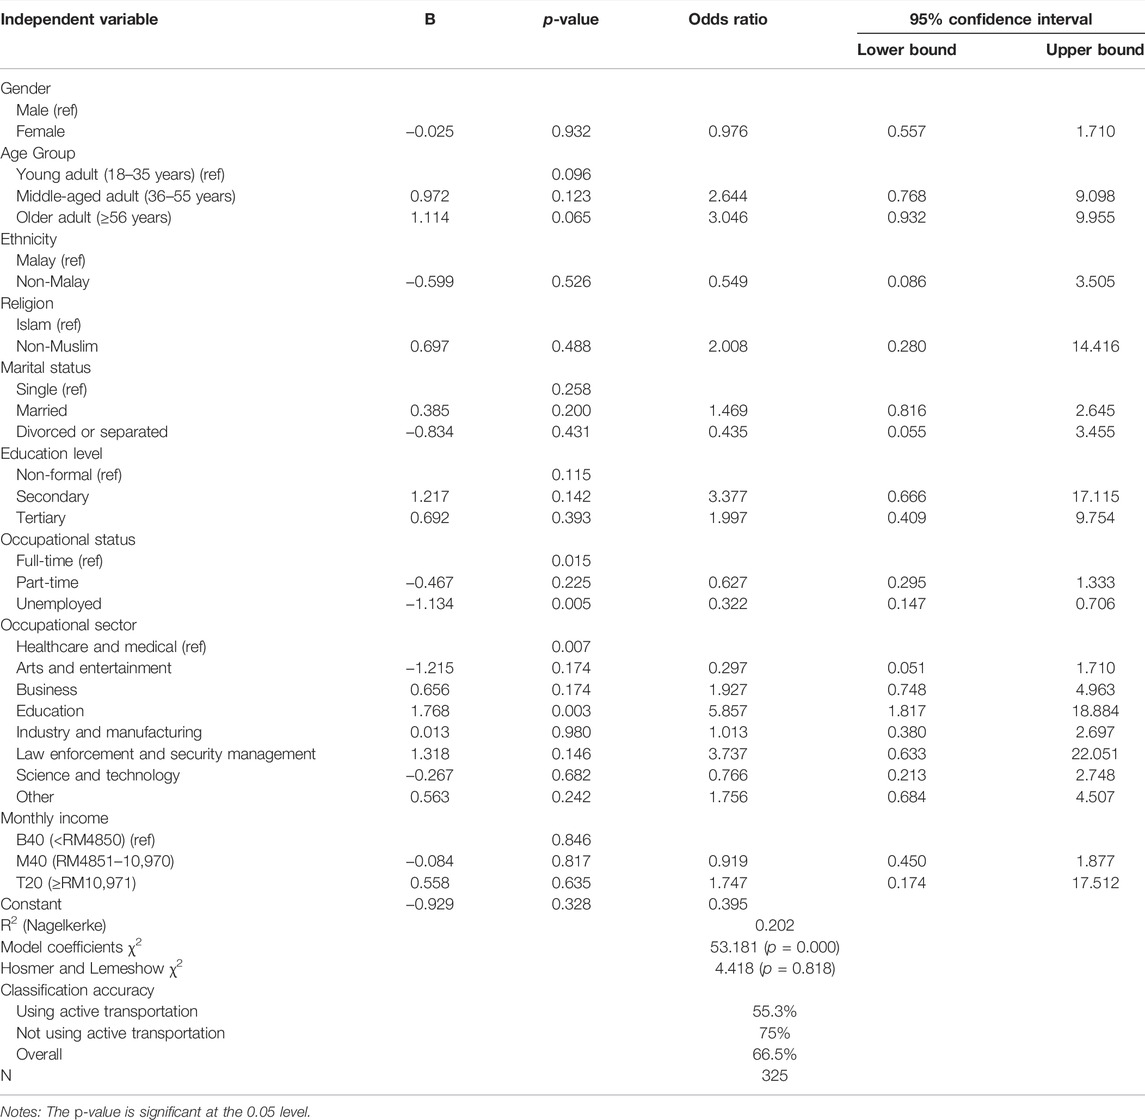
TABLE 6. Logistic regression model of predictors of active transportation use.
H0: There is no significant relationship between active transportation to the public transportation station and sociodemographic background (gender, age, race, religion, marital status, education level, occupational status, occupational sector, and income level);
H1: There is a significant relationship between active transportation use to the public transportation station and sociodemographic background.
Logistic regression was conducted to determine whether the sociodemographic factors could predict the likelihood that the respondents would use active transportation. Table 6 demonstrates that the logistic regression results were statistically significant [χ2 (20) = 53.181, p = 0.000]. The Nagelkerke R2 value, a measure of the explanatory power of the models, was 0.202, indicating that the models explained approximately 20.2% of the response variable. Furthermore, Hosmer and Lemeshow’s test for measuring the concordance of the observed and predicted values of the dependent variable demonstrated that the null hypothesis (H0) was accepted (χ2 = 4.418, p = 0.818), revealing that there was no difference between the observed and predicted values.
Occupational status (p = 0.015) and occupational sector (p = 0.007) were statistically significant predictor variables. The differences between individual variables were interpreted using the odds ratio. Unemployed respondents demonstrated 0.322 times greater odds for using active transportation than full-time employed respondents. In relation to this finding, economic status cannot be used as evidence to define the use of active transportation. By contrast, respondents in the education sector were 5.857 times more likely to use active transportation than those in the healthcare and medical sector. This means, education background is important in the awareness of active transportation in the developments of both Bangsar and Shah Alam.
4.6 Home–Public Transportation Station Distance
Statistically significant differences between the means of ≥2 independent groups and the dependent variable were determined using one-way analysis of variance (ANOVA). The independent variables were gender, age, race, religion, marital status, education level, occupational status, occupational sector, and income level. The dependent variable was the home–public transportation station distance. Table 7 presents the ANOVA results on the home–public transportation station distance with sociodemographic background. The hypotheses are as follows:
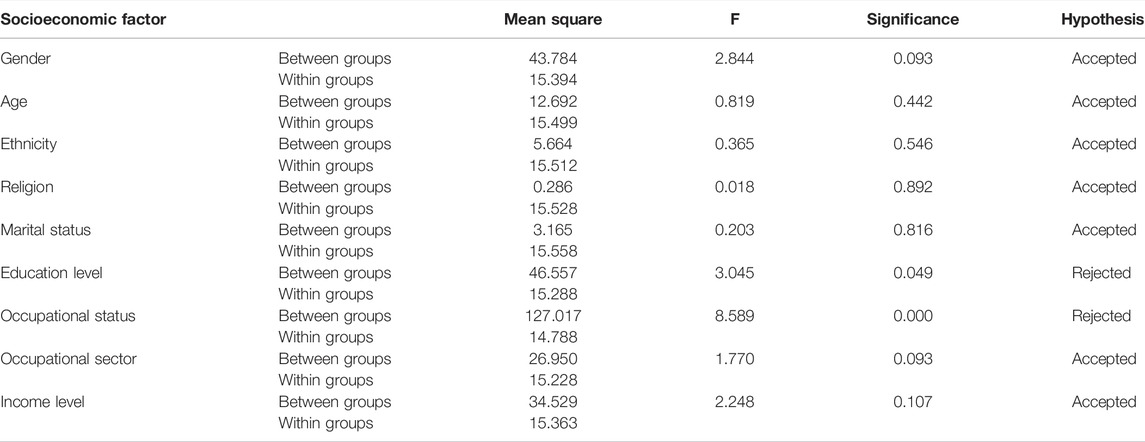
TABLE 7. ANOVA of home–public transportation station distance with sociodemographic background.
H0: There are no significant differences between the home–public transportation station distance and sociodemographic background;
H1: There are significant differences between the home–public transportation station distance and sociodemographic background.
Table 7, which exhibits the ANOVA results, demonstrates that there was a statistically significant difference between home–public transportation station distance and education level (F = 3.045, p = 0.049) and occupational status (F = 8.589, p = 0.000) groups. The results demonstrated that education level and occupational status significantly influenced the respondents’ decision to walk a certain distance to access the public transportation station. Hence, the alternative hypothesis (H1) was accepted, while the null hypothesis (H0) was rejected.
Table 8 presents the post hoc test results on home–public transportation station distance with education level and occupational status.
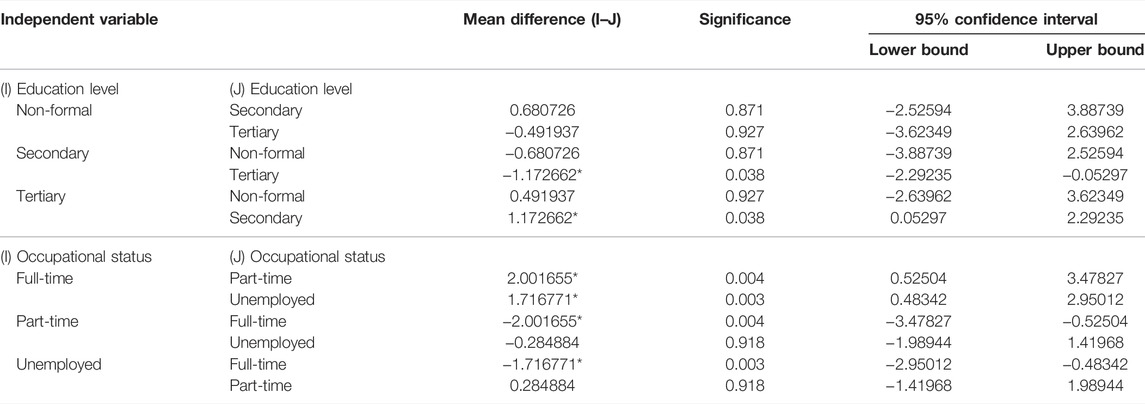
TABLE 8. Post hoc test for home–public transportation station distance with education level and occupational status.
Table 8 demonstrates that the mean home–public transportation station distance was significantly different between secondary and tertiary education levels (p = 0.038, 95% confidence interval [CI] = -2.29235, −0.05297). There was no statistically significant difference between the non-formal education with secondary-level (p = 0.871) and tertiary-level education groups (p = 0.927). Furthermore, Tukey’s HSD test revealed that the mean home–public transportation station distance was significantly different between full-time and part-time employment (p = 0.004, 95% CI = 0.52504, 3.47827) and between full-time employment and unemployment (p = 0.003, 95% CI = 0.48342, 2.95012). Part-time employment and unemployment were not statistically significantly different (p = 0.918).
4.7 Travel Cost and Socioeconomic Background
Statistically significant differences between daily travel costs and socioeconomic background were determined using ANOVA. Table 9 presents the ANOVA results for daily travel cost with sociodemographic background. The hypotheses are as follows:
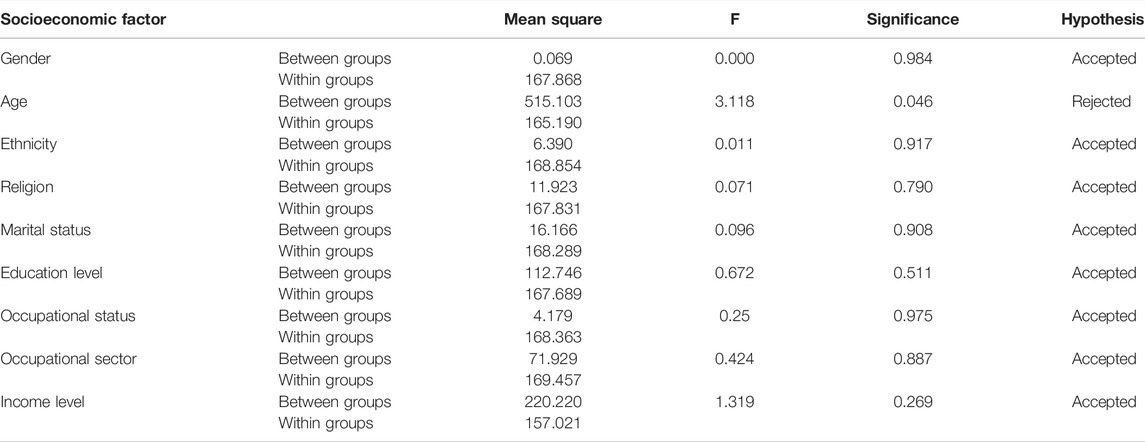
TABLE 9. ANOVA results for daily travel cost with sociodemographic background.
H0: There are no significant differences between travel cost and sociodemographic background;
H1: There are significant differences between travel cost and sociodemographic background.
The one-way ANOVA for comparing performed to compare the effect of the three age groups on daily travel cost revealed a statistically significant difference in mean daily travel cost between the age groups (F = 3.118, p = 0.046). Table 10 presents the post hoc test results for daily travel cost with age group. Tukey’s HSD test for multiple comparisons demonstrated that the mean daily travel cost was significantly different between young adults (18–35 years old) and older adults (≥56 years old) (p = 0.039, 95% CI = −14.2878, −0.2821). There was no statistically significant difference in daily travel cost between young adults and middle-aged adults (p = 0.788) or between middle-aged adults and older adults (p = 0.349).
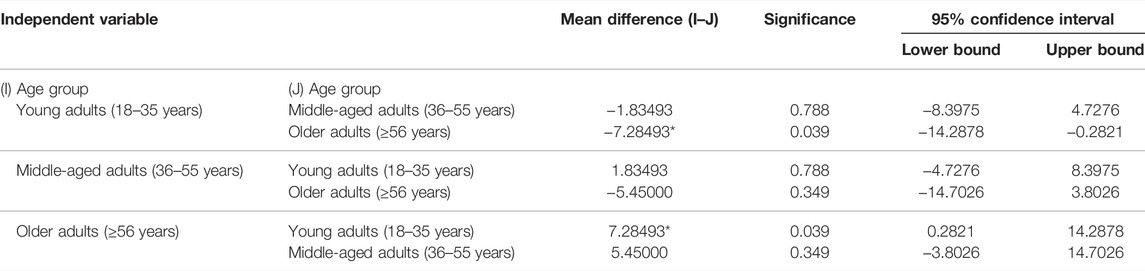
TABLE 10. Post hoc test for daily travel cost with age group.
5 Discussion
Active transportation use is an alternative sustainable means of transportation for creating walkable cities. This study focused on sociodemographic factors and their association with active transportation usage. The most influential sociodemographic factors were further investigated using statistical analysis. Some studies considered sociodemographic factors as variables in determining modes of transport. Apart from this, the criteria (safety, comfort, distance, weather condition, cost, and health) encouraging the willingness to walk and cycle among users from different socioeconomic backgrounds were also assessed. In terms of opinion toward active transportation, most respondents used active transportation for short trips only, indicating that most people are willing to walk short distances. Most cities are composed of mixed neighborhoods, where residential, education, and business centers are within convenient walking distance of each other.
For the criteria of using active transportation, most respondents preferred safe and comfortable pedestrian walkways. Most of the respondents were willing to walk <500 m or <10 min from their home to the public transportation station. Although distance is becoming the primary consideration for active transportation usage, the different public transportation types and trip purposes play significant roles in determining the pedestrians’ desired walking distance. People are apparently walking farther from home to access train services as compared to the bus. Thus, most transit stations were built appropriately to minimize walking distance and time.
Most of the respondents stated that good weather and health were among their reasons for using active transportation. Weather and climate have become influential factors in determining transport mode choice. People tend to use active transportation when the weather is good, while the opposite is also true, whereas some people do not depend on weather conditions when deciding to walk or cycle. On the contrary, this study demonstrated that travel cost and other reasons, such as support from family and friends, provision of bathing and changing facilities, remuneration from the employer, and obligation, were non-significant criteria for the respondents’ decision regarding active transportation.
A binomial logistic regression model was used to investigate how active transportation related to individual sociodemographic factors. The logistic regression model revealed that there was a significant relationship between occupational status and occupational sector with active transportation usage to public transportation stations. Nevertheless, gender, age, ethnicity, religion, marital status, education level, and income level were not significantly related to active transportation use. Here, unemployed respondents were likely to walk and cycle in daily travel. Few studies have acknowledged occupational sector as a determinant in active transportation use. In this study, respondents who worked in the education sector were more likely to walk as compared with those in the medical sector. This was a new discovery; hence, the occupational sector should be considered in future planning of active transportation facilities and policies.
The ANOVA on home–public transportation station distance with socioeconomic background demonstrated that education level and occupational status statistically influenced the distance in accessing public transportation stations. Moreover, the ANOVA results also demonstrated that the respondents’ daily travel cost was statistically influenced by age-group. Notably, age was a vital determinant in the choice of transportation mode. From the findings, youths, especially students, are more likely to use active transportation in daily travel. This is due to the fact that they travel to school, which is within walking distance, and perhaps because they do not possess a driving license. This study has a few limitations: The number of respondents was not fairly dispersed due to the pandemic and because this study focused on sociodemography. Hence, future studies should use a large-scale survey that encompasses all sociodemographic aspects for assessing the comprehensive prospect of active transportation use.
6 Conclusion
This study focused on sociodemography and the facilities to support them, which will eventually be used in determining transportation policies to encourage active transportation use in Bangsar and Shah Alam. Nevertheless, the results might differ in other urban settings. Based on these study findings, we have found significant conclusions in occupational status and occupational sector on the use of active transportation. Although there are no significant conclusions in gender, age, ethnicity, or religion, we believe that the size of the data sampling might influence the result; thus we suggest that in future studies, larger sampling is needed to discover meaningful findings related to these types of variables. Also, the result may also suggest that in Bangsar and Shah Alam, variables such as gender, age, ethnicity, and religion do not play a main factor in the use of active transportation, due to the majority of one religion and one ethnicity among active transportation users. Although we anticipated that women might dominate men, due to the pandemic, we were not able to prove this argument. From the findings, we also find that being educated is important in active transportation, as active transportation is not seen as culture but as one of the benefits of physical and mental health. Changing the mentality of people toward active transportation from leisure to way of life and as part of the daily commute needs more than just an educational background. To inculcate walking and cycling among people of different sociodemographic backgrounds has to start at an early age and by having walkable environments that encourage them to walk. This can be done by having smaller commercial lots near residential areas, instead of a hypermarket with ample parking spaces located far from residential areas. In addition, more pocket parks which are easily accessible to the children and the location of schools where children can easily walk to school could nurture and change the mindset about active transportation. We also found that there is evidence that short trips are preferable, therefore it is logical to plan for better walkability and to facilitate active transportation regardless of sociodemographic background. In conclusion, we have found that certain aspects of sociodemographic background like education and occupation type can influence active transportation. Despite the limitations, this study examined the association between sociodemographic background and active transportation use for daily travel. Generally, active transportation use is determined by some sociodemographical characteristics with certain parameters. It is hoped that these findings will aid the relevant authorities in future planning and development of active transportation.
Data Availability Statement
The original contributions presented in the study are included in the article/supplementary material, and further inquiries can be directed to the corresponding author.
Ethics Statement
The studies involving human participants were reviewed and approved by University Malay. Written informed consent for participation was not required for this study in accordance with national legislation and institutional requirements.
Author Contributions
All authors listed have made a substantial, direct, and intellectual contribution to the work and approved it for publication. YASH is the principal author that design the study, concept and contribute to the main interpretation of results, SK is responsible in the data analysis and interpretation of results, NR contributes in the writing and the revision of the manuscript and NI work on the data collection and data analysis.
Conflict of Interest
The authors declare that the research was conducted in the absence of any commercial or financial relationships that could be construed as a potential conflict of interest.
Publisher’s Note
All claims expressed in this article are solely those of the authors and do not necessarily represent those of their affiliated organizations, or those of the publisher, the editors, and the reviewers. Any product that may be evaluated in this article, or claim that may be made by its manufacturer, is not guaranteed or endorsed by the publisher.
Acknowledgments
We would like to acknowledge Universiti Malaya for the IIRG grant (IIRG009B-19SAH) and everyone who contributed to this research during the COVID-19 pandemic.
References
Adkins, A., Dill, J., Luhr, G., and Neal, M. (2012). Unpacking Walkability: Testing the Influence of Urban Design Features on Perceptions of Walking Environment Attractiveness. J. Urban Des. 17 (4), 499–510. doi:10.1080/13574809.2012.706365
Arshad, A. K., Bahari, N. I., Hashim, W., and Abdul Halim, A. G. (2016). Gender Differences in Pedestrian Perception and Satisfaction on the Walkability of Kuala Lumpur City Center. MATEC Web Conf. 47 (4), 03003. doi:10.1051/matecconf/20164703003
Carlson, J. A., Sallis, J. F., Kerr, J., Conway, T. L., Cain, K., Frank, L. D., et al. (2014). Built Environment Characteristics and Parent Active Transportation Are Associated with Active Travel to School in Youth Age 12-15. Br. J. Sports Med. 48 (22), 1634–1639. doi:10.1136/bjsports-2013-093101
Chillón, P., Evenson, K. R., Vaughn, A., and Ward, D. S. (2011). A Systematic Review of Interventions for Promoting Active Transportation to School. Int. J. Behav. Nutr. Phys. Activity 8, 1115–1134. doi:10.1016/j.ypmed.2018.02.010
Daniels, R., and Mulley, C. (2011). Explaining Walking Distance to Public Transport: The Dominance of Public Transport Supply. J. Transp. Land Use 6 (2), 5–20. doi:10.5198/jtlu.v6i2.308
ESRI (Environmental Systems Research Institute). (2021) Introducing StoryMaps. Available at: https://www.esri.com/en-us/home (Accessed November 2021).
González, S. A., Aubert, S., Barnes, J. D., Larouche, R., and Tremblay, M. S. (2020). Profiles of Active Transportation Among Children and Adolescents in the Global Matrix 3.0 Initiative: A 49-Country Comparison. Int. J. Environ. Res. Public Health 17 (16), 1–29. doi:10.3390/ijerph17165997
González, S. A., Castiblanco, M. A., Arias-Gómez, L. F., Martinez-Ospina, A., Cohen, D. D., Holguin, G. A., et al. (2017). Results from Colombia's 2016 Report Card on Physical Activity for Children and Youth. J. Phys. Activity Health 13, S129–S136. doi:10.1123/jpah.2016-0369
Grasser, G., Van Dyck, D., Titze, S., and Stronegger, W. (2013). Objectively Measured Walkability and Active Transport and Weight-Related Outcomes in Adults: A Systematic Review. Int. J. Public Health 58 (4), 615–625. doi:10.1007/s00038-012-0435-0
Gul, Y., Sultan, Z., and Jokhio, G. A. (2018). The Association between the Perception of Crime and Walking in Gated and Non-gated Neighbourhoods of Asian Developing Countries. Heliyon 4 (8), e00715–476. doi:10.1016/j.heliyon.2018.e00715
Heinen, E., Maat, K., and van Wee, B. (2011). Day-to-Day Choice to Commute or Not by Bicycle. Transp. Res. Rec. 2230, 9–18. doi:10.3141/2230-02
Heinen, E., Maat, K., and van Wee, B. (2013). The Effect of Work-Related Factors on the Bicycle Commute Mode Choice in the Netherlands. Transportation 40 (1), 23–43. doi:10.1007/s11116-012-9399-4
Hilland, T. A., Bourke, M., Wiesner, G., Garcia Bengoechea, E., Parker, A. G., Pascoe, M., et al. (2020). Correlates of Walking Among Disadvantaged Groups: A Systematic Review. Health & Place 63 (3), 102337. doi:10.1016/j.healthplace.2020.102337
Jamal, S., and Mohiuddin, H. (2020). Active Transportation Indicators and Establishing Baseline in a Developing Country Context: A Study of Rajshahi, Bangladesh. Growth Change 51 (4), 1894–1920. doi:10.1111/grow.12420
Jensen, A. F., Cherchi, E., and de Dios Ortúzar, J. (2014). A Long Panel Survey to Elicit Variation in Preferences and Attitudes in the Choice of Electric Vehicles. Transportation 41, 973–993. doi:10.1007/s11116-014-9517-6
Jensen, W. A., Brown, B. B., Smith, K. R., Brewer, S. C., Amburgey, J. W., and McIff, B. (2017). Active Transportation on a Complete Street: Perceived and Audited Walkability Correlates. Int. J. Environ. Res. Public Health 14 (9), 1014. doi:10.3390/ijerph14091014
Kim, E. J., Kim, J., and Kim, H. (2020). Neighborhood Walkability and Active Transportation: A Correlation Study in Leisure and Shopping Purposes. Ijerph 17, 2178. doi:10.3390/ijerph17072178
Larouche, R., Saunders, T. J., Faulkner, G. E. J., Colley, R., and Tremblay, M. (2014). Associations between Active School Transport and Physical Activity, Body Composition, and Cardiovascular Fitness: A Systematic Review of 68 Studies. J. Phys. Activity Health 11 (1), 206–227. doi:10.1123/jpah.2011-0345
Loo, L. Y. L., Corcoran, J., Mateo-Babiano, D., and Zahnow, R. (2015). Transport Mode Choice in South East Asia: Investigating the Relationship between Transport Users’ Perception and Travel Behaviour in Johor Bahru, Malaysia. J. Transp. Geogr. 46, 99–111. doi:10.1016/j.jtrangeo.2015.06.011
Lubans, D. R., Boreham, C. A., Kelly, P., and Foster, C. E. (2011). The Relationship between Active Travel to School and Health-Related Fitness in Children and Adolescents: A Systematic Review. Int. J. Behav. Nutr. Phys. Act. 8 (5), 1–12. doi:10.1186/1479-5868-8-5
Lyu, Y., and Forsyth, A. (2021). Attitudes, Perceptions, and Walking Behavior in a Chinese City. J. Transp. Health 21 (3), 101047. doi:10.1016/j.jth.2021.101047
Marczyk, G., DeMatteo, D., and Festinger, D. (2005). ‘Essentials of Research Design and Methodology,’ in Essentials of Behavioral Science Series (USA: John Wiley & Sons). http://www.mgmiom.org/downloads/MBA/Wiley,%20Essentials%20Of%20Research%20Design%20And%20Methodology.pdf.
Marquet, O., Hipp, J. A., and Miralles-Guasch, C. (2017). Neighborhood Walkability and Active Ageing: A Difference in Differences Assessment of Active Transportation over Ten Years. J. Transp. Health 7, 190–201. doi:10.1016/j.jth.2017.09.006
Mau, M., Nielsen, D. S., Jakobsen, I. S., Klausen, S. H., and Roessler, K. K. (2021). Mental Movements: How Long‐distance Walking Influences Reflection Processes Among Middle‐age and Older Adults. Scand. J. Psychol. 62 (3), 365–373. doi:10.1111/sjop.12721
McCormack, G. R., and Shiell, A. (2011). In Search of Causality: a Systematic Review of the Relationship between the Built Environment and Physical Activity Among Adults. Int. J. Behav. Nutr. Phys. Act. 8, 125. doi:10.1186/1479-5868-8-125
Ministry of Transport Malaysia (2020). Malaysia Transportation Statistics 2020. Available at: https://www.mot.gov.my/en/Statistik%20Tahunan%20Pengangkutan/Transport%20Statistics%20Malaysia%202020.pdf (Accessed November, 2020).
Papageorgiou, G., Balamou, E., Efstathiadou, T., Xergia, S., and Maimaris, A. (2018). Examining Ways to Enhance Active Transportation and the Impact on Commuters’ Health, Wellbeing and Sustainable Development. PeerJ Prepr. 6, e26690v1. doi:10.7287/peerj.preprints.26690v1
Polis Di-Raja Malaysia (2020). Statistik Kemalangan Jalan Raya 2020. Available at: https://www.data.gov.my/data/ms_MY/dataset/?tags=kemalangan&organization=Polis+Diraja+Malaysia+%28PDRM%29 (Accessed November, 2020).
Rabl, A., and De Nazelle, A. (2012). Benefits of Shift from Car to Active Transport. Transp. Policy 19 (1), 121–131. doi:10.1016/j.tranpol.2011.09.008
Rišová, K., and Madajová, M. S. (2020). Gender Differences in a Walking Environment Safety Perception: A Case Study in a Small Town of Banská Bystrica (Slovakia). J. Transp. Geogr. 85, 102723. doi:10.1016/j.jtrangeo.2020.102723
Saelens, B. E., Sallis, J. F., and Frank, L. D. (2003). Environmental Correlates of Walking and Cycling: Findings from the Transportation, Urban Design, and Planning Literatures. Ann. Behav. Med. 25 (2), 80–91. doi:10.1207/S15324796ABM2502_03
Sallis, J. F., Frank, L. D., Saelens, B. E., and Kraft, M. K. (2004). Active Transportation and Physical Activity: Opportunities for Collaboration on Transportation and Public Health Research. Transp. Res. Part A Policy Pract. 38 (4), 249–268. doi:10.1016/j.tra.2003.11.003
Sarker, R. I., Mailer, M., and Sikder, S. K. (2019). Walking to a Public Transport Station: Empirical Evidence on Willingness and Acceptance in Munich, Germany. Smart Sustain. Built Environ. 9 (1), 38–53. doi:10.1108/SASBE-07-2017-0031
Seong, E. Y., Lee, N. H., and Choi, C. G. (2021). Relationship between Land Use Mix and Walking Choice in High-Density Cities: A Review of Walking in Seoul, South Korea. Sustainability 13 (2), 810. doi:10.3390/su13020810
Tirachini, A., and Cats, O. (2020). COVID-19 and Public Transportation: Current Assessment, Prospects, and Research Needs. J. Public Transp. 22 (1), 1–21. doi:10.5038/2375-0901.22.1.1
United Nations (2021). The Sustainable Development Goals Report 2021. Available at: https://unstats.un.org/sdgs/report/2021/The-Sustainable-Development-Goals-Report-2021.pdf (Accessed January, 2021).
Williams, G. C., Borghese, M. M., and Janssen, I. (2017). Neighborhood Walkability and Objectively Measured Active Transportation Among 10-13 Year Olds. J. Transp. Health 8, 202–209. doi:10.1016/j.jth.2017.12.006
Yazid, M. R. M., Borhan, M. N., Yaakub, N. M. I. T., and Jamaludin, S. A. (2017). Pemodelan Kesediaan Masyarakat Beranjak Kepada Pengangkutan Aktif. Sains Humanika 9 (3), 43–49. doi:10.11113/sh.v9n3.1208
Young, D. R., Cradock, A. L., Eyler, A. A., Fenton, M., Pedroso, M., Sallis, J. F., et al. (2020). Creating Built Environments that Expand Active Transportation and Active Living across the United States: A Policy Statement from the American Heart Association. Circulation 142 (11), 167–183. doi:10.1161/CIR.0000000000000878
Keywords: sustainable, walkability, active transportation, sociodemographic, Malaysia
Citation: Harumain YAS, Koting S, Rosni NA and Ibrahim N (2022) The Influence of Sociodemographic Background on Active Transportation: A Case Study of Bangsar and Shah Alam, Malaysia. Front. Built Environ. 8:925956. doi: 10.3389/fbuil.2022.925956
Received: 22 April 2022; Accepted: 20 May 2022;
Published: 02 August 2022.
Edited by:
Irina Makarova, Kazan Federal University, RussiaReviewed by:
Jozef Stoklosa, University of Economics and Innovation, PolandFiras Alrawi, University of Baghdad, Iraq
Copyright © 2022 Harumain, Koting, Rosni and Ibrahim. This is an open-access article distributed under the terms of the Creative Commons Attribution License (CC BY). The use, distribution or reproduction in other forums is permitted, provided the original author(s) and the copyright owner(s) are credited and that the original publication in this journal is cited, in accordance with accepted academic practice. No use, distribution or reproduction is permitted which does not comply with these terms.
*Correspondence: Yong Adilah Shamsul Harumain, YWRpbGFoX3NoYW1zdWxAdW0uZWR1Lm15