 Vladimir Shepelev
 Ivan Slobodin
 Alexandr Gritsenko
 Olga Fadina
- 1Department of Road Transport, South Ural State University, Chelyabinsk, Russia
- 2Department of Machine-Tractor Fleet Operation, South Ural State Agrarian University, Chelyabinsk, Russia
1 Introduction
Continuous urbanization has led to a significant increase in traffic density in large cities and a concomitant growth of vehicle emissions (Davis et al., 2005; Perugu, 2019). An effective way to protect public health is air quality forecasting through early warning of the concentration of harmful substances in the air (Bai et al., 2016). The authors proposed a hybrid model to predict the concentration of air pollutants. The model is based on combining the empirical mode decomposition method, the sample entropy index, and a bidirectional neural network with long and short-term memory (Teng et al., 2022). In several-days-ahead forecasting tasks, the researchers presented an ensemble system for multi-step PM 2.5 forecasting in urban areas. The authors applied support vector regression based on the least squares method in conjunction with the capabilities of a neural network (LSTM) (Tong et al., 2019; Ahani et al., 2020; Petry et al., 2021). Studies on training parallel artificial networks based on AutoRegressive with eXternal input models (Alkasassbeh et al., 2013) are focused on modelling air pollution parameters (Feng et al., 2019). presents a method for estimating PM 2.5 transfer rates based on complex relationships between air pollutants, urban development, and meteorology. To obtain a highly accurate forecast of changes in the concentration of harmful pollutants, researchers have developed a hybrid model based on Empirical Wavelet Transform and a deep learning neural network (Kim et al., 2021; Zeng et al., 2022). Several researchers focused on the development of highly accurate emission models at the level of individual vehicles due to their diversity, driving conditions, and other factors (Motallebiaraghi et al., 2021; Makarova et al. (2020)).
Studies on the development of prediction models are generally focused on the final assessment of the concentration of atmospheric emissions, taking into account all urban pollutants (Deep et al., 2021). Thus, Kleine Deters et al. (2017), Rybarczyk and Zalakeviciute (2016), Ni et al. (2017), Han et al. (2018) propose a machine learning approach to forecast PM 2.5 concentrations based on the analysis of meteorological data, including the average regional precipitation, average daily temperature, average relative humidity, average wind speed, maximum wind speed, and pollution data. At the same time, Li et al. (2015) revealed negative correlations between other meteorological parameters and PM 2.5, with the exception of the average atmospheric pressure. A prediction model built on a dataset of many variables with relatively few observations can cause accuracy issues and restrict the performance of a deep learning model (Choi and Kim, 2021).
However, this is still challenging due to limited information on the primary source of emissions (road traffic) and the high uncertainty of dynamic processes (Adams and Kanaroglou, 2016; Shepelev et al., 2021). This study proposes a new hybrid model based on the use of a convolutional (YOLOv4) and recurrent (LSTM) neural network to improve the accuracy of forecasting the changes in the concentration of traffic-related particulate matter.
This study is aimed at developing a hybrid prediction model to quantify road traffic parameters, i.e. forecast the number of vehicles by their driving directions. To achieve this goal, we divide the task into two subtasks: collection of data on the number of vehicles and short-term forecast.
2 Data and Methods
2.1 Data Collection
An important component of urban air quality engineering is traffic-related emission management, which depends on the number and type of vehicles and their dynamic performance indicators (Wen et al., 2019; Kelp et al., 2020; Glushkov and Shepelev, 2021). According to international methodologies and approved standards (Ntziachristos et al., 2009; garantru, 2019; GOST R 56162-2019, 2019), the amount of emissions is primarily determined by the amount, type, and nature of traffic flows (Equation):
where: L0 is length of the road section, km;
In this study, we have focused on developing a prediction model for estimating the number of vehicles. Considering that traffic is concentrated at urban intersections, we have focused on one of the busiest intersections in the city of Chelyabinsk, Russia (AIMS eco, 2022 ). A dataset of many variables with relatively few observations can cause a dimensionality issue and restrict the performance of a deep learning model. We received a continuous data stream from a street video surveillance camera with a large viewing angle and a stable video stream (25 frames per second), supporting a 1920 × 1,080 resolution. We trained and modified the YOLOv4 convolutional neural network to collect data on traffic parameters, such as the number, trajectory, speed, and idle time of vehicles (Figure 1) (Gorodokin et al., 2020; Shepelev et al., 2020; Winter et al., 2021; Shepelev et al., 2022).
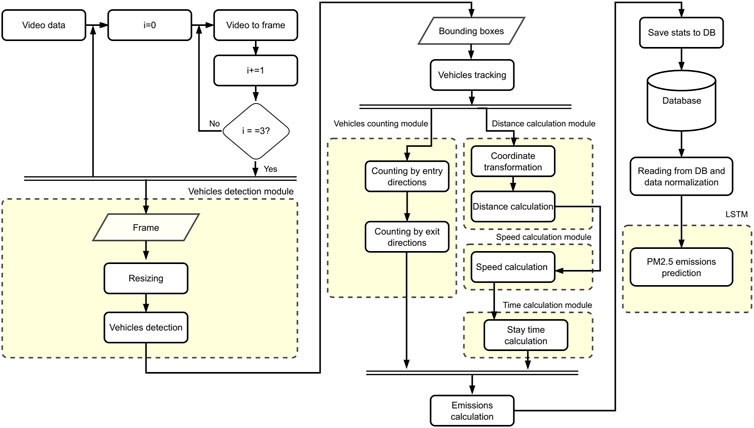
FIGURE 1. An algorithm of a hybrid model for vehicle forecasting.
2.2 Emission Forecasting
The recurrent neural network was implemented in the Python programming language using the Keras library. This is an open library, which is a high-level API facilitating the operation of neural networks and capable of working as an add-in for TensorFlow (an open machine learning library to build and train neural networks).
A dataset was formed for training and testing the neural network. We extracted the latest records from a database created by a system based on the YOLOv4 convolutional neural network and aggregated them into 20-min time intervals, in which the amount of PM2.5 emissions was summed for all transport directions and categories. Thus, we had 1,500 records for about 3 weeks. The data were divided into training and test samples in the ratio of 85%–15%.
A set of 72 24-h time intervals was chosen as the input data of the neural network used as a basis for training and forecasting. The dataset contained three parameters: the amount of PM2.5 emissions, the day of the week, and the index of the time interval in days. Thus, the shape of the two-dimensional input dataset is (72, 3).
A set of 72 time intervals with one parameter (amount of PM2.5 emissions) was chosen as the output (predicted value). The shape of the two-dimensional output dataset is (72, 1).
All input and output data were converted to the interval [0,1] for normalization. For each 20-min time interval, the amount of PM2.5 emissions was divided by the maximum value in the entire dataset equal to 30. Each weekday from the interval 0 … 6, where 0 is Monday and six is Sunday, was divided by 6. Each time interval in the interval 0 … 71, where 0 is the interval from 0:00 to 0:20 and 71 is the interval from 23:40 to 00:00, was divided by 71.
To find the best neural network configuration, we have implemented a program that generates several configurations, trains each configuration, conducts tests, and evaluates the work quality.
To evaluate the quality of the neural network, we chose the mean square error (mse), the mean absolute error (mae), and the maximum absolute error (Mae).
The following layers were chosen to create configurations:
• LSTM (recurrent layer).
• Dropout with the rate = 0.2 (a layer that prevents over-training by ignoring randomly selected neurons during training). This layer follows each LSTM layer.
• Dense (an output layer reconfiguring the data into the desired format).
We tested 32 configuration options with different parameters:
• the number of LSTM layers: 1, 2, 3, 4;
• the number of neurons in each of the LSTM layers: 50, 100, 250, 400, 600, 800, 1,000, 1,200.
The number of learning epochs: 500.
The following results were obtained as a result of training and testing.
• 1 layer:
o mse: 0.097–0.194;
o mae: 1.143–1.577;
o Mae: 9.553–10.077;
o training time: 5.17–101.75 s; o average operation time: 0.027–0.065 s;
• 2 layers:
o mse: 0.092–0.149;
o mae: 1.109–1.39;
o Mae: 8.541–10.058;
o training time: 8.42–307.76 s; o average operation time: 0.033–0.121 s;
• 3 layers:
o mse: 0.081–0.13;
o mae: 1.013–1.326;
o Mae: 8.347–9.757;
o training time: 12.92–527.34 s; o average operation time: 0.038–0.181 s;
• 4 layers:
o mse: 0.083–0.124;
o mae: 1.068–1.324;
o Mae: 8.372–10.657;
o training time: 16.77–697.52 s; o average operation time: 0.048–0.251 s
As a result of testing, configuration 24 with 3 layers and 1,200 neurons in each layer showed the minimum errors (mse: 0.081; mae: 1.013; Mae: 8.347; training time: 527.34 s; average operation time: 0.181 s). However, this configuration spends much time on training and operation. Another optimal configuration is 29 with 4 layers and 600 neurons in each layer (mse: 0.083; mae: 1.068; Mae: 9.245; training time: 212.32 s; average operation time: 0.086 s). It is close in quality to the first configuration but is 2.5 times faster.
We have also found that configurations with 50 and 100 neurons in any number of layers show poor results. Configurations with 1 and 2 layers are worse than the others. Configurations with 1,000 and 1,200 neurons spend a lot of time on training and work and do not show much better results.
As a result of the experiments, we have determined that the accuracy of forecasting the number of vehicles crossing the studied intersection varies in the range of 80%–96% using a limited number of measurements.
3 Discussion
Accuracy of the hybrid model is superior to the considered methods and allows us to continue optimizing the model to increase the depth of forecasting and taking into account the influence of buildings and additional meteorological predicts.
The proposed predictor architecture does not only use the advantages of the fast extraction of data bulks from a convolutional neural network, but also incorporates the efficiency of the long-term feature extraction of the LSTM recurrent neural network.
Future research will expand this methodology capable of short-term forecasting (per day) and allow us to proceed to long-term forecasting (up to 7 days) with potential model self-learning, based on the continuous accumulation of data history.
4 Conclusion
Thus, we can conclude that the proposed model for forecasting traffic-related pollutant emissions built on convolutional and recurrent neural networks is superior to the competing models in terms of its forecast accuracy. The main findings of this study are summarized as follows:
1. The proposed model is an effective method for improving the accuracy of deep learning neural network models to forecast the amount and concentration of air pollutants.
2. High-quality road traffic monitoring and choosing features, taking into account spatial-time correlations and characteristics of urban development, can improve significantly the predictability.
3. The YOLOv4 neural network is a good option for extracting features to forecast road traffic parameters, which provides for environmental risk management.
Author Contributions
VS: Conceptualization, methodology, investigation, visualization, writing—review and editing, supervision. IS: Software, validation, writing—original draft, AG: Data curation, writing—original draft, OF: review and editing.
Funding
This research was supported by Russian Science Foundation, grant number 22-21-20057.
Conflict of Interest
The authors declare that the research was conducted in the absence of any commercial or financial relationships that could be construed as a potential conflict of interest.
Publisher’s Note
All claims expressed in this article are solely those of the authors and do not necessarily represent those of their affiliated organizations, or those of the publisher, the editors and the reviewers. Any product that may be evaluated in this article, or claim that may be made by its manufacturer, is not guaranteed or endorsed by the publisher.
References
Adams, M. D., and Kanaroglou, P. S. (2016). Mapping Real-Time Air Pollution Health Risk for Environmental Management: Combining Mobile and Stationary Air Pollution Monitoring with Neural Network Models. J. Environ. Manag. 168, 133–141. doi:10.1016/j.jenvman.2015.12.012
Ahani, I. K., Salari, M., and Shadman, A. (2020). An Ensemble Multi-Step-Ahead Forecasting System for Fine Particulate Matter in Urban Areas. J. Clean. Prod. 263 (5), 120983. doi:10.1016/j.jclepro.2020.120983
AIMS eco (2022). Real-time Monitoring. Available at: http://aims.susu.ru/view (Accessed May 02, 2022).
Alkasassbeh, M., Sheta, A. F., Faris, H., and Turabieh, H. (2013). Prediction of PM10 and Tsp Air Pollution Parameters Using Artificial Neural Network Autoregressive, External Input Models: A Case Study in Salt, Jordan. Middle East J. Sci. Res. 14 (7), 999–1009. doi:10.5829/idosi.mejsr.2013.14.7.2171
Bai, Y., Li, Y., Wang, X., Xie, J., and Li, C. (2016). Air Pollutants Concentrations Forecasting Using Back Propagation Neural Network Based on Wavelet Decomposition with Meteorological Conditions. Atmos. Pollut. Res. 7 (3), 557–566. doi:10.1016/j.apr.2016.01.004
Choi, S., and Kim, B. (2021). Applying PCA to Deep Learning Forecasting Models for Predicting PM2.5. Sustainability 13 (7), 3726. doi:10.3390/su13073726
Davis, N., Lents, J., Osses, M., Nikkila, N., and Barth, M. (2005). Development and Application of an International Vehicle Emissions Model. Transp. Res. Rec. 1939, 156–165. doi:10.1177/0361198105193900118
Deep, B., Mathur, I., and Joshi, N. (2021). An Approach to Forecast Pollutants Concentration with Varied Dispersion. Int. J. Environ. Sci. Technol. 19, 5131–5138. doi:10.1007/s13762-021-03378-z
Feng, R., Zheng, H.-J., Gao, H., Zhang, A.-R., Huang, C., Zhang, J.-X., et al. (2019). Recurrent Neural Network and Random Forest for Analysis and Accurate Forecast of Atmospheric Pollutants: A Case Study in Hangzhou, China. J. Clean. Prod. 231, 1005–1015. doi:10.1016/j.jclepro.2019.05.319
garant.ru (2019). Order of the Ministry of Natural Resources and Ecology of the Russian Federation No. 804 Dated November 27, 2019 on Approval of the Methodology for Determining Emissions of Pollutants into the Atmospheric Air from Mobile Sources for Conducting Summary Calculations of Atmospheric Air Pollution. Available at: https://www.garant.ru/products/ipo/prime/doc/73240708/(Accessed November 10, 2021).
Glushkov, A., and Shepelev, V. (2021). Development of Reliable Models of Signal-Controlled Intersections. Transp. Telecommun. 22 (4), 417–424. doi:10.2478/ttj-2021-0032
Gorodokin, V., Shepelev, V., Buyvol, P., and Shepeleva, E. (2020). Method of Non-stop Passage of Signal-Controlled Intersections Using Dynamic Signs and Computer Vision. Transp. Res. Procedia 50, 174–181. doi:10.1016/j.trpro.2020.10.022
GOST R 56162-2019 (2019). Emissions of Pollutants into the Atmosphere. Method for Calculating the Amount of Emissions of Pollutants into the Atmosphere by Flows of Motor Vehicles on Highways of Different Categories. Available at: https://docs.cntd.ru/document/1200167788 (Accessed November 10, 2021).
Han, L., Zhou, W., and Li, W. (2018). Growing Urbanization and the Impact on Fine Particulate Matter (PM2.5) Dynamics. Sustainability 10 (6), 1696. doi:10.3390/su10061696
Kelp, M., Gould, T., Austin, E., Marshall, J. D., Yost, M., Simpson, C., et al. (2020). Sensitivity Analysis of Area-wide, Mobile Source Emission Factors to High-Emitter Vehicles in Los Angeles. Atmos. Environ. 223, 117212. doi:10.1016/j.atmosenv.2019.117212
Kim, J., Wang, X., Kang, C., Yu, J., and Li, P. (2021). Forecasting Air Pollutant Concentration Using a Novel Spatiotemporal Deep Learning Model Based on Clustering, Feature Selection and Empirical Wavelet Transform. Sci. Total Environ. 801, 149654. doi:10.1016/j.scitotenv.2021.149654
Kleine Deters, J., Zalakeviciute, R., Gonzalez, M., and Rybarczyk, Y. (2017). Modeling PM2.5 Urban Pollution Using Machine Learning and Selected Meteorological Parameters. J. Electr. Comput. Eng. 2017, 1–14. doi:10.1155/2017/5106045
Li, Y., Chen, Q., Zhao, H., Wang, L., and Tao, R. (2015). Variations in PM10, PM2.5 and PM1.0 in an Urban Area of the Sichuan Basin and Their Relation to Meteorological Factors. Atmosphere 6 (1), 150–163. doi:10.3390/atmos6010150
Makarova, I., Buyvol, P., Magdin, K., Pashkevich, A., Boyko, A., and Shubenkova, K. (2020). Usage of Microscopic Simulation to Estimate the Environmental Impact of Road Transport. Transp. Res. Procedia 44, 86–93. doi:10.1016/j.trpro.2020.02.013
Motallebiaraghi, F., Rabinowitz, A., Jathar, S., Fong, A., Asher, Z., and Bradley, T. (2021). High-Fidelity Modeling of Light-Duty Vehicle Emission and Fuel Economy Using Deep Neural Networks. SAE International, Technical Paper 2021-01-0181. doi:10.4271/2021-01-0181
Ni, X. Y., Huang, H., and Du, W. P. (2017). Relevance Analysis and Short-Term Prediction of PM 2.5 Concentrations in Beijing Based on Multi-Source Data. Atmos. Environ. 150, 146–161. doi:10.1016/j.atmosenv.2016.11.054
Ntziachristos, L., Gkatzoflias, D., Kouridis, C., and Samaras, Z. (2009). “COPERT: A European Road Transport Emission Inventory Model,” in Information Technologies in Environmental Engineering. Editors I.N. Athanasiadis, A.E. Rizzoli, P.A. Mitkas, and J.M. Gómez (Berlin: Springer), 491–504. Environmental Science and Engineering. doi:10.1007/978-3-540-88351-7_37
Perugu, H. (2019). Emission Modelling of Light-Duty Vehicles in India Using the Revamped VSP-Based MOVES Model: The Case Study of Hyderabad. Transp. Res. Part D Transp. Environ. 68, 150–163. doi:10.1016/j.trd.2018.01.031
Petry, L., Meiers, T., Reuschenberg, D., Mirzavand Borujeni, S., Arndt, J., Odenthal, L., et al. (2021). Design and Results of an Ai-Based Forecasting of Air Pollutants for Smart Cities. ISPRS Ann. Photogramm. Remote Sens. Spat. Inf. Sci. VIII-4/W1-2021 (4/W1-2021), 89–96. doi:10.5194/isprs-annals-VIII-4-W1-2021-89-2021
Rybarczyk, Y., and Zalakeviciute, R. (2016). “Machine Learning Approach to Forecasting Urban Pollution,” in 2016 IEEE Ecuador Technical Chapters Meeting (ETCM), Guayaquil, Ecuador, 12-14 Oct. 2016. ETCM. 7750810. doi:10.1109/ETCM.2016.7750810
Shepelev, V., Aliukov, S., Glushkov, A., and Shabiev, S. (2020). Identification of Distinguishing Characteristics of Intersections Based on Statistical Analysis and Data from Video Cameras. J. Big Data. 7 (1), 46. doi:10.1186/s40537-020-00324-7
Shepelev, V., Glushkov, A., Bedych, T., Gluchshenko, T., and Almetova, Z. (2021). Predicting the Traffic Capacity of an Intersection Using Fuzzy Logic and Computer Vision. Mathematics 9 (20), 2631. doi:10.3390/math9202631
Shepelev, V., Zhankaziev, S., Aliukov, S., Varkentin, V., Marusin, A., Marusin, A., et al. (2022). Forecasting the Passage Time of the Queue of Highly Automated Vehicles Based on Neural Networks in the Services of Cooperative Intelligent Transport Systems. Mathematics 10 (2), 282. doi:10.3390/math10020282
Teng, M., Li, S., Xing, J., Song, G., Yang, J., Dong, J., et al. (2022). 24-Hour Prediction of PM2.5 Concentrations by Combining Empirical Mode Decomposition and Bidirectional Long Short-Term Memory Neural Network. Sci. Total Environ. 821, 153276. doi:10.1016/j.scitotenv.2022.153276
Tong, W., Li, L., Zhou, X., Hamilton, A., and Zhang, K. (2019). Deep Learning PM2.5 Concentrations with Bidirectional LSTM RNN. Air Qual. Atmos. Health. 12 (4), 411–423. doi:10.1007/s11869-018-0647-4
Wen, Y., Wang, H., Larson, T., Kelp, M., Zhang, S., Wu, Y., et al. (2019). On-Highway Vehicle Emission Factors, and Spatial Patterns, Based on Mobile Monitoring and Absolute Principal Component Score. Sci. Total Environ. 676, 242–251. doi:10.1016/j.scitotenv.2019.04.185
Winter, H., Serra, J., Nesmachnow, S., Tchernykh, A., and Shepelev, V. (2021). Computational Intelligence for Analysis of Traffic Data. Commun. Comput. Info. Sci. 1359, 167–182. doi:10.1007/978-3-030-69136-3_12
Keywords: air pollution, particulate matter (PM 2.5), recurrent neural networks (LSTM), convolutional neural network (YOLOv4), traffic, deep learning
Citation: Shepelev V, Slobodin I, Gritsenko A and Fadina O (2022) Forecasting the Amount of Traffic-Related Pollutant Emissions by Neural Networks. Front. Built Environ. 8:945615. doi: 10.3389/fbuil.2022.945615
Received: 16 May 2022; Accepted: 26 May 2022;
Published: 14 June 2022.
Edited by:
Katarzyna Gdowska, AGH University of Science and Technology, PolandReviewed by:
Dmitrii Zakharov, Tyumen Industrial University, RussiaTimur Bakibayev, Almaty Management University, Kazakhstan
Copyright © 2022 Shepelev, Slobodin, Gritsenko and Fadina. This is an open-access article distributed under the terms of the Creative Commons Attribution License (CC BY). The use, distribution or reproduction in other forums is permitted, provided the original author(s) and the copyright owner(s) are credited and that the original publication in this journal is cited, in accordance with accepted academic practice. No use, distribution or reproduction is permitted which does not comply with these terms.
*Correspondence: Vladimir Shepelev, c2hlcGVsZXZ2ZEBzdXN1LnJ1