Abstract
This study applied the acoustic emission (AE) technique to investigate mechanical behaviors and failure processes of corroded and non-corroded reinforced concrete (RC) cylinders, subjected to compressive loading. RC cylinders with 150 mm diameter and 300 mm height were tested. A set of twelve specimens was arranged into four groups of three specimens. These were the specimens corroded at the initiation stage, at the acceleration stage, at the deterioration stage of rebars, and another group was prepared as non-corroded specimens. The other set of twelve specimen was corroded as the same as the one, but axial rebars were coated with epoxy resin. After performing electrical corrosion, by applying 200 mA current under salt water immersion of 3% chloride concentration, axial compression tests were conducted on all specimens up to failure, using the AE technique. The corrosion of rebars inside the cylinders trends to decrease the compressive load-carrying performance of the RC cylinders, with the occurrence of early damages during the axial compression test. The analysis of the measured AE parameters enabled the classification of the generated damages into shear-type and tensile-type damages, which provided a characteristic signature of the failure mechanism of the tested cylinders. Next, it provided a 3D visualization of the damage events location and evolution inside the cylinders. Then, it gave the means to correlate the damage process of the RC cylinders, with their specific condition related to their corrosion level, prior to the compression test.
1 Introduction
Concrete is the primary construction and repair material used in infrastructure such as highway bridges, high-rise buildings, and dams. In many countries, concrete structures fail to fulfill their designed lifetime because of the effects caused by their local environment. The problem is particularly serious when corrosion occurs in reinforcing steel bars, in reinforced concrete (RC) structures. It has been widely reported that carbonation and chloride attack are the two major causes of the corrosion of RC structures, affecting their load-bearing capacities and mechanical performances. In the salty environment, the rate of deterioration in RC structures highly increases, when chloride-induced corrosion occurs at reinforcing bars. Consequently, the expansion of corrosion implies rebar mass loss, and cracking, lifting then peeling of concrete cover. Moreover, it reduces the bond strength between concrete and rebar, and then affects the overall load-bearing capacities of the RC structure. In such situation, the maintenance and repair of corrosion-damaged infrastructure lead to the increase in their life-cycle costs, to maintain their functionality and safety. So, effective monitoring, reliable data analysis, rational data interpretation, and correct decision making for corrosion-damaged RC structures are some challenging problems for engineers who specialized in structural health assessment. In the field of damage monitoring and inspection, extensive attempts and advancements have been performed, to develop non-destructive testing (NDT) methods, which consist of investigating mechanical, acoustical, chemical, electrical, magnetic, and physical properties of materials (Stanley, 1995; Grosse et al., 1997; Ohtsu et al., 2002; Kurz et al., 2006; Schechinger and Vogel, 2007; Shiotani et al., 2009; Kawasaki et al., 2010; Aggelis et al., 2011; Aggelis, 2011; Aggelis et al., 2011; Kawasaki et al., 2013a; Farhidzadeh et al., 2013; Farhidzadeha et al., 2014; Kawasaki et al., 2015; Helal et al., 2015). Particularly, the acoustic emission (AE) technique is known to detect precursors due to damage nucleation.
According to a phenomenological model of rebar corrosion in seawater environments, it was reported that a typical corrosion loss during the corrosion process can be divided into four phases: a dormant stage, an initiation stage, an acceleration stage, and a deterioration stage (Melchers and Li, 2006; Kawasaki et al., 2015). Therefore, it is important to evaluate the performance of RC structures affected by different rates of chloride-induced rebar corrosion. Many studies focused on the effects of chloride attack, on the performance of plain concrete. Furthermore, relevant advancements were carried out through many studies related to the analysis of the effects of corrosion in RC structures (Goharrokhi et al., 2019; Anxin et al., 2018; Choe et al., 2020; Andisheh et al., 2018; Ge et al., 2019; JIS), particularly in vertical RC members. For instance, Pelle et al. (2021) investigated the long-term behavior of RC bridge columns. Lavorato et al. (2019) presented numerical analyses of RC sections under cyclic bending including buckling of steel reinforcement in compression and the effects of corrosion under chlorides-induced corrosion. A simplified model was used by Campione et al. (2016) to determine the axial load-carrying capacity of compressed short reinforced concrete columns subjected to corrosion processes. However, a limited number of studies adopted AE techniques (Xia et al., 2015; Shaojie et al., 2019).
Hence, this study intends to undertake the examination of the failure mechanisms of corroded and non-corroded RC cylinders, subjected to axial compressive loading, using the AE technique. For this purpose, one set of twelve cylinders, made with normal rebars, was arranged into three groups of three specimens. These specimens were corroded at the initiation stage, at the acceleration stage, and corroded at the deterioration stage of rebar corrosion, respectively. Another group was reserved as non-corroded specimens. The corrosion process was electrically accelerated applying 200 mA current under salt water immersion with 3% chloride concentration. The other set of twelve specimens was subjected to the same corrosion degrees as the one set, but axial rebars were coated with epoxy resin. Thereafter, axial compression tests were conducted on all specimens, and results were analyzed to correlate the compressive behaviors of RC cylinders with AE parameters.
2 Design and manufacture of specimens
In this study, the one set of twelve RC specimens are made of normal steel bars, while the other set of twelve specimens are made of coated bars with epoxy resin. Using epoxy-coated rebar can be alternative solution provided in any concrete, subjected to salt exposer area such as coastal or marine environment, to resist from corrosion and increase the service life of an RC structure. Epoxy-coated rebar may act as a barrier system intended to prevent moisture and chlorides from eroding the surface of the reinforcing bar. In both sets, deformed rebars are used as longitudinal bars with a diameter of 13 mm, and tie hoops are made of round rebar with a diameter of 9 mm as shown in Figure 1. RC cylinders are designed with 150 mm diameter and 300 mm height, where longitudinal rebars are connected to copper electrical cable wires for charging electricity (Figure 2). Table 1 presents mixture proportion of the concrete, and Table 2 shows the mechanical properties of rebars used to fabricate the cylinders. For each RC cylinder, three standard plain concrete cylinders, with 100 mm diameter and 200 mm height, were made at the same time. These concrete blocks are used to evaluate the static modulus of elasticity of the concrete at the time of performing compression test on each corresponding RC cylinder group. All the concrete blocks were cured under the same condition as the group of cylinders they belong to. They were prepared based on the Japanese Industrial Standards (JIS A 11321) (Li et al., 2020). After casting concrete, the specimens were moisture-cured for 28 days under tap water shower. Following the curing period, they were dried for 7 days under room condition then immersed in 3% NaCl solution for 7 days to promote the ingress of chloride ions. Before the immersion, the top and bottom sides of the specimens were coated with epoxy resin, to promote only lateral side chloride ingress, which could simulate salt attack in the real condition.
FIGURE 1
FIGURE 2
TABLE 1
| Water–cement ratio (%) | Sand-aggregate ratio (%) | kg/m3 | ||||||
|---|---|---|---|---|---|---|---|---|
| Cement: ordinary Portland cement | Sand | Gravel | Water | Water reducing agent (Cx0.8%) | Air entrainment (diluted 100 times, Cx0.4%) | |||
| Fine aggregate (05–15 mm) | Coarse aggregate (10–20 mm) | |||||||
| 50 | 46.5 | 332 | 808 | 489 | 489 | 166 | 2.66 | 0.66 |
| Targeted slump: 12 ± 2.5 cm | Targeted air content: 4.5 ± 1.5 | |||||||
Concrete mix design.
TABLE 2
| Type of rebar | Reinforcement | Diameter (mm) | Yield strength (MPa) | Tensile strength (MPa) | Elongation (%) | Elastic modulus (kN/mm2) |
|---|---|---|---|---|---|---|
| Deformed steel rebar | Axial rebar | 13 | 295 | 440 | >16 | 200 |
| Round steel rebar | Tie hoops | 9.5 | 245 | 400 | >17 | 200 |
Mechanical properties of rebar used in the cylinders.
3 Acoustic emission technique
3.1 Detection of acoustic emission
A wave-based system is applied to pick up transient waves propagated in a concrete structure by using AE sensors because the waves are reactive to nucleation of cracks and corrosion products as depicted in Figure 3 (Sohn et al., 2004). Thus, the AE technique is a unique, non-invasive, and passive NDT method. AE is a class of phenomena whereby transient elastic waves from a localized source within a material and conversion of the waves into electrical signals through coupled piezoelectric sensors (Beattie, 1983; Miller and Entire, 1987; Shiotani, 2006; Lapitz et al., 2007; Alvarez et al., 2012).
FIGURE 3
3.2 Acoustic emission parameter analysis
3.2.1 Commonly used parameters
While performing the compression test on specimens, AE waves are generated due to sudden releases of stored energy. Detected AE signals are usually referred to as hit. A more detailed analysis can be conducted on the waveform of each signal to calculate a number of parameters such as amplitude, rise time, duration, signal strength, energy, and counts. The parameter-based technique is useful for better characterization of the AE source (
Titus et al., 1988;
Ohtsu, 1996;
Ohtsu, 2010). In this study, the features of various AE parameters obtained from AE signals detected by sensors are investigated and analyzed. The correlation between these AE parameters enables the identification of the damage evolution, and the estimation of the existing deterioration condition in the RC structure. Commonly used parameters obtained from an emitted signal are shown in
Figure 4, and the features of these parameters are explained as follows.
1) Hit: the process of detection and measurement of an AE signal on an individual sensor channel. It is related to cracks occurrence and progress.
2) Threshold: the reference value of the amplitude. Values lower than this amplitude are not covered. It is set to remove noise, which is unintentionally detected during AE measurement.
3) Maximum amplitude value (Amax): the largest voltage peak in the AE signal waveform; customarily expressed in decibels (dB) relative to 1 µV at the preamplifier input (dB), assuming a 40 dB pre-amplification.
4) Rise time (Rt): the time from an AE signal’s first threshold crossing to its peak.
5) Energy: the area of an AE signal above the threshold. It represents the size of the generated AE signal.
6) Count (C): the number of times an AE signal crosses the detection threshold.
7) Duration (D): the time from the first threshold crossing to the end of the last threshold crossing of an AE signal from the AE threshold.
FIGURE 4
3.2.2 RA values and average frequency
AE sources can also be classified in terms of an RA value and average frequency (AF) into the type of cracking. The RA value and the average frequency (AF) are defined from AE parameters (Aggelis, 2011; Ohtsu and Tomoda, 2007; Ohtsu and Tomoda, 2008; JCMS-IIIB5706, 2003), as presented in Eqs 1, 2.where Rt, Amax, , and are defined in Section 3.2.1.
A crack type can be classified by the relationship between the RA value and the average frequency according to ISO 16838:2017, as shown in Figure 5. A tensile-type crack is referred to as an AE signal with high average frequency and low RA value. A shear-type crack is identified by low average frequency and high RA value. This criterion is used to classify AE data detected in the compression tests.
FIGURE 5
3.3 Simplified Green’s functions for Moment tensor Analysis
In order to determine the moment tensor of an AE source, a simplified procedure has been developed and implemented as Simplified Green’s functions for Moment tensor Analysis (SiGMA) by Ohtsu (Yun et al., 2010). The analysis consists of a three-dimensional (3D) AE source location procedure and moment tensor analysis of AE sources. The location of the AE source is determined from the differences in arrival time (Ohtsu et al., 1998). Then, the components of the moment tensor are determined from the amplitudes of the first motions at the AE channels (Kawasaki et al., 2013b). For this matter, SiGMA is a sophisticated method for estimating the size, orientation, crack type, location, and fracture mode of individual micro-cracking (Shigeishi and Ohtsu, 2001). When an AE signal is generated and detected by an AE sensor during the compression test, the initial amplitude value A(x) is expressed by Eq. 3.where Cs is the coefficient of the physical property value of the material including the sensitivity of the AE sensor, R is the distance from the crack occurrence point x′ to the detection point x, Ref(t,γ) is the reflection coefficient considering the detection point at the AE sensor installation point, γpγq is the area of the cosine in that direction, and DA is the area of the crack surface. In addition, in order to solve Eq. 3 and determine the independent six components of moment tensor Mpq, the detection by 6 AE sensors at least is necessary. In SiGMA analysis, two parameters are used, the arrival time of the AE signal and its initial amplitude value, to locate the AE source and identify the type of crack and the direction of motion of the elastic body. The location of the source x' is detected by solving Eq. 4 using the following parameters: the time difference ti of the AE signal arrival at each detection point xi, the elastic waveform velocity vp, and detection point distance Ri.
Therefore, the location of the AE source is possible, and the crack generated inside the concrete can be identified as a tensile-type or a shear-type based on the unified decomposition of the moment tensor.
4 Experimental setup
4.1 Accelerated corrosion test
To provide reasonable results within a realistic time lapse, laboratory corrosion tests were performed using electrically accelerated process. The electrolyte was a 3% NaCl solution, which is representative of marine environments. The reinforcing bars were used as the anode, and a copper plate was placed alongside each axial rebar. These copper plates served as the cathode (Figure 6). The corrosion process was electrically accelerated applying 0.2 A current, which is provided by a direct current (DC) power supply. Each specimen was separately placed in a plastic container and on two wood sticks because they are neutral to the redox reaction. Twelve specimens were arranged into four groups of three specimens. The one set of the specimens were corroded at the initiation stage for 54 h, corroded at the acceleration stage for 111 h, and corroded at the deterioration stage of rebar corrosion for 372 h. Another group was prepared as non-corroded specimens. The accelerated corrosion test was also performed on the other set of twelve specimens with coated rebars under the same conditions as the one.
FIGURE 6
4.2 Compressive strength test
After the electrical corrosion, axial compression tests were conducted on all specimens up to failure. The axial loading was single, uniform and non-stop, and the speed was set at 4.5 kN/s. The compressive strength test was performed according to JIS A 11082, and the elastic modulus was estimated according to JIS A 11493.
4.3 Acoustic emission measurement
AE measurements were carried out during the compression tests on one representative RC specimen of each group. Eight AE sensors (R15) of 150 kHz resonance were mounted on the lateral surface of the RC specimen. Their coordinates are given in Table 3, and the schematic of their location is shown in Figure 7. AE parameters were recorded and then correlated to the mechanical failure process during the compression test. To reduce the effect of noise in AE measurement, the compression tests were carried out by covering both top and bottom sides of the specimen with a Teflon sheet. In order to filter noises from external sources, AE data with a count equal to 1 and AE energy equal to 0 are deleted. Before fixing the sensors, contact surfaces at the measuring points were polished until smooth. Each sensor was connected to a preamplifier, which was connected to the acquisition computer. Concerning the event counting, the dead-time was set to 2 ms, and the threshold level was set to 40 dB gain.
TABLE 3
| Channel number | x (mm) | y (mm) | z (mm) |
|---|---|---|---|
| 1 | 150 | 230 | 75 |
| 2 | 75 | 195 | 0 |
| 3 | 0 | 185 | 75 |
| 4 | 75 | 175 | 150 |
| 5 | 150 | 125 | 75 |
| 6 | 75 | 115 | 0 |
| 7 | 0 | 105 | 75 |
| 8 | 75 | 70 | 150 |
AE sensors coordinates.
FIGURE 7
4.4 Rebar mass loss
After the compression test, rebars was taken out of the specimens to be diagnosed. In the presence of corrosion, the corrosion products were removed after immersion in a 10% concentration of di-ammonium hydrogen citrate solution, at 60°C for 24 hours. At the end of this process, the rebar corrosion rate at different stages was calculated based on the JCI code (JCI-SC1, corrosion evaluation method of steel in concrete). During the electrical corrosion test, visual inspection was regularly conducted to check the condition the specimens. Then prior to the compression tests, the maximum crack width was measured using a crack scale to quantitatively evaluate the corrosion-induced cracks.
5 Results and discussion
5.1 Maximum width of corrosion-induced crack
In the uncoated case, Figure 8 shows the typical condition of the RC cylinders, at the end of the electrical corrosion process, and the average of maximum widths of corrosion-induced cracks are summarized in Figure 9. However, no corrosion-induced damage was observed in the coated case. Crack widths are measured on all specimens where cracks appeared, using a crack scale. Two types of crack are observed: horizontal cracks induced by tie hoops and vertical ones induced by axial rebars. As the healthy specimens do not present any superficial damage, crack damages are only considered at “Initiation stage,” “Acceleration stage,” and “Deterioration stage.” However, no superficial damage are observed at “Initiation stage.” At the acceleration stage, thin cracks with an average width of 0.05 mm are observed alongside the axial rebars, and wider corrosion-induced cracks, of which widths vary from 0.25 to 0.45 mm, are observed alongside the tie hoops. As for the deterioration stage, previous corrosion-induced cracks become wider and longer, with branching in all directions. The maximum crack width reached 0.70 mm alongside the axial rebars. In the other set of specimens, no corrosion-induced cracks were observed during the electrical corrosion process.
FIGURE 8
FIGURE 9
5.2 Compressive strength
Results of compression tests are shown in Figure 10. To compare uncoated and coated cases, both results at four stages are presented, although no corrosion was observed in the coated case. So, this shows results of the healthy conditions, respectively, the initiation stage, the acceleration stage, and the deterioration stage of reinforcement bars. In the case of RC specimens with non-coated rebars, the increase in corrosion of rebar up to the deterioration stage corresponds to the decrease in the compressive strengths. In particular, the strength at healthy condition is 5 MPa larger than the initiation stage and 7 MPa than that of the deterioration stage, although the strengths in initiation and acceleration stages are similar. This is because no deep internal damage evolution is generated until the acceleration stage, as suggesting little rebar corrosion. It is noted that no major variations of the modulus of elasticity are observed in both cases.
FIGURE 10
5.3 Corrosion rate
The diagnostic of rebar condition after performing compression test showed that no corrosion affected the reinforcement members, in the coated case. However, in the uncoated case, Table 4 shows the corroded conditions of the axial rebar and tie hoops at the three stages. Figure 11 shows results of the corrosion rates calculated after chipping out rebars from specimens. From the healthy condition to the deterioration stage of corrosion, the cross section of the reinforcing bars was reduced gradually due to corrosion-induced mass loss. Local and overall irregularities in the reduction of cross section are observed, particularly at acceleration and deterioration stages where it significantly affected the external part of the reinforcing bars, due to the proximity to the concrete surface. According to Figure 11, the corrosion rate increased more rapidly in tie hoops than in axial rebar. That is due to the difference in concrete cover thickness between them, since the tie hoops are arranged shallower than the axial rebars. It suggests that chloride ions penetrated into the specimens from the concrete surface could reach first the tie hoops. With time history, the concentration of chloride ions inside the specimen decreases in function of the depth and implies more corrosion at the tie hoops than at the axial rebars.
TABLE 4
| Different stages | Photograph | |
|---|---|---|
| Axial rebar | Tie hoops | |
| Initiation stage | 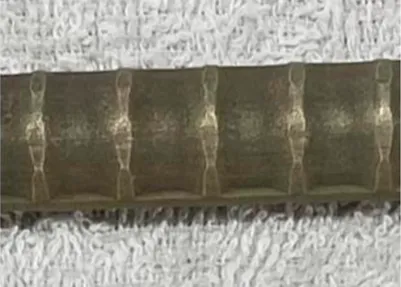 |  |
| Acceleration stage |  | 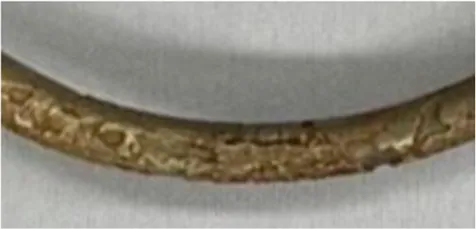 |
| Deterioration stage | 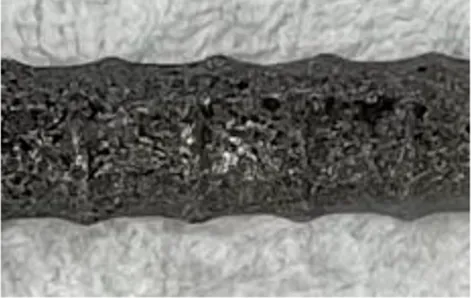 | 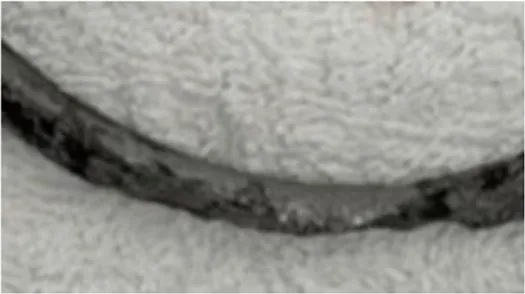 |
Conditions of rebar that has been rusted from corrosion products.
FIGURE 11
5.4 Results of acoustic emission measurements
5.4.1 Cumulative acoustic emission hits
Cumulative AE hits in the specimens with uncoated rebars and in coated are shown in Figure 12. Figure 13, along with the corrosion rates and the cumulative AE hits generated during the axial compression tests. Here, the stress level f (x) is calculated by using Eq. 5, where F is the maximum stress level and x is time to be determined,
FIGURE 12
FIGURE 13
The stress level is then classified as following: the values less than 30% were considered as the range of low stress level, the interval from 30 to 60% as the range of medium stress level, and the values larger than 60% as the high stress level. The cumulative AE hits in uncoated rebars show similar transitions and convex trends under the healthy condition and at the initiation stage. At the acceleration and deterioration stages, similar linear trends are observed. That is due to the fact that the cumulative number of AE hits is dominantly related to the corrosion rate of the axial bars compared to that of the tie hoops (Figure 13). In fact, the corrosion rate of the axial bars was in low progress under the healthy condition and at the initiation stage, while the increase in the number of AE hits was slow at the low stress level. The number of AE hits continued rising more rapidly at the medium and high stress levels during the acceleration and degradation periods. This situation is due to the crack evolution in pre-existing corrosion-induced cracks. In the case of coated rebars, the cumulative AE hits are similar to the healthy condition under all four considered conditions. The number of AE hits continued rising at any stress level. This is supposed to be due to the fact that the bonding strength between concrete and epoxy-coated axial bars decreased earlier and more rapidly than with uncoated axial rebars. Therefore, the concrete slipped around epoxy-coated axial bars during the axial compression, which lasted longer than in the uncoated case.
5.4.2 Crack classification
Crack types, which occurred during the compression test, were classified based on the relationship between RA values and average frequencies, as discussed in Section 3.2.2. They are presented in Figures 14 and 15, respectively, for the uncoated case and the coated case. AE phenomena in the upper side from the oblique transition line could be classified as tensile cracks, and the downside as shear cracks. Thus, in the uncoated case, the occurrence of tensile-type cracks was dominant in all stress ranges from low to high level, under the healthy condition, while shear-type cracks were exclusively generated with a moderated amount at the high stress level. At the initiation and acceleration stages, only tensile-type cracks were generated in all the ranges of stress level. As for the deterioration stage, tensile-type and shear-type cracks were generated with higher amounts at all stress ranges. Yet, shear-type cracks trended to become a minority when the stress progressed from low to high range. In the coated case, the occurrence of tensile-type cracks was widely dominant in all stress ranges from low to high level, and that under the healthy condition, and at the initiation, acceleration, and deterioration stages. Thus, shear-type cracks were either exclusively generated in a very little amount, or not generated, particularly at the low and high stress ranges in the corresponding deterioration stage. These results confirm a poor bonding strength of epoxy-coated rebar with concrete inside the RC cylinders. Therefore, the results presented in Figures 14 and 15 could be considered as a characteristic signature of the mechanical behaviors and failure processes of the tested RC cylinders.
FIGURE 14
FIGURE 15
According to Figure 16, the RA values and the average frequencies fluctuated inversely and alternately during the compression test. In fact, the maximum RA values seemed to correspond to the minimum values of average frequencies, and vice versa. At the acceleration and deterioration stages, the average frequencies showed an earlier decreasing trend than at the initiation stage, in the uncoated case. Around 100 s after starting the compression test a decreasing trend of average frequencies could be observed at acceleration and deterioration stages, while they continued an increasing trend up to 140 s at the initiation stage. In the coated case, similar results of the RA values and the average frequencies are observed at the initiation, acceleration, and deterioration stages. They confirmed that RC cylinders with coated rebars were under the same condition after the electrical corrosion process. Since the corrosion could not occur in rebars, only chloride ingress occurred. In conclusion, tensile-type cracks are first generated then shear-type cracks progressively and alternately. However, shear-type cracks could be generated earlier with the corrosion level of the RC structures and become dominant while failure occurs.
FIGURE 16
These results gave the means as well, to correlate the damage process of the RC cylinders during compression, with their specific condition related to their corrosion level, prior to loading.
5.4.3 Simplified Green’s functions for Moment tensor Analysis
Results of SiGMA analysis with three-dimensional locations of both uncoated and coated cases are shown in Figure 17. Table 5 shows the failure profiles of RC specimens after the compression tests. In the uncoated case, AE event positioning results were similar under the healthy condition and at the initiation stage of RC cylinders. This situation is related to fact that at the initiation stage, only local corrosion pitting occurs on the rebar surface. Therefore, at the acceleration stage, an increase in AE events was observed during the compression test. At that stage, the AE events could be detected around rebars and in all the volume of concrete, from the bottom end to the top one. In fact, during the electrical corrosion process, the initiation of corrosion-induced cracks occurs from rebars through different directions inside the specimens, particularly toward the concrete surface where cracks can be observed. So, during the compression test, many alternative share-type and tensile-type cracks occurred with the propagation of the pre-existing cracks. After the acceleration stage, the number of event positioning is decreased with the increase in erosion rate, during the compression test. In fact, at the deterioration stage, corrosion-induced cracks already reach high scales due to a higher mass loss of rebars, which drastically reduce the strength between rebar and concrete. So, during the compression test, no significant progress of pre-existing cracks occurs, and the failure is basically due to the weakness of the structure.
FIGURE 17
TABLE 5
| Type of specimens | Healthy condition | Initiation stage | Acceleration stage | Deterioration stage |
|---|---|---|---|---|
| Uncoated case | 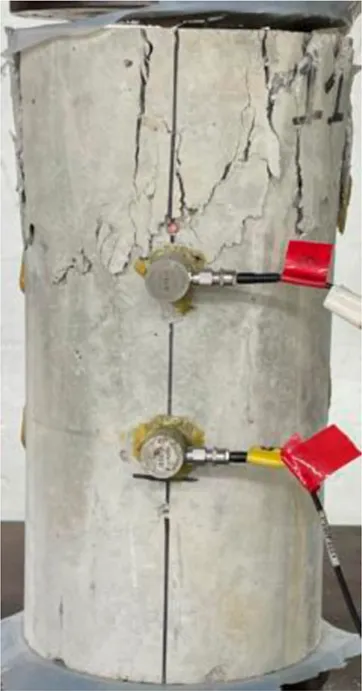 | 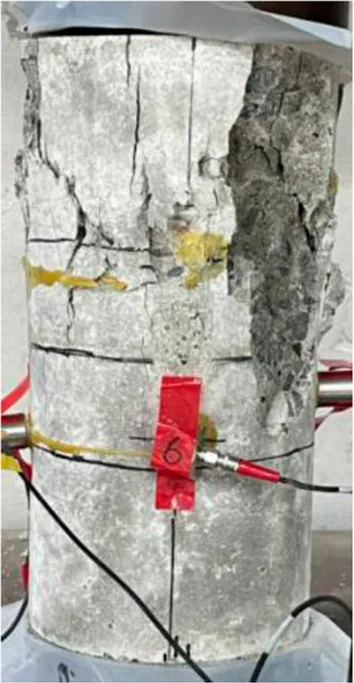 | 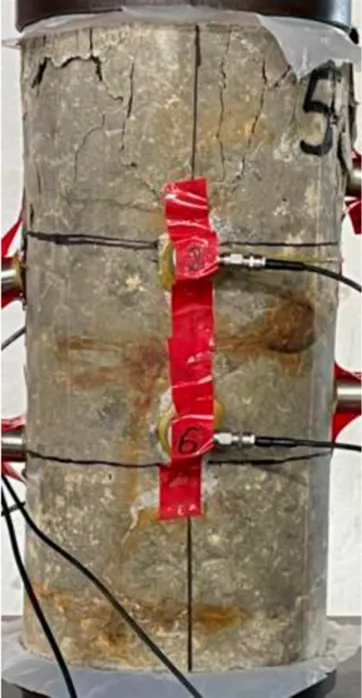 | 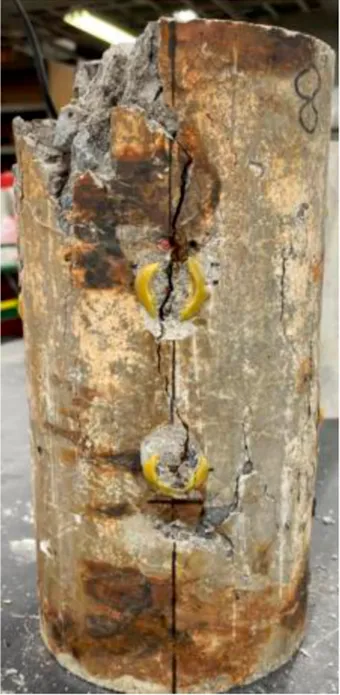 |
| Coated case | 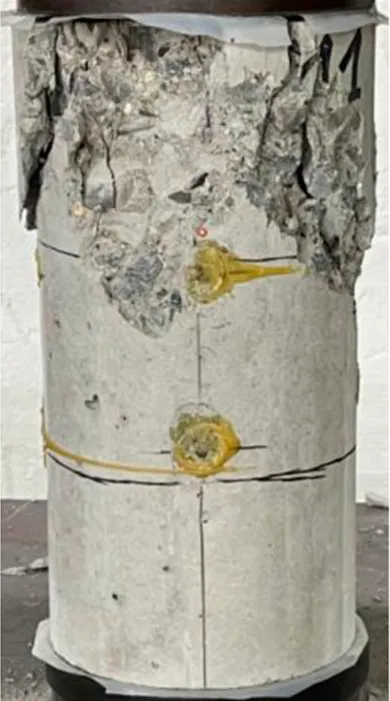 | 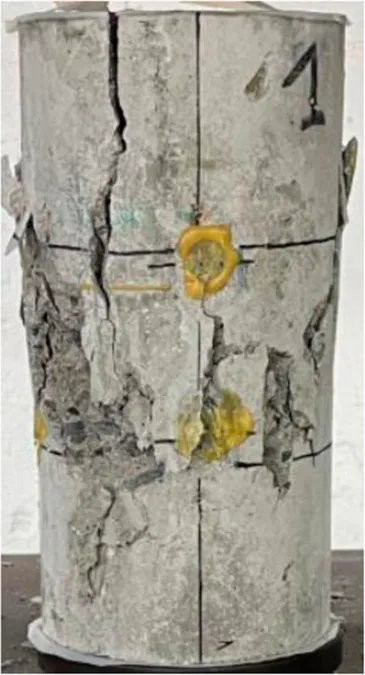 | 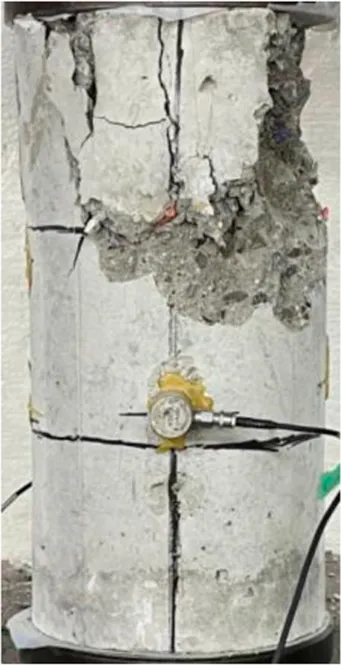 | 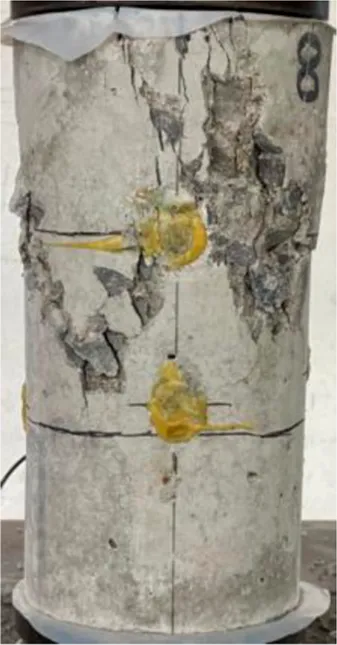 |
Conditions after compression testing.
Hereinafter, in the coated case, AE event positioning results were similar at the initiation, acceleration, and deterioration stages. Therefore, fewer AE sources were identified at those stages compared to the AE event positioning result under the healthy condition. The main reason is that the specimens under the healthy condition were not affected by chloride ions, while the specimens at the other stages were immerged in salt water. Although corrosion could not occur in the specimens with epoxy resin-coated axial rebar while performing electrical corrosion test, moisture from salt water could affect them. So, in that case, only moisture and chloride ingress could have influence on the results from the compression test and the generated AE events.
6 Conclusion
In this study, axial compression tests up to failure of short-scale circular RC cylinders are carried out under different conditions related to the rebar corrosion progress. AE measurement is simultaneously performed for the evaluation of the failure process. The characteristics of collected AE parameters are examined for that purpose. Thus, the evaluation of the effect of pre-existing internal damages, caused by rebar corrosion on the compression fracture process, could be performed. Therefore, the conclusions obtained from this study are presented as follows.
In the case uncoated case:
1) The corrosion of rebars inside the cylinders trends to decrease the compressive load-carrying performance of the RC cylinders, with the occurrence of early damages during the axial compression test.
2) The difference in the increasing trends of the number of AE hits between the healthy condition, the initiation stage, the acceleration stage, and the deterioration stage was confirmed.
3) The occurrence of tensile-type cracks was dominant and increased in amount, from the initiation stage to the deterioration stage, while shear-type cracks increased in amount at the deterioration stage but trended to become a minority when the stress progressed from low to high range.
In the coated case:
1) The epoxy coat was a water-impermeable layer, which boosted the anticorrosion performance of rebar, providing additional protection in conditions where reinforcements were subjected to accelerated corrosion.
2) The occurrence of tensile-type cracks in RC cylinders was widely dominant during the compression test, under the healthy condition, and at the initiation, acceleration, and deterioration stages, while shear-type cracks were either exclusively generated in a very little amount, or not generated.
3) The classification of the generated crack types during the compression test, based on the relationship between RA values and average frequencies, confirmed a poor bonding strength of epoxy-coated rebar with concrete inside the RC cylinders.
In this experimental investigation, the advantages of using the acoustic emission (AE) technique, during the compression test on RC cylinders, consisted of:
1) Enabling the classification of the generated damages into a ratio of shear-type and tensile-type damages, which provide a characteristic signature of the mechanical behavior and failure process of the tested cylinders.
2) Providing a 3D visualization of the damage events location, and evolution inside the cylinders with the loading time history.
3) Giving the means to correlate the damage process of the RC cylinders, with their specific condition related to their corrosion level, prior to the compressive loading.
Statements
Data availability statement
The raw data supporting the conclusions of this article will be made available by the authors, without undue reservation.
Author contributions
SM conducted the experiments, collected data, and proceeded to the analysis at the “Materials and Structures for Sustainable Infrastructures Laboratory” at Ritsumeikan University, under the supervision of YK.
Conflict of interest
The authors declare that the research was conducted in the absence of any commercial or financial relationships that could be construed as a potential conflict of interest.
Publisher’s note
All claims expressed in this article are solely those of the authors and do not necessarily represent those of their affiliated organizations, or those of the publisher, the editors, and the reviewers. Any product that may be evaluated in this article, or claim that may be made by its manufacturer, is not guaranteed or endorsed by the publisher.
References
1
AggelisD. G.SouliotiD. V.SapouridisN.BarkoulaN. M.PaipetisA. S.MatikasT. E. (2011). Acoustic emission characterization of the fracture process in fibre reinforced concretefibre reinforced concrete. Constr. Build. Mater.25, 4126–4131. 10.1016/j.conbuildmat.2011.04.049
2
AggelisD. G. (2011). Classification of cracking mode in concrete by acoustic emission parametersfication of cracking mode in concrete by acoustic emission parameters. Mech. Res. Commun.38, 153–157. 10.1016/j.mechrescom.2011.03.007
3
AlvarezM. G.LapitzP.RuzzanteJ. (2012). Analysis of acoustic emission signals generated from SCC propagation. Corros. Sci.55, 5–9. 10.1016/j.corsci.2011.08.014
4
AndishehK.ScottA.PalermoA. (2018). Experimental evaluation of the residual compression strength and ultimate strain of chloride corrosion-induced damaged concrete. Int. Fed. Struct. Concr.20, 296–306. 10.1002/suco.201800108
5
AnxinG.WentingY.HaitaoL.HuiL. (2018). Structural strength deterioration of coastal bridge piers considering non-uniform corrosion in marine environments. Earthq. Eng. Eng. Vib.17, 429–444. 10.1007/s11803-018-0451-z
6
BeattieA. G. (1983). Acoustic emission, principles and instrumentation. J. Acoust. Emiss.2, 95–128.
7
CampioneG.CannellaF.MinafoG. (2016). A simple model for the calculation of the axial load-carrying capacity of corroded RC columns. Mat. Struct.49, 1935–1945. 10.1617/s11527-015-0624-4
8
ChoeG.ShinoharaY.KimG.LeeS.LeeE.NamJ. (2020). Concrete corrosion cracking and transverse bar strain behavior in a reinforced concrete column under simulated marine conditions. Appl. Sci. (Basel).10, 1794. 10.3390/app10051794
9
FarhidzadehA.SalamoneS.SinglaP. (2013). A probabilistic approach for damage identification and crack mode classification in reinforced concrete structures. J. Intelligent Material Syst. Struct.24, 1722–1735. 10.1177/1045389X13484101
10
FarhidzadehaA.MpalaskasbA. C.MatikasbT. E.FarhidzadehcH.AggelisdD. G. (2014). Fracture mode identification in cementitious materials using supervised pattern recognition of acoustic emission featuresfication in cementitious materials using supervised pattern recognition of acoustic emission features. Constr. Build. Mater.67, 129–138. 10.1016/j.conbuildmat.2014.05.015
11
GeX.DietzM. S.AlexanderN. A.KashaniM. M. (2019). Nonlinear dynamic behaviour of severely corroded reinforced concrete columns: Shaking table study. Bull. Earthq. Eng.18, 1417–1443. 10.1007/s10518-019-00749-3
12
GoharrokhiA.AhmadiJ.ShayanfarM. A.BaghaM. G.NasserasadiK. (2019). Indian academy of sciences. Effect of transverse reinforcement corrosion on compressive strength reduction of stirrup-confined concrete: An experimental study. Sadhana45, 1–9. 10.1007/s12046-020-1280-0
13
GrosseC. U.ReinhardtH. W.DahmT. (1997). Localization and classification of fracture types in concrete with quantitative acoustic emission measurement techniquesfication of fracture types in concrete with quantitative acoustic emission measurement techniques. NDT E Int.30 (4), 223–230. 10.1016/s0963-8695(96)00060-6
14
HelalJ.SofiM.MendisP. (2015). Non-destructive testing of concrete: A review of methods. Special Issue Electron. J. Struct. Eng.14 (1), 97–105. 10.56748/ejse.141931
15
JCMS-IIIB5706 (2003). Japan Construction Material Standards. Monitoring Method for Active Cracks in Concrete by Acoustic Emission. Japan: The Federation of Construction Material Industries.
16
JISJapanese industrial standards (JIS A 11321).
17
KawasakiY.TomodaY.OhtsuM. (2010). AE monitoring of corrosion process in cyclic wet–dry test. Constr. Build. Mater.24, 2353–2357. 10.1016/j.conbuildmat.2010.05.006
18
KawasakiY.WakudabT.KobaraibT.OhtsuM. (2013). Corrosion mechanisms in reinforced concrete by acoustic emission. Constr. Build. Mater.48, 1240–1247. 10.1016/j.conbuildmat.2013.02.020
19
KawasakiY.WakudaT.KobaraiT.OhtsuM. (2013). Corrosion mechanisms in reinforced concrete by acoustic emission. Constr. Build. Mat.48, 1240–1247. 10.1016/j.conbuildmat.2013.02.020
20
KawasakiY.OkamotoT.IzunoK. (2015). Corrosion-induced cracks in concrete and hybrid non-destructive evaluation (NDE) for evaluation in rebar corrosion. Civ. Struct. Eng.57–77. 10.1016/B978-1-78242-327-0.00004-0
21
KurzJ. H.FinckF.GrosseC. U.ReinhardtH. W. (2006). Stress drop and stress redistribution in concrete quantified over time by the b-value analysisfied over time by the b-value analysis. Struct. Health Monit.5, 69–81. 10.1177/1475921706057983
22
LapitzP.RuzzanteJ.AlvarezM. G. (2007). AE response of α-brass during stress corrosion crack propagation. Corros. Sci.49, 3812–3825. 10.1016/j.corsci.2007.03.043
23
LavoratoD.FiorentinoG.PelleA.RasuloA.BergamiA. V.BriseghellaB.et al (2019). A corrosion model for the interpretation of cyclic behavior of reinforced concrete sections. Int. Fed. Struct. Concr.21, 1732–1746. 10.1002/suco.201900232
24
LiQ.JinX.WuD.YeH. (2020). Acoustic emission analysis of corroded reinforced concrete columns under compressive loading. Sensors20, 2412. 10.3390/s20082412
25
MelchersR. E.LiC. Q. (2006). Phenomenological modeling of reinforcement corrosion in marine environments. ACI Mater. Journal/January-February103, 25–32. Title no. 103-M04.
26
MillerR. K.EntireP. M. (1987). in Acoustic emission testing (New York; New York, NY, USA: Springer), 12–154.Encyclopedic dictionary of polymers
27
OhtsuM.OkamotoT.YuyamaS. (1998). Moment tensor analysis of acoustic emission for cracking mechanisms in concrete. ACI Struct. J.95, 87–95.
28
OhtsuM. (1996). The history and development of acoustic emission in concrete engineering. Mag. Concr. Res.48, 321–330. 10.1680/macr.1996.48.177.321
29
OhtsuM. (2010). Recommendation of RILEM TC 212-ACD: Acoustic emission and related NDE techniques for crack detection and damage evaluation in concrete. Mat. Struct.43, 1187–1189. 10.1617/s11527-010-9640-6
30
OhtsuM.TomodaY. (2007). Corrosion process in reinforced concrete identified by acoustic emission. Mat. Trans.48, 1184–1189. 10.2320/matertrans.I-MRA2007844
31
OhtsuM.TomodaY. (2008). Phenomenological model of corrosion process in reinforced concrete identified by acoustic emission. ACI Mat. J.105, 194–199.
32
OhtsuM.UchidaM.OkamotoT.YuyamaS. (2002). Damage assessment of reinforced concrete beams qualified by acoustic emission. Am. Concr. Inst. J.99, 411–417. ISSN: 0889-3241.
33
PelleA.BriseghellaB.BergamiA. V.FiorentinoG.GiaccuG. F.LavoratoD.et al (2021). Time-dependent cyclic behavior of reinforced concrete bridge columns under chlorides-induced corrosion and rebars buckling. Struct. Concr.23, 81–103. 10.1002/suco.202100257
34
SchechingerB.VogelT. (2007). Acoustic emission for monitoring a reinforced concrete beam subject to four-point-bending. Constr. Build. Mater.21 (13), 483–490. 10.1016/j.conbuildmat.2006.04.003
35
ShaojieC.JianxiR.QiangL.GuangY.PeilinY. (2019). Acoustic emission characteristics of corroded reinforced concrete columns under low-cyclic loading. J. Eng. Sci. Technol. Rev.12, 21.
36
ShigeishiM.OhtsuM. (2001). Acoustic emission moment tensor analysis: Development for crack identification in concrete materials. Constr. Build. Mat.15, 311–319. 10.1016/S0950-0618(00)00079-9
37
ShiotaniT.AggelisD. G.MakishimaO. (2009). Global monitoring of large concrete structures using acoustic emission and ultrasonic techniques: Case study. J. Bridge Eng.14, 188–192. 10.1061/(asce)1084-0702(2009)14:3(188)
38
ShiotaniT. (2006). Evaluation of long-term stability for rock slope by means of acoustic emission technique. NDT E Int.39, 217–228. 10.1016/j.ndteint.2005.07.005
39
SohnH.ParkG.WaitJ. R.LimbackN. P.FarrarC. R. (2004). Wavelet-based active sensing for delamination detection in composite structures. Smart Mat. Struct.13, 153–160. 10.1088/0964-1726/13/1/017
40
StanleyJ. (1995). Nondestructive testing handbook 9: Special nondestructive testing methods. Columbus: American Society of Nondestructive Testing.
41
TitusT. N. K.ReddyD. V.DunnS. E.HarttW. H. (1988). “Acoustic emission crack monitoring and prediction of remaining life of corroding reinforced concrete beams,” in Proceeding of the 4th European Conference Non-destructive Testing, London, UK, September 1988.
42
XiaJ.JinW. L.LiL. Y. (2015). Performance of corroded reinforced concrete columns under the action of eccentric loads. J. Mater. Civ. Eng.28, 04015087. Article in. 10.1061/(ASCE)MT.1943-5533.0001352
43
YunH. D.ChoiW. C.SeoS. Y. (2010). Acoustic emission activities and damage evaluation of reinforced concrete beams strengthened with CFRP sheets. NDT E Int.43, 615–628. 10.1016/j.ndteint.2010.06.006
Summary
Keywords
acoustic emission, compression test, electrical corrosion, location analysis, reinforced concrete column, concrete column, concrete cylinder
Citation
Seye MM and Kawasaki Y (2022) Failure mechanisms of corroded/non-corroded RC cylinder under axial compressive loading evaluated by AE technique. Front. Built Environ. 8:947310. doi: 10.3389/fbuil.2022.947310
Received
18 May 2022
Accepted
25 July 2022
Published
12 September 2022
Volume
8 - 2022
Edited by
Didem Ozevin, University of Illinois at Chicago, United States
Reviewed by
Alessandro Rasulo, University of Cassino, Italy
Giovanni Minafò, University of Palermo, Italy
Xiao-Hui Wang, Shanghai Maritime University, China
Updates
Copyright
© 2022 Seye and Kawasaki.
This is an open-access article distributed under the terms of the Creative Commons Attribution License (CC BY). The use, distribution or reproduction in other forums is permitted, provided the original author(s) and the copyright owner(s) are credited and that the original publication in this journal is cited, in accordance with accepted academic practice. No use, distribution or reproduction is permitted which does not comply with these terms.
*Correspondence: Mouhamadou Mountakhah Seye, gr0396fk@ed.ritsumei.ac.jp
This article was submitted to Structural Sensing, Control and Asset Management, a section of the journal Frontiers in Built Environment
Disclaimer
All claims expressed in this article are solely those of the authors and do not necessarily represent those of their affiliated organizations, or those of the publisher, the editors and the reviewers. Any product that may be evaluated in this article or claim that may be made by its manufacturer is not guaranteed or endorsed by the publisher.