 Luis C. Esquivel-Salas1*
 Víctor Schmidt-Díaz1
 Massimiliano Pittore2
 Diego Hidalgo-Leiva1
 Michael Haas2Aarón Moya-Fernández1
- 1Seismic Engineering Laboratory, Engineering Research Institute, University of Costa Rica, San José, Costa Rica
- 2Seismic Hazard and Risk Dynamics, German Research Center for Geosciences, Potsdam, Germany
The present work shows the implementation of a data collection strategy for characterizing large amounts of buildings efficiently by the conduction of remote surveys on 360° panoramic images and aerial photographs. A set of 7,296 buildings from the Latin American city of San José, Costa Rica were studied and characterized from a structural engineering point of view, obtaining information like occupancy type, height, type of lateral load resisting system, and structural irregularities, among others. Also, an estimation of the error of the remote surveys was performed, by contrasting its results with the ones of field (in situ) surveys applied on a subset of 556 structures denominated “control buildings.” The results show that for San José buildings, the predominant occupancy type, height, type, and material of the lateral load resisting system are, respectively, residential, one or two storey, wall type of confined-reinforced masonry. The overall precision level estimated for the remote surveys was 75 %, which the authors consider acceptable and an improvement when compared to more popular surveys, for example, the field surveys carried out during a population and housing census that typically have an estimated precision level of 50 %. The results proved the adopted strategy to be a promising one, albeit subject to improvements to increase its precision and reduce the implementation time.
1 Introduction
The majority of the world population concentrates in urban environments, this is especially true for more developed regions where 79 % of its inhabitants live in the cities. It is also the case for Costa Rica, despite its location in the region of Central America, generally considered as less developed, 81 % percent of its population live in urban environments (United Nations, Department of Economic and Social Affairs, 2018).
These agglomerations or concentrations of population in specific and often relatively small geographical areas, necessarily lead to a high density of buildings (here buildings refer to structural independent units ranging from houses to tall buildings). In the context of disaster risk reduction, this high density is prompting the need to characterize large quantities of buildings on a local high-resolution level and in relatively short periods of time for a diverse number of reasons. To name a few: 1) developing inventories of city buildings to enable hazard or multi-hazard assessments, that is, potential damage and loss estimations; 2) evaluating the need for retrofitting private- or public-owned real state; 3) designing risk mitigation programs and 4) for insurance ratings, among others (FEMA, 2015).
The challenge of characterizing these built environments is a dynamic one, becoming even more important and complex in the years to come, as it is expected for the cities around the world to grow by the partial migrations of rural populations to them (United Nations, Department of Economic and Social Affairs, 2018). So, the question to be answered is How to capture the main attributes of thousands of buildings with the smallest possible error (misidentifications), using the least resources (i.e., time, money, personnel)?
One answer is to use and take advantage of the visual technologies available to reduce resources, that is, time, money, and personnel, without overly compromising the precision of the results. To this end, a data collection strategy was developed by the Deutsches GeoForschungsZentrum (GFZ-Potsdam), called Rapid Environmental Mapping (REM) (Parolai, 2016a).
REM uses panoramic 360° images of building facades and aerial photographs to conduct remote surveys through a web-based platform hosting standardized data collection forms and imagery for the buildings that need to be characterized. Through this system, the processes of visual data collection and technical structural characterization are decoupled, meaning that the images can be taken by non-technical personnel, and the analysis, using concepts of structural engineering and knowledge of local engineering practice, can be done by the more highly trained one.
This technical personnel would not need to travel to and between buildings (dead travel times) or use mobile data collection systems, both subjected to some limitations, such as good weather conditions for performing the surveys. Instead, from a PC on their site of preferences, the remote surveys can be conducted at a flexible time, adapting the work to be done to busy schedules, making the recruitment of experienced engineers for this process a possibility.
Other strategies for characterizing large amounts of buildings at a local high-resolution scale are the Rapid Visual Screening (RVS), from the Federal Emergency Management Agency of the United States of America—FEMA—(FEMA, 2015) and the Inventory Data Capture Tools (IDCT) software from the Global Earthquake Model Foundation—GEM—(Hu et al., 2014).
RVS uses sidewalk field (also known as in situ) surveys to “identify, inventory, and screen buildings that are potentially seismically hazardous” (FEMA, 2015) while GEM uses the Android/Windows Mobile Tool for Field Data Collection (Rosser et al., 2014), for implementing in situ surveys to characterize buildings. At least three common limitations of this method as compared to REM are readily identified: 1) they require more time availability from the technical personnel (surveyors) because of the rigid schedule that needs to be followed from the logistics implied for field surveys, 2) they need more resources because of what is stated in the previous point and the travel times of surveyors and 3) the application of the surveys is subjected to conditions found on the days of their implementation (e.g., weather, transit limitations, personal safety and robbery risks on dangerous neighborhoods).
For IDCT an adaptation may be made for using it remotely in combination with Google Street View, but it is constrained to areas already mapped by the latter and subjected to charge if extensive use of the photographs is intended (as it is in this type of studies). Also, significant work would be needed in order to include it as part of an integrated system that can be used smoothly by the surveyors, something that REM already does.
For RVS and other similar methodologies, there is an additional important limitation: the characterization is done using assigning a “FEMA building type” to the structure being surveyed. When a building is characterized by assigning a specific construction class or typology from a class schema or typological matrix, there is a need to make compromises when the structure cannot be categorized completely as one of the classes. This is not a minor concern, especially if the class schema is being adopted from abroad.
Then, a decision must be made for each building that falls in the previous situation, based on the best engineering subjective criteria, as to which class is to be assigned for it, choosing the one that in the analyst’s point of view is more representative. When other studies want to use this information, it could be at least two important limitations. First, if the new research team is using another class schema it would be necessary to map the old class schema to the new one. Second, if they do not agree with the criteria followed by the analyst to assign classes in the past, little can be done.
On the other hand, the way REM (and also IDCT) characterizes the buildings is by following a taxonomy-based approach, specifically using the GEM Building Taxonomy Version 2.0 (Brzev et al., 2013) In this way, what is gathered in a REM remote survey are specific structural attributes that can be screened from outside of the building, not a construction class assignation to the whole of it. This separates the attribute identification process from the construction class assignation, enabling the use of any class schema and making the process more transparent, by eliminating the necessity of the analyst criteria for class assignation in the characterization process.
For the reasons previously exposed, REM was selected for the task of characterizing, from a structural engineering point, a set of thousands of buildings located in San José, Costa Rica, as part of the generation of a high-resolution exposure model to be used in seismic risk assessments for this city. Emphasis was given to the identification of the most important attributes affecting the performance of the structures under seismic loads from earthquakes, which is the main hazard for this country since it is in a region with high seismicity, the so-called “ring of fire of the Pacific”.
Also, the level of precision of remote surveys in contrast with in situ ones is quantified. This was done by comparing results from both remote and in situ surveys applied to a subset of structures denominated “control buildings,” both at an overall (attribute clustering or grouping) and detail level (independent attributes).
2 Materials and methods
2.1 Region of interest
Costa Rican territory is divided into provinces, which are further divided into cantons and later into districts, the smallest official administrative unit (Costa Rica Republic Constitution, 2017) Unofficially but of common practice, the districts are divided into neighborhoods. Each canton is administrated by a Municipality, and only some of them have official maps from their own developing of neighborhood boundaries, this is the case of the Municipality of the San José canton.
San José canton belongs to the province of San José, the capital of Costa Rica. It has an extension of approximately 45 km2, constituting about 0.1 % of the country’s territory. It is the most important canton in terms of commercial activity and inhabitants, with the latter around 337 thousand total and 6,500 inhabitants/km2. Only 3 % of its urban territory is still available for construction, making this a heavily populated and urban canton. It is divided into 11 districts (Carmen, Merced, Hospital, Catedral, Zapote, San Francisco, Uruca, Mata Redonda, Pavas, Hatillo, San Sebastián), which are themselves divided into 196 neighborhoods.
2.2 Rapid environmental mapping
The direct bottom-up data collection strategy called Rapid Environmental Mapping (REM), developed by the Deutsches GeoForschungsZentrum (GFZ-Potsdam) (Parolai, 2016a) enables the generation of building inventories by working with a sample from the population of structures in the region of interest. This strategy was used by the authors to remotely characterize thousands of structures from the San José canton.
Per (Parolai, 2016b) REM workflow can be divided into four phases, namely 1) stratification of target areas or regions of interest, 2) sampling and optimizing routing, 3) visual data collection through the MOMA (MObile MApping) system and 4) analysis of the data collected through the RRVS (Remote Rapid Visual Screening) platform. For this study, from phase one (stratification) is only important to mention that strata were defined as the unofficial but common territorial division of neighborhoods, mainly because they are recognized by the National Emergency Committee of Costa Rica for risk and emergency plans, conforming Committees at a neighborhood level for this end.
From phase two (sampling) it is pertinent to mention that, because the objective was to characterize San José building stock that is, population, in order for the sample to be representative it had to include enough buildings that were spatially distributed throughout the whole canton. Considerations the total city building population (approximately 84,000 structures), its geographical distribution, constraints in the budget, personnel, and time were weighted against each other to include as many buildings as possible to comprise the sample. In the end, it was possible to apply the remote surveys to a set of 7,296 buildings.
A thorough exposition of the stratification and sampling phases will be found in Esquivel-Salas et al. (2022)—work in progress -, in the context of assessing the seismic risk of the city of San Jose and, therefore, the need of generating an exposure model. Phases three and four are of main interest for this study and are further described below.
2.2.1 Visual data collection through the MOMA system
The task was to collect and analyze visual data from enough buildings throughout the San José canton, specifically from the strata defined to obtain robust statistics about the building attributes present within each stratum (see Figure 1). The visual data are georeferenced high-resolution photographs post-processed to produce panoramic 360° images, which are captured by the GFZ Mobile Mapping -MOMA- system (Wieland et al., 2012; Parolai, 2016a) This system consists of a Ladybug3 omnidirectional camera, from Point Grey Research Ltd., mounted on top of a vehicle, an acquisition and storage unit, a Global Navigation Satellite System receiver and a battery pack (see Figure 2).
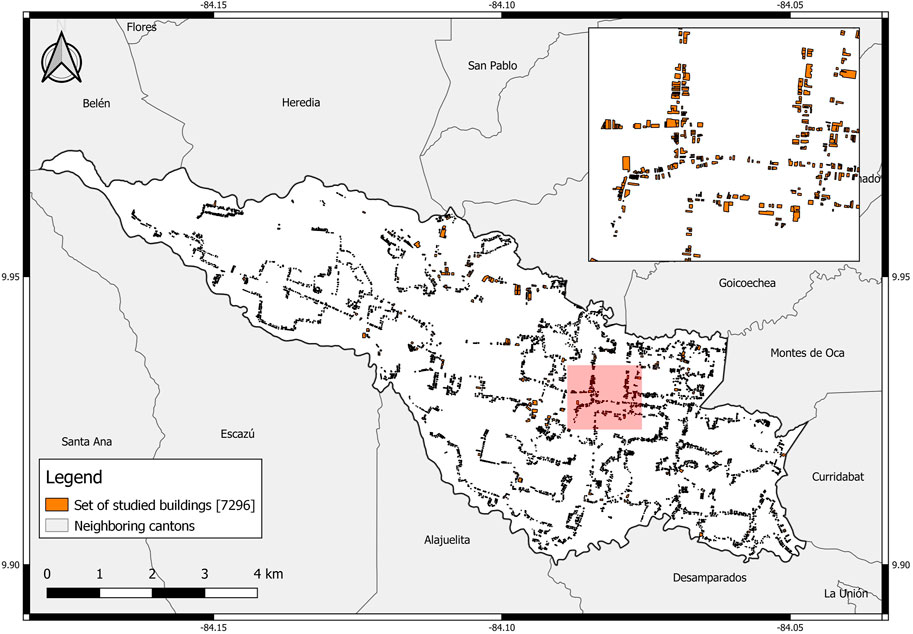
FIGURE 1. Location of the set of studied buildings. Each polygon corresponds to the footprint of a building.

FIGURE 2. GFZ-MOMA system mounted in the vehicle for the visual data collecting activity.
To do this efficiently, a route was generated to be followed by the car with the MOMA system. This route passed through the centroids of the strata (each neighborhood) following an optimization requirement of less cost, being the cost in this case the length of the route. Approximately 17,000 pictures were taken from the 7,296 structures comprising dwellings and buildings of all types of occupancy. The complete set of photographs is available and freely accessible on the 4TU.ResearchData repository, under Esquivel-Salas et al. (2021a)
2.2.2 Visual data analysis through RRVS platform
The next step was to analyze the collected visual data from the sample buildings. To this end, remote surveys were implemented in each sample unit (i.e., building), using the Remote Rapid Visual Screening -RRVS- platform (Parolai, 2016b) from REM. RRVS allows the surveyor to access, via the web, the panoramic photographs of each structure, along with aerial photographs of its building block highlighting the polygon of the structure in question and the survey itself, all in one single.
The survey uses the GEM Building Taxonomy Version 2.0 (Brzev et al., 2013) to describe the buildings from a structural point of view, also capturing some other attributes (e.g., the height of the first floor from the street, roof shape) that may be of importance to other hazards, for example, floods or storms. It seeks to collect information in the form of 32 attributes for each sample unit, all of which are stored in the REM database (Parolai, 2016a) based on the PostgreSQL database management system (PostgreSQL Global Development Group, 2018). This database relates the information of the attributes, the photographs used, and the surveyor who took the survey to the sampling unit, enabling data administration and information extraction via query.
The surveys were conducted by trained last year civil engineering students from the University of Costa Rica (UCR), supervised by local structural engineers from the Seismic Engineering Laboratory from the same institution (LIS-UCR). From the start, a series of meetings were arranged with the team of surveyors to answer questions, evaluate difficult attribute remote identification cases, and set common criteria for addressing them.
Two examples of relevant decisions made in the team meetings for setting a common criteria for the surveyors on difficult or rare cases are listed below, all of them rely on knowledge of the local engineering practice:
1. Surveyors’ question: “What material should we mark if there are different materials on each floor (for two-storey houses)? For example, the first floor is of reinforced masonry and the second floor is of cold-formed steel” (see Figure 3A).
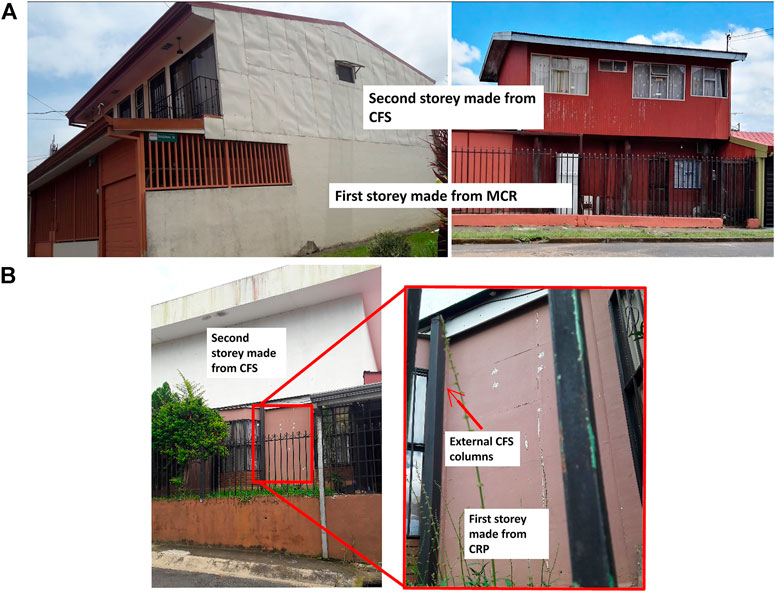
FIGURE 3. (A) Change in material from one storey to another. CFS, cold-formed steel; MCR reinforced and confined concrete masonry. (B) Independent structural units, one on top of the other. CFS, cold-formed steel; CRP, Reinforced precast concrete.
Decision: Mark the material from the first floor, since this is the floor that withstands the larger shear force product of an earthquake. Also mark “vertical irregularity,” “change in vertical structure,” and make sure is one structural unit, this is, the top floor is not another structural unit independent from the first floor.
2. Surveyors’ question: “How to classify a two-storey house where the second storey is supported on external columns detached from the first storey?” (see Figure 3B).
Decision: These are two independent structures. Complete the survey for the most vulnerable of the two, and mark “pounding potential” if necessary.
Also, revisions were conducted to the data as an additional inspection tool of the work of the surveyors. These revisions consist of cross-tabulations (cross-tabs) for pairs of attributes to look for “suspicious” or extremely rare combinations of them, taking into account the local engineering practice. A list containing all the buildings with these rare combinations was shared with the surveyors so they could double-check the attributes in question, to determine whether or not it was a mistake (i.e., typography error), a misunderstanding about the term used, or some concept of structural engineering not completely understood.
2.3 Remote vs. in situ surveys
A subset of the sample was defined as “control buildings,” in order to apply both remote and in situ surveys, to allow a comparison between them that serves as an indicator of the level of precision of the first ones. As many buildings as possible were included in this subset, limited by the already constrained available budget, time, and surveyors. In the end, the surveyors were able to conduct in situ surveys of a total of 556 structures.
The main attributes that are directly observed from the panoramic photographs were contrasted, setting the ones from the in situ as the reasonable truth. The control buildings were selected throughout the canton, as shown in Figure 4, by applying random cluster sampling because this kind of sampling is better suited for in situ surveys than completely random sampling, reducing the costs associated (e.g., time, transportation) from spatial grouping of the structures.
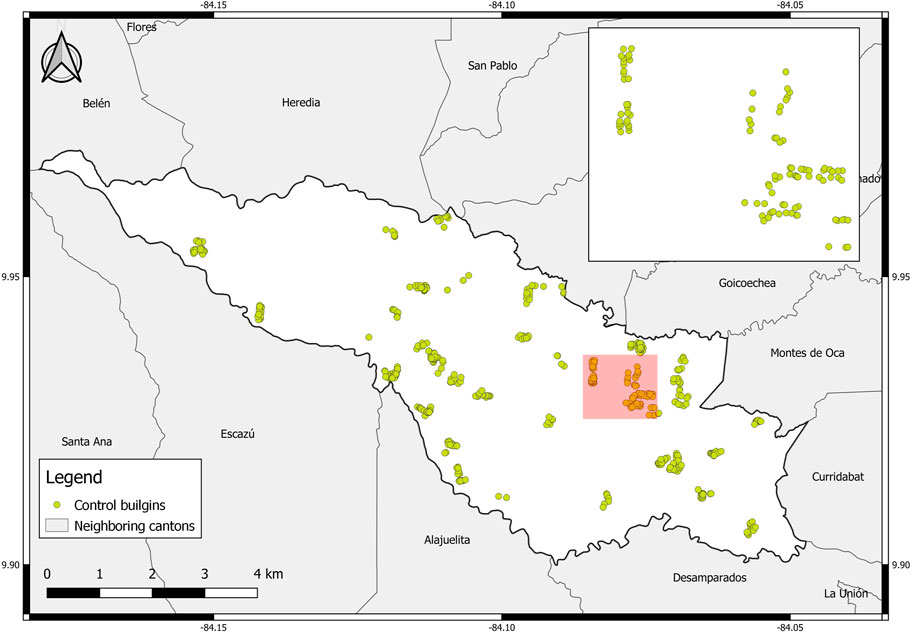
FIGURE 4. Location of the control buildings in the San José canton.
For each control building, the comparison was made at the level of attribute values (disaggregated) and attributes types (aggregated). It consisted of counting the number of times every single attribute value differs in the corresponding remote and in situ surveys. Then they were grouped by their type and summed, thus obtaining the comparison at the aggregated attribute type level.
Additionally, on the broader level and also for each control building, a comparison of the construction or typological class assignment was made. A construction class group or clusters buildings with similar structural characteristics in a way that the ones belonging to a certain class are expected to have a very similar seismic performance, to the point of being represented by the same fragility function to model their structural behavior. This classification is a necessary step for making suitable use of information from the remote structural characterization for wide-scale seismic risk assessments (Pittore et al., 2018).
For the buildings in the San José canton, a construction class scheme that is, a set of construction classes (also called typology matrix) was defined. The details of the definition of this schema are out of the scope of this study and are presented on (Esquivel-Salas et al., 2022). For this study, is important to mention that for each control building two construction classes from this schema were assigned. The first one, named “in situ construction class,” as the name indicates, was assigned based on the attributes identified in the in situ surveys. The second one, called “remote construction class,” was assigned based on the ones identified in the remote survey. So, the comparison consisted of counting the number of times the “in situ” and “remote” construction classes differ from each other for each control building. The reasonable truth was taken to be the “in situ construction class”.
3 Results
3.1 Building characteristics
Data exploratory analysis (DEA) was implemented on the REM database allowing the extraction of information from all the data, approximately 230,000 attribute values gathered by the implementation of the remote surveys on each of the 7,296 buildings, representing a total built area of 2.65 km2. The complete database is available and freely accessible on the Mendeley Data repository, under (Esquivel-Salas et al., 2021b).
The results for the seven main attributes, namely occupancy (Figure 5), material type, lateral load resisting system type, number of storeys (Figure 6), regularity, irregularity type, and floor type (Figure 7) are shown, both in terms of several buildings and built-up area. The latter was possible to obtain because the footprint of each building surveyed was facilitated by the Municipality of San José, so the constructed area of each structure was computed as the product of its footprint by the number of floors.
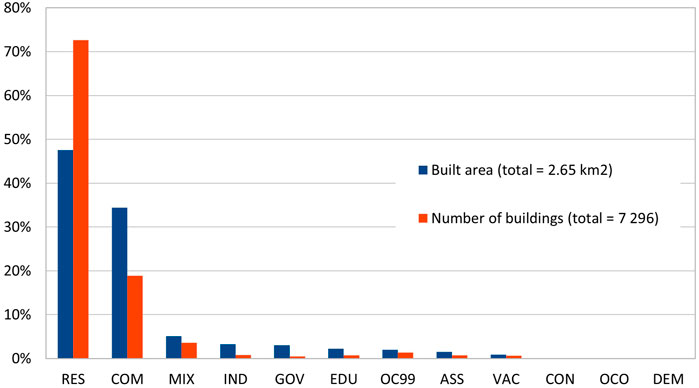
FIGURE 5. Occupancy type relative frequency distribution. AGR, agriculture; ASS, assembly place; COM, commercial and public; DEM, demolished; EDU, education; GOV, government; IND, industrial; MIX, mixed-use; OC99, unknown; OCO, other; RES, residential; VAC, vacancy.
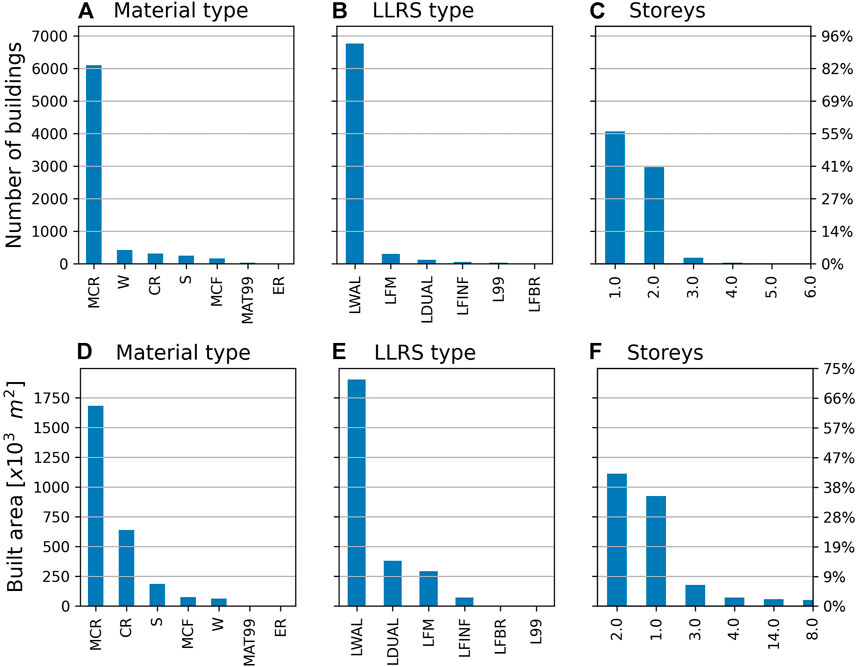
FIGURE 6. Material type, LLRS type, and a number of storeys distributions. The frequency distribution is shown on the left axis, and the relative frequency is on the right axis. CR, concrete, reinforced; ER, earth, reinforced; L99, unknown LLRS; LDUAL, dual frame-wall LLRS; LFBR, braced frame LLRS; LFINF, infilled frame LLRS; LFM, moment frame LLRS; LLRS, lateral load resisting system; LWAL, wall LLRS; MAT99, unknown material; MCF, masonry, confined; MCR, masonry, confined and reinforced; S, steel; W, wood.
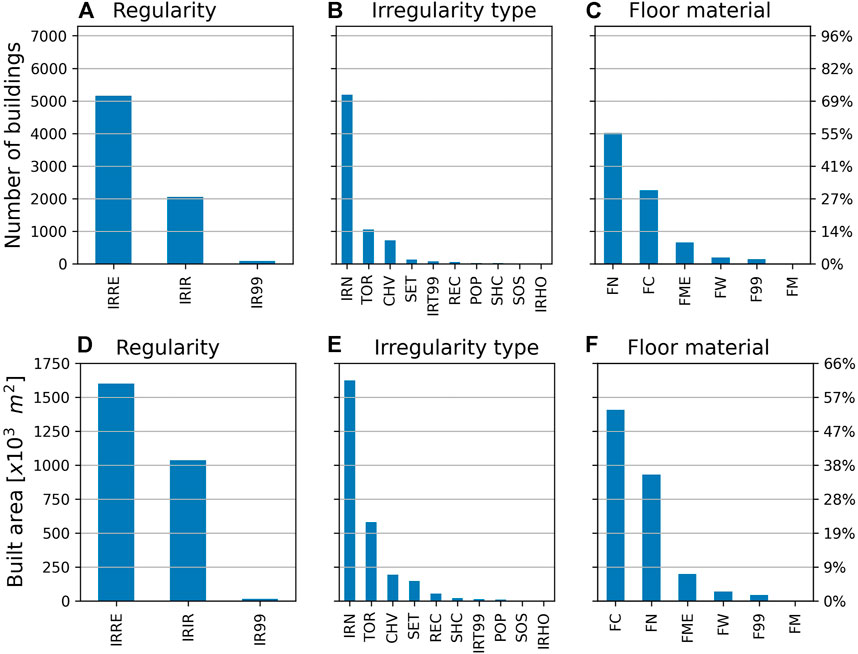
FIGURE 7. Regularity, type of irregularity, and floor material distributions. The frequency distribution is shown on the left axis, and the relative frequency is on the right axis. F99, floor material, unknown; FC, concrete floor; FM, masonry floor; FME, metal floor; FN, no elevated or suspended floor material; FW, wooden floor; IR99, unknown structural irregularity; IRHO, other plan irregularity; IRIR, irregular structure; IRN, no irregularity; IRRE, regular structure; IRT99, structural irregularity type, unknown; POP, pounding potential; REC, re-entrant corner; SET, setback; SHC, short column; SOS, soft storey; TOR, torsion eccentricity.
A detailed description of the alphanumeric codes of the different types shown in Figures 6, 7 can be found in Brzev et al. (2013). Real-life examples with photographs for each attribute value are available in the Glossary for GEM Taxonomy (Allen et al., 2021).
It is important to clarify that the MCR material is the only case where the GEM Taxonomy had to be extended to consider the local building practice, which is a combination of the more known confined masonry and reinforced masonry (Hidalgo-Leiva et al., 2021). In MCR, reinforced concrete masonry walls are confined by horizontal and vertical reinforced concrete elements. This material is the most popular one in Costa Rica for masonry structures.
Regarding the occupancy type, the results show that the main portfolio is of the residential type, followed by the commercial one. The widely predominant material type and lateral load resisting system (LLRS) are confined-reinforced masonry (MCR) and wall (LWAL), respectively. One- and two-storey buildings represent more than 96 % of the total number of buildings, corresponding to about 70 % of the total built area. Additionally, most of the buildings are regular (IRRE), and for the irregular ones (IRIR) the most common structural irregularity is associated with torsion eccentricity (TOR). The main floor material is reinforced concrete (FC) with respect to the built area and number of buildings since FN refers to one-storey structure.
A significant attribute that could not be extracted from the remote or in situ surveys was the construction period, which serves as a proxy to identify the design code that should have been used for each building, and therefore its expected performance under seismic loads. This was addressed by analyzing aerial photographs of San Jose from different periods of time, to be able to assign an approximate construction period for each building. Further details can be found at Blanco-Saenz and Esquivel-Salas (2021).
The results listed above in the form of tables and charts can also be presented as maps since every attribute identified is linked to the location of each of the surveyed buildings. With maps, the spatial distribution of any of the characteristics of the building is readily obtained. For the sake of clarity, only an example of one of the material type attributes is shown below, mainly to prove how useful they are.
The selected material type for this example is wood, with every building constructed with this material shown on the map generated for this attribute (Figure 8). As can be seen, a concentration of wooden buildings can be identified on the east side of the city. This is in agreement with a local study on wood houses of San José (Malavassi-Aguilar, 2013), which states that because of the Cartago 1910 earthquake, there were migrations to this part of the city to build new homes, selecting wood as the preferred material, since earthen constructions were prohibited on 12 September 1910 by the then president, Mr. Ricardo Jiménez (Castro, 2017).
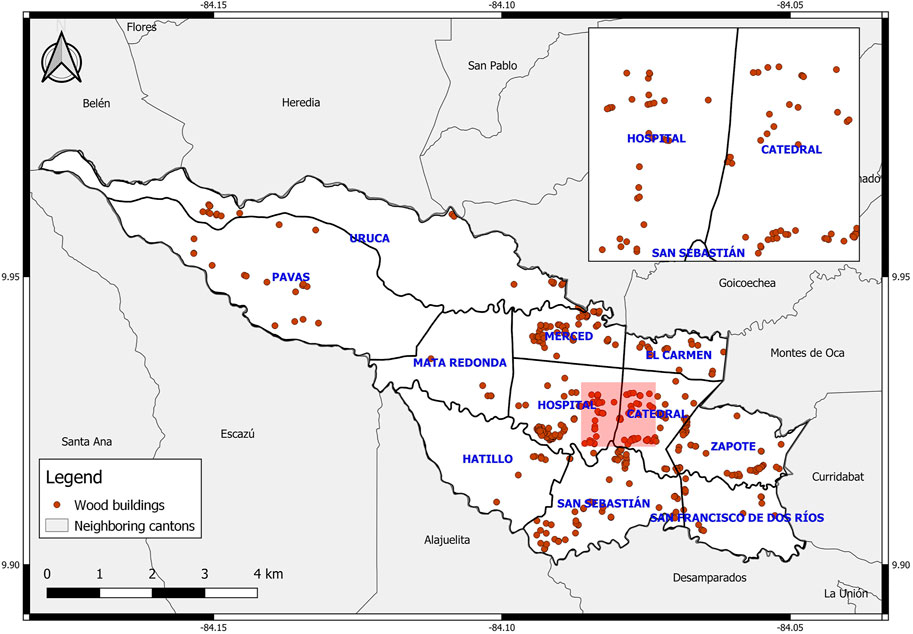
FIGURE 8. Map of buildings with wood material type.
3.2 Remote surveys
3.2.1 Applications, difficulties, and revisions
The 7,296 buildings were surveyed in a total time of 2,680 worked hours, for a mean time of 22 min per survey. The task that took more time, based on the surveyor’s opinion, was to identify in the panoramic images the building they had to survey. The buildings were readily recognized in the aerial photographs, by a polygon highlighting their footprint, but on the panoramic images, depending on the angles where they were captured, it was not straightforward, mainly because of the orientation of the images when loaded.
The main difficulty encountered was the lack of visibility reported for 2,168 buildings because of a complete frontal enclosure of the first floor, not allowing the survey to be executed. This enclosure is implemented by the owners to prevent robberies of the dwellings/buildings, an example is shown in Figure 9. These structures represented almost 31 % of the total sample and they were replaced by others that could be screened in order to survey as many buildings as possible.
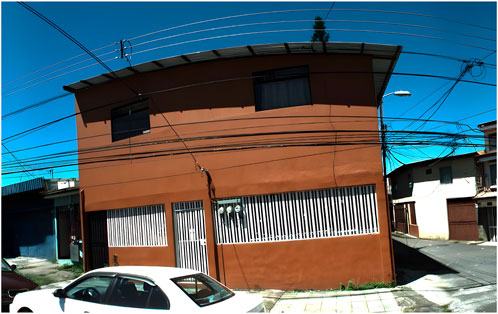
FIGURE 9. Example of a complete frontal enclosure of a dwelling.
Other difficulties presented were associated with the polygons that highlighted the surveyed buildings’ footprints to facilitate their identification in the aerial photographs. There were errors in position (4.2 %), geometry (6.1 %), and size of the polygons (5.8 %), representing a total of 13 %, approximately 950 structures (see examples in Figure 10). All of these errors were marked so that a geography assistant could correct them in the shape file containing the footprints of the buildings.
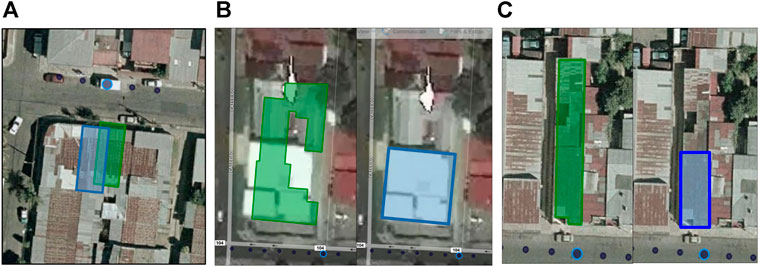
FIGURE 10. Difficulties with polygons highlighting building footprints. The color green denotes the polygon with error and the color blue denotes the corrected polygon. (A) corresponds to a position error, (B) to a geometry error, and (C) to a size error.
Of minor frequency, only for 1.5 % of the structures, a difficulty with the associated location (georeference) of the images captured from the buildings was encountered. The actual location of the photographs in these cases was about 10 m off from the georeferenced location shown in the RRVS, as can be seen in Figure 11.
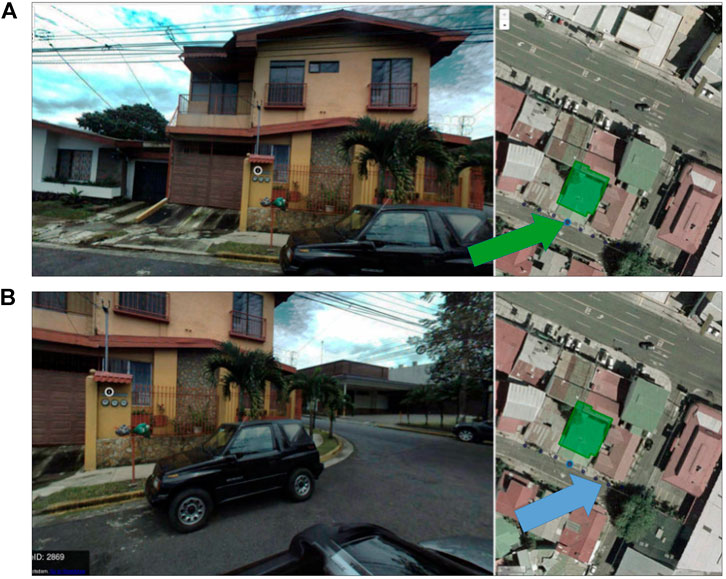
FIGURE 11. Difficulty with image position. (A) corresponds to the incorrect location of the image, pointed by the green arrow; (B) to the actual (correct) location, pointed by the blue arrow.
As explained in the “Visual data analysis through RRVS platform” section, in order to assess the quality of the data gathered by the surveyors, the supervising team conducted a total of four revisions throughout the remote surveys campaign. They consisted of identifying very rare combinations of “Material types” and “Lateral load resisting systems” (LLRS), taking into account of course the local engineering practice.
To this end, cross-tabulations (popularly known as cross-tabs) were conducted on the REM database, which are two-way tables forming a matrix indicating the distribution frequency of a pair of values, in this case. To show how these revisions increased the quality of the data gathered, is convenient to examine the first and last cross-tab, shown in Table 1.
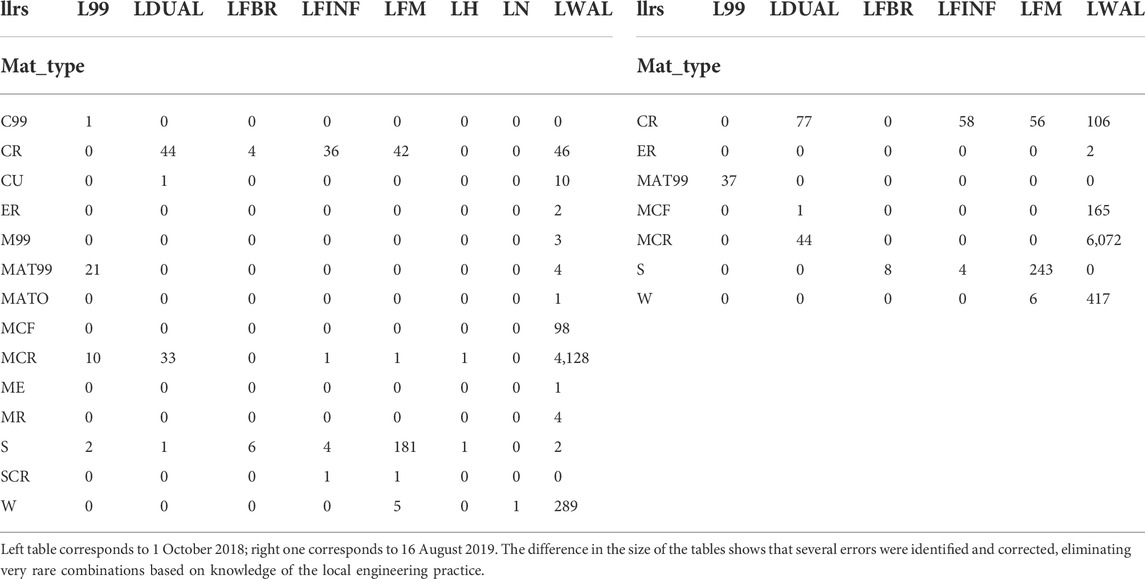
TABLE 1. Cross-tabs from Material type and LLRS.
The most important aspect to be seen is that the size of the last cross-tab is smaller than the first one and more compact. This indicates that several combinations were identified as “very rare” by the supervising team, prompting the surveyors to double-check their choices in order to minimize errors. The fact that the last cross-tab has 19 fewer combinations than the first one tells that some mistakes were successfully identified and corrected. A total of 258 structures were affected by this process, representing 3.5 % of the building set.
3.2.2 Precision levels
As it was explained in the “Remote vs. in situ surveys” section, for each one of the control buildings a comparison was made at the level of attribute types (more general) and attribute values (more specific). The results are shown in the following Figure 12 and Table 2, and should be read like the following: for example, 1) “the attribute type ‘Occupancy’ was misidentified by remote screening surveys for 23 % of the control buildings, 2) the attribute value ‘Confined-Reinforced Masonry (MCR)’ was misidentified by remote screening surveys for 6.3 % of the control buildings.” It is important to consider that a single control building can have more than one misidentification, that is, the sum of all the percentages from the table above does not equal the percentage representing the total amount of control buildings with misidentifications.
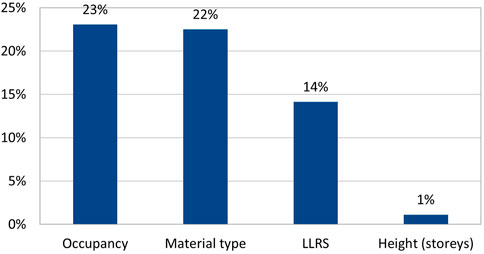
FIGURE 12. Misidentified attribute types (aggregated) in the remote surveys.
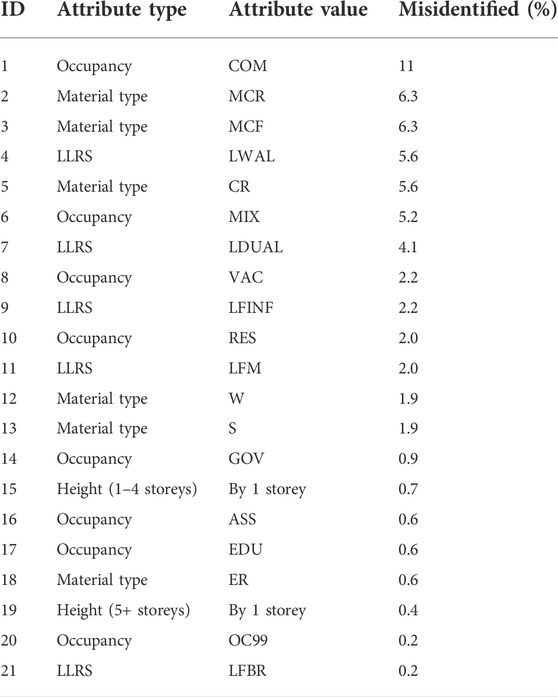
TABLE 2. Misidentified attribute values (disaggregated) in the remote surveys.
Of special interest are the misidentifications of the material type, because of its great influence on the actual and modeled behavior of structures under any kind of load. By performing a deeper analysis of this attribute type, the following chart (Figure 13) was generated. On the chart legend, the first value corresponds to the in situ survey reported value, taken as the reasonable truth, while the second one belongs to the remote survey one. The percentages sum to the 22 % shown in the previous graph (Figure 12).
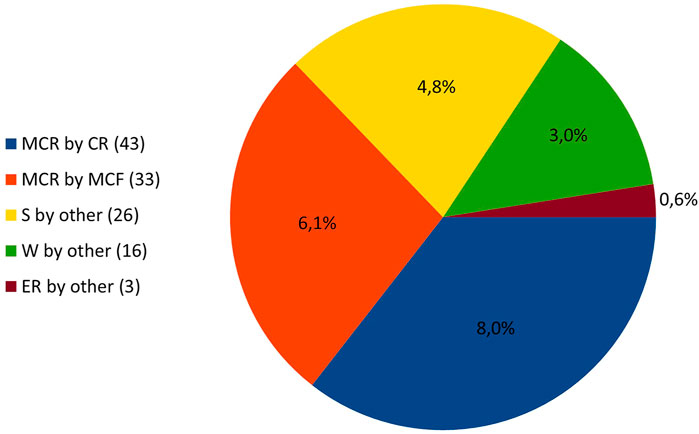
FIGURE 13. Material type attribute values exchanged in the remote surveys.
Also explained in the same section, on the broader level comparison was made based on the construction class assignment (building types), which groups buildings with similar structural characteristics and can be thought of as a weighted index that considers all the attributes identified for each building. This is important because it measures the impact of the misidentifications in the determination of the building type, which is the one actually used in seismic risk assessments, giving it another tool to characterize the precision level of remote surveys in the context of this study.
It was determined that in 75 % of the cases (402 buildings) the “remote construction class” matches the “in situ construction class.” Is the author’s opinion that this can be defined as the general level of precision of the remote surveys, for the reasons stated in the previous paragraphs?
4 Discussion
From the results, it can be interpreted that the set of buildings studied is predominantly composed of one- or two-storey residences, built with a wall lateral load resisting system (LLRS) of confined-reinforced masonry (MCR), a local Costa Rican material/construction practice. This is in general agreement with recent exposure models developed for Costa Rica, at a national level by Calderón and Silva (2019) and at the local San José canton level by Miyamoto et al. (2018), using an indirect top-bottom and direct bottom-up approach respectively, as defined by (Simpson et al. (2014).
For the seven characteristics (attribute types) examined (i.e., occupancy, material type, LLRS, number of storeys, structural regularity, irregularity type, and floor material), the differences in frequencies are larger for the “number of buildings” variable than for the “built area” one. For example, the relative frequency difference for several buildings between the first and second occupancy type (Figure 5) is just over 50 %, while for the built area this difference is approximately 10 %.
Only in the occupancy type and structural regularity attributes (Figures 7A, D), does the order of frequency of their possible values match both for a number of buildings and built area. The latter one has better chances to match because of the limited value possibilities: irregular, regular, or unknown. The predominant LLRS is a wall system, mainly because this is the one used with MCR.
Regarding the remote surveys, the application time of 22 min per survey for this study is within the range of 15–75 min reported for the Rapid Visual Screening procedure (FEMA, 2015) and is higher than the reported by Wieland et al. (2012) of 6 min per survey. In the latter case, it can be partially justified by the fact that local engineers applied the surveys versus last year’s civil engineering students for this study. Also, the principle of quality versus quantity was continually insisted to the surveyors throughout the project to get the best information possible from the available visual data. Regardless of this fact, better time performance will be an objective in future remote surveys campaigns conducted by the authors, including an examination of the requested 32 attributes to be screened in order to determine if all of them are strictly necessary, for the sake of reducing the survey length and thus the survey time.
The revision of the database using cross-tabs proved to be a valuable tool for quality control of the data pool, identifying on time possible wrong lectures, and preventing new ones. This is reflected in the 56 % decrease in the number of combinations of the pair of attributes examined.
The precision levels analysis shows that from the visual data collected, the misidentifications are concentrated on occupancy and material type attributes, mainly with commercial and MCR attribute values, respectively. The first one can be partially explained by taking into account that in San José it can be found unofficial commercial activities conducted in residences, so no attractive or big signs are used. The second one is related to the finishes of the facade in some buildings, covering the true materials of the structure and not being able to relate them correctly. The local engineering knowledge, work experience related to buildings, and special training minimize the possibility of misidentifications.
The 75 % overall precision level of the remote surveys determined in this study is a little higher than the one reported by Stone (2017) for the same kind of surveys conducted in Guatemala City. For the authors, this level of precision is acceptable subject to improvements, when compared to others associated with different data collection methods reported in the same reference. For instance, the precision level of in situ rapid visual screenings performed by surveyors with very limited structural engineering knowledge is about 50 %. This is likely the case with the national population and housing census, the preferred way of obtaining data by the indirect top-bottom approaches, where the average surveyor received very limited training in recognizing common construction materials of house finishes, as compared with the training in structural engineering and materials that last year civil engineering students possess.
5 Conclusion
A remote structural characterization of a set of 7,296 buildings located throughout the San José canton of Costa Rica was achieved, exemplifying the use of the data collection strategy from the Deutsches GeoForschungsZentrum (GFZ-Potsdam) called Rapid Environmental Mapping (REM), consisting on the application of remote surveys to analyze visual data associated for each building. This data is composed of panoramic 360° images collected with the GFZ Mobile Mapping (GFZ-MOMA) system and aerial photographs. The integration of the visual data along with the survey, for ease of application, was allowed via the GFZ Remote Rapid Visual Screening (RRVS) platform.
It was determined that the building set studied is mainly comprised of regular one- to two-storey residencies, made of confined-reinforced masonry with a wall-type lateral load resisting system. This is an interesting result, taking into account that major commercial activities are conducted in San José, in a sense that at a first glance one could think it was the main occupancy type for the city.
It was found that there is a significant difference in the frequency distributions of the attributes studied based on the variable used, in this case, a number of buildings or built area. It is important to be aware of these differences when conducting seismic risk assessments and presenting the potential loss estimations, in order to choose the best variable for the calculations.
The use of REM in San José canton, Costa Rica, a Latin American highly populated urban environment, enabled the identification of difficulties and consequently, the proposal and implementation of solutions for applying this kind of data collection strategy outside of Europe and Central Asia, where REM has been used in the past (Wieland et al., 2012; Pittore et al., 2015, 2018), suggesting that it can be used in other countries as well.
Opportunities for improvement were also determined, for example, reducing the number of attributes to be collected, 32 in the present format of the remote survey, to the main eight to ten structural attributes, and adding some important attributes for another type of risks besides earthquakes (e.g., floods, storms). The latter is for making the most of the resources assigned to the remote survey campaigns, considering it could have a use in multi-hazard risk assessments, not only seismic risk ones.
In situ surveys were conducted on a set of 556 control buildings, enabling the estimation of a measure of “overall level of precision” for the remote surveys, estimated at 75 %. Taking into account the large number of buildings that it permits to survey in a reasonable time with a spatially high coverage and the low costs involved when it is compared with in situ survey run by highly trained personnel, the pis considered consider acceptable subjective to improvements by the authors (see the “Discussion” section).
The results proved the adopted strategy to be a promising one, subjected to improvements, as is the case of methodologies when faced with applications on new latitudes and realities. The information generated in this study can be used for identifying spatial concentrations of structural characteristics (attributes) of interest, for example for implementing a retrofit campaign on buildings having an attribute associated with poor structural performance under seismic displacements/loads. It can also be used to generate statistically based local high-resolution exposure models, using the set of 7,296 buildings as a representative sample of the population of buildings. This was done for San José and is further detailed in Esquivel-Slas et al. (2022).
Data availability statement
The datasets presented in this study can be found in online repositories. The names of the repository/repositories and accession number(s) can be found below: https://doi.org/10.17632/8BY7R5SZCN.2 https://doi.org/10.4121/c.5618230.v1.
Author contributions
LE-S, VS-D, and MP co-directed the study. MP, LE-S, MH, and VS-D collected the visual data. LE-S, VS-D, and DH-L supervised the completion of remote and presential surveys. MP wrote the EDA script. MH implemented the RRVS platform. AM-F and MH installed REM on LIS-UCR servers. LE-S wrote the manuscript and MH reviewed, read, and approved the submitted version.
Funding
This study was carried out with funds from the “Transitory 1 of the National Emergencies Law (N° 8488)” from the Costa Rica Republic, assigned to the Seismic Engineering Laboratory—Engineering Research Institute—University of Costa Rica (LIS-UCR).
Acknowledgments
We would like to thank 1) the Municipality of San José, especially Lorena Romero and Werner Obando, for the valuable information they shared with us, and 2) the students that participated in this study: Joselin Morales, Jairo Chacón, Brayna Ruiz, Natalia Sánchez, Carolina Fajardo, Richard Godfrey, Katherine Méndez, Andrés Quesada, Steven Vásquez, Roger Herrera, Silvia Blanco and 3) the student Juan Carlos Araya for assisting in the formatting of the images and document.
Conflict of interest
The authors declare that the research was conducted in the absence of any commercial or financial relationships that could be construed as a potential conflict of interest.
Publisher’s note
All claims expressed in this article are solely those of the authors and do not necessarily represent those of their affiliated organizations, or those of the publisher, the editors, and the reviewers. Any product that may be evaluated in this article, or claim that may be made by its manufacturer, is not guaranteed or endorsed by the publisher.
References
Allen, L., Charleson, A. W., Brzev, S., and Scawthorn, C. (2021). Glossary for gem taxonomy. Retrieved January 6, 2021.
Blanco-Saenz, S., and Esquivel-Salas, L. C. (2021). Estimación del período de construcción de las edificaciones del cantón de San José por medio de análisis de fotografías aéreas. Rev. Geográfica América Cent. 2 (67), 85–106. doi:10.15359/rgac.67-2.3
Brzev, S., Scawthorn, C., Charleson, A. W., Allen, L., Greene, M., Jaiswal, K., et al. (2013). GEM Building taxonomy version 2.0. Pavia, Italy: GEM Technical Report, 188. doi:10.13117/GEM.EXP-MOD.TR2013.02
Calderón, A., and Silva, V. (2019). Probabilistic seismic vulnerability and loss assessment of the residential building stock in Costa Rica. Bull. Earthq. Eng. 17 (3), 1257–1284. doi:10.1007/s10518-018-0499-1
Castro, M. (2017). Entre temblores y cemento. Cambio Político. Available at: https://cambiopolitico.com/entre-temblores-y-cemento/88801/.
Costa Rica Republic Constitution (2017). Costa Rica republic constitution, 89. Available at: https://www.imprentanacional.go.cr/editorialdigital/libros/textos juridicos/constitucion_politica_digital_edincr.pdf.
Esquivel-Salas, L. C., Pittore, M., Schmidt-Díaz, V., and Haas, M. (2021a). Photographs of buildings from San Jose canton, Costa Rica, taken from the street. version 1. doi:10.4121/c.5618230.v1
Esquivel-Salas, L. C., Schmidt-Díaz, V., Hidalgo-Leiva, D. A., Pittore, M., and Haas, M. (2022). High resolution exposure model for San José. Costa Rica.
Esquivel-Salas, L. C., Schmidt-Díaz, V., Pittore, M., Hidalgo-Leiva, D. A., Haas, M., and Moya-Fernández, A. (2021b). Dataset of the attributes affecting seismic performance of a sample of buildings from San José-Costa Rica. doi:10.17632/8BY7R5SZCN.2
FEMA (2015). P-154 rapid visual screening of buildings for potential seismic hazards: A handbook. FEMA, January 388. doi:10.4231/D3M90238V
Hidalgo-Leiva, D. A., Pujades, L. G., Barbat, A. H., Vargas, Y. F., and Díaz, S. A. (2021). Nonlinear static and dynamic analyses of Costa Rican reinforced concrete masonry structures. Eng. Struct. 234, 111998. doi:10.1016/j.engstruct.2021.111998
Hu, Z., Huyck, C., Eguchi, M., and Bevington, J. (2014). User guide: Tool for spatial inventory data development. Gem. Tech. Rep. 60. doi:10.13117/GEM.DATA-CAPTURE.TR2014.05
Malavassi-Aguilar, R. (2013). “Los “barrios del sur” del Cantón de San José, Costa Rica. Los corredores históricos y la vivienda de madera, 1910-1955,” in La conservación del patrimonio en Costa Rica. Editors M. Aguilar Bonilla, and O. Niglio, 447–469.
Miyamoto, K. H., Gilani, A. S., and Nifuku, T. (2018). “USAID/OFDA PREPARE program for Costa Rica,” in Eleventh U.S. National conference on earthquake engineering. June 25-29. Available at: https://www.researchgate.net/publication/327845581_USAIDOFDA_PREPARE_Program_for_Costa_Rica_and_Colombia.
Parolai, S. (2016b). DB3 Guidelines of the mobile mapping system and remote rapid visual screening. SIBYL Proj. Deriv., 1–36.
Pittore, M., Haas, M., and Megalooikonomou, K. G. (2018). Risk-oriented, bottom-up modeling of building portfolios with faceted taxonomies. Front. Built Environ. 4, 1–14. doi:10.3389/fbuil.2018.00041
Pittore, M., Wieland, M., Errize, M., Kariptas, C., and Güngör, I. (2015). Improving post-earthquake insurance claim management: A novel approach to prioritize geospatial data collection. ISPRS Int. J. Geoinf. 4 (4), 2401–2427. doi:10.3390/ijgi4042401
PostgreSQL Global Development Group (2018). PostgreSQLCA, United States: The PostgreSQL Global Development Group, 2626.
Rosser, J., Morley, J. G., and Vicini, A. (2014). “User guide: Android mobile tool for field data collection,” in GEM technical report 2014-03 V1. doi:10.13117/GEM.DATA-CAPTURE.TR2014.03
Simpson, A., Murnane, R., Saito, K., Phillips, E., Reid, R., and Himmelfarb, A. (2014). “Understanding risk,” in GFDRR-world bank (Washington DC, United States: World Bank). doi:10.1136/bmj.329.7474.1086
Stone, H. (2017). Exposure and vulnerability for seismic risk evaluations. London, England: Doctoral thesis University College London. Available at: https://discovery.ucl.ac.uk/id/eprint/10051591.
United Nations, Department of Economic and Social Affairs (2018). World Urbanization Prospects: The 2018 Revision, custom data acquired via website. Available at: https://population.un.org/wpp/.
Keywords: building stock, remote survey, taxonomy, seismic risk, exposure model
Citation: Esquivel-Salas LC, Schmidt-Díaz V, Pittore M, Hidalgo-Leiva D, Haas M and Moya-Fernández A (2022) Remote structural characterization of thousands of buildings from San Jose, Costa Rica. Front. Built Environ. 8:947329. doi: 10.3389/fbuil.2022.947329
Received: 18 May 2022; Accepted: 15 August 2022;
Published: 08 September 2022.
Edited by:
Izuru Takewaki, Kyoto University, JapanReviewed by:
Iolanda-Gabriela Craifaleanu, Technical University of Civil Engineering of Bucharest, RomaniaConstantinos Repapis, University of West Attica, Greece
Copyright © 2022 Esquivel-Salas, Schmidt-Díaz, Pittore, Hidalgo-Leiva, Haas and Moya-Fernández. This is an open-access article distributed under the terms of the Creative Commons Attribution License (CC BY). The use, distribution or reproduction in other forums is permitted, provided the original author(s) and the copyright owner(s) are credited and that the original publication in this journal is cited, in accordance with accepted academic practice. No use, distribution or reproduction is permitted which does not comply with these terms.
*Correspondence: Luis C. Esquivel-Salas, bHVpc2Nhcmxvcy5lc3F1aXZlbEB1Y3IuYWMuY3I=