 Deborah Balk1,2*
 Daniela Tagtachian1,3
 Leiwen Jiang4,5
 Peter Marcotullio6
 Elizabeth M. Cook7
 Bryan Jones1,2
 Ahmed Mustafa8
 Timon McPhearson8,9,10,11
- 1CUNY Institute for Demographic Research, City University of New York, New York, NY, United States
- 2Marxe School of Public and International Affairs, Baruch College CUNY, New York, NY, United States
- 3Department of Sociology, CUNY Graduate Center, New York, NY, United States
- 4Population Council, New York, NY, United States
- 5Asian Demographic Research Institute, Shanghai, China
- 6Department of Geography and Environmental Science, Hunter College, Institute for Sustainable Cities at Hunter College, CUNY, New York, NY, United States
- 7Department of Environmental Sciences, Barnard College, New York, NY, United States
- 8Urban Systems Lab, The New School, New York, NY, United States
- 9Cary Institute of Ecosystem Studies, Millbrook, NY, United States
- 10Stockholm Resilience Centre, Stockholm University, Stockholm, Sweden
- 11Beijer Institute of Ecological Economics, Royal Swedish Academy of Sciences, Stockholm, Sweden
Cities are at the forefront of climate change action and planning for futures that are concomitantly more resilient and equitable, making local goals imperative for global sustainability. Under the multiple challenges of changing climatic, ecological and socio-economic conditions, cities need the means to meet these goals. We know cities are and will continue to be points of concentrated and diverse populations, socioeconomic vulnerability, amplified exposure, transformed ecosystems and are responsible for the bulk of the world’s greenhouse gas emissions. Yet, much is also unknown and intrinsically uncertain about urban futures: there is a range of potential plausible futures which have differing implications for both potential mitigation and adaptation actions. To better assess these plausible futures, the “global change” research community developed a framework including scenarios that are applicable for global and regional policy, entitled the Shared Socio-economic Pathways (SSPs) and scenarios exploring future emissions that will drive climate change, entitled Representative Concentration Pathways (RCPs). Importantly, this global scale framework does not include specific city-level perspectives or data at the spatial scales necessary to address questions of local relevance. While the SSPs address many of the key population and socioeconomic drivers of climate change, they do not address important concerns that are particularly relevant to cities, such as racial justice, ecosystem change or migration. Nevertheless, city-level impacts will evolve, in part, as a function of the global scale change characterized by the SSPs, and in part based on demographic and social processes already underway. As such, applying a modification of this framework to cities has the potential to help limit local climate impacts, and create a more resilient, equitable city. To address these needs and respond to city and regional stakeholders, we propose a framework for science-based narratives and quantitative projections for cities and metropolitan areas, such as Greater New York City. In this paper, we review a wide-range of existing approaches to generate estimates of future populations and identify their vulnerabilities to climate-change hazards, ranging from subnational population projections or the spatially-explicit allocation of populations linked to SSPs for the US and selected cities, city-specific population forecasting without climate considerations, and participatory approaches to future scenario development and fine-scale, within-city land use change models. By showcasing the strengths and limitations of various approaches and modeling efforts, their spatial and temporal scales, and thematic breadth, we propose a novel framework that leverages state-of-the art quantitative approaches and couples it with stakeholder engagement that can help cities plan equitably under uncertainty.
1 Introduction
Situated on at most 3% of the world’s land area (MacManus et al., 2021), cities, already home to the majority of the world’s population, are expected to be the location of most of the world’s future population growth (UN, 2018). They are also home to concentrated and diverse populations of people, as well as frequently located in critical hot spots for threatened species (Ives et al., 2016; Simkin et al., 2022). Given that cities are disproportionately located in coastal areas (McGranahan et al., 2007) and subject to warmer “heat island” effects (Oke et al., 2017), cities are particularly susceptible to multiple impacts of climate change (Depietri et al., 2018). Almost two billion urban residents globally are currently affected by extreme heat, with the urban poor inequitably impacted (Tuholske et al., 2021), and sixty percent of those living in the low elevation coastal zone at risk of storms and seaward hazards live in cities (i.e., about 14% of the global population) (MacManus et al., 2021). Due to their physical location, population composition, built-up density, and level of activity, urban areas are characterized by socioeconomic vulnerability, amplified exposure, and are responsible for the bulk of the world’s greenhouse gas emissions (Seto et al., 2014). Cities, because they tend to have their own means of local governance, are also uniquely situated to address the impacts of climate change at the local level, including matters ranging from housing and public health to biodiversity and equity (Lopez-Cantu et al., 2020). As such, cities are at the forefront of climate change action and planning for futures that are more resilient and equitable, making local goals imperative for global sustainability. Under the challenges of changing climatic and socio-economic conditions, as well as corresponding changes to urban ecosystems and the surrounding natural landscapes (Ives et al., 2016; Planchuelo et al., 2019; Adem Esmail et al., 2022; Simkin et al., 2022), cities are pressed to meet these goals. Yet, much is intrinsically uncertain about urban futures: there is a range of plausible futures which have differing implications for both currently planned and potential future mitigation and adaptation actions.
To explore and assess these plausible futures, the global change research community developed the Shared Socio-economic Pathways (SSPs), a framework including scenarios that are applicable for global and regional policy (O’Neill et al., 2014), and the Representative Concentration Pathways (RCPs), scenarios exploring future emissions that will drive climate change (Riahi et al., 2017). Notably, specific city-level perspectives or data at the spatial scales necessary to address questions of local relevance are missing from the global scale framework (O’Neill et al., 2020). While the SSPs address many of the key population and socioeconomic drivers of climate change, they do not address important concerns that are particularly relevant to cities, such as racial justice or migration. Nevertheless, city-level impacts will evolve, in part, as a function of the global scale change characterized by the SSPs, and in part based on demographic and social processes already underway. Thus, applying a modification of this framework to cities has the potential to help limit local climate impacts and create a more resilient, equitable city.
Potential futures will be driven by interconnected climate change, the socio-economic and demographic characteristics of the population, and structural racism that underpins current and future inequities and will lead to the most significant implications for cities’ most vulnerable populations. In 2021, the EPA released a report on climate change and social vulnerability which analyzed climate change impacts in six categories: air quality and health, extreme temperature and health, extreme temperature and labor, coastal flooding and traffic, coastal flooding and property, and inland flooding and property (EPA, 2021). This report demonstrated that minorities are most likely to live in areas that are projected to have the highest levels of climate change impact. For example, in comparison to others, Blacks and African Americans are 40% more likely to live in areas that have the highest projected increases in climate-driven mortality rates due to extreme temperature changes; Hispanics and Latinos are 43% more likely to live in areas that have the highest projected losses of hours of labor in “weather-exposed industries” (such as agriculture and construction) due to extreme heat; and, American Indians and Alaska Natives are 48% more likely to live in areas that have the highest projected percentage of land underwater due to sea level rise. Disparities are also predictable across other harms. Minority communities are more likely to have higher exposure to air pollution than other groups (Tessum et al., 2021). In comparison to the average American, African Americans are 75% more likely to live in “fence-line” communities—“communities that are next to a company, industrial, or service facility and are directly affected in some way by the facility’s operation (e.g., noise, odor, traffic, and chemical emissions)” (NAACP, 2017). Studies of urban areas across the US show that tree canopy is also unevenly distributed with low-income areas having significantly lower tree cover than high-income areas, and that these associations are correlated with housing segregation (Locke et al., 2021; Zhou et al., 2021) and differential heat exposure (McDonald et al., 2021). Vulnerabilities are neither solely place-based nor only associated with race and ethnicity, but are salient across a variety of dimensions. For example, the NRDC found that violations of the Safe Drinking Water Act (which guarantees access to clear and drinkable water for all Americans) were increased in areas predominantly composed of communities of color, low-income individuals, non-native English speakers, crowded housing conditions, and areas with less access to transportation (NRDC, 2019).
The inequitable impacts of climate change as well as the uneven distribution of environmental benefits and burdens (such as access to nature, tree canopy, placement of undesirable land uses and polluting facilities) are evident within cities (Rohat et al., 2021). For example, in New York City (NYC), heat waves disproportionately cause blackouts in low-income neighborhoods (Con Edison Media Relations 2019; Ortiz et al., 2022) and non-Hispanic Blacks living in rent-assisted housing face higher odds of mortality during warm seasons than other New Yorkers (Madrigano et al., 2015). Disparities persist across hazards (Foster et al., 2019). Lieberman-Cribbin et al. (2021) found that higher social vulnerability households were more likely to be exposed to flooding associated with Superstorm Sandy and were more likely to be lower income or older. Similarly, New Yorkers in low-income neighborhoods have, on average, 21% less access to public parks than residents in high-income neighborhoods and neighborhoods that are predominantly home to communities of color have, on average, 33% less access to public parks than predominantly White areas (the national average is 42% less access for low-income neighborhoods and 44% less access for communities of color) (Trust for Public Land, 2021). These disparities in access to ecosystem services today arise due to systemic inequities, for example through the legacy of redlining and housing discrimination in New York City (Herreros-Cantis and McPhearson, 2021) and throughout many cities in the US (Hoffman et al., 2020; Schell et al., 2020). Understanding the past is the first necessary step in projecting the future (Smith et al., 2006; Hamstead, 2021a).
Given that these disparities exist in the present day, what might they be like in the future and how will these conditions impact population vulnerability under different climate and demographic regimes? City-specific or even state-level demographic projections to date tend to be undertaken at spatial and temporal scales traditionally much shorter and more coarse than would be useful for planning with respect to climate change vulnerability (Jones and O’Neill, 2013). Further, local-scale forecasts do not typically have thematic breadth—that is, they focus on forecasting population by age and sex but not by race or ethnic groups or other characteristics associated with social or economic variation or vulnerability (Wilson et al., 2022). These shortcomings arise in part from (and are exacerbated by) disciplinary traditions which have been important in developing rigorous and different types of methods for population, land-use and climate projections, but they have concomitantly contributed to creating methodological silos that fail to respond to the needs of urban places in preparing systematically and equitably for their futures (Balk et al., 2021).
The objective of this paper is to develop a framework for multi-scale and multi-disciplinary modeling, which couples population and land use projections for cities and their surroundings using a climate and racial justice lens, with New York City as a case study. This work has not been performed to date, but is necessary for local climate adaptation planning. The framework builds on prior work that forecasts population futures in a demographically informed way, including efforts to model future population consistent with climate change outcomes—but also takes into account stakeholder engagement and the complexities that are apparent in cities regarding spatial distributions of resources (e.g., infrastructure and nature) and spatial distributions of vulnerable communities and populations. By proposing an integrated framework, we aim to close gaps in spatial, temporal and thematic coverage that heretofore exist from more discipline-specific approaches (Mohtat and Khirfan, 2021).
In order to develop this new framework, we address three intertwined research questions: 1) What are the key prevailing concepts for modeling (urban and total) population futures for the US and selected cities and what are their strengths and limitations in the context of long-term local applications that inform mitigation and adaptation responses to alternative climate scenarios?; 2) What are the strengths and limitations of current fine-scale, spatially-explicit, social-ecologically nuanced, and participatory approaches to modeling urban futures in the context of long-term local applications that inform mitigation and adaptation responses to alternative climate scenarios?; and 3) How can the methodological strengths and associated data of various discipline-specific approaches (with ever-improving spatial resolution of an expansive range of socioeconomic variables), be leveraged and integrated to create socio-demographically and social-ecologically informed futures for large metropolitan areas, such as greater New York City, in order to help local and regional stakeholders adapt to and mitigate against future climate change with a social equity lens?
This paper is organized as follows: We begin with a short background to the two traditions—demographic and scenario-based shared socioeconomic pathways (SSP)—to modeling the future. Section three lays out the material and methods for this study, including a discussion of the criteria for our review and the New York City case study. Section four presents a review of the strengths and limitations of various approaches and modeling efforts, their spatial and temporal scales, and thematic breadth. Section four ends with a proposed novel framework that leverages state-of-the art quantitative approaches and couples it with stakeholder engagement that can help cities plan equitably under uncertainty. The paper concludes in the fifth section with a discussion of the application and limitations of the framework, paying particular attention to equity considerations, and generalization to cities and metro regions throughout the US.
2 Background
Understanding population futures and socioeconomic pathways associated with different climate scenarios has largely been shaped by advancements in disciplinary thinking, and has occurred at a macro-scale (such as global or national units). In this section, we provide a short summary on population projections and scenarios that act as a starting point for scaling work to cities and other downscaled (or local) applications, which we discuss and build upon in constructing our framework in later sections.
2.1 Population projections: Understanding their strengths and limitations in the context of long-term local applications, and therefore with respect to alternative climate scenarios
Population projections provide fundamental demographic information for socioeconomic and environmental outlooks at global, national and subnational levels. Different methods, approaches and models have been developed to project changes in population sizes, compositions, and spatial distributions, to cover a range of population trends and produce a set of plausible demographic futures. The most frequently used are those that implement a cohort-component model (Burch, 2018). The cohort-component method is considered the gold-standard for national-level projections because it is robust (i.e., replicable and verifiable), has simple data requirements (which have improved substantially in recent decades), and is transparent to a wide range of users. This method is based on information about the current stock (size and age composition) and on various assumptions on demographic flows or components of change—fertility, mortality, and migration—rather than simply extrapolating trends in population counts over time. The components of change, particularly those associated with natural increase (i.e., births minus deaths), and related changes in age-structure, are more predictable based on past records than simple population counts. More importantly, the cohort-component model provides information on the changes in not only the total population size but also those in the composition (age, sex, and other characteristics such as race and ethnicity) of the population. Therefore, the cohort-component model has been applied to make short-, medium-, and long-term population projections at the global, national, as well as subnational levels.
Applying the cohort-component method for projecting population changes at a city or local level often encounters the problem of data limitation, especially when the projection includes population characteristics (or demographic traits) other than just age and sex. With increases in the number of demographic traits and spatial resolution, the data requirements (that is, having information on base year population and changes in fertility, mortality, and migration) also increase. While demographic forecasts allow for understanding future population composition, for example, by race and ethnicity or foreign-born status, using the cohort component method requires knowing fertility, mortality, and migration rates for each subpopulation group. As this data requirement is arduous, it can mostly be implemented at the national-level only (Vespa et al., 2018); few cities or states can produce such projections, with California being a notable exception (California State Department of Finance, 2020). Similarly, while fertility rates are reported in the decennial census data at the county-scale, sub-city data for fertility and migration has only recently been introduced as a variable in the micro-data series of the US Census Bureau’s American Community Survey (ACS) (at the tract-level). County-level mortality data for the US is reported by the Centers for Disease Control (CDC) and for NYC is reported by New York City Department of Health and Mental Hygiene (DOHMH) for sub-city units (such as modified ZIP codes). Given the smaller sample sizes in the ACS data series (than in the decennial census), while the ACS data are suitable for national, state-level and county-level projections (in most cases), they are unlikely to be suitable for application at the sub-county level. This is the reason that demographers and geographers develop additional methods for small area population projections, such as the Hamilton-Perry Method (a simplified cohort-component model, Hamilton and Perry, 1962) and methods that proportionally allocate projected city-level population to sub-city districts based on the current population distributions (Smith et al., 2006). Such approaches may be adequate for the short-term (Swanson and Tayman, 2017); but these typically cannot capture the changes of population across sub-city districts in the long run. As a result, population projections are typically conducted for small areas for a short period of no more than 40 or 50 years, and in contrast to national or global estimates, with only one medium scenario. This has been accepted as a standard for state and local projections because most are undertaken for shorter-term planning objectives (for which there is greater certainty) and have not taken into account the long-term impacts of climate change.
2.2 Scenarios and narratives for envisioning the future: From global to more local
Scenarios are effective tools to analyze future trends while addressing uncertainties (Peterson et al., 2003; Schoemaker 1991; van Vliet and Kok, 2015; van’t Klooster and van Asselt, 2011). Several different approaches to scenario development exist (Van Notten et al., 2003; Borjeson et al., 2006). While there is no universal scenario typology, literature reviews often include three types: predictive, exploratory, and backcasting (Borjeson et al., 2006). Predictive scenarios forecast how the future will unfold, based on preconceived development patterns. Exploratory scenarios sketch plausible futures, showing the implications of change in external drivers. Though not necessarily for prediction, they focus on what may happen if certain drivers are present, ultimately exploring uncertainty in outcomes and driving forces (Van Der Heijden 2000; Shearer 2005). Typically, exploratory projects include a set of scenarios constructed to cover a wide scope of plausible developments over a very long-time span. The third scenario type, backcasting, starts with the end state and works backwards, hence the name (Lovins 1977; Robinson 1982; Quist 2007). Backcasted scenarios often include normative approaches to developing a transformed future end state of the system, as well as the pathways needed to achieve the desired end state. In this review, we describe a range of scenarios and narratives, and their usages for city and metropolitan applications.
Though not much more than a decade old, there is already a well-developed framework for exploratory climate change and socio-economic development scenarios (Moss et al., 2008). This framework deploys, at least, two sets of data. The first set is defined as representative concentration pathways (RCPs), which embody climate changes through projecting different levels of greenhouse gas (GHG) concentrations in the atmosphere to 2100. The RCPs represent trajectories for emissions that subsequently affect the radiative forcing of the climate system (Van Vuuren et al., 2014). A variety of RCPs have been developed that span a wide range of emissions levels (numbered from 1.9 to 8.5)1. RCP8.5 is sometimes called the reference scenario and by the end of the century results in the highest global GHG concentrations and temperatures among all RCPs. Any deviation from this pathway, that is, any lower numbered RCP, is arguably a pathway that includes actions to reduce emissions (i.e., mitigation efforts or slowdown in economic growth). The second set of data in the framework is the shared socioeconomic pathways (SSPs), which describe development trends and conditions. The SSPs offer plausible alternative tendencies in the evolution of society and natural systems and include narrative descriptions and quantifications of selected socioeconomic variables at the national, regional, and global scales. There are a total of five SSPs, and each is categorized as a function of the pathways’ global challenges to mitigation and to adaptation (Riahi et al., 2017). That is, for each SSP, the level of energy usage; the increase in GDP, trade, population and urbanization growth; and the scale of international coordination, among other aspects, result in either benefits or challenges to climate mitigation or adaptation (O’Neill et al., 2020). Three of the five SSPs fall along the axis of low-to-high mitigation and adaptation trade-offs, including pathways nicknamed “sustainability” (SSP1), “middle-of-the-road” (SSP2), and “regional rivalry” (SSP3). Off-axis, there is an “inequality” pathway (SSP4) which has high challenges for adaptation but low challenges for mitigation, and conversely a “fossil-fueled development” pathway (SSP5) that is consistent with high challenges for mitigation but low challenges for adaptation. All SSPs are reference pathways and assume no climate impacts, and no new climate policies (Kriegler et al., 2014). While there can be multiple SSPs consistent with one of the RCPs, there are some limitations to matching SSPs and RCPs. For example, the emissions levels of RCP8.5 can only be achieved through SSP5 (a fossil-fuel development scenario).
Importantly, these scenarios were originally designed for global, regional, or national-level applications. Assumptions regarding the broad development and associated socio-demographic trends driving each scenario are based upon regional and/or national-level conditions. National-level population projections for each SSP are produced using a multi-state cohort component model. To apply these models to an SSP framework, assumptions are made regarding demographic futures. For example, to be consistent with SSP3, low fertility, high mortality, low migration, and low education are assumed for the US, while to be consistent with SSP1, medium fertility, low mortality, high migration, and high education are assumed. (Details on what constitutes low, medium or high fertility, mortality or migration is found in the Supplementary Note for the SSP data sets). The future population (KC and Lutz, 2017), urbanization (Jiang and O’Neill, 2017), and additional SSP-based socioeconomic data (e.g., Gross Domestic Product, GDP) associated with each scenario are all produced and reported at either the national or regional level (see SSP Database (iiasa.ac.at)). However the scenarios do not yet treat sub-national or city-scale conditions, or more importantly, the variation in conditions within the national-level narrative for each SSP. The original designers of the scenario framework did anticipate that researchers would further develop (i.e., extend) the narratives for specific geographies and contexts. The objective of the original work was to provide a structure in which sub-national narratives could nest, in an internally consistent fashion, within the global, regional, and national-level narratives.
To better assess plausible futures and to fulfill a planning need, the global climate change research community developed a set of narratives that are applicable for global and regional socioeconomic scenarios entitled the Shared Socio-economic Pathways (SSPs) (Moss et al., 2010; Kriegler et al., 2014; O’Neill et al., 2014; Van Vuuren et al., 2014), and the corresponding quantitative projections of demographic, economic, and technological changes under the SSPs for each country (Riahi et al., 2017). While climate science increasingly recognizes the importance of multi-scalar models recognizing urban centers (Sharma et al., 2021; Zhao et al., 2021), the SSP narratives do not include local or city-level perspectives or details necessary to address most questions of local importance (O’Neill et al., 2020). And while the SSPs address key socioeconomic drivers of climate change, the global SSPs do not address the nature of changes to the built environment, critical to understanding future vulnerabilities and consequences of different urban futures, nor do they speak to concerns that are prominent in city-life such as those relating to diversity, racial justice, or migration. Recent work to extend these narratives to regions (e.g., Absar and Preston 2015; Reimann et al., 2021) and cities (e.g., Kamei et al., 2016; Lino et al., 2019; Rohat et al., 2021) are just beginning to emerge. Similarly, other scholars use a visioning process to generate plausible scenarios for climate-adaptation futures—these tend to adopt a business-as-usual future (one of the five SSPs) along with stakeholder-driven framings to envision the future (Iwaniec et al., 2020b; Hamstead et al., 2021b). We review such efforts, and explore the possibilities arising from integrating different approaches in the Results section below, but we first describe the methods used to identify key perspectives and our choice of New York City as a case study.
3 Material and methods
Frameworks have been developed and applied to address climate change from a variety of perspectives from urban and city planning (Solecki et al., 2015), including those with a focus on nature-based solutions (Albert et al., 2021; Mansur et al., 2022), to regional planning (Yang and Cui, 2019) to a variety of sectors such as public health (Bikomeye et al., 2021). Such framework studies vary in the methods, but all include some means of expert assessment and review of key literature or evidence before constructing a framework, typology or set of best practices. Similarly, in order to create our interdisciplinary framework, we relied on the expert judgment of the author team which includes specialization in demography, ecology, geography, community lawyering, public policy, public health, sociology, spatial data science, and urban planning.
3.1 Criteria for inclusion as exemplar approaches
The goal of our review was to facilitate knowledge of key strengths and gaps (such as key variables “included” and “omitted”) in existing approaches across disciplines and to identify opportunities to fill those gaps. As such, the studies included in our review (Table 1, and also described in our Results section) form a narrative. We began by identifying key studies that pioneered methods to create spatial distributions of future population scenarios consistent with future climate change scenarios; then highlight key subnational demographic projection methods; followed by the identification of hybrid approaches that combine subnational demographic forecasts with spatial reallocation refinements; and finally we include narratives of alternative futures based on participatory scenario development. Our review did not aim to be exhaustive, but rather to provide a useful and systematic set of examples for developing our interdisciplinary framework.
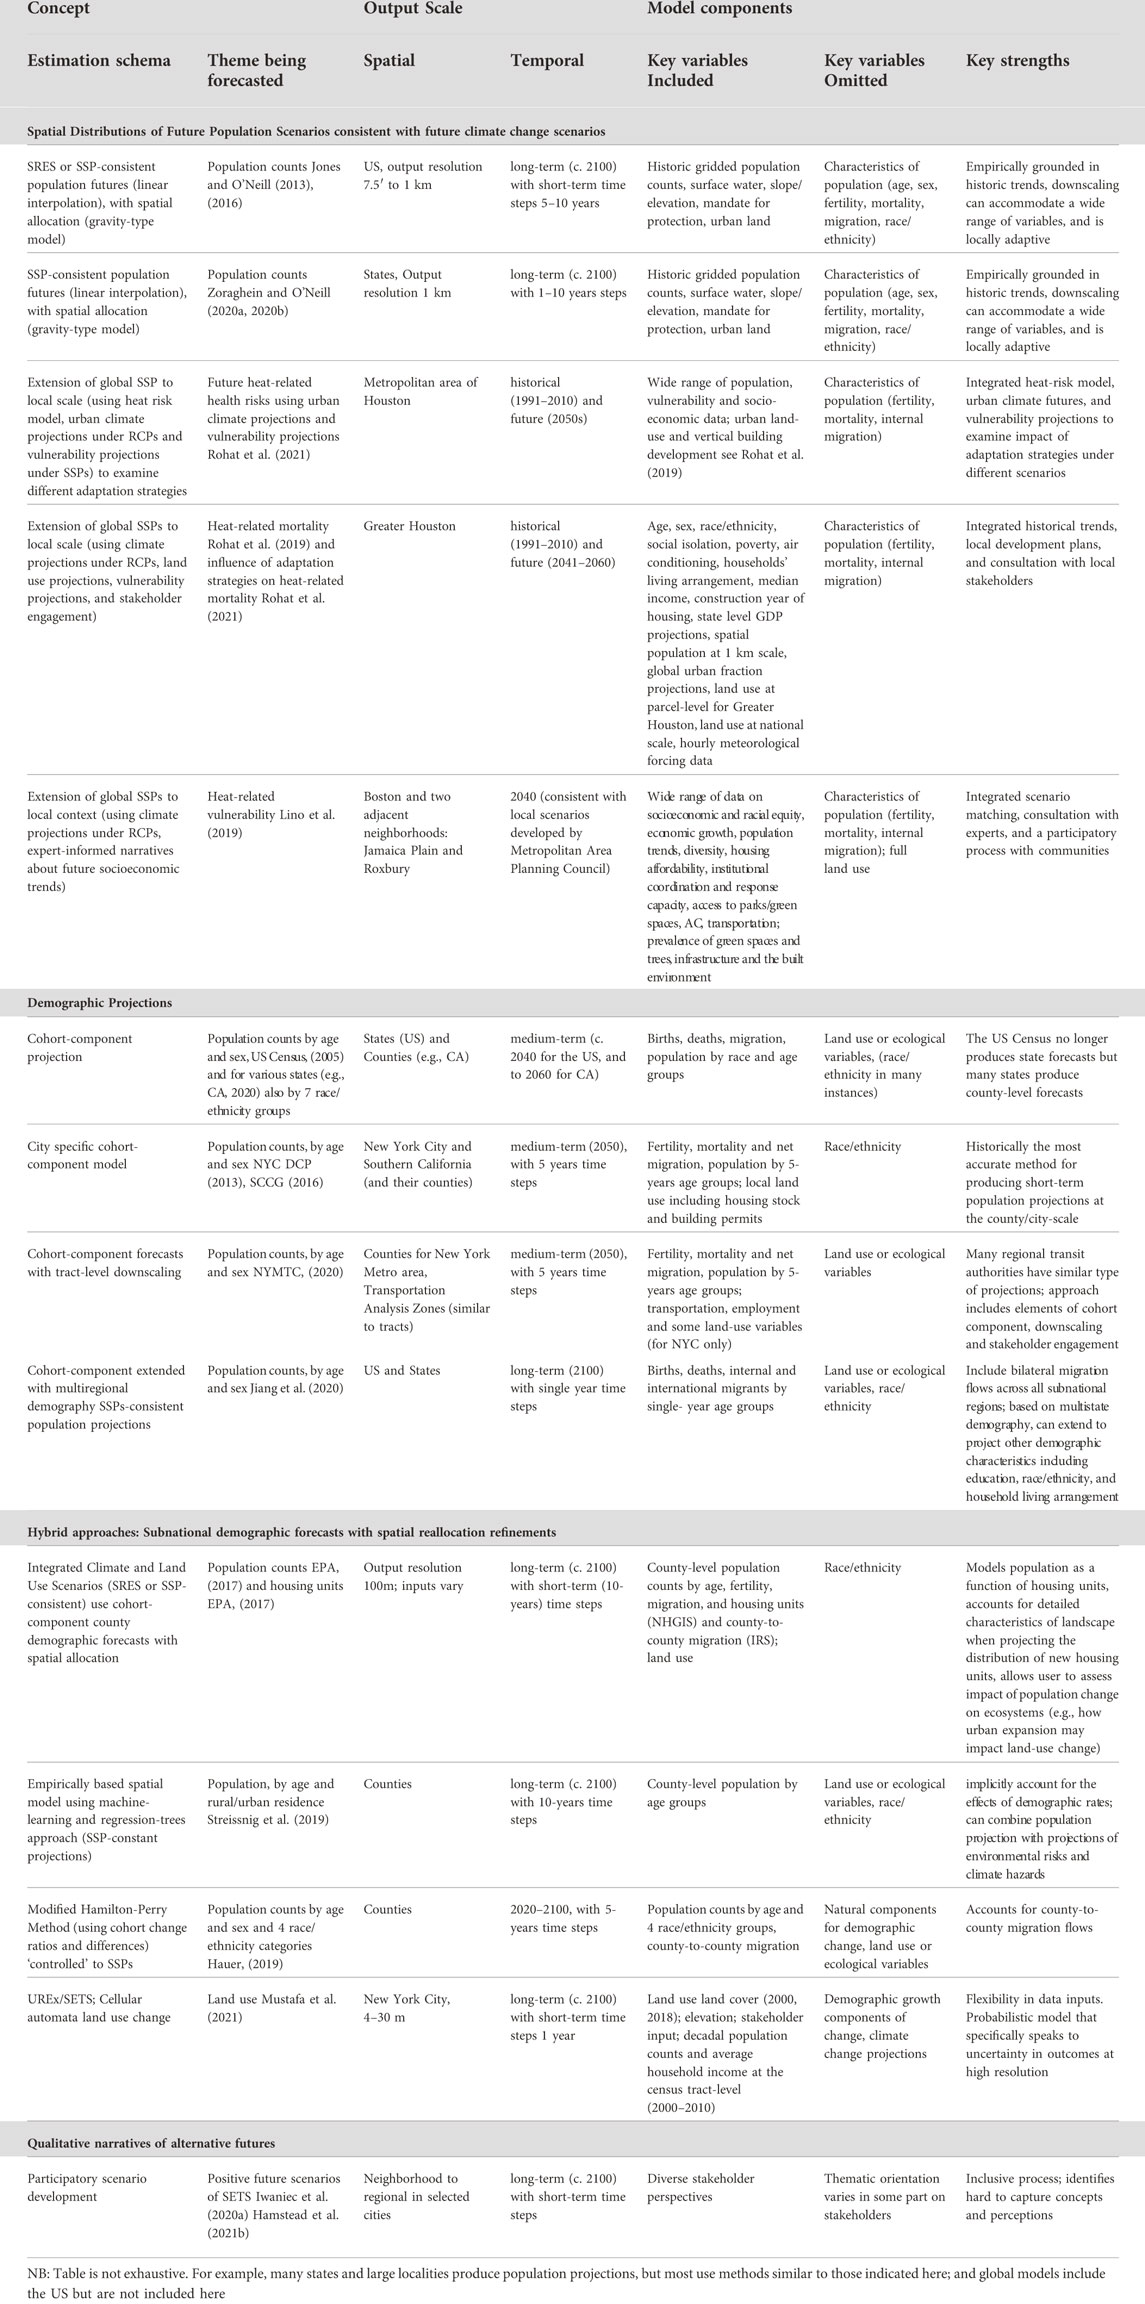
TABLE 1. Concepts and key features for population futures modeling for the US and its cities.
Further, our review brings together scientific traditions from different eras: while traditional demographic methods to project the future (for global, national and even state and local application) date back more than half a century (Smith et al., 2006); the SSP framework is a little over a decade old (Moss et al., 2010; O’Neill et al., 2014), with spatially-explicit demographic projections following thereafter; and the work of participatory visioning is even more recent (Iwaniec et al., 2021). Our review has selected examples from these different traditions respecting their scientific roots but also offering promise for modification with interdisciplinary collaboration in the future.
The spatial extent and scale of examples reviewed are, with a few exceptions, restricted to the U.S. and to subnational scales—neighborhoods, counties, cities, states, regions, and fine to moderate-resolutions for gridded outputs. Because there are so few examples of city-specific applications, we include a couple city-specific examples outside the U.S. We selected studies for inclusion that showcase methodological advances in projecting new themes (e.g., characteristics of population vulnerability) and at new spatial or temporal scales or by climate-exposures. We intentionally omitted data products that were exclusively national-level or subnational but relied exclusively on linear trend extrapolation of singular variables.
Similarly, we review projections and future scenarios that include the medium term (i.e., to about 2050) as well as the long term (i.e., to 2100). Short-term projections and scenarios were not included.
3.2 Contextualizing a local application: A case study of New York City and surrounding area
Demographically, New York City is one of the largest and most diverse cities in the US, with approximately 8.5 million people within its immediate boundaries and over 19 million in the metropolitan area in 2020 (ACS, 2020), with about 36% being foreign born (U.S. Census). Economically, it is a major location for international firm headquarters as well as a globally significant finance, insurance, real estate (FIRE) industrial center. Biophysically, the city lies at the head of the Hudson River estuary along the northeast coast of the US. During summers, it experiences high heat events and is one of the most vulnerable cities to tropical storms and hurricanes within the US and throughout the year the city is buffeted by Nor’easters. The most vulnerable residents of New York City, based primarily on their socio-economic status, are those also most at-risk to the extreme events associated with climate change including, inter alia, heat, sea-level rise, flooding, and coastal storms (Kinney et al., 2015; Foster et al., 2019; Herreros-Cantis et al., 2020). New York City’s government is engaged both in producing demographic projections as well as preparing the city and its communities and many agencies for future climate change, which we describe next.
The Population Division of the New York City Department of City Planning (NYC DCP, 2013), produces short-to-medium term population projections based on the cohort-component method. The most recent population projections are produced for each of the city’s five boroughs (i.e., the counties of Bronx, Kings (Brooklyn), New York (Manhattan), Richmond (Staten Island), and Queens) by age and sex with 5-year intervals from 2010 to 2040, constrained by a housing or land-use projection. For fertility rates and mortality rates, they use the average values of 2008, 2009, and 2010. Each county’s net migration rate (of both international and domestic migrants) is separately calculated using the survival rate method, which compares total population, as reported in the two censuses, to natural changes during the intercensal period. For the projection period, fertility is assumed unchanged, while survival rate increases by half of the US Census Bureau’s national trend. However, the projections of total population for the counties are largely and ultimately determined by local land use projections. The assumptions on land use and zoning, and housing constructions act to limit population growth, through adjusting the crude migration rates. Population projections are done for each county separately, without accounting for their interactions through migration.
In addition to its city-specific demographic projection, New York City participates in a regional effort. The New York Metropolitan Transportation Council (NYMTC, 2020)—which is mandated by federal transportation legislation for all urbanized areas with a population over 50,000 in order to qualify for federal transportation funds—adopts the DCP population projections for its Socioeconomic and Demographic (SED) forecasts and extends the projection period to 2055 and the extent to include 31 counties in the greater New York metropolitan area (rather than the five boroughs of New York City). NYMTC SED projections include input data of the population by not only age and sex, but also race. However, the projections do not provide output by race. Additionally, the single-region cohort-component model that accounts for net migration does not consider differences among in-migrants and out-migrants, or by internal and international migration. The migrants moving in and out of New York City from (and to) domestic and foreign origins (and destinations) can have very different age, gender, and ethnic profiles. NYMTC’s projection with its focus on transportation, also includes many additional variables in its model, including those derived from surveys (and other sources) on commuting, transportation, jobs and industry development, and more (NYMTC, 2015). Because NYMTC brings together representatives from many city and municipal agencies, part of the production of the final projection includes engagement with these data producers—that is, the various city and municipal agencies become stakeholders in the resulting projections. Unlike DCP’s projections, NYMTC uses a spatial allocation method to downscale population into transportation analysis zones (TAZ), which for New York City are akin to census tracts. The publicly-available projections of both DCP and NYMTC produce only one population scenario, based on a set of assumptions including current fertility levels remaining unchanged, the same proportions of increase in survival rates, and the adjusted crude migration rates by housing limits.
To address climate impacts, New York City’s government has been a progressive leader in climate mitigation and adaptation. For example, New York City adopted Local Law 42 in 2012 requiring regular, local climate assessments, and establishing city agencies addressing sustainability, environmental justice and so forth (NYC Service; Smart Connect, 2022). Currently the New York City Panel on Climate Change is undertaking the City’s fourth Assessment (NYC Office of the Mayor, 2019). However, improvements in our understanding of the key regional environmental changes expected this century are cause for additional concern across the metropolitan area (NPCC, 2019; Solecki and Rosenzweig, 2019) since New York may suffer changes of greater magnitude than the globally predicted averages across a number of climate-related hazards. For example, projected sea-level rise in the New York City metropolitan area is approximately twice that of the global average due to regional land subsidence (linked to isostatic rebound of formerly glaciated land to the north of the city) (NPCC, 2015). These and other changes will affect the city’s water supply, energy demand, public health, and community resilience, particularly among the city’s most vulnerable inhabitants (Jones et al., 2015; Marcotullio et al., 2018). Given its national and international importance and its current focus on climate planning and the future climate impacts New York City and the surrounding area will have to overcome, we consider it a compelling case study for developing local climate scenarios.
Figure 1 shows the jurisdictional boundaries of New York City, along with census tract-level population density (for the whole city in panel A, and a close-up in panel B), and land-use (same close-up extent in panel C), data which are key ingredients used in population “downscaling” and land-use modeling. Panel A also identifies the boundaries of New York City’s five counties and Public Use Microdata Areas (PUMA) that correspond to demographic data available from the American Community Survey (ACS), because those spatial units are associated with some data series of relevance to some types of population or land use modeling, as we discuss below.
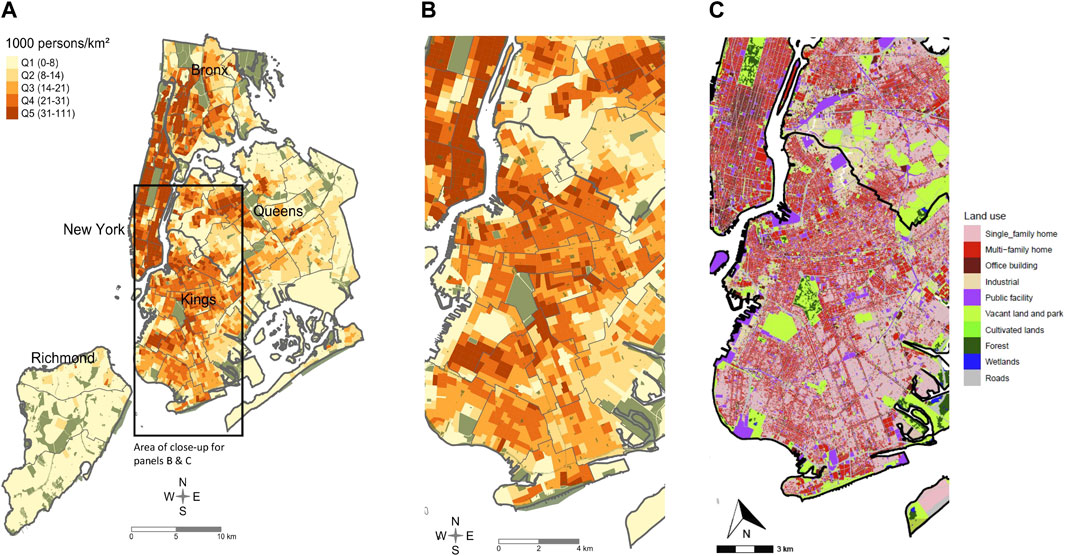
FIGURE 1. Population Density, 2000, with Public Use Microdata Area (PUMA) and county borders ((A), entire city; (B), close-up), and Land Use ((C), close-up), 2016, New York City.
New York City’s government operates to serve its five boroughs (counties), but also participates in regional planning efforts, some of which we review here. Thus, our case study considers both extents and we adopt a flexible spatial extent and scale and temporal units of analysis. Disciplinary perspectives impact spatial and temporal scales of the analytical units of inputs and outputs, and range from fine scale census units (such as block-groups or tracts), to coarser spatial units such as PUMA and Zip Codes (which are available throughout the U.S.) and Neighborhood Tabulation Areas and Community Districts (which are specific to New York City). As discussed in our review below, there are trade-offs between spatial, temporal and thematic specificity, and for that reason, we do not adopt a single set for our example.
4 Results
In this section we address our three interconnected research questions, with the ultimate goal of examining global frameworks that are used to assess and prepare for the impacts of future climate change and transforming them for use in local and urban applications.
To limit climate impacts and create a more resilient, equitable city, it is imperative that we understand potential future social-ecological and demographic pathways and how local stakeholders envision the future and can intervene to foster a more inclusive future (Iwaniec et al., 2020a; Cook et al., 2021). Adaptation policy, that is, preparing the population for the impacts of climate change, is an important local-level consideration. Involving diverse stakeholders at multiple levels to co-create and co-produce novel, positive visions of the future can be an important mechanism for bringing local communities into the adaptation planning process. However, adaptation is just one piece of a holistic approach to combating climate change. Identifying, anticipating, and mitigating future vulnerabilities is necessary to ensure an equitable future (Solecki et al., 2019) since populations change in size, age structure, race/ethnicity compositions, and in their spatial distributions and concentrations. In order to estimate future impacts (social, health, economic, etc.), projections and future scenarios must be richly thematic and the supporting data must be available at the sub-city level (Creutzig et al., 2019).
As reviewed above, traditional demographic projections are a well-known method for projecting future populations, but when undertaken for cities and other small areas, they tend to be shorter-term (extending out 30–50 years) and at coarser resolution (Wilson et al., 2022) than those needed by the climate-science community and those engaged in local or even regional adaptation planning. Thus, increasingly new tools (ranging from those with global extent to local bottom-up approaches) have been developed to envision population futures that are consistent with possible future climate change projection outcomes, which include developing future scenarios and narratives of plausible demographic and socioeconomic futures.
Our first two research questions are, respectively, to identify the prevailing concepts, and their strengths and limitations, for 1) modeling population futures, and 2) for use of fine-scale spatially-explicit, social-ecologically informed, and participatory approaches to modeling urban or city-specific futures in the US, in the context of long-term local applications that inform mitigation and adaptation responses to alternative climate scenarios.
Table 1 highlights key approaches for efforts focused on subnational and spatially explicit population projections or future narratives for the United States and some of its cities. In the following sections, we review the efforts, as well as those from beyond the US, that have helped to frame each approach. We structure each subsection starting with the broadest framing and work our way down to cities, with an application to New York City, where possible.
When applied to a local context, such as New York City, it is clear that in order to anticipate future vulnerabilities and to mitigate against them, or estimate the future costs and social or health impacts, it is necessary to have richly thematic projections of the future population of the city. However, despite the imperative to include measures of vulnerability as components of future planning, few city or regional efforts have materialized (as shown in Table 1). Thus, to address our third research question—how can we leverage the methodological strengths and associated data of various discipline-specific approaches and advances to create socio-demographically and social-ecologically informed and integrated projections or future visions for cities, in order to help local and regional stakeholders adapt to and mitigate against future climate change with a social equity lens?—our final subsection proposes a new framework with suggestions for ways to implement it in different communities of practice.
4.1 Contextualizing SSPs: Expanding the SSP framework to the local level
Several research teams have made recent advances in subnational population projections that correspond to socioeconomic scenarios (such as the SSPs) based on modified cohort-component methods and those using spatial downscaling tools, as shown in Table 1. These studies represent important advancements in that they provide information on population change that is more spatially refined and for long-term. These are described in greater detail below after first expanding the context of scenario development.
Yet, as regional and local actors begin to plan for the impacts of climate change, there is an increasing interest in those global narratives for a range of subnational usages, in order to include sub-national and local level pathways. In the US, there are numerous variations of applications to subnational units: Jones and O’Neill (2013), EPA (2017), and Jiang et al. (2020) represent three different approaches. These are discussed in the next section because the ways in which they differ largely involve how the demographic components of change were incorporated. With less attention to incorporating demographic methods (but largely relying on trend extrapolation of population change), studies have also extended the SSPs regionally to the Great Lakes (Méthot et al., 2015) and the US South (Absar and Preston, 2015).
The SSPs have been applied even less often at the local, city or sub-city scales (i.e., a further extension of the SSP narratives at a finer resolution). Nevertheless, interest in local scenario work is increasing as initial studies suggest the SSP framework can be used as a tool for examining local drivers of development. For example, a study in Flensburg, Germany extended four SSPs to develop local narratives to aid in adaptation decisions (a so-called “climate service”) in the flood-prone Baltic coastal city (Reimann et al., 2021). The authors employ a multi-scale co-production approach combining a bottom-up participatory approach involving local stakeholders and experts with a top-down thematic expansion of key elements associated with the existing SSP narratives and applied to the local scale. The authors used an iterative and collaborative process (through focus groups, workshops, and digital feedback) to develop the new local scenario elements far from those included in the global SSP framework (for example, care for the elderly and childcare, inequality between neighborhoods, and the implementation of adaptation measures). With these additions, the SSP framework becomes more relevant to local conditions and concerns.
In another study, researchers developed a multi-scale method to extend the SSPs to the city and neighborhood scale. Using Boston, Massachusetts as a case study, they combined experts’ elicitation, and participatory processes to contextualize and make the global SSPs locally relevant (Lino et al., 2019). The research focused on developing narratives of future neighborhood-level vulnerability to extreme heat under multiple plausible socioeconomic trajectories. The results found that there were large differences in outcomes suggesting the potential for risk reduction through social and urban planning policies. Focused on Tokyo’s long-term socioeconomic scenarios, Kamei and colleagues examine the driving forces of change and use expert interviews to base the relevant future narratives (Kamei et al., 2019). The results were three alternative future pathways to 2050. The research identified the importance of a city-scale scenario that addresses urban form elements and infrastructure. In another paper, researchers developed and quantified extended SSPs for Greater Houston (Rohat et al., 2019). In this project, the authors operationalized the SSP framework at the intra-urban scale and provided estimates of heat-related mortalities under multiple futures for 2041–2060. They find that the changes in population and vulnerability have the greatest influence on excess mortality and that socioeconomic pathways play a critical role in shaping future urban heat related challenges. We provide a discussion of their method for incorporating the demographic components of change in the section below.
4.1.1 Understanding spatial distributions of populations in the context of the SSPs
One way of estimating spatial population futures has been to take national-level future population change as given by the SSPs and then use spatial allocation methods to down-scale and distribute this population change over space. In this approach, historical population counts at a local or regional level are typically used, but the demographic components of growth (such as fertility, mortality, and migration) are not, and therefore, these approaches would be considered future estimates rather than projections. Recent applications have included more components on demographic composition, notably age structure and sex ratio (Rigaud et al., 2021).
A common approach at the global (Jones and O’Neill, 2016), national (Jones and O’Neill, 2013, 2016; EPA, 2017; Rigaud et al., 2018; Clement et al., 2021; Rigaud et al., 2021) and state level (Zoraghein and O’Neill, 2020a; Zoraghein and O’Neill, 2020b), has been to downscale population forecasts associated with the SSPs [or the older Special Report on Emissions Scenarios (SRES) in the case of Jones and O’Neil (2013)] using gravity-based spatial allocation models. This family of models often employs additional geospatial data to aid in refining the distribution of national (or state) level population projections across high-resolution spatial units (most often grid-cells). Examples include land-cover land-use data, elevation and slope, mandate for protection, crop yields, water stress, ecosystem productivity, roads, and built infrastructure. Projected future changes in the distribution of the population occur as a function of two factors; 1) a “neighborhood effect” based on a friction of distance parameter (the perceived cost, in monetary value and/or time, of travel) that controls whether cities sprawl or concentrate, and 2) local characteristics that make each point in space more or less attractive than its neighbors. The neighborhood effect is defined to match the narratives accompanying each SSP (Supplementary Note for the SSP data sets, Jones and O’Neill 2016). The importance of various local characteristics is determined by fitting a spatial autoregressive model to historic data, and the future impact occurs as a function of projections of each pertinent characteristic (e.g., higher levels of water stress will make a place less attractive).
In general, when compared to historical patterns of change, these models tend to work well for predicting broad trends in the spatial distribution of population (concentration vs. expansion of population) but it omits variation that occurs within spatial units (that is, differences between individuals or households or communities), including household decision making processes that drive these trends (Rigaud et al., 2018).
4.1.2 Projecting population in the context of the SSPs
As shown in Table 1, recent work has included modifications to earlier global-extent national-level population projections, by simultaneously projecting population changes for all the US states with a multiregional population projection model (Jiang et al., 2020). While the state-level projections are consistent with global-extent national-level SSPs, they explicitly address the large variations in demographic variables across the states, especially the different patterns of internal and international migration flows between the states. The state-level population projection outcomes are then downscaled to grid cells at 1 km resolution (Zoraghein and O’Neill, 2020b), which reveal significant differences in spatial population distributions compared to the results downscaled from global national projections (Jones and O’Neill, 2016).
Several other subnational population projections have been produced to be consistent with the SSPs. Hauer (2019) derived changes in population size by age group for each SSP at the county level, to 2100, using an expanded Hamilton-Perry method. This model is based on past trends without explicitly accounting for demographic changes. Although this approach has the advantage of reducing data requirements for small area population projections, it does have its limitations for projecting long term trends like SSPs (Rogers and Woodward 1991; Smith et al., 2006).
While most of the existing spatial population projections are the result of downscaling the projected total number of people (often by rural and urban residence) to grid cells (as described in the section above), a recent work by Striessnig et al. (2019) uses complete age structure (somewhat like the Hamilton-Perry method) with a regression-tree model—that is, it uses a predictive algorithm in machine learning to explain how a target variable’s value can be predicted based on other values—to generate county-level projections of population by age groups for all counties consistent with the SSPs. Using an empirically-based spatial model, it reveals wide variations in the spatial pattern of county-level age structures across SSPs.
For projections to capture the complexities of social vulnerabilities, many more data inputs are required, and as such few studies have undertaken this, but for this reason it also bears additional elaboration. To estimate heat-related risk and mortality in the 2050s for Greater Houston, Rohat et al. (2019), extend the global SSPs to the local scale and combine extreme-heat projections (to account for urban heat islands) with population and vulnerability projections. Using the Hamilton-Perry method, the population projections take into account a number of variables including population counts by age, sex, and race/ethnicity (at the census tract-level), and county-level projections of populations and households under the SSPs and use several scaling factors (urban, suburban and rural for spatial patterns, and national age-sex cohorts projections for aggregated totals) as consistency checks. Their vulnerability projections include projections of social isolation (single-person households), poverty (which take into account median income, persons in poverty, and GDP projections at the state level under the SSPs), and the prevalence of air conditioning (which takes into account both the prevalence of AC and the year the housing units were constructed). In addition to these projections, the heat-related mortality modeling also takes into account land use projections and urban climate projections. By producing these three independent projections, the study team then estimates future exposure to extreme heat. In a related paper (mentioned below), Rohat et al. (2021) take the output of this study to use with stakeholders to examine the influence of different adaptation measures on extreme-heat outcomes.
4.1.3 Application of these advancements to cities
To enhance demographic projections and cover the plausible range of population trends for New York City and other large cities and their surrounding regions, there exist some advanced demographic models and approaches. Recall, city and regional projects often include a single output for up to a medium-term, and therefore, no confidence bounds (see Table 1), but for longer-term projections (needed to plan for climate-change), uncertainty is intrinsically higher. Some new methods from global efforts may hold promise: For example, the UN Population Division recently adopted the Bayesian Hierarchical model to project a range of population changes under various confidence intervals for all countries of the world (Raftery et al., 2014; United Nations Department of Economic and Social Affairs Population Division, 2019) and efforts are underway to apply to subnational units (Ševčíková et al., 2018), yet these methods have not been widely adopted for cities. (A similar approach of probabilistic population projection was developed earlier by the International Institute for Applied System Analysis (IIASA) based on an expert opinion method (Lutz et al., 2001).) Although the probabilistic approaches can be used to assess the uncertainty of demographic trends, the method cannot be used to investigate the impacts of demographic determinants on population dynamics and the consistency of assumptions about changes in sociodemographic variables (Jiang 2014). It cannot help determine the influence of socioeconomic and environmental policies, or answer “if … then … ?” questions. Therefore, the probabilistic population projection method is usually not used for developing projections consistent with the SSP framework.
Instead, an expanded cohort-component model—multistate (or multiregional) demographic methods (that is, those that allow for transitions between places (e.g., migration between states) or attributes (e.g., level of educational attainment)—is adopted to develop alternative scenarios, based on expert opinions, for population projections at national (KC and Lutz, 2017) and subnational (KC et al., 2018; Jiang et al., 2020) levels. Since cities and regions typically use a cohort component method, it would be a natural extension for them to adopt multistate methods. The global, national and subnational population projection results are further spatially allocated, or downscaled, to grid cells at various resolutions using gravity models (Jones and O’Neill 2013; Zoraghein and O’Neill 2020a, 2020b). Local planning and land-use models use a variety of spatial allocation methods, so this acts as an entry point for integration with demographic forecasting.
4.2 Participatory visioning and local land-use approaches to modeling urban futures
Participatory visioning is an approach that can capture the nuances of the local context and be a bridge with other exploratory, larger scale scenarios, such as the SSPs and RCPs (Cook et al., 2021). Similar to the SSPs, participatory visioning is an exploratory or backcasting approach to develop and examine plausible alternative futures and the pathways needed to achieve those futures. Different from SSPs, the participatory visioning process can account for local city or neighborhood scale and context, while also building upon projections for future weather-related conditions, such as expected climate changes. The participatory process has the added benefit of integrating perspectives of diverse stakeholders (notwithstanding that some of the above-mentioned SSP extensions are co-produced with local stakeholders e.g., Reimann et al., 2021 and Rohat et al., 2021) into the co-production of future scenarios. Examples of the participatory visioning process at local scale can be drawn from the Urban Resilience to Extreme Event Sustainability Research Network (UREx SRN) and the Social-ecological-technological systems (SETS) Convergence projects (urexsrn.net, http://convergence.urexsrn.net) both of which utilize a participatory process—with local community and government stakeholders—to co-develop resilient, desirable future long-term scenarios for urban contexts in North and Latin America (Hamstead. 2021a).
Much of the dominant discourse around urban futures is dystopian with business-as-usual forecasts making it difficult to develop actionable plans and policies for generating more positive futures (McPhearson et al., 2017). Such negative discourse around urban futures can leave little reason to invest in long-term social and environmental goods, nor does it recognize the vast possibility within existing creativity and innovation at all levels that already drive much of development in cities. Positive visions, in contrast, are critical to guide urban planning, motivate actions, inspire innovative strategies, and move toward transformative change (Iwaniec et al., 2021; McPhearson et al., 2021). In response, methods to work with stakeholders to develop alternative resilient, desirable scenarios have been developed (Iwaniec et al., 2020a; Cook et al., 2021) that allow for diverse stakeholder perspectives to be articulated as qualitative futures which can also then be translated into quantitative futures. Through a co-production process working with local stakeholders at neighborhood or citywide scales, a backcasting approach has been used to allow for a normative goal setting and working backward to develop the pathways needed to achieve those goals (Iwaniec et al., 2020a). The most common strategies proposed throughout the workshops were related to adding green infrastructure, linking green spaces, relocating people from weather-related hazard zones, and increasing built-up density (Iwaniec et al., 2020a; Hamstead et al., 2021b). In the UREx SRN, the scenario development process integrates creative storytelling through narratives, drawn vignettes, and design renderings into the development of future visions that are then coded and translated into spatialized futures, where possible.
The new visions, goals, targets, and strategies can be spatialized to examine urban futures where population density, land use, land cover, and other urban characteristics can change. The future visions are coded into spatially and temporally explicit land use transition rules to be simulated through a land use/cover change (LUCC) model (as shown in Table 1). Land use change models are widely used to simulate future land use patterns that assume no major changes in socioeconomic settings or policies so that the future changes are just an extrapolation of observed historical changes (even though many land use change models that have examined past changes and/or simulated possible future land use patterns have found that many demographic variables are important drivers of land use changes (Puertas et al., 2014; Rienow and Goetzke 2015; Ku, 2016; Vermeiren et al., 2016; Saganeiti et al., 2021).
In the URExSRN, a Cellular Automata (CA) LUCC model developed by Mustafa et al. (2021) was used to simulate multiple future visions. The model allows a wide range of spatial changes in ecosystem properties and neighborhood-scale (such as census tracts) social behavior to be examined together, though only total population and median income are used currently to model social behavior (Mustafa et al., 2021). These models optimize fine resolution spatial inputs, and processes, with the current version of this model to simulate LUCC in NYC running at 4 m × 4 m resolution, which is much higher than the previous versions. In terms of temporal scale, inputs to the LUCC model include inputs from 2001 to 2016, used along with the future visioning process to generate annual, long-term (to 2080) simulations. Figure 2 illustrates an example of the output, that is, future visions for Baltimore, MD within the URExSRN. For example, the “Resilience to Multiple-hazards” vision suggests urban areas within floodplains are converted into open and green spaces, many ecological corridors are created along major roads across the region, and many small green patches are added across the region to increase access to green space.
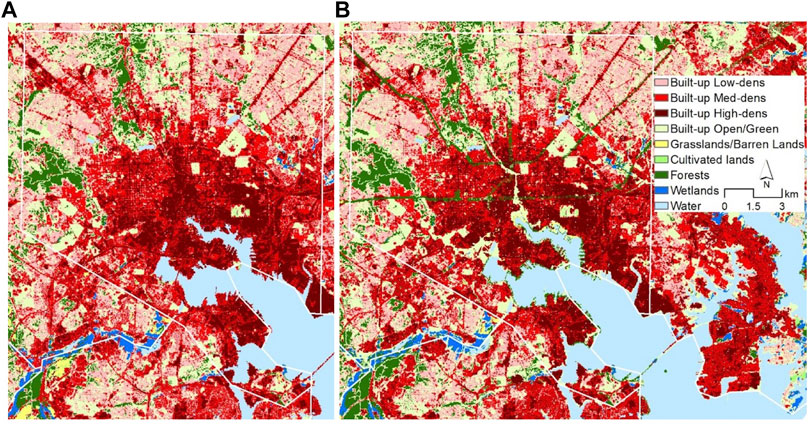
FIGURE 2. Examples of 2080 land-use simulations: for (A) Business-as-usual (A) and Resilience to Multiple-hazards (B), for Baltimore, MD.
4.3 Framework for integrating population perspectives with scenarios and narratives to envision the future
To answer our third research question, we propose that methodological strengths and associated data inputs from the various disciplinary-specific approaches with increasingly improved spatial scale and thematic range—demographic and land-use forecasting, future visioning processes at sub-city scales—can be leveraged to forecast diverse populations in large cities, like New York. Below we set forth a framework, illustrated in Figure 3, that draws on the core principles of the methods and typical data inputs described above. The funnel is symbolic of the potential to develop a multi-level modeling approach to produce detailed high-resolution data outputs at the sub-city scale enabling a more holistic approach to climate impacts, adaptation, and vulnerability research within the context of the SSP/RCP or related narrative frameworks. The diagram also includes examples of possible data outputs that could result. Towards this end, we suggest some ways to develop fuller, more interdisciplinary and inclusive models. Furthermore, these ingredients can be tailored to a wide-range of disciplines and communities and therefore, we offer a mix of suggested improvements to be implemented depending on the application. As noted in the diagram, and as the examples below describe, users must consider inherent trade-offs between thematic breadth, spatial resolution and temporal scale.
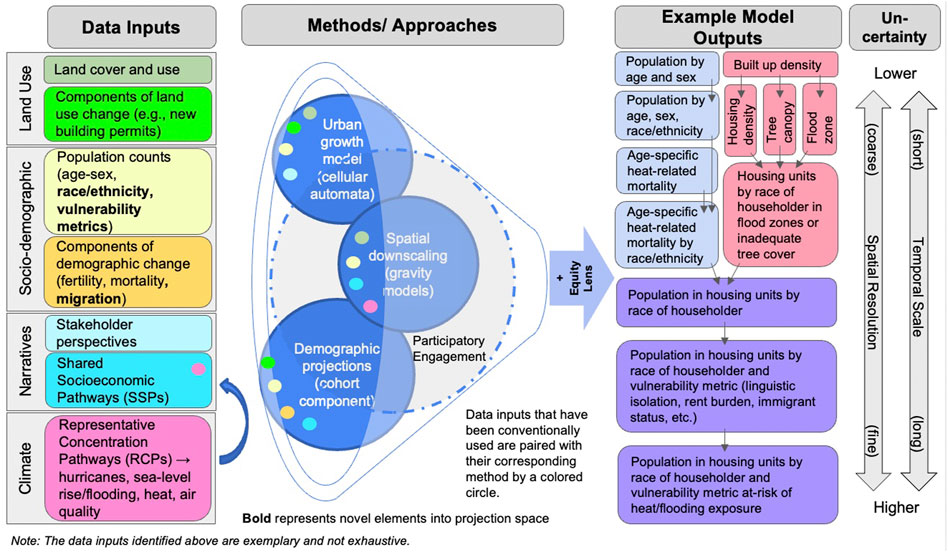
FIGURE 3. Framework for integrated modeling of local and regional population and land use projections with equity considerations.
The remainder of this section is organized around four recommendations that act as entry points for implementation of the Framework.
4.3.1 Undertake city and regional demographic forecasting at higher spatial resolutions and with more demographic variables, including race and ethnicity
The state-level work of Jiang and O’Neill (2020a) is an excellent example of a demographic projection methodology that could refine its spatial resolution and expand its thematic breadth. It would adapt its multistate cohort-component model to project changes in population by age, sex, race and ethnicity, among other factors: NYC county-level forecasts by race and ethnicity would be the first expansion of the existing state-level work (Jiang et al., 2020). The demographic inputs to this type of modeling include age-, gender-, and race/ethnicity-specific fertility, mortality, and migration rates, which can be derived from the censuses and ACS data at county (and possibly, finer-resolution PUMA)-level. Because the ingredients for this type of estimation are micro-data samples (that is, knowing the demographic behavior of individuals by their age, sex, and race), this process depends on the size of this micro-data samples (i.e., whether the sample is 5% or 1% of the population), and the size of the population. For example, PUMA data are groups of 100,000–200,000 persons. In New York City, this results in many sub-county units (as shown in Figure 1).
This approach could produce model results consistent with different SSPs, including SSP1 (the “sustainability” and most climate-friendly scenario), SSP2 (the “business as usual” scenario), and SSP4 (the “inequality” scenario, a future that best highlights the challenges through the lens of racial and social justice principles across and within regions). To develop the SSP population scenarios requires different assumptions about future changes in fertility, mortality, international and domestic migration, based on historical data and understanding of future plausible trends. Whether the same assumption framework that is adopted in national or state-level work would be used, or whether alternative methods that would be generated by engagement with local stakeholders depends on the desired outputs and their intended uses. While the multistate cohort component model can be used to project population by age, sex and race, the PUMA level is certainly the smallest spatial unit that this type of modeling could possibly support. This leaves the matter of population redistribution to spatial downscaling methods to which we now turn.
4.3.2 Model spatial refinements of future population based on historical patterns of population by race, ethnicity and other characteristics at a neighborhood scale
A second example comes from understanding the spatial distribution of future populations. Population downscaling models such as those described above use ancillary data to spatially allocate current and future population. The maps shown here provide clear examples of neighborhood level change: Figure 4 shows changes in the spatial distribution of population by racial and ethnic groups in New York City from 1980 to 2020 (data for 1990 and 2010 are available but not shown).2 From the top, this map shows changes in percent of population by racial and ethnic groups: Non-Hispanic Asian and Pacific Islander population, Non-Hispanic Black population, all races of Hispanic ethnicity, and white population. To provide further context from 1980 to 2020, the Asian population increased from around 249 thousand to 1.4 million; the Hispanic population increased from 1.4 million to 2.4 million, the Black population increased from 1.69 million to 1.77 million, and the white population decreased from 3.7 million to 2.7 million. Total population of the city increased from 7.07 million to 8.5 million over this period with increases in population density throughout the city (not shown).
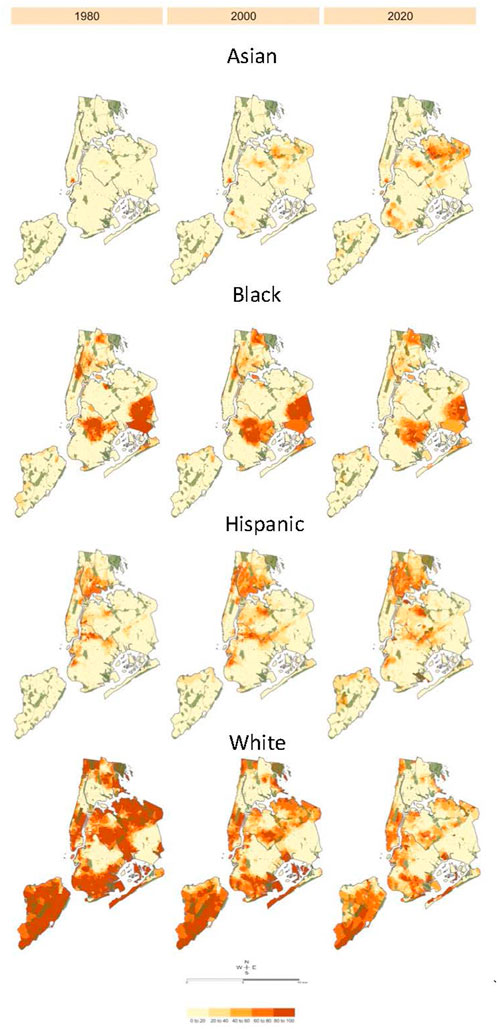
FIGURE 4. Percent of the population by race and ethnicity, New York City, 1980–2020, based on decennial census tracts.
As seen in Figure 4, there have been significant changes in the spatial distribution of population by race and ethnicity in New York City. In 1980, the Asian population was much smaller and largely concentrated in Chinatown on the lower east side of Manhattan. By 2020, it has spread to Queens with high concentrations in Flushing and Forest Hills and western Brooklyn. The Hispanic population also grew substantially from 1980 to 2020, and continued to concentrate in the South Bronx, northern Brooklyn and northern Queens, while also increasing across the city, The Black population remained largely concentrated in Harlem, northern Brooklyn and southeastern Queens, though in decreasing shares in all three neighborhoods. While trend data are not necessarily the most robust choice for modeling population futures, and as noted above there are caveats to small-area population projections especially if they represent changes that are “harder-to-predict,” they can nevertheless provide the basis for spatially explicit future scenarios, particularly if used in the short and medium-term and as a basis for engagement and the development of narratives for the longer-term. This is especially the case for data on spatially-explicit racial and group compositions, or other vulnerability metrics, which at a scale finer than borough or PUMA are unlikely to ever be produced through for example cohort component forecasting methods.
Given that current population downscaling approaches already use historical population change as one component to aid in future population change (Jones and O’Neill, 2013), these data are likely to be useful in predicting future population distributions by race and ethnicity in spatial downscaling models. The data in these figures are based on census tracts, and whether future distributions should be based on tract-level or somewhat aggregated level-neighborhood change is an open question. Additional ancillary data that can be shown to correlate with spatial population change, and the distribution of the city population by important demographic characteristics, in the empirical record (e.g., migration status, which may indicate where recent migrants are most likely to settle, an important characteristic as this group tends to be disproportionately vulnerable to hazards) are critical to robust methods for producing future scenarios. Similarly, spatially explicit data regarding future climate hazards such as sea level rise and/or flood risk will help to characterize exposure, vulnerability, and future residential patterns under alternative climate futures.
4.3.3 Use sub-city population projections in land-use models and projections
A third example comes from incorporating population change into a multi-level land-use model. Changes in demographic characteristics directly affect land uses (Hoffmann 2021) and the LUCC model can help address changes related to ecosystems, whereas the population projections cannot. Though some LUCC models include socio-demographic factors such as population density, household size and type, job access, and unemployment rate to explain variation in LUC changes (Cammerer et al., 2013; Achmad et al., 2015; Mustafa et al., 2017; Guo and Zhang, 2021), current models do not account for the changes in socio-demographic characteristics that will influence the land-use change process. Rather, land-use change models make simple projections assuming future population will change at the same rate as historical changes (Puertas et al., 2014; Vermeiren et al., 2016; Mustafa et al., 2018; Saganeiti et al., 2021). Using the existing modeling framework as shown in Mustafa et al. (2021), it is possible to make the land use-based model more demographically informed. One means of integrating models would be through the fine resolution (4 m2) of the LUCC model, allowing for city-scale scenarios to integrate county or PUMA-level projected population data, consistent with different SSPs, that would be generated from the multi-state model as described above.
Another way to integrate across models, would be to add additional socio-demographics variables to examine the magnitude and direction of these characteristics on changes in land uses and urban development, as we illustrate in Table 2. Based on prior work (see Figure 5 in Mustafa et al., 2021), in which the prediction of the land-use model for urban development between 2001 and 2016 in New York City included only counts of population and median household income3, here we introduce additional socioeconomic variables to the prediction of urban development. The performance of this multinomial logistic regression model is evaluated using the relative operating characteristic (ROC) method. The ROC is a method to estimate the quality of a model that predicts the occurrence of an event by comparing a probability map depicting the likelihood of change occurring and a binary map showing where the changes actually occurred (Hu and Lo, 2007) where a ROC value of 1 means perfect prediction. Adding new variables to the original variables introduced in Mustafa et al. (2021) shows an improvement in ROC values: ROC values of Mustafa et al. (2021) were 0.63, 0.65, and 0.59 for changes from non-built-up to low-, med- and high-density built-up respectively, whereas ROC values with the added variables illustrated here are 0.64, 0.69, and 0.73 respectively.
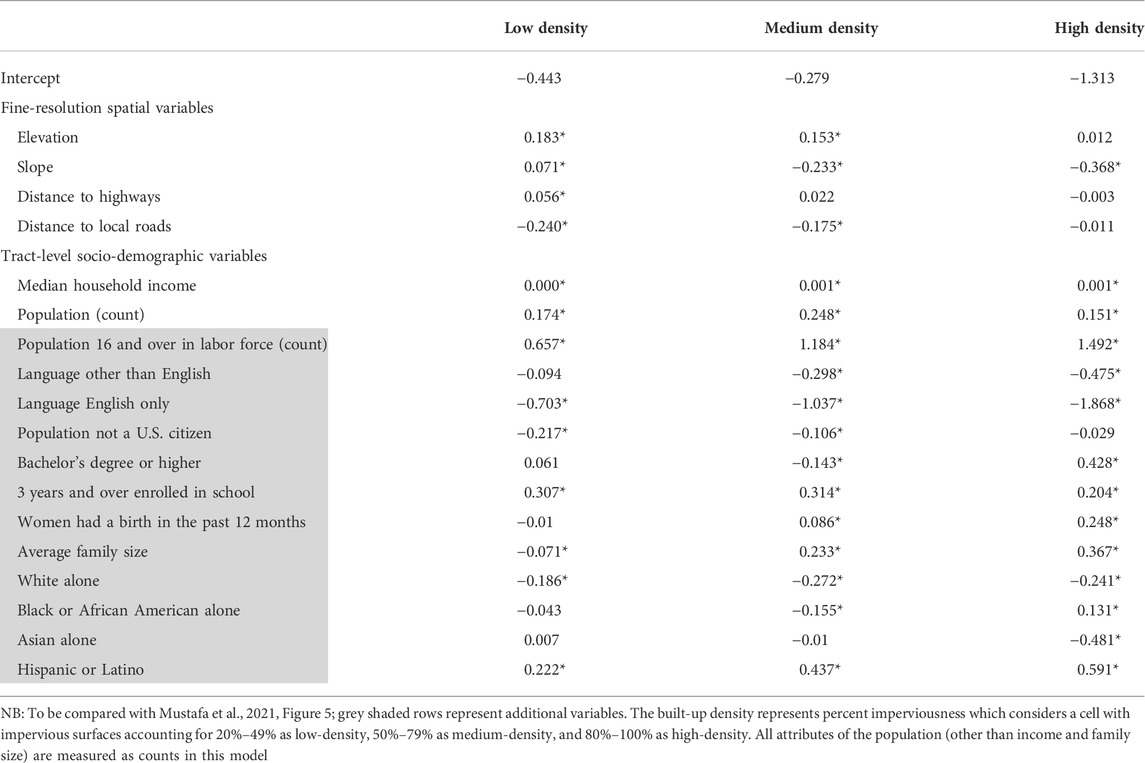
TABLE 2. Coefficients of multinomial logistic regression model of urban expansion (changes from non-urban to low-, medium- or high-built-up density urban).
Moving beyond population size and median household income as the only predictors of urban expansion, here we find that while those variables remain important (but lower in magnitude), a much fuller range of population and socioeconomic characteristics also influence urban development. For example, Table 2 shows that the size of the 16 + year old population engaged in the labor force increases all types of development, but especially the high-density type; conversely, urban development is unlikely to happen in neighborhoods with higher fractions of non-citizens. Neighborhoods with higher percentage of Hispanic residents saw growth in all types of development, but neighborhoods with higher percentage of Black residents saw declines in medium-density development but increases in high-density areas, a pattern also evident in the maps above. By introducing these variables, the LUCC model is informed by a more comprehensive range of socio-demographic changes underway in New York City.
Understanding the importance of housing (and housing construction), as described above, New York City (and other large cities or municipalities) already includes some land-use (and housing) information as constraints on population growth in its projections at the county-level. Yet, additional information from census data, such as that on rent burden (defined as more than 35% of annual income going to rent), can also be incorporated, perhaps into land-use models or other down-scaling models. Figure 5 below shows such data for New York City, from 1980–2020, at the census tract-level, and while rent burdens are increasing throughout the city, increases are more pronounced outside of Manhattan, and in neighborhoods (shown in Figure 4) that have also seen changes in distributions of the racial or ethnic subpopulations (Furman Center 2016; Chronopoulos, 2020; Sutton, 2020). New York City’s Comptroller Affordability Index also found that the median gross rent and other expenses continuously rose from 2005 to 2017 but this was not met with a proportional rise in the median household income (NYC Comptroller Affordability Index, 2019). Without additional protections in place (such as anti-displacement strategies), the increased rent burden is going to disproportionately impact the ability of low-income communities and communities of color to afford increasing housing costs and stay in their neighborhoods. Such neighborhood-scale data could be used to refine and combine local land use and population projections and thus be attentive to the inclusivity or exclusivity of local development practices. Rent burden is just one of the many vulnerability metrics that may be included in these models (see Figure 3 for a full model).
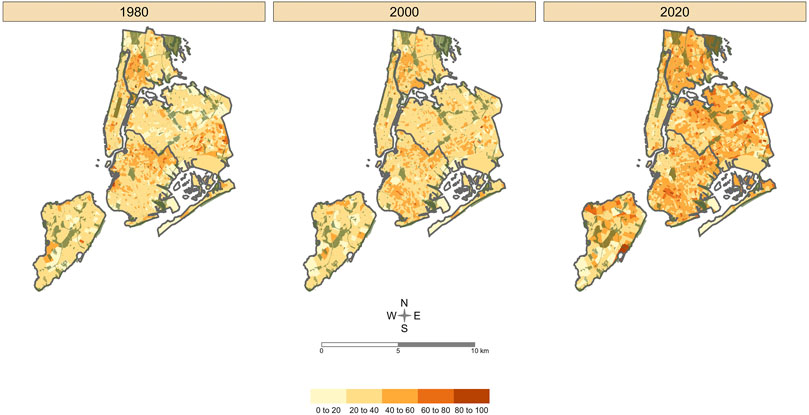
FIGURE 5. Percent share of population experiencing rent burden per census tract across New York City from 1980 to 2020. The rent burden is defined as using 35% or more of total annual income for rent.
4.3.4 Engage with stakeholders, experts, and community members
A final component of the proposed framework is the integration of participatory approaches. Following the proposed framework for integrated components of population and LUCC models described above, the participatory component offers an opportunity to integrate normative goals and develop positive, alternative visions and models for the future (Ortiz et al., 2021). In particular, this component adds a context-specific perspective to the local/fine scale modeling that may be missing from downscaled data. It is also an opportunity to engage with local stakeholders in planning for the future and integrating the models into their decision-making process. Positive visioning is not limited to urban social-ecological systems. The biodiversity community is also actively engaging with stakeholders to create scenarios and positive visions as they relate to nature-based solutions and sustainable development goals (Albert et al., 2021; Mansur et al., 2022). For example, the Intergovernmental Science-Policy Platform on Biodiversity and Ecosystem Services (IPBES) has developed a program of work around these principles (https://ipbes.net/scenarios-models).
As described above, and demonstrated in a few of the local SSP studies (Rohat et al., 2021, 2019; Reimann et al., 2021) as well as the process in place in the NYMTC SED Projections, there may be previously untapped connections between engaging with local stakeholders and experts in the development of assumptions about SSP narratives or other future pathways that can be used with local population projections; this would then make further downscaling work more consistent with stakeholder visioning.
5 Discussion and conclusion
The multi-scale and multi-disciplinary framework proposed here couples population and land use projection models for cities and their surrounding areas with climate, social-ecological, and socioeconomic futures and integrates climate and racial justice principles to envision sustainable and equitable urban futures. Our discussion and conclusion addresses key considerations for future research and implementation of the framework, as well as some of its limitations.
An equity lens must become part of the standard in planning for climate adaptation and mitigation. The changing diversity of population in cities is fundamental to defining the cities’ history and future. Changes in population sizes, age, and race/ethnicity compositions and their spatial distributions are largely determined by the interactions of population movements and vital rates differentiated by the demographic characteristics within the city and outside world. The increase in the flow of people across places brings with it increased complexity of social formations and interactions. Unfortunately, contemporary futures exercises have yet to include socio-economic diversity variables (race, ethnicity, migration status, education, income, etc.). Ensuring equitable and just futures for all urban communities requires adopting new methods for policy-relevant planning that accommodate aspects of that diversity and vulnerability in its medium-and long-term forecasting of population and land use, and consequently with future climate scenarios. In applying an equity lens, it is important to keep in mind that the guiding principles of environmental and climate justice (distributive, procedural, recognitional, and intergenerational) apply to all aspects of the proposed framework from data collection to engagement to decision-making (in analysis, policy or planning) (Newell et al., 2021).
The examples here show how improvements—spatially, temporally and thematically—can be made to address the lack of representation of socio-economic diversity variables in the future models. The proposed framework offers a mix-and-match approach among different model types that can vary depending on the given application. Thus, the precise implementation will depend on the most robust and appropriate spatial and temporal scales to model. Fitness-for-use is an important concept that helps a user decide which models to integrate for which purpose. While there are likely trade-offs between modeling themes and spatial and temporal scales (as shown in Figure 3), ideally, the model outputs should be able to inform solutions for both adaptation and mitigation measures that simultaneously reduce exposure and lower emissions levels (Hussein et al., 2013).
Planning for climate change, especially in urban settings, should include sub-city level vulnerability metrics that are tailored to the climate hazards anticipated and the adaptation and mitigation measures contemplated. Primarily due to internal and international migration, cities are prime locations for “super-diversity,” a term used to underscore the type of complexity experienced in cities as it relates to socio-cultural and sociolinguistic diversity, along with differences and nuances in nationality, class, religion, identity, educational background, legal status, mode of entry, etc. (Foner et al., 2019; Vertovec 2019). With a majority of its residents being immigrants or children of immigrants, New York City is a prime example of this super-diversity and the interplay of complexities in social interactions (Zapatka, 2021). As described above, marginalized populations are often at heightened risk for experiencing climate impacts and thus should be more fully captured in projections in order to ensure equitable climate adaptation and mitigation planning that reduces vulnerability.
Vulnerability metrics must also adequately represent the sensitivity of the population for the specific climate risk in order to generate effective responses (NRC, 2011). For example, in areas with concentrations of vulnerable populations without legal status, residents may be fearful about participating in government services (such as disaster readiness or relief, Mendez et al., 2020) and therefore local governments should develop plans that minimize these concerns and provide targeted outreach to assuage their fears. Concentration of residents whose primary language is not English may need alternative measures for communicating early weather warnings. Low-income homeowners and renters in flood-prone areas are likely to experience storms, flooding, or sea-level rise differently since homeowners are less mobile but renters tend to have less equity and therefore need different emergency care measures. After Hurricane Ida in September 2021, New York City took measures to identify those affected and create policies meant to include vulnerable populations in early warning and rapid response policies for future extreme weather events (New York City Office of the Mayor, 2021). The New York City Emergency Management (NYCEM) office also took on a series of initiatives including developing a Hazard Mitigation Plan and is currently in the process of expanding their community resources to include risk assessments (e.g., the Community Mitigation Pilot Project focused on the Gowanus community in Brooklyn) (NYCEM) and a composite Urban Risk Index. Our proposed framework could be used to evaluate the effectiveness of these measures in the future.
Accurate and thoughtful data collection and inclusive and sustained engagement are necessary for just policy outcomes (Newell et al., 2021). As such, those most likely to be disproportionately affected by a specific climate risk should be identified early on and their experiences should be centered throughout the planning process. For example, when planning for climate hazards such as heat, individuals who are likely to be more susceptible to increases in temperature must be identified such as individuals in areas with less tree canopy (due to the heat island effect), older residents (due to their decreased ability to adjust to changes in temperature or lack of mobility), individuals with disabilities (due to increased sensitivity to heat or lack of mobility) and residents without AC or without access to cooling centers (due to the lack of ability to cool the environment) (Herreros-Cantis and McPhearson 2021; McDonald et al., 2021). Thus, in order to ensure equitable climate mitigation and adaptation measures, city and regional stakeholders projecting climate impacts would be better primed to address the needs of residents if they had access to sub-city level, socio-economically nuanced projections on the spatial distribution of the population by combinations of key vulnerability metrics (e.g., age, race/ethnicity, income, housing tenure, linguistic isolation, disability), aspects of the built-environment (e.g., access to cooling, basement dwelling) and their environmental exposures (e.g., tree canopy, flood proneness). While complex thematic specificity is well beyond the capacity of current projection and visioning methods, by using the proposed integrated, multiscale framework it will move us towards a planning future that takes into account intersecting vulnerability indicators.
Engagement with local communities is necessary to identify and prioritize community needs, inform the decision-making process, understand uncertainty, and ensure that equity principles are applied. Furthermore, use of a participatory development of positive future scenarios, along with long-standing demographic and land use projection methods, can acknowledge the complexity and inherent uncertainty of urban systems by integrating local knowledge of the system, as well as help create support to clear policy hurdles. Thus, participatory engagement in the process of modeling urban futures also provides opportunities to work toward just futures (Newell et al., 2021) and evaluate conditions under which positive future outcomes can emerge (Iwaniec et al., 2020a; Cook et al., 2021; Reimann et al., 2021; Rohat et al., 2021).
The framework is intended for wide application. While we have focused on bringing together demographic and urban ecological approaches, the proposed framework can be applied in diverse contexts and applications. For example, while cities can exacerbate biodiversity loss (McKinney 2006), they also provide an opportunity to address the biodiversity challenge (Ives et al., 2016; Planchuelo et al., 2019; Adem Esmail et al., 2022; Frantzeskaki and McPhearson, 2022) and conservation through future projections and scenario planning (IPBES, 2019). Applying this framework, scenarios and projections could be developed to address nature-based solutions (Albert et al., 2021; Mansur et al., 2022) and the impacts of different urban futures associated with the SSP on conservation outcomes (e.g., Sanderson et al., 2019).
Existing regulations can be leveraged by cities and regional authorities to implement this framework. Unlike national population counts or climate projections, no single statistical body authoritatively produces state, county or local projections. Yet population projections may be useful or necessary not just to adequately plan for the future but also to comply with federal, state, or local regulations. For example, federal transportation legislation mandates that urbanized areas of 50,000 persons or more designate a Metropolitan Planning Organization in order to qualify for federal transportation funds (NYMTC). Thus, many cities and their greater metropolitan area participate in a regional planning process that includes both modeling projections and participatory processes. Like NYMTC for the Greater New York Area, this planning process is often blended—bringing together demographic, land-use and transportation or employment information, and relies on demographic projections with stakeholder feedback. This provides a useful and real-world example of how the framework proposed here can be scaled up into city and regional planning. However, the production of these projections is only starting to think about the role of climate change as a constraint on or as an enabler of growth.
Climate change makes it apparent why cities and their nearby regions need to work together. Because city and regional planners have not typically considered the implications of climate change in their planning, their projections have tended to be fairly short-term. Cities often have local laws that require long-term climate projections be made available for local planning needs (Lopez-Cantu et al., 2020). Yet, these laws do not apply to envisioning population and socioeconomic futures. Nevertheless, cities and their surrounding regions are increasingly aware that they must plan to mitigate and adapt to the impacts of climate change. The framework proposed here demonstrates that the exchange of ideas and integration of methods used by those thinking about climate-change (and the population and socioeconomic futures likely to accompany those futures) with those working at the regional scale could be mutually beneficial and highly productive for envisioning sustainable and equitable urban futures. Thus, a fully worked application of this new framework will be important in demonstrating the utility and feasibility for cities and metropolitan regions to adopt such methods in their own forecasting in future work.
Data availability statement
The original contributions presented in the study are included in the article. Further inquiries can be directed to the corresponding author.
Author contributions
The study was conceived by DB, BJ, PM, and LJ and they acquired initial funding for it. TM and EC acquired additional resources for it. DB led the conceptualization, supervision and project administration, with support from DT. DB, DT, EC, LJ, PM, BJ, AM, and TM contributed to co-creation of the methodology and visualization. PJ and AM led the data acquisition and production of maps and Table 2. DT led the construction of the conceptual framework diagram with inputs from all others. DB, DT, LJ, PM, EC, BJ, AM, and TM contributed to the initial writing. DB and DT led the revisions with contributions from PM, EC, and TM.
Funding
This work was made possible by funding from the City University of New York’s Interdisciplinary Research Grant (proposal #2828) to DB, BJ, PM, DT, and LJ. We acknowledge support for TM, AM, and EC from the US National Science Foundation (awards #1444755, #1927167, and #1934933).
Acknowledgments
We thank Julie Margolin of the Baruch College Climate Scholars Program for research assistance and Grace Sinay of the CUNY Institute for Demographic Research for administrative support that made this research possible. The authors also thank David Burgy, formerly an analyst at NYMTC, for several conversations about local, regional, and state projection efforts. We thank the reviewers for their thoughtful comments and suggestions.
Conflict of interest
The authors declare that the research was conducted in the absence of any commercial or financial relationships that could be construed as a potential conflict of interest.
Publisher’s note
All claims expressed in this article are solely those of the authors and do not necessarily represent those of their affiliated organizations, or those of the publisher, the editors and the reviewers. Any product that may be evaluated in this article, or claim that may be made by its manufacturer, is not guaranteed or endorsed by the publisher.
Footnotes
1RCPs are based on projections of greenhouse gas emissions and concentrations and their combined radiative (or climate) forcing, ranging from low (1.9) to high (8.5) (Van Vuuren et al., 2014). An RCP of 2.6 corresponds closely with a 2°C increase, per the Paris Agreement. See https://climatescenarios.org/primer/mitigation/for how various RCPs correspond to expected temperature increases, climate forcings, and to the five different SSPs.
2The data in the map represent the population of census tracts, the boundaries having been harmonized over time and, from NHGIS (Manson et al., 2021). There have been many changes in the way the census classifies racial and Hispanic-origin population (Humes and Hogan, 2009; Strmic-Pawl et al., 2018), but these data have been made consistent over time for the major racial and ethnic groups
3The LUCC model consists of demand and allocation modules. The demand module estimates the rate of change from one LUC class to another in each annual timestep. The model allocates LUCC over a geographic space according to a transition rule that consists of two components: the first measures the impact of a set of variables (e.g., distance to roads, slope degree) which is calibrated using a multinomial logistic regression (Mustafa et al., 2018) with fine-level spatial variables derived from the U.S. National Land Cover Dataset of 2001 and 2016. A second component measures the impact of the land-use composition of the neighborhood on each land unit which is calibrated using multi-objective Markov Chain Monte Carlo optimizer (Mustafa et al., 2021).
References
Absar, S. M., and Preston, B. L. (2015). Extending the Shared Socioeconomic Pathways for sub-national impacts, adaptation, and vulnerability studies. Glob. Environ. Change 33, 83–96. doi:10.1016/j.gloenvcha.2015.04.004
Achmad, A., Hasyim, S., Dahlan, B., and Aulia, D. N. (2015). Modeling of urban growth in tsunami-prone city using logistic regression: Analysis of Banda Aceh, Indonesia. Appl. Geogr. 62, 237–246.
Adem Esmail, B., Cortinovis, C., Suleiman, L., Albert, C., Geneletti, D., and Mörtberg, U. (2022). Greening cities through urban planning: A literature review on the uptake of concepts and methods in stockholm. Urban For. Urban Green. 72, 1–13. doi:10.1016/j.ufug.2022.127584
Albert, C., Brillinger, M., Guerrero, P., Gottwald, S., Henze, J., Schmidt, S., et al. (2021). Planning nature-based solutions: Principles, steps, and insights. Ambio 50 (8), 1446–1461. doi:10.1007/s13280-020-01365-1
American Community Survey (ACS), (2020). New York-Newark-Jersey city, NY-NY-pa metro area. Census reporter. Available at: https://censusreporter.org/profiles/31000US35620-new-york-newark-jersey-city-ny-nj-pa-metro-area/.
Balk, D. S. L., Montgomery, M., and Matthews, S. (2021). Revitalizing urban research: What is the future role of demographers?” A commentary. Look. Back, Look. Forw. Prog. Prospect Spatial Demogr. Spatial Demogr. 9, 14–17. doi:10.1007/s40980-021-00084-9
Bikomeye, J. C., Rublee, C. S., and Beyer, K. M. (2021). Positive externalities of climate change mitigation and adaptation for human health: A review and conceptual framework for public health research. Int. J. Environ. Res. Public Health 18 (5), 2481. doi:10.3390/ijerph18052481
Börjeson, L., Höjer, M., Dreborg, K. H., Ekvall, T., and Finnveden, G. (2006). Scenario types and techniques: Towards a user's guide. Futures 38 (7), 723–739. doi:10.1016/j.futures.2005.12.002
Burch, T. K. (2018). “The cohort-component population projection: A strange attractor for demographers,” in Model-based demography (Cham: Springer), 135–151.
California State Department of Finance (2020). Population projections methodology (2019 baseline) - demographic research unit. Available at: https://dof.ca.gov/wp-content/uploads/Forecasting/Demographics/Documents/Projections_Methodology.pdf.
Cammerer, H., Thieken, A. H., and Verburg, P. H. (2013). Spatio-temporal dynamics in the flood exposure due to land use changes in the Alpine Lech Valley in Tyrol (Austria). Nat. Hazards (Dordr). 68 (3), 1243–1270. doi:10.1007/s11069-012-0280-8
Chronopoulos, T. (2020). What’s happened to the people?” Gentrification and racial segregation in Brooklyn. J. Afr. Am. Stud. New. Brunsw. 24 (4), 549–572. doi:10.1007/s12111-020-09499-y
Clement, V., Rigaud, K., de Sherbinin, A., Jones, B., AdamoSchewe, S. J., Sadiq, N., et al. (2021). Groundswell Part 2: Acting on internal climate migration. Washington, DC: World Bank.
Con Edison Media Relations (2019). Con Edison working to restore power to approximately 33,000 customer outages in some southeast Brooklyn neighborhoods. Available at: https://www.coned.com/en/about-us/media-center/news/20190721/con-edison-working-to-restore-power-to-33000-outages-in-southeast-brooklyn-neighborhoods.
Cook, E. M., Berbés-Blázquez, M., Mannetti, L. M., Grimm, N. B., Iwaniec, D. M., and Muñoz-Erickson, T. A. (2021). “Setting the stage for Co-production,” in Resilient urban futures. Editors Z. A. Hamstead, D. M. Iwaniec, T. McPhearson, M. Berbés-Blázquez, E. M. Cook, and T. A. Muñoz-Erickson (Cham, Switzerland: Springer International Publishing), 99–111.
Creutzig, F., Lohrey, S., Bai, X., Baklanov, A., Dawson, R., Dhakal, S., et al. (2019). Upscaling urban data science for global climate solutions. Glob. Sustain. 2. doi:10.1017/sus.2018.16
Depietri, Y., Dahal, K., and McPhearson, T. (2018). Multi-hazard risks in New York city. Nat. Hazards Earth Syst. Sci. 18 (12), 3363–3381. doi:10.5194/nhess-18-3363-2018
EPA (2021). Climate change and social vulnerability in the United States: A focus on six impacts. EPA 430-R-21-003. U.S. Environmental Protection Agency. Available at: www.epa.gov/cira/social-vulnerability-report.
EPA (2017). Updates to the demographic and spatial allocation models to produce integrated climate and land use scenarios (iclus) (final report, version 2). EPA/600/R-16/366F. Washington, DC: U.S. Environmental Protection Agency.
Foner, N., Duyvendak, J. W., and Kasinitz, P. (2019). Introduction: Super-diversity in everyday life. Ethn. Racial Stud. 42 (1), 1–16. doi:10.1080/01419870.2017.1406969
Foster, S., Leichenko, R., Nguyen, K. H., Blake, R., Kunreuther, H., Madajewicz, M., et al. (2019). New York city panel on climate change 2019 report chapter 6: Community-based assessments of adaptation and equity. Ann. N. Y. Acad. Sci. 1439 (1), 126–173. doi:10.1111/nyas.14009
Frantzeskaki, N., and McPhearson, T. (2022). Mainstream nature-based solutions for urban climate resilience. BioScience 72 (2), 113–115. doi:10.1093/biosci/biab105
Furman Center (2016). State of New York city’s housing and neighborhoods in 2015. Available at: https://furmancenter.org/research/sonychan/2015-report.
Guo, J., and Zhang, M. (2021). Exploring the patterns and drivers of urban expansion in the Texas triangle megaregion. Land 10 (11), 1244. doi:10.3390/land10111244
Hamilton, C. H., and Perry, J. (1962). A short method for projecting population by age from one decennial census to another. Soc. Forces 41, 163–170. doi:10.2307/2573607
Hamstead, Z. A. (2021a). “How we got here: Producing climate inequity and vulnerability to urban weather extremes,” in Resilient urban futures. Editors Z. A. Hamstead, D. M. Iwaniec, T. McPhearson, M. Berbés-Blázquez, E. M. Cook, and T. A. Muñoz-Erickson (Cham, Switzerland: Springer International Publishing), 11–28.
Hamstead, Z. A., Iwaniec, D. M., McPhearson, T., Berbés-Blázquez, M., Cook, E. M., and Munoz-Erickson, T. A. (2021b). Resilient urban futures. Cham, Switzerland: Springer International Publishing.
Hauer, M. E. (2019). Population projections for US counties by age, sex, and race controlled to shared socioeconomic pathway. Sci. Data 6 (1), 190005–190015. doi:10.1038/sdata.2019.5
Herreros-Cantis, P., and McPhearson, T. (2021). Mapping supply of and demand for ecosystem services to assess environmental justice in New York City. Ecol. Appl. 31 (6), e02390. doi:10.1002/eap.2390
Herreros-Cantis, P., Olivotto, V., Grabowski, Z. J., and McPhearson, T. (2020). Shifting landscapes of coastal flood risk: Environmental (in) justice of urban change, sea level rise, and differential vulnerability in New York city. Urban Transform. 2 (1), 9–28. doi:10.1186/s42854-020-00014-w
Hoffman, J. S., Shandas, V., and Pendleton, N. (2020). The effects of historical housing policies on resident exposure to intra-urban heat: A study of 108 US urban areas. Climate 8 (1), 12. doi:10.3390/cli8010012
Hoffmann, J. (2021). “Demographic change and land use,” in Sustainable land management in a European context. Editors T. Weith, T. Barkmann, N. Gaasch, S. Rogga, C. Strauß, and J. Zscheischler (Cham: Springer), Vol. 8.
Humes, K., and Hogan, H. (2009). Measurement of race and ethnicity in a changing, multicultural America. Race Soc. Probl. 1 (3), 111–131. doi:10.1007/s12552-009-9011-5
Hu, Z., and Lo, C. P. (2007). Modeling urban growth in Atlanta using logistic regression. Comput. Environ. Urban Syst. 31 (6), 667–688. doi:10.1016/j.compenvurbsys.2006.11.001
Hussein, Z., Hertel, T., and Golub, A. (2013). Climate change mitigation policies and poverty in developing countries. Environ. Res. Lett. 8 (3), 035009. doi:10.1088/1748-9326/8/3/035009
Intergovernmental Science-Policy Platform on Biodiversity and Ecosystem Services (IPBES) Balvanera, P., Brauman, K., Butchart, S., and Chan, K. (2019). The global assessment report on biodiversity and ecosystem services: Summary for policy makers. Report.
Ives, C. D., Lentini, P. E., Threlfall, C. G., Ikin, K., Shanahan, D. F., Garrard, G. E., et al. (2016). Cities are hotspots for threatened species. Glob. Ecol. Biogeogr. 25 (1), 117–126. doi:10.1111/geb.12404
Iwaniec, D. M., Berbés-Blázquez, M., Cook, E. M., Grimm, N. B., Mannetti, L. M., McPhearson, T., et al. (2021). “Positive futures,” in Resilient urban futures. Editors Z. A. Hamstead, D. M. Iwaniec, T. McPhearson, M. Berbés-Blázquez, E. M. Cook, and T. A. Muñoz-Erickson (Cham, Switzerland: Springer International Publishing), 85–97.
Iwaniec, D. M., Cook, E. M., Davidson, M. J., Berbés-Blázquez, M., Georgescu, M., Krayenhoff, E. S., et al. (2020a). The co-production of sustainable future scenarios. Landsc. Urban Plan. 197, 103744. doi:10.1016/j.landurbplan.2020.103744
Iwaniec, D. M., Cook, E. M., Davidson, M. J., Berbés-Blázquez, M., and Grimm, N. B. (2020b). Integrating existing climate adaptation planning into future visions: A strategic scenario for the central Arizona–phoenix region. Landsc. Urban Plan. 200, 103820. doi:10.1016/j.landurbplan.2020.103820
Jiang, L. (2014). Internal consistency of demographic assumptions in the shared socioeconomic pathways. Popul. Environ. 35 (3), 261–285. doi:10.1007/s11111-014-0206-3
Jiang, L., and O’Neill, B. C. (2017). Global urbanization projections for the shared socioeconomic pathways. Glob. Environ. Change 42, 193–199. doi:10.1016/j.gloenvcha.2015.03.008
Jiang, L., O’Neill, B. C., Zoraghein, H., and Dahlke, S. (2020). Population scenarios for US states consistent with shared socioeconomic pathways. Environ. Res. Lett. 15 (9), 094097. doi:10.1088/1748-9326/aba5b1
Jones, B., and O’Neill, B. C. (2013). Historically grounded spatial population projections for the continental United States. Environ. Res. Lett. 8 (4), 044021. doi:10.1088/1748-9326/8/4/044021
Jones, B., O’Neill, B. C., McDaniel, L., McGinnis, S., Mearns, L. O., and Tebaldi, C. (2015). Future population exposure to US heat extremes. Nat. Clim. Chang. 5 (7), 652–655. doi:10.1038/nclimate2631
Jones, B., and O’Neill, B. C. (2016). Spatially explicit global population scenarios consistent with the Shared Socioeconomic Pathways. Environ. Res. Lett. 11 (8), 084003. doi:10.1088/1748-9326/11/8/084003
Kamei, M., Hanaki, K., and Kurisu, K. (2016). Tokyo’s long-term socioeconomic pathways: Towards a sustainable future. Sustain. Cities Soc. 27, 73–82. doi:10.1016/j.scs.2016.07.002
Kamei, M., Kurisu, K., and Hanaki, K. (2019). Evaluation of long-term urban transitions in a megacity’s building sector based on alternative socioeconomic pathways. Sustain. Cities Soc. 47, 101366. doi:10.1016/j.scs.2018.11.041
KC, S., Lutz, W., Wurzer, M., and Speringer, M. (2018). Future population and human capital in heterogeneous India. Proc. Natl. Acad. Sci. U. S. A. 115 (33), 8328–8333. doi:10.1073/pnas.1722359115
KC, S., and Lutz, W. (2017). The human core of the shared socioeconomic pathways: Population scenarios by age, sex and level of education for all countries to 2100. Glob. Environ. Change 42, 181–192. doi:10.1016/j.gloenvcha.2014.06.004
Kinney, P. L., Matte, T., Knowlton, K., Madrigano, J., Petkova, E., Weinberger, K., et al. (2015). New York city panel on climate change 2015 report chapter 5: Public health impacts and resiliency. Ann. N. Y. Acad. Sci. 1336, 67–88. doi:10.1111/nyas.12588
Kriegler, E., Edmonds, J., Hallegatte, S., Ebi, K. L., Kram, T., Riahi, K., et al. (2014). A new scenario framework for climate change research: The concept of shared climate policy assumptions. Clim. Change 122 (3), 401–414. doi:10.1007/s10584-013-0971-5
Ku, C. A. (2016). Incorporating spatial regression model into cellular automata for simulating land use change. Appl. Geogr. 69, 1–9. doi:10.1016/j.apgeog.2016.02.005
Lieberman-Cribbin, W., Gillezeau, C., Schwartz, R. M., and Taioli, E. (2021). Unequal social vulnerability to Hurricane Sandy flood exposure. J. Expo. Sci. Environ. Epidemiol. 31 (5), 804–809. doi:10.1038/s41370-020-0230-6
Lino, J., Rohat, G., Kirshen, P., and Dao, H. (2019). Extending the shared socioeconomic pathways at the city scale to inform future vulnerability assessments—the case of boston, Massachusetts. J. Extreme Events 6 (3-4), 2050009. doi:10.1142/s2345737620500098
Locke, D. H., Hall, B., Grove, J. M., Pickett, S. T. A., Ogden, L. A., Aoki, C., et al. (2021). Residential housing segregation and urban tree canopy in 37 US Cities. npj Urban Sustain. 1 (1), 15–19. doi:10.1038/s42949-021-00022-0
Lopez-Cantu, T., Samaras, C., and Webber, M. (2020). Compilation of U.S. City climate adaptation plans. Carnegie Mellon Univ. doi:10.1184/R1/13125473.v2
Lovins, A. (1977). Soft energy paths: Toward a durable peace. Cambridge, MA: Friends of the Earth International/Ballinger Publishing Company.
Lutz, W., Sanderson, W., and Scherbov, S. (2001). The end of world population growth. Nature 412, 543–545. doi:10.1038/35087589
MacManus, K., Balk, D., Engin, H., McGranahan, G., and Inman, R. (2021). Estimating population and urban areas at risk of coastal hazards, 1990–2015: How data choices matter. Earth Syst. Sci. Data 13 (12), 5747–5801. doi:10.5194/essd-13-5747-2021
Madrigano, J., Ito, K., Johnson, S., Kinney, P. L., and Matte, T. (2015). A case-only study of vulnerability to heat wave–related mortality in New York City (2000–2011). Environ. health Perspect. 123 (7), 672–678. doi:10.1289/ehp.1408178
Manson, S. M. J., Van Riper, D., Kugler, T., and Ruggles, S. (2021). IPUMS national historical geographic information system. Report.
Mansur, A. V., McDonald, R. I., Güneralp, B., Kim, H., de Oliveira, J. A. P., Callaghan, C. T., et al. (2022). Nature futures for the urban century: Integrating multiple values into urban management. Environ. Sci. Policy 131, 46–56. doi:10.1016/j.envsci.2022.01.013
Marcotullio, P. J., Rosenzweig, C., Solecki, W. D., Romero-Lankao, P., et al. (2018). “The urban energy supply sector: Challenges and opportunities for low-carbon, resilient and just cities,” in Climate change and cities: Second assessment report of the urban climate change research network. Editors C. Rosenzweig, W. D. Solecki, P. Romero-Lankao, S. Mehrotra, S. Dhakal, and S. A. Ibrahim (New York: Cambridge University Press), 443–490.
Mayor’s Office of Sustainability (2017). Aligning New York city with the Paris climate agreement. New York City: Mayor’s Office of Sustainability.
McDonald, R. I., Biswas, T., Sachar, C., Housman, I., Boucher, T. M., Balk, D., et al. (2021). The tree cover and temperature disparity in US urbanized areas: Quantifying the association with income across 5, 723 communities. PloS One 16 (4), e0249715. doi:10.1371/journal.pone.0249715
McGranahan, G., Balk, D., and Anderson, B. (2007). The rising tide: Assessing the risks of climate change and human settlements in low elevation coastal zones. Environ. urbanization 19 (1), 17–37. doi:10.1177/0956247807076960
McKinney, M. L. (2006). Urbanization as a major cause of biotic homogenization. Biol. Conserv. 127 (3), 247–260. doi:10.1016/j.biocon.2005.09.005
McPhearson, T., Iwaniec, D. M., and Bai, X. (2017). Positive visions for guiding urban transformations toward sustainable futures. Curr. Opin. Environ. Sustain. 22, 33–40. doi:10.1016/j.cosust.2017.04.004
McPhearson, T., Iwaniec, D. M., Hamstead, Z. A., Berbés-Blázquez, M., Cook, E. M., Muñoz-Erickson, T. A., et al. (2021). “A vision for resilient urban futures,” in Resilient urban futures. Editors Z. A. Hamstead, D. M. Iwaniec, T. McPhearson, M. Berbés-Blázquez, E. M. Cook, and T. A. Muñoz-Erickson (Springer International Publishing), 173–186.
Méndez, M., Flores-Haro, G., and Zucker, L. (2020). The (in) visible victims of disaster: Understanding the vulnerability of undocumented Latino/a and indigenous immigrants. Geoforum 116, 50–62. doi:10.1016/j.geoforum.2020.07.007
Méthot, J., Huang, X., and Grover, H. (2015). Demographics and societal values as drivers of change in the Great Lakes–St. Lawrence River basin. J. Gt. Lakes. Res. 41, 30–44. doi:10.1016/j.jglr.2014.11.001
Mohtat, N., and Khirfan, L. (2021). The climate justice pillars vis-à-vis urban form adaptation to climate change: A review. Urban Clim. 39, 100951. doi:10.1016/j.uclim.2021.100951
Moss, R. H., Babiker, M., Brinkman, S., Calvo, E., Carter, T., Edmonds, J. A., et al. (2008). Towards new scenarios for analysis of emissions, climate change, impacts, and response strategies (No. PNNL-SA-63186). Pacific Northwest National Lab.(PNNL). Richland, WA (United States): Impacts, and Response Strategies.
Moss, R. H., Edmonds, J. A., Hibbard, K. A., Manning, M. R., Rose, S. K., Van Vuuren, D. P., et al. (2010). The next generation of scenarios for climate change research and assessment. Nature 463 (7282), 747–756. doi:10.1038/nature08823
Mustafa, A., Cools, M., Saadi, I., and Teller, J. (2017). Coupling agent-based, cellular automata and logistic regression into a hybrid urban expansion model (HUEM). Land Use Policy 69, 529–540. doi:10.1016/j.landusepol.2017.10.009
Mustafa, A., Ebaid, A., Omrani, H., and McPhearson, T. (2021). A multi-objective Markov chain Monte Carlo cellular automata model: Simulating multi-density urban expansion in NYC. Comput. Environ. Urban Syst. 87, 101602. doi:10.1016/j.compenvurbsys.2021.101602
Mustafa, A., Van Rompaey, A., Cools, M., Saadi, I., and Teller, J. (2018). Addressing the determinants of built-up expansion and densification processes at the regional scale. Urban Stud. 55 (15), 3279–3298. doi:10.1177/0042098017749176
National Research Council (NRC) (2011). Adapting to the impacts of climate change. Washington, DC: National Academies Press.
National Association for the Advancement of Colored People (NAACP) Fleischman, L., and Franklin, M., (2017). Fumes across the fence-line: The health impacts of air pollution from oil and gas facilities on African American Communities. Report.
Natural Resource Defense Council (NRDC), Fedinick, K. P., Taylor, S., Roberts, M., Moore, R., and Olson, E. (2019). Watered down justice. Natural Resource Defense Council Report.
New York City Comptroller Affordability Index (2019). Available at: https://comptroller.nyc.gov/reports/affordability-index/.
New York City Department of City Planning (DCP) (2013). New York city population projections by age/sex & borough, 2010-2040. Available at: https://www1.nyc.gov/assets/planning/download/pdf/planning-level/nyc-population/projections_report_2010_2040.pdf.
New York City Emergency Management (NYCEM). NYC Hazard Mitigation. Available at: https://nychazardmitigation.com/planning/who-is-involved/.
New York City Office of the Mayor (2019). Mayor de Blasio appoints leadership team for the fourth New York city panel on climate change. Available at: https://www1.nyc.gov/office-of-the-mayor/news/635-19/mayor-de-blasio-appoints-leadership-team-the-fourth-new-york-city-panel-climate-change.
New York City Office of the Mayor (2021). The new normal: Combating storm-related extreme weather in New York city. Available at: https://www1.nyc.gov/assets/orr/pdf/publications/WeatherReport.pdf.
New York City Panel on Climate Change (NPCC) (2015). Building the knowledge base for climate resiliency. Ann. N. Y. Acad. Sci. 1336 (1), 1–150. Available at: https://nyaspubs.onlinelibrary.wiley.com/toc/17496632/2015/1336/1.
New York City Panel on Climate Change (NPCC) (2019). Advancing tools and methods for flexible adaptation pathways and science policy integration. Ann. N. Y. Acad. Sci. 1439 (1), 10. Available at: https://www.nyas.org/annals/special-issue-advancing-tools-and-methods-forflexible-adaptation-pathways-and-science-policy-integration-new-york-citypanel-on-climate-change-2019-report-vol-1439/.
New York City Service. The mayor’s office of long-term planning and sustainability. Available at: https://www.nycservice.org/organizations/1686 (Accessed May, 2022).
New York Metropolitan Transportation Council (NYMTC). Required planning products. Available at: https://www.nymtc.org/REQUIRED-PLANNING-PRODUCTS (Accessed May, 2022).
New York Metropolitan Transportation Council (NYMTC) (2015). Technical memorandum 1: Existing trends analysis. Available at: https://www.nymtc.org/Portals/0/Pdf/SED/2055%20SED/Technical%20Memo%201_Existing%20Trends%20Analysis.pdf?ver=fVG5kIJGwekD__d-_-PoeA%3d%3d.
New York Metropolitan Transportation Council (NYMTC) (2020). Technical memorandum 4: 2055 SED forecasts executive summary & public comments. Available at: https://www.nymtc.org/DATA-AND-MODELING/Socioeconomic-and-Demographic-SED-Forecasts/2055-Forecasts.
Newell, P., Srivastava, S., Naess, L. O., Torres Contreras, G. A., and Price, R. (2021). Toward transformative climate justice: An emerging research agenda. WIREs Clim. Change 12 (6), e733. doi:10.1002/wcc.733
Oke, T. R., Mills, G., Christen, A., and Voogt, J. A. (2017). Urban climates. Cambridge: UK: Cambridge University Press.
O’Neill, B. C., Carter, T. R., Ebi, K., Harrison, P. A., Kemp-Benedict, E., Kok, K., et al. (2020). Achievements and needs for the climate change scenario framework. Nat. Clim. Chang. 10 (12), 1074–1084. doi:10.1038/s41558-020-00952-0
O’Neill, B. C., Kriegler, E., Riahi, K., Ebi, K. L., Hallegatte, S., Carter, T. R., et al. (2014). A new scenario framework for climate change research: The concept of shared socioeconomic pathways. Clim. change 122 (3), 387–400. doi:10.1007/s10584-013-0905-2
Ortiz, L., Mustafa, A., Cantis, P. H., and McPhearson, T. (2022). Overlapping heat and COVID-19 risk in New York City. Urban Clim. 41, 101081. doi:10.1016/j.uclim.2021.101081
Ortiz, L., Mustafa, A., Rosenzweig, B., and McPhearson, T. (2021). “Modeling urban futures: Data-driven scenarios of climate change and vulnerability in cities,” in Resilient urban futures. Editors Z. A. Hamstead, D. M. Iwaniec, T. McPhearson, M. Berbés-Blázquez, E. M. Cook, and T. A. Muñoz-Erickson (Springer International Publishing), 129–144.
Peterson, G. D., Cumming, G. S., and Carpenter, S. R. (2003). Scenario planning: A tool for conservation in an uncertain world. Conserv. Biol. 17 (2), 358–366. doi:10.1046/j.1523-1739.2003.01491.x
Planchuelo, G., von Der Lippe, M., and Kowarik, I. (2019). Untangling the role of urban ecosystems as habitats for endangered plant species. Landsc. Urban Plan. 189, 320–334. doi:10.1016/j.landurbplan.2019.05.007
Puertas, O. L., Henríquez, C., and Meza, F. J. (2014). Assessing spatial dynamics of urban growth using an integrated land use model. Application in Santiago Metropolitan Area, 2010–2045. Land Use Policy 38, 415–425. doi:10.1016/j.landusepol.2013.11.024
Quist, J. (2007). Backcasting for a sustainable future: The impact after ten years. Delft, The Netherlands: Eburon Publishers.
Raftery, A. E., Alkema, L., and Gerland, P. (2014). Bayesian population projections for the united nations. Stat. Sci. 29 (1), 58–68. doi:10.1214/13-sts419
Reimann, L., Vollstedt, B., Koerth, J., Tsakiris, M., Beer, M., and Vafeidis, A. T. (2021). Extending the shared socioeconomic pathways (SSPs) to support local adaptation planning—a climate service for Flensburg, Germany. Futures, 127, 102691. doi:10.1016/j.futures.2020.102691
Riahi, K., Van Vuuren, D. P., Kriegler, E., Edmonds, J., O’Neill, B. C., Fujimori, S., et al. (2017). The shared socioeconomic pathways and their energy, land use, and greenhouse gas emissions implications: An overview. Glob. Environ. change 42, 153–168. doi:10.1016/j.gloenvcha.2016.05.009
Rienow, A., and Goetzke, R. (2015). Supporting SLEUTH – enhancing a cellular automaton with support vector machines for urban growth modeling. Comput. Environ. Urban Syst. 49, 66–81. doi:10.1016/j.compenvurbsys.2014.05.001
Rigaud, K., de Sherbinin, A., Jones, B., AdamoMaleki, S. D., Abu-Ata, N. E., Casals Fernandez, A. T., et al. (2021). Groundswell Africa: Internal climate migration in the lake victoria basin countries. Washington, DC: World Bank.
Rigaud, K., de Sherbinin, A., Jones, B., Bergmann, J., Clement, V., Ober, K., et al. (2018). Groundswell: Preparing for internal climate migration. Washington, DC: World Bank.
Robinson, J. B. (1982). Energy backcasting: A proposed method of policy analysis. Energy Policy 10 (4), 337–344. doi:10.1016/0301-4215(82)90048-9
Rogers, A., and Woodward, J. A. (1991). Assessing state population projections with transparent multiregional demographic models. Popul. Res. Policy Rev. 10, 1–26. doi:10.1007/bf00122150
Rohat, G., Wilhelmi, O., Flacke, J., Monaghan, A., Gao, J., Dao, H., et al. (2019). Characterizing the role of socioeconomic pathways in shaping future urban heat-related challenges. Sci. total Environ. 695, 133941. doi:10.1016/j.scitotenv.2019.133941
Rohat, G., Wilhelmi, O., Flacke, J., Monaghan, A., Gao, J., van Maarseveen, M., et al. (2021). Assessing urban heat-related adaptation strategies under multiple futures for a major US city. Clim. Change 164 (3), 61–20. doi:10.1007/s10584-021-02990-9
Saganeiti, L., Mustafa, A., Teller, J., and Murgante, B. (2021). Modeling urban sprinkling with cellular automata. Sustain. Cities Soc. 65, 102586. doi:10.1016/j.scs.2020.102586
Sanderson, E. W., Moy, J., Rose, C., Fisher, K., Jones, B., Balk, D., et al. (2019). Implications of the shared socioeconomic pathways for tiger (Panthera tigris) conservation. Biol. Conserv. 231, 13–23. doi:10.1016/j.biocon.2018.12.017
Schell, C. J., Dyson, K., Fuentes, T. L., Des Roches, S., Harris, N. C., Miller, D. S., et al. (2020). The ecological and evolutionary consequences of systemic racism in urban environments. Science 369 (6510), eaay4497. doi:10.1126/science.aay4497
Schoemaker, P. J. (1991). When and how to use scenario planning: A heuristic approach with illustration. J. Forecast. 10 (6), 549–564. doi:10.1002/for.3980100602
Seto, K. C., Dhakal, S., Bigio, A., Blanco, H., Delgado, G. C., Dewar, D., et al. (2014). “Chapter 12 - human settlements, infrastructure and spatial planning,” in Climate change 2014: Mitigation of climate change. IPCC working group III contribution to AR5 (New York: Cambridge University Press).
Ševčíková, H., Raftery, A. E., and Gerland, P. (2018). Probabilistic projection of subnational total fertility rates. Demogr. Res. 38, 1843–1884. doi:10.4054/demres.2018.38.60
Sharma, A., Wuebbles, D. J., and Kotamarthi, R. (2021). The need for urban-resolving climate modeling across scales. AGU Adv. 2 (1), e2020AV000271. doi:10.1029/2020av000271
Shearer, A. W. (2005). Approaching scenario-based studies: Three perceptions about the future and considerations for landscape planning. Environ. Plann. B. Plann. Des. 32 (1), 67–87. doi:10.1068/b3116
Simkin, R. D., Seto, K. C., McDonald, R. I., and Jetz, W. (2022). Biodiversity impacts and conservation implications of urban land expansion projected to 2050. Proc. Natl. Acad. Sci. U. S. A. 119 (12), e2117297119. doi:10.1073/pnas.2117297119
Smart Cities Connect (2022). NYC mayor creates office of climate and environmental justice, appoints climate leadership. Available at: https://smartcitiesconnect.org/nyc-mayor-creates-office-of-climate-and-environmental-justice-appoints-climate-leadership/.
Smith, S. K., Tayman, J., and Swanson, D. A. (2006). State and local population projections: Methodology and analysis. New York: Kluwer Academic Publishers.
Solecki, W., Grimm, N., Marcotullio, P., Boone, C., Bruns, A., Lobo, J., et al. (2019). Extreme events and climate adaptation-mitigation linkages: Understanding low-carbon transitions in the era of global urbanization. WIREs Clim. Change 10 (6), 616. doi:10.1002/wcc.616
Solecki, W., and Rosenzweig, C. (2019). New York city panel on climate change 2019 report chapter 9: Perspectives on a city in a changing climate 2008-2018, 1439. Annals of the New York Academy of Sciences.
Solecki, W., Seto, K. C., Balk, D., Bigio, A., Boone, C. G., Creutzig, F., et al. (2015). A conceptual framework for an urban areas typology to integrate climate change mitigation and adaptation. Urban Clim. 14, 116–137. doi:10.1016/j.uclim.2015.07.001
Southern California Council of Governments (SCCG) (2016). Regional transportation plan/sustainable communities strategy, demographics & growth forecast appendix. Available at: http://scagrtpscs.net/Documents/2016/final/f2016RTPSCS_DemographicsGrowthForecast.pd.
State of California (2020). “Methodology report: State of California,” in demographic research unit. Population projections methodology (2019 baseline) (Sacramento, California: Department of Finance). Available at: https://dof.ca.gov/wp-content/uploads/Forecasting/Demographics/Documents/Projections_Methodology.pdf.
Striessnig, E., Gao, J., O’Neill, B. C., and Jiang, L. (2019). Empirically based spatial projections of US population age structure consistent with the shared socioeconomic pathways. Environ. Res. Lett. 14 (11), 114038. doi:10.1088/1748-9326/ab4a3a
Strmic-Pawl, H. V., Jackson, B. A., and Garner, S. (2018). Race counts: Racial and ethnic data on the US census and the implications for tracking inequality. Sociol. Race Ethn. 4 (1), 1–13. doi:10.1177/2332649217742869
Supplementary Note for the SSP data sets Supplementary text. Available at: https://secure.iiasa.ac.at/web-apps/ene/SspDb/static/download/ssp_suplementary%20text.pdf (Accessed May, 2022).
Sutton, S. (2020). Gentrification and the increasing significance of racial transition in New York city 1970–2010. Urban Aff. Rev. 56 (1), 65–95. doi:10.1177/1078087418771224
Swanson, D. A., and Tayman, J. (2017). “A long term test of the accuracy of the Hamilton-Perry method for forecasting state populations by age,” in The Frontiers of applied demography. Editor D. Swanson (Cham, Switzerland: Springer), Vol. 9.
Tessum, C. W., Paolella, D. A., Chambliss, S. E., Apte, J. S., Hill, J. D., and Marshall, J. D. (2021). PM2. 5 polluters disproportionately and systemically affect people of color in the United States. Sci. Adv. 7 (18), 4491. doi:10.1126/sciadv.abf4491
Trust for Public Land (2021). Parks and an equitable recovery: A trust for public land special report. Available at: https://www.tpl.org/parks-and-an-equitable-recovery-parkscore-report.
Tuholske, C., Caylor, K., Funk, C., Verdin, A., Sweeney, S., Grace, K., et al. (2021). Global urban population exposure to extreme heat. Proc. Natl. Acad. Sci. U. S. A. 118 (41), e2024792118. doi:10.1073/pnas.2024792118
United Nations Department of Economic and Social Affairs Population Division (2019). World population prospects 2019: Methodology of the united nations population estimates and projections. ST/ESA/SER.A/425.
United Nations, Department of Economic and Social Affairs, Population Division (2018). World urbanization prospects: The 2018 revision. Online edition. Available at: https://population.un.org/wup/Download/.
U.S. Census. Quick facts: New York city. New York. Available at: https://www.census.gov/quickfacts/newyorkcitynewyork (Accessed May, 2022).
Van Der Heijden, K. (2000). Scenarios and forecasting: Two perspectives. Technol. Forecast. Soc. change 65 (1), 31–36. doi:10.1016/s0040-1625(99)00121-3
Van Notten, P. W., Rotmans, J., Van Asselt, M. B., and Rothman, D. S. (2003). An updated scenario typology. Futures 35 (5), 423–443. doi:10.1016/s0016-3287(02)00090-3
van Vliet, M., and Kok, K. (2015). Combining backcasting and exploratory scenarios to develop robust water strategies in face of uncertain futures. Mitig. Adapt. Strateg. Glob. Chang. 20 (1), 43–74. doi:10.1007/s11027-013-9479-6
Van Vuuren, D. P., Kriegler, E., O’Neill, B. C., Ebi, K. L., Riahi, K., Carter, T. R., et al. (2014). A new scenario framework for climate change research: Scenario matrix architecture. Clim. Change 122 (3), 373–386. doi:10.1007/s10584-013-0906-1
van’t Klooster, S. A., and van Asselt, M. B. (2011). Accommodating or compromising change? A story about ambitions and historic deterministic scenarios. Futures 43 (1), 86–98. doi:10.1016/j.futures.2010.10.015
Vermeiren, K., Vanmaercke, M., Beckers, J., and Van Rompaey, A. (2016). Assure: A model for the simulation of urban expansion and intra-urban social segregation. Int. J. Geogr. Inf. Sci. 30 (12), 2377–2400. doi:10.1080/13658816.2016.1177641
Vertovec, S. (2019). Talking around super-diversity. Ethn. Racial Stud. 42 (1), 125–139. doi:10.1080/01419870.2017.1406128
Vespa, J., Armstrong, D. M., and Medina, L. (2018). Demographic turning points for the United States: Population projections for 2020 to 2060. Washington, DC: US Department of Commerce, Economics and Statistics Administration, US Census Bureau.
Wilson, T., Grossman, I., Alexander, M., Rees, P., and Temple, J. (2022). Methods for small area population forecasts: State-of-the-art and research needs. Popul. Res. policy Rev. 41, 865–898. doi:10.1007/s11113-021-09671-6
Yang, S., and Cui, X. (2019). Building regional sustainable development scenarios with the SSP framework. Sustainability 11 (20), 5712. doi:10.3390/su11205712
Zapatka, K. (2021). Superdiversity in metropolitan New York: Technical report. MMG Working Paper (Göttingen, Germany: Max Planck Institute for the Study of Religious and Ethnic Diversity), 21.
Zhao, L., Oleson, K., Bou-Zeid, E., Krayenhoff, E. S., Bray, A., Zhu, Q., et al. (2021). Global multi-model projections of local urban climates. Nat. Clim. Chang. 11 (2), 152–157. doi:10.1038/s41558-020-00958-8
Zhou, W., Huang, G., Pickett, S. T., Wang, J., Cadenasso, M. L., McPhearson, T., et al. (2021). Urban tree canopy has greater cooling effects in socially vulnerable communities in the US. One Earth 4 (12), 1764–1775. doi:10.1016/j.oneear.2021.11.010
Zoraghein, H., and O’Neill, B. C. (2020a). A spatial population downscaling model for integrated human-environment analysis in the United States. Demogr. Res. 43, 1483–1526. doi:10.4054/demres.2020.43.54
Keywords: population, land use, urban, scenarios, projections, climate, local futures, narratives
Citation: Balk D, Tagtachian D, Jiang L, Marcotullio P, Cook EM, Jones B, Mustafa A and McPhearson T (2022) Frameworks to envision equitable urban futures in a changing climate: A multi-level, multidisciplinary case study of New York City. Front. Built Environ. 8:949433. doi: 10.3389/fbuil.2022.949433
Received: 20 May 2022; Accepted: 25 July 2022;
Published: 06 October 2022.
Edited by:
Solomon Tesfamariam, University of British Columbia, Okanagan Campus, CanadaReviewed by:
Nimesh Chettri, Royal University of Bhutan, BhutanBlal Adem Esmail, Ruhr University Bochum, Germany
Copyright © 2022 Balk, Tagtachian, Jiang, Marcotullio, Cook, Jones, Mustafa and McPhearson. This is an open-access article distributed under the terms of the Creative Commons Attribution License (CC BY). The use, distribution or reproduction in other forums is permitted, provided the original author(s) and the copyright owner(s) are credited and that the original publication in this journal is cited, in accordance with accepted academic practice. No use, distribution or reproduction is permitted which does not comply with these terms.
*Correspondence: Deborah Balk, ZGVib3JhaC5iYWxrQGJhcnVjaC5jdW55LmVkdQ==