 James A. Bittner
 John S. Popovics
- 1Engineering Fundamentals, Michigan Technological University, Houghton, MI, United States
- 2Civil and Environmental Engineering, University of Illinois, Urbana, IL, United States
Characterizing standard building materials such as concrete is challenging primarily because of the broad range of constituent component sizes within the material itself. Concrete, the most ubiquitous building material, contains critical components that span at least three orders of magnitude of physical size. This work introduces a nondestructive sequential impact test to extract transient nonlinear vibration behaviors that provide statistically significant holistic characterization of a heterogeneous building material, neat cement paste, on a centimeter scale sample. The sensitivity of the single impact vibration combined with the repeatability of the new sequential apparatus enables the extraction of statistically distinct transient nonlinear (slow dynamic) material memory behaviors. Experimental results on neat cement paste prisms and borosilicate glass blocks across several environmental states and damage conditions reveal an underlying phenomenon of transient nonlinear behaviors. Material damage and moisture state significantly affect the proper interpretation of the transient nonlinear material behaviors. The presented testing procedure and observations, supported by historical experiments, confirm that sequential impact reports a consistent transient nonlinear vibration behavior, and the measured behavior can identify damaged heterogeneous building materials.
Introduction
Material testing for civil infrastructure materials is a complex task with implications ranging from public safety to the effective use of public funds. Most existing testing methods lack sufficient spatial resolution to identify microscopic degradation details early enough to prevent extensive, costly damage from occurring. Leveraging new measurement techniques, transient slow dynamic measurements, to characterize material changes (such as damage) is highly desired. A history of the transient slow dynamic behavior field was provided by Ten Cate (Guyer et al., 1995; Ten Cate, 2011). The initial work in manually applying transient slow dynamic measurements to a standard cementitious testing framework has yielded highly variable observations (Somaratna, 2014). As a results of the high variability, the feasibility of damage monitoring with transient slow dynamic measurements was difficult to evaluate.
Transient slow dynamic behaviors are a form of non-classical dynamic behaviors and can be observed to occur in a wide range of natural materials, such as sandstones and granites (Ten Cate et al., 2000b; Ostrovsky and Johnson, 2001; Ten Cate, 2011; Snieder et al., 2017). In these natural materials, structural properties (grain size, fractures, and composition) are variable and uncontrolled. Efforts to categorize the manifestation of the softening have identified several influential triggers that activate slow dynamic behavior events, such as temperature, pressure, and strain (Ten Cate et al., 2002).
In order to assess the value of transient slow dynamic measurements for nondestructive tests in civil infrastructure, a series of simplified automated observational studies need to capture the feasibility of the observation, demonstrate the repeatability of the measurement, and identify key material states that influence the behavior.
The Nonlinear Resonant Ultrasound Spectroscopy (NRUS) test is an established method to measure material nonlinearity (Van Den Abeele and Visscher, 2000; Bentahar et al., 2006). However, NRUS has several drawbacks for the work studied here because it may disrupt the natural dynamic behaviors and the environmental condition of the material, such as the requirements of a permanently attached piezoelectric wafer to the sample and a long slender geometric test sample geometry of about 12:1. These two limitations make applying NRUS on cement paste not ideal.
One solution to avoid these limitations was to extend an existing concrete testing standard, ASTM C215, to provide a sequential and consistent controlled level of excitation over time. The existing ASTM C215 standard was designed to extract a linear dynamic modulus from a cylinder or prismatic sample through a specific fundamental vibration mode. The standard defines the support, receiving, and excitation positions to excite a specific vibration mode. The excitation occurs through an impact of a steel ball on the material, and the receiver can be a small detachable accelerometer.
In this article, work with a sequential impact test device that was designed, built and applied to prismatic samples is described. The device was used to perform transverse vibration measurements with identical force impacts over time. The application of multiple high-strain vibration events elicits a slow dynamic conditioning behavior as observed in the free resonance frequency of the sample. First, the consistency of the impact energy provided by the sequential impact test device was verified and the linearity of the complete vibration system was established. Then a series of experiments explored slow dynamic conditioning behaviors in neat cement paste prisms under different environmental conditions. Further measurements studied the effects of damage levels and moisture. Parallel experiments were carried out on a material that has a simple microstructure: solid borosilicate glass block.
Neat cement paste, described in detail below, exhibits many similarities to the natural materials in which the transient slow dynamic behaviors were discovered, such as porosity, strength, and multi-scale degradation features. In contrast to natural materials, cement paste provides a relatively young microstructure with a known material history in terms of moisture and loading. By controlling the sample’s loading history, an exploratory series of experiments can be performed to observe how sensitive the slow transient dynamic behaviors are to various changes of state.
Experimental materials and methods
Sequential impact test
The sequential impact test consists of a multiple impact-driven slow dynamic conditioning phase followed by a perturbation free slow dynamic recovery phase. The conditioning phase comprises the time during which regularly applied impact events drive high-strain vibration events for a specified number of impact events. The recovery phase begins immediately after the conditioning phase during which the sample is at rest.
The sequential impact test records the vibration resonance frequencies during the conditioning phase of a test. This is in contrast to the NRUS method, which primarily focuses on the recovery behavior of the test (Ten Cate, 2011). The distinction is worth noting because all recovery behaviors require measurements after a conditioning has occurred, while the conditioning measurements start with the material in an at-rest state.
The material used in the experiments was neat portland cement paste. The samples were cast into 5 cm by 5 cm by 19.6 cm prisms with a water to cement ratio of 0.5. Samples were mixed following the procedures of ASTM C305. Samples were demolded and moist-cured for at least 28 days after mixing, and then dried unrestrained in ambient laboratory conditions for at least 56 days (8 weeks) after the end of moist curing.
Experimental control and recording were performed by a computer running MATLAB with a digital acquisition device and two microcontrollers. The controls performed the sequential impact tests utilizing the electro mechanical device. The timing of the impact events was controlled through a programmed interrupt at a period of 4 s. The first microcontroller interfaced with the impact device. The second microcontroller interfaced with environmental monitoring sensors, for example humidity and temperature sensors. The digital acquisition device recorded the signals of the accelerometer to capture the vibrational behaviors in time.
The environmental monitoring sensors deployed were a Sensirion SHT75 for humidity and temperature, and a Bosch BMP180 for barometric pressure. The Sensirion SHT75 sensor has a nominal accuracy of approximately ±1.8% for relative humidity and ±0.3 C for temperature within the range tested, with a response time of 8 s. The Bosch BMP180 barometer has a nominal accuracy of ±400 Pa. Environmental parameters were averaged over 30 readings every 5 min.
The vibration sensor used was a PCB 352C15 accelerometer with a PCB 482B11 line-powered ICP signal conditioner with ten times amplification. The accelerometer was coupled using a cyanoacrylate bonding to the cement paste samples at the start of a sequential impact series. This bonding agent provided consistent behavior regardless of temperature or moisture conditions in the environment. The data were captured with a digital acquisition device, the Picoscope 5442 A. The sampling rate was 62.5 MHz at 16-bit resolution, such that 3 million data points were captured for each impact vibration. Each vibration signal was captured by the digital acquisition device and stored as a compressed MATLAB file. After each sequential impact series, the time-domain signals were processed and the peak fundamental frequency was identified for each impact. The outputs of the processed results are the peak vibration frequencies over the impact sequence.
Electro mechanical sequential impactor device
To extend the existing standard, ASTM C215, to capture slow dynamic conditioning and recovery behaviors, the impact excitation must have strictly controlled force and timing. An overview of the developed sequential impact test is shown in Figure 1. An electromagnetic impact driver is able to control the motion of a ball to cause a single isolated strike and lift off away from the surface of the sample. A small accelerometer is fixed at an anti-node of the tested prism as defined in ASTM C215 and records the acceleration of the vibration in time.
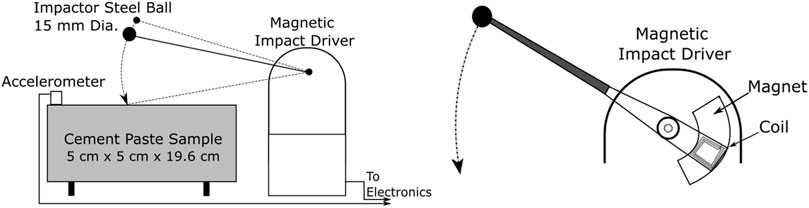
FIGURE 1. Illustration representing the sequential impact dynamic vibration test for transverse vibration on a prismatic sample (left) and the angular solenoid for repeatable impact excitation (right).
In order to prevent contamination of the recorded behaviors over time, the friction of the rotating armature was limited to enable multiple quick impacts. An angular solenoid activated by a microcontroller was implemented to achieve repeatable impacts as pictured in Figure 1. Current flowing through the coil within the fixed magnetic field resulted in a smooth quick force applied to the armature. To optimize repeatability, the force was used only to lift the impactor ball; the downward motion was driven entirely by gravity.
The electromagnetic impact driver, when not being driven with a current through the coil, can be configured to act as a sensor. During the free fall of the impact ball, the voltage potential across the open circuit of the coil leads is proportional to the velocity of the coil moving through the magnetic field. Because the impact ball and the coil shared a fixed armature, the voltage signal verifies that an impact occurred and, with some calibration, measure the ball’s velocity before and after the impact event. The recorded open circuit coil voltage for a single impact event is shown in Figure 2. In the figure, the occurrence of the impact event is defined by the time where the ball velocity quickly changes direction, which in terms of the plotted voltage is at the zero crossing of the voltage signal. Unfortunately, due to the vibration of the armature that occurs shortly after the impact event, the oscillating signal after impact requires extrapolation to estimate the bulk velocity of the steel ball by excluding the armature vibration. The highlighted red and green regions of the measured voltage signal are extrapolated to the zero-crossing time, which represents the approximate velocity measurements of the ball falling before the impact event and directly after the impact event. The before and after impact velocities are denoted in the figure as black stars. From the velocity and known mass, kinetic energy can be calculated before and after an impact event.
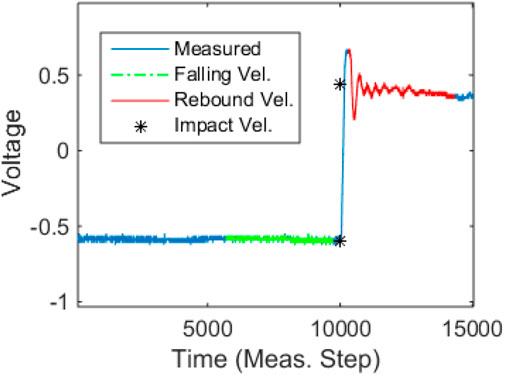
FIGURE 2. Voltage of the open circuit magnetic impact driver during an impact event occurring at approximately the 10,000th measurement time step.
Consistent device performance was critical to verify that the observed behavior was not an artifact of the new measurement system. One method to monitor the performance of the impact device was through the energy of the impacts. The energy change of each impact was measured from the impact velocity measurements as illustrated in Figure 2. The energy change of the impactor due to the impact was calculated by
where
The ball impact location and accelerometer were physically placed on the smooth top surface; two dowel bars were used for supports as specified in ASTM C215 in order to excite a fundamental transverse vibration mode. The fundamental transverse mode was selected over the fundamental longitudinal mode so as to limit the rigid movement of the specimen during a multiple-impact test series.
Using the test setup, the peak vibration frequency was expected to correspond with the first fundamental resonance frequency. The fundamental resonance frequency is a function of the test geometry and the material mechanical properties. For a consistent test geometry, a decrease in fundamental resonance frequency corresponds to an apparent decrease in the material’s mechanical properties, specifically Young’s modulus.
Because slow dynamic conditioning was studied here, the parameter of interest was the modulus reduction that occurs because of a specific conditioning history. One method to measure this parameter is to record the reduction in fundamental resonance frequency during the conditioning phase that is setup by sequential impacts. The change in resonance frequencies can be calculated as
where
One principal concern with running a sequential impact test is the potential for non-uniform impact energy over time. In order to evaluate the electromagnetic impact driver’s performance over a series of impacts, the impact energy was recorded for a test sample prism of ambient laboratory-dried 0.5 w/c ratio neat cement paste over 100 impacts. The sample was allowed to rest for 24 h prior to testing at ambient environmental conditions. If the impact energy is consistent, the softening trends observed are not due to an error in the measurement system and are in fact the material’s nonlinear behavior.
Linear material vibration
The next validation of the sequential impact device was to test a known standard linear material. The material selected was polymethyl methacrylate (PMMA), which is frequently used in ultrasonic operations as a calibration material due to its being a non-porous homogeneous linear material that is optically free of defects at room temperature and has a mechanical impedance similar to that of rocks. As a result, no transient dynamic behaviors are expected when the sequential impact tests are performed on the PMMA material.
The sequential impact test was carried out with a series of one hundred impacts in a 4-s period with a 2-h period between impact series. Two identical tests were carried out in succession. A prism of PMMA was cut with a band saw to the identical dimensions as the previously tested neat cement paste prisms: 5 cm by 5 cm by 19.6 cm. The impact test was configured to excite the fundamental transverse vibration mode. The peak frequency of vibration was measured and tracked for each of the sequential impacts.
Measurement reproducibility and correlations
The next critical experiment for the new testing device was to understand the reproducibility and potential correlations with indirect testing parameters such as temperature.
A sequential impact test was performed exciting the fundamental transverse mode of a neat cement paste prism (w/c 0.5) sized 5 cm by 5 cm by 19.6 cm at both ambient laboratory conditions and in environmentally controlled conditions. The sequential impact test carried out 100 impacts at an impact interval of 4 s every 2 h. The period between impact sets was a rest period where the sample was left undisturbed to recover. The test was performed continuously for three and a half days. Observations between recorded environmental parameters and vibration behaviors were compared to identify any correlations.
After correlations were identified, efforts were made to improve the reproducibility by controlling the environmental parameters (temperature and relative humidity), and the test was repeated. Both the temperature and relative humidity were maintained constant within a controlled chamber where the test setup was housed: Associated Environmental Systems FD-21. Humidity was controlled using different saturated salt solutions following the specifications of ASTM E104 within the sealed chamber. The nominal target environmental parameters were temperature controlled at 32°C and a relative humidity of 22% maintained with a potassium acetate solution.
Significance of moisture and damage experiment
The next stage of observing the global nonlinear transient dynamic behaviors was to build a sample dataset with various levels of damage and moisture. The objective of this investigation was to identify a driving material condition behind the generation of nonlinear transient dynamic behaviors.
The material used for this experiment was neat portland cement paste. In order to maximize any effects present in the material due to the porous microstructure, a high water-to-cement ratio of 0.8 was used. Cement paste was mixed in accordance with ASTM C305. Prisms were cast in 5 cm by 5 cm by 19.6 cm steel forms lined with oil to aid in demolding conforming to ASTM C192. Prisms were covered with two moist 0.15 mm thick plastic sheets for 24 h until demolding. After demolding, specimens were cured in a moist chamber conforming to ASTM C511.
The testing protocol followed for this investigation was to test specimens before and after the prisms were treated with different combinations of damage and moisture conditions. Prior to implementing the testing plan, all specimens were completely saturated by remaining in the moist curing room since creation.
Twenty prisms were cast and moist-cured for at least 3 months prior to testing. Four test groups were generated that included each combination of two levels of damage and moisture. The groups were defined as pristine wet, naturally dry, damaged wet, and damaged dry. The pristine case was defined as being in the mechanical condition present at the end of curing. The damaged case was defined as being exposed to fast temperature changes due to saturated thermal shocking. The wet moisture case was defined as always being stored at above 97%–100% humidity. The dry case was defined as being slowly dried down to 50% relative humidity, with an intermediate step at 80% humidity. The naturally dry condition was a pristine sample that had been slowly dried to limit any significant potential shrinkage damage.
The damage procedure implemented during this investigation comprised saturated thermal shock cycles. This method of damage was selected to induce a uniform level of damage across the five prism samples while maintaining a completely saturated moisture state within the material. Two respective water baths were maintained at 4°C using ice water and at 80°C using an electric heater. Prisms in the damaged groups were cycled first to the cold bath for 20 min then to the hot bath for 20 min; this procedure was repeated for two full cycles. To monitor internal prism temperature, an extra prism was drilled, and a thermocouple was inserted into the center of it. The temperature history of the extra prism is shown in Figure 3. The captured internal temperature profile shows uniform shocking behaviors for the two cycles of identical damage.
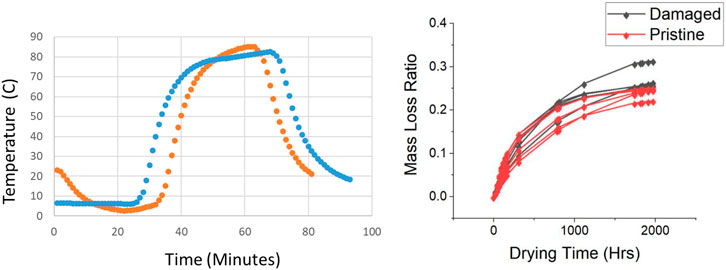
FIGURE 3. Temperature profiles from an embedded thermocouple within samples during two saturated thermal cycle events comprising of a ice bath and heated water bath. The first shocking cycle is colored blue and the second shocking cycle is colored orange (left). Gradual drying mass loss of damaged and pristine groups of neat cement paste prisms over time in a controlled environment. Mass loss ratio is defined as mass loss at a specific time to the initial mass of cement prism (right).
The implemented drying procedure was designed to gradually remove the moisture within the saturated porous cement paste while limiting the damage caused by drying shrinkage cracking. It has been established that the evaporation rate and the level of hydration of the cement (Mindess et al., 2002) affect the extent of drying shrinkage cracking in cement-based materials. These components were mitigated in the test samples. First, the prisms were allowed to reach maturity prior to testing by maintaining them in a controlled moist-cure environment for 3 months after mixing. Second, the evaporation rate was controlled by slowly stepping down the humidity of the drying environment.
After the damaged set was created, prisms in the dry sets were slowly dried by being placed in a sealed 23°C temperature and 80% relative humidity chamber controlled by saturated potassium chloride for 1 week. After 1 week, the prisms were dried further in a 50% relative humidity chamber. Mass measurements were taken at 1, 3, 7, 14, and 21 days after the start of drying and at least every 21 days thereafter. The relative mass loss of each prism over time is shown in Figure 3. Once the change in the mass loss ratio was identified as less than 0.01 per day for all prisms, the drying protocol was defined as completed. The recorded mass loss ratio resulted in a consistent trend among most of the samples with an average mass loss of 25% of the original mass. The two bounding outliers clearly seen in the figure represent the minimum and maximum mass loss of 22% and 31%. This confirms that the drying protocol was consistent between the two groups of dried condition prisms being tested.
To build confidence in the material states of the sample groups, additional measurements of damage identification were performed. The first measurement was high-resolution optical scanning. The dried blocks were scanned at 4600 dpi. Cracks were identified manually through visual inspection and traced to confirm that the material states represented different levels of damaged specimens.
The second implemented measurement technique was ultrasonic pulse velocity as documented in ACI 218.2R (ACI Committee 228, 2013). An ultrasonic pulser and receiver device, the Proceq Pundit, was used with 54 kHz transducers to measure a pitch-catch wave transmission. The time of flight of the transmission was recorded along with the geometric distance traveled. These two values were used to compute a wave velocity in the prism. Wave velocity is proportional to the square root of the modulus and inversely proportional to the square root of the density. As a sample is damaged by cracking, the velocity will decrease. Wave velocity was measured three times for every prism.
The impact testing was performed following the previously described sequential impact testing method. One hundred impacts were recorded with 4 s spacing between impacts. The sequential impact testing was performed on a 2-h cycle for 24 h. The final four sequential impact test datasets were collected and processed for two summarizing parameters. The first parameter was the initial fundamental resonance frequency, which was used to calculate the linear dynamic modulus as defined by ASTM C215. The second parameter was the shift in the fundamental resonance frequency during the duration of a single sequential impact test series. The shift in frequency over a single sequential impact test series was used to characterize the transient nonlinear slow dynamic behaviors observed.
Solid and cracked glass block experiments
The final study performed in this global scale experiment series was to explore the presence of slow dynamic nonlinearity in a non-porous brittle material in both a pristine and damaged state.
The non-porous brittle material selected was a solid, transparent soda-lime glass block. The blocks used are a standard architectural material used in building design and were acquired from Seves Glass Block in the Czech Republic. These blocks in the pristine condition were optically clear of defects and contained very few small (<1 mm diameter) voids. The block measured 24 cm by 11.7 cm by 5.3 cm in dimensions and had a mass of 3.5 kg. The block was brought to equilibrium testing conditions at 32°C and 80% relative humidity. The block was initially tested in a pristine condition and then in a damaged condition with sequential impact testing identical to the previous test.
Damage to the glass block was carried out using thermal shock to encourage a uniform distribution of damage (Ten Cate et al., 2016). The glass block was heated in an oven to 100°C for 24 h and then submerged in 23°C water for 30 min. After submersion, the block was returned to the oven and dried for 24 h. After drying, the block was placed in a temperature and humidity-controlled environment at 32°C and 10% relative humidity and allowed to equilibrate for 24 h. The damaged block and the sequential impact-testing device are shown in Figure 4. The glass block was then tested using a set of 100 sequential impacts every 2 h over a 24-h period. At the completion of 24 h of testing, the humidity in the environment was raised to 80% and the system was allowed to equilibrate for an additional 24 h. After the equilibrium period, the glass block was tested using the same sequential impact protocol.
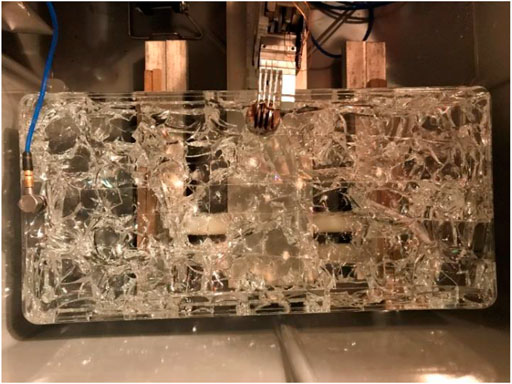
FIGURE 4. Solid soda-lime glass block in thermally shocked damaged state on sequential impact test device.
In addition to the recording of transient slow dynamic nonlinearity, another method of processing that can be performed on the sequential impact dataset is the extraction of any resonant frequency shifting during a single vibration impact. The single vibration impact processing is called NSIRAS and is reported to represent the opening and closing of cracks due to the level of instantaneous strain during the vibration (Van Den Abeele et al., 2000; Eiras et al., 2014). The change in frequency during a single impact event was calculated based upon the collected impact vibration data for the block in each damage and moisture states.
Experimental results
The results for each experiment will be presented and the significance of each result will be addressed in the following discussion section.
Sequential impact test results
The measured time signal from a transverse vibration acceleration test excited by a single automated impact created by the sequential impact-testing device on a cement paste prism is shown in the top left inset of Figure 5. The vibration lasts for approximately 20 milliseconds and displays a single principal mode of vibration corresponding to the transverse configuration. The frequency spectrum of the measured time signal is shown in the top right inset. The peak fundamental transverse resonance frequency is labeled with a red circle and occurs at approximately 3060 Hz.
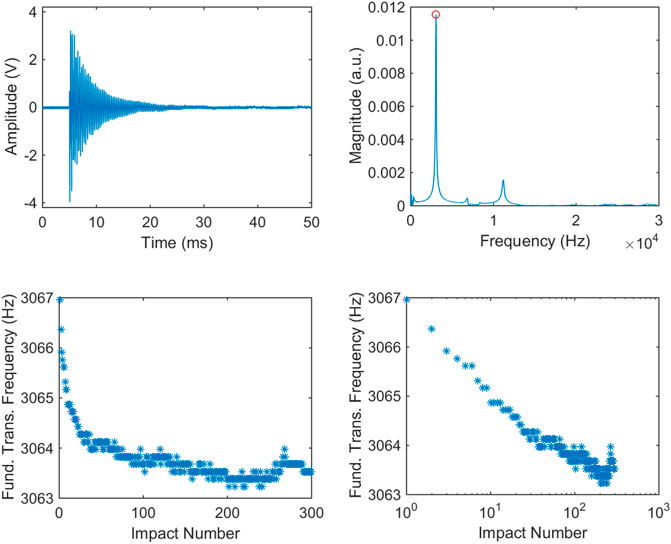
FIGURE 5. Single impact vibration time signal (top left) and discrete frequency spectrum (top right) with the frequency of the fundamental transverse mode identified by a red circle. Linear (bottom left) and semi-log (bottom right) plots of fundamental transverse frequency recorded during sequential impact testing set of dry cement paste (0.5 w/c) in uncontrolled laboratory conditions.
All collective results of a sequential impact test on a neat cement paste prism with 300 impacts are shown for linear, bottom left inset, and log-linear, bottom right inset, scales in Figure 5. Each impact event is characterized by the extracted peak fundamental frequency of vibration. The initial impact of the sequential impact test displays the highest fundamental resonance frequency. Subsequent impacts display a reduction in resonance frequency that suggests a progressive softening of the material’s mechanical behaviors. This softening behavior indicates the effect of slow dynamic conditioning on the material sample.
The results of multiple sequential impact tests are shown in Figure 6. The horizontal axis shows time in hours, and the vertical axis the extracted fundamental transverse resonance frequency of each impact event. The results from individual impacts within each sequential impact test set display a shape similar to a reversed letter “J.” Between sequential impact test sets the results display a recovery of resonance frequency (or stiffness) during the rest periods where no impact events occur.
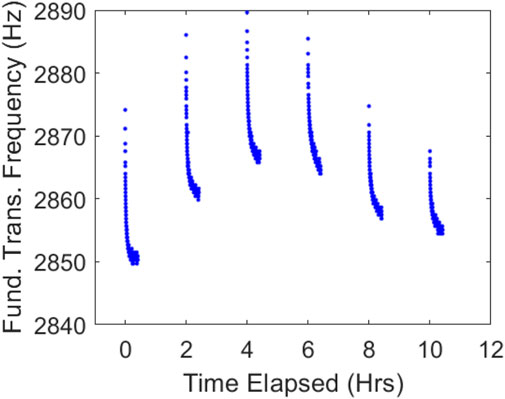
FIGURE 6. Multiple repeated sequential impact tests with intermittent rest periods performed on a 2-h recovery cycle on cement paste in an uncontrolled laboratory environment.
Uniform force validation results
The recorded vibration frequency of each impact is plotted, illustrating the characteristic softening of the fundamental transverse vibration frequency shown in Figure 7. The secondary axis represents a measurement of relative impact energy from the falling steel ball owing to the impact events. The value of energy over time represents the repeatability of the sequential impact device to impart a consistent excitation impulse source to drive the vibration, thus arguing that the observed softening in the data in Figure 6 is not caused by changes in mechanical impact energy. Although the energy data do show variability (32% Coefficient of Variation), the results are effectively consistent and no consistent trend over time during the impact set is observed. This relative energy value verifies that our automated system does not display drift or systematic changes throughout the impact event set.
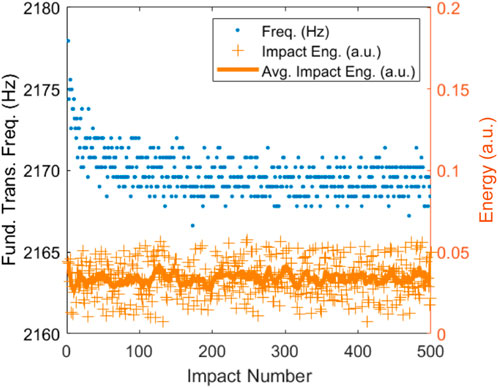
FIGURE 7. Peak fundamental transverse resonance frequency of prismatic neat cement paste sample over sequential impacts and extracted average change of energy from the dynamic electromagnetic impactor.
Linear material vibration results
The results from two different sequential impact tests performed at ambient laboratory conditions on a prism of PMMA were collected. No consistent change in transverse resonance frequency over the series of impacts was observed.
Measurement reproducibility and correlations results
A plot of the fundamental resonance frequency for multiple sequential impact test sets on a neat cement paste prism over a duration of 3 days is shown in Figure 8. Mass and geometry were unchanged during the duration of this experiment. The initial impact of each sequential impact set was observed to always be the highest frequency of each test set. In the case of uncontrolled ambient environment (Figure 8 left), the frequency varies from test set to test set. The initial impact of each sequential impact test represents the standard linear dynamic measurement captured by one single uncontrolled impact.
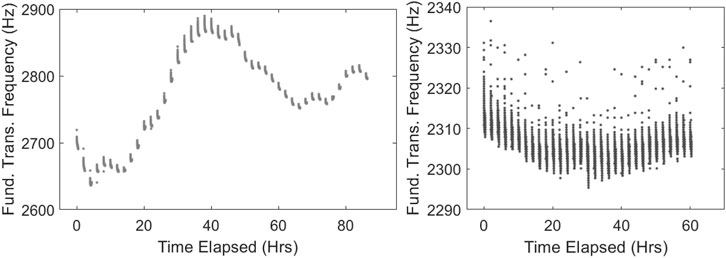
FIGURE 8. Sequential impact test sets carried out on neat cement pastes using a 2-h test cycle period in ambient laboratory conditions over the course of 5 days (left) and in a controlled temperature and relative humidity chamber (right).
The results of the 3-day sequential impact study shows that varying ambient conditions disrupt measurement results obtained from this vibration technique. The parameters that influence the results should be identified, controlled, and understood before sequential impact tests can be used for practical applications.
Three selected ambient environmental characteristics, temperature, relative humidity, and barometric pressure, are compared with resonance frequency results from impact set tests in Figure 9. The resonance frequency, which is proportional to Young’s modulus, does not exhibit obvious visual correlation with the small change in ambient temperature. More obvious direct correlation is observed between the resonance frequency and relative humidity and inverse correlation observed between resonance frequency and barometric pressure.
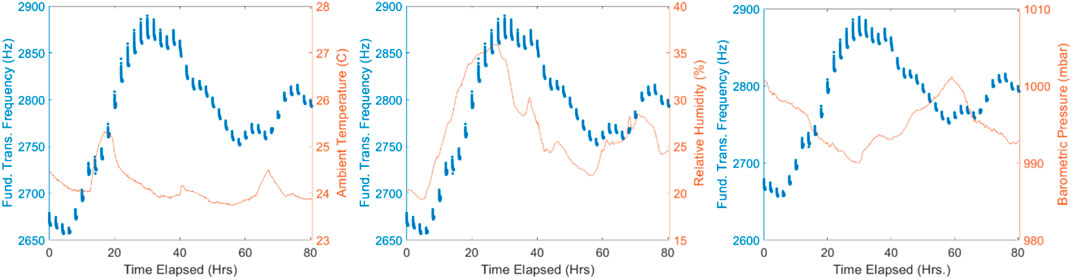
FIGURE 9. Sequential impact test results compared with recorded laboratory temperature (left), relative humidity (middle), and barometric pressure (right).
The shift in resonance frequency across a single sequential impact test set displays characteristic transient slow dynamic nonlinearity. The effects of ambient environmental parameters (temperature, humidity, and pressure) on the intra-test transient resonance frequency shift are explored in Figure 10. The measured transient resonant frequency shift ranged from 6 to 26 Hz per impact set, with the strongest correlation identified with the inverse of ambient relative humidity.
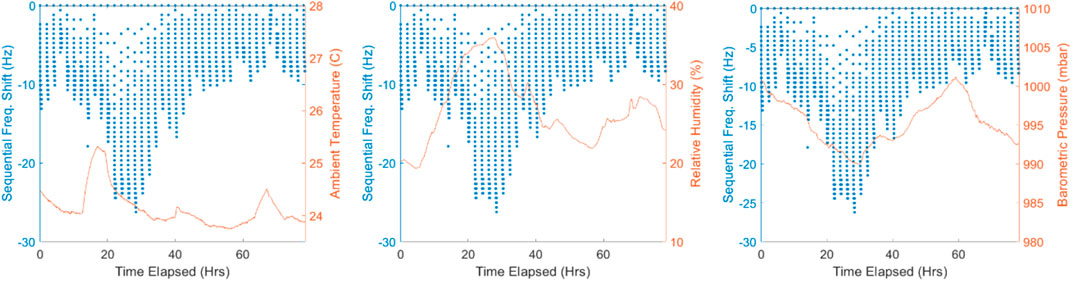
FIGURE 10. Shift in fundamental resonance frequency within sequential impact sets relative to the first impact within the set compared with recorded ambient laboratory temperature (left), relative humidity (middle), and barometric pressure conditions (right).
The results of an environmentally controlled, 32°C and 22% relative humidity, sequential impact test are shown in the right inset of Figure 8. The variability between sequential impact tests is significantly less than in the uncontrolled-environment cases shown in the left inset of Figure 8.
In order to better control repeatability all of the following reported experiments were performed with controlled environmental humidity and temperature, although we were not able to control barometric pressure of the environment with our test set up. Unless otherwise stated, the temperature was set and monitored at 32°C ± 1°C and the relative humidity was fixed at 50% ± 5% while barometric pressure was ambient.
The significance of moisture and damage experiment results
The significance of the moisture and damage experiment was intended to identify the root cause behind the transient behaviors in a series of samples with different conditions. The test protocol was carried out as planned and the verified damage and moisture conditions were monitored with temperature and mass measurements. The results of the sequential impact testing were processed to generate a dynamic linear modulus as defined by ASTM C215 (ASTM C215, 2014) and a transient slow dynamic frequency shift as defined in above.
The results of the standard dynamic linear modulus test from the fundamental transverse resonance mode are shown in Figure 11. All samples were mature and started in the saturated pristine case; this condition is identified as Case 0. Some samples were then exposed to other ambient temperature and RH conditions and those samples are identified as Case 1 for each of the testing group conditions. In other words, Case 0 and Case 1 represent before and after controlled damage and environmental exposure cases, respectively. Each testing group consists of five samples tested four replicate times; that is, each bar in Figure 11 represents 20 sets of data. The control condition group, pristine and maintained in a saturated environment, displays no obvious change in dynamic linear modulus. The saturated damaged case displays a slight median decrease in modulus after being subjected to thermal shock damage but the difference in modulus does not appear to be statistically different. The naturally dry pristine case displays a notable and apparently statistically significant decrease in linear dynamic modulus. The dry damaged case presents the largest reduction in dynamic linear modulus and apparently statistically significant reduction in modulus. The magnitude of reduction in median linear dynamic modulus owing only to the pristine slow evaporation of moisture, 1.42 GPa, was larger than the magnitude of reduction measured for only thermal shocking damage, 0.21 GPa.
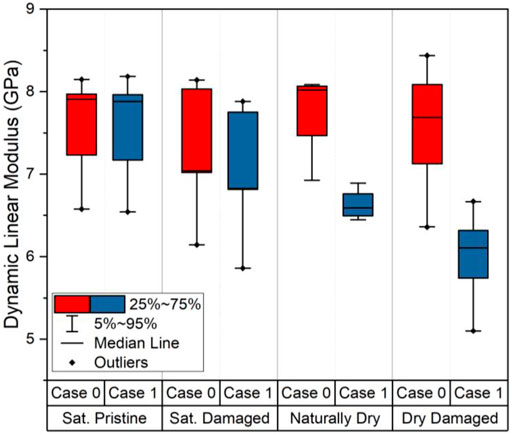
FIGURE 11. Linear transverse fundamental resonant vibration-based estimate of elastic modulus in neat cement paste prisms in the uniform saturated pristine condition, Case 0 (red bars), and the representative labeled damaged test condition, Case 1 (blue bars). The height of the bar represents the 50% confidence interval for five separate bars of each group tested four times each bar. Case 0 represents the saturated pristine material condition before exposure to the subject environment.
Results from the sequential impact testing set for only a single randomly selected prism from each condition group are shown in Figure 12. In the plots, the relative frequency shift from the initial point (vertical axis) is plotted against the number of impacts within an impact test set (horizontal axis) in both the Case 0 (before exposure), and Case 1 (after exposure) conditions. In all exposure conditions, Case 0, the saturated pristine condition before exposure, displays relatively consistent frequency shift value with impact number. This flat response indicates no transient conditioning behavior associated with an ideal linear elastic material behavior. For the “after exposure” case (Case 1) for the saturated group, no distinct change from linear behavior was observed, meaning that no slow dynamic conditioning observed. The same can be said for the saturated damaged and naturally dried cases. The only visually obvious change occurred for the dried damaged condition group. The dried damage group, however, displayed a reduction of 1.33 Hz in resonant frequency during the application of 100 impact events as compared with the pre-exposure results (case 0). Clear indication of slow dynamic conditioning occurs in this case.
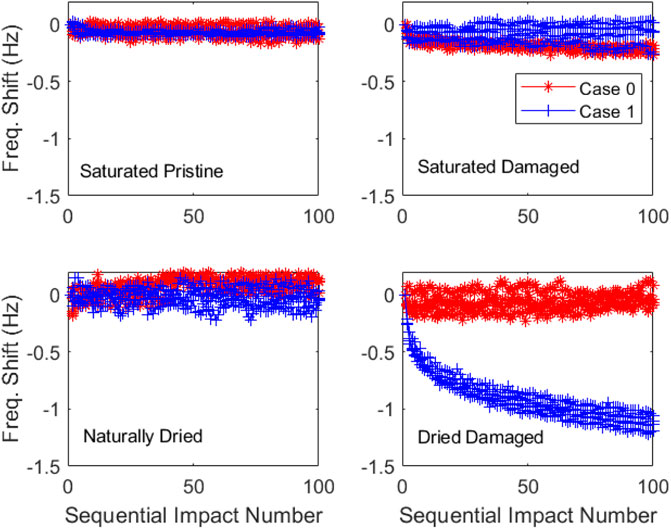
FIGURE 12. Sequential impact test results for four randomly selected neat cement paste samples in the saturated pristine condition before exposure, Case 0 (red), and then the same sample after damage and/or environmental exposure, Case 1 (blue). The representative test conditions are saturated pristine (top left), saturated damaged (top right), naturally dried (bottom left), and dried damaged (bottom right). Case 0 represents the saturated pristine material condition before exposure to the subject environment.
The aggregation of the sequential impact testing resonant frequency shifts for the five replicates in each condition group is shown as a box plot in Figure 13. The results confirm the individual prism results presented in Figure 12. Only one conditioning group, dried damaged, shows clear and statistically significant change in slow dynamic resonance frequency shift beyond the 95% confidence intervals of the measurement. In this experiment, the repeatability of the measurement, as indicated by the relative size of the 95% confidence intervals, was observed to be constant for all conditioning groups except in the highest level of the damaged case.
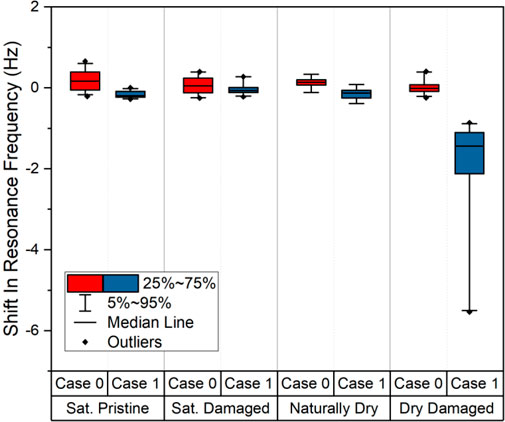
FIGURE 13. Sequential impact test results of the fundamental transverse resonant frequency shift during one series of impacts in neat cement paste samples for the uniform saturated pristine condition, Case 0 (red), and then the same sample after damage and/or environmental exposure, Case 1 (blue), for four different test conditions. The height of the solid bar represents the 50% percentile confidence interval for five separate prisms of each group tested four times each case. Case 0 represents the saturated pristine material condition before exposure to the subject environment.
Additional comparisons of the damaged state
High resolution photographic images were collected from the surface of a representative test sample for each dry condition to verify the created damaged state. The collected images for dry damaged and naturally dry are shown in Figure 14. The dry damaged condition displays one large visible crack on the surface, while the naturally dried condition does not display any visible cracking. Owing to the high water-cement ratio, some scaling was observed on the surface of both samples.
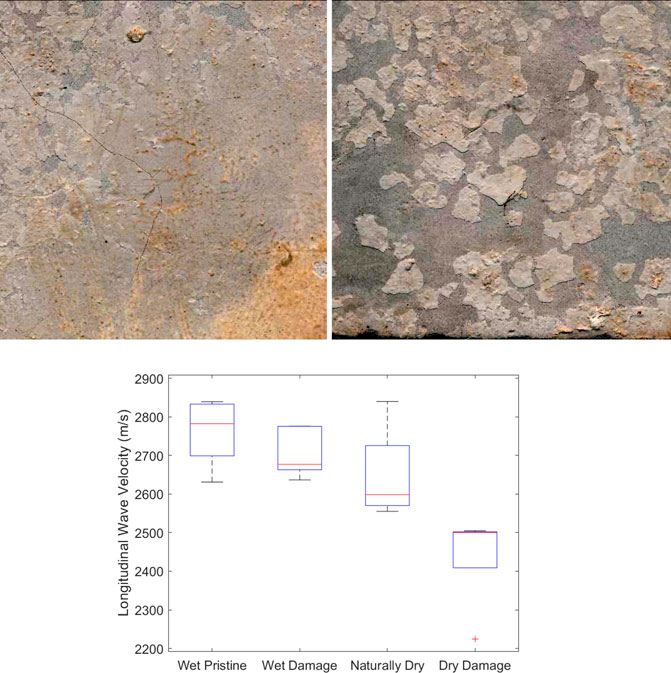
FIGURE 14. Surface photos, with enhanced contrast, to facilitate crack identification, of cement paste (w/c = 0.8) prisms with two thermal-cycle induced damage (top left) and undamaged naturally dried (top right) conditions. Vertical size of images is 2.5 cm. Ultrasonic pulse velocity measurement repeated three times for five replicates of each sample condition group (Bottom). Black bars represent the 95% confidence intervals within each sample, the blue box represents the 50% confidence intervals, and the red line represents the median of the condition group.
This measurement adds an additional verification that the damage conditioning protocols generated clear and visible cracking damage. Further verification of the condition of each group was measured through an ultrasonic velocity measurement. The velocity measurement was carried out after all conditioning and impact tests were completed. The results of the ultrasonic velocity measurements are summarized in Figure 14. The wet pristine condition was found to have the largest median velocity, followed in order by the wet damaged, naturally dry and dry damaged condition groups. This order of material stiffness agrees with the order recorded by the linear dynamic elastic modulus testing shown in Figure 11. The indicated sample confidence intervals demonstrate that only the dry damaged condition group exhibits a statistically significant difference in velocity value.
Solid and cracked glass block results
The transient slow dynamic conditioning results of a sequential impact test on a glass block in two different damaged conditions are shown in Figure 15. The pristine case displays linear behavior with no visible slow dynamic conditioning trends seen within the series of 100 impact events. The two damaged cases do display slow dynamic conditioning occurring within the 100 impacts. The damaged case at higher humidity (80%) displays the largest conditioning behavior, reducing a total of 60 Hz over a series of 100 impacts. At the same damage state but a lower humidity (10%), a smaller resonance frequency shift of only 13 Hz is observed, which represents a 78% difference in transient nonlinear slow dynamic behavior casued only by ambient RH values.
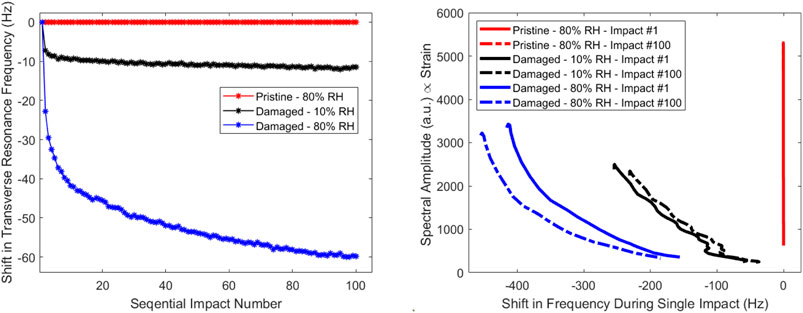
FIGURE 15. Sequential impact fundamental transverse resonant frequency shift in glass block sample for two damage states and two moisture states (left) and single-impact windowed frequency shift, NSIRAS, for the glass block sample calculated on the first (001) and last (100) signal from sequential impact test set for different damage and moisture conditions (right).
The results of NSIRAS processing on the first and last signal of the 100 impacts sequential impact set are shown in Figure 15. The vertical axis of the plot is the maximum recorded acceleration in the windowed signal subsection, which can be considered proportional to strain (Shokouhi et al., 2017; Carrión et al., 2018). The horizontal axis of the plot is the difference in frequency between the windowed signal subsection and the last windowed signal subsection in a single impact signal. The processed data series are presented for the first (#1) and the last (#100) impact in the sequential set. The pristine case displays no significant shift in frequency during the damped vibration event, so the NSIRAS results overlie each other in the plot. The damaged low humidity case displays an observable shift with frequency during a single impact event. The first (#1) and last (#100) damaged low humidity impacts in the 100-impact series display similar results, often overlapping. The damaged high humidity case has the largest observable shift with frequency during a single impact event. The first and last high humidity impacts of the 100-impact series display different shifting behaviors over a single impact and do not overlap.
Discussion
Sequential impact test
Each sequential impact test on ambient dried neat cement paste displays a pattern of continuously decreasing resonance frequency. The decreasing frequency represents the softening of the modulus over time during impact excitation, which is attributed to the conditioning phase of slow dynamics. The reduction in frequency when exposed to an excitation event mirrors the results reported with other testing techniques such as the Larson effect and DAET (Ten Cate et al., 2004; Lobkis and Weaver, 2009; Rivière et al., 2013).
From the calculated impact energy data in Figure 7, no clear trend over time exists in the energy of the impact. The repeated excitation results in a decrease of dynamic stiffness as measured through vibrational transverse fundamental resonance frequency. The measured impact energy and transient nonlinear behaviors observed through sequential impact testing provides confidence that the recorded nonlinear behaviors were a feature of the material and not a feature of the testing system.
Linear material vibration
The frequency of the fundamental transverse resonance mode remained constant for a PMMA prism, a known linear material at low-frequency inspection at room temperature, during repeated application of impact events. The two repeated tests demonstrated no transient nonlinear trend of vibration behaviors throughout the sequential impacts. The lack of transient trend affirms the expected linear behaviors of the material measured with the new sequential impact device.
The combination of consistent impact energy with the measurement of linear behaviors provides confidence that the testing device was extracting behaviors that were representative of the material rather than the testing approach. These two validation studies confirm that the automated sequential impact device provided a valid platform for monitoring material-level nonlinear vibration behaviors.
Measurement reproducibility and correlations
The multiday measurement of sequential impact testing provided a baseline understanding of the variability of resonance frequency measurements from one test situation to another. The first impact is interpreted to be the undisturbed linear dynamic vibration behavior. In this multiday measurement, the linear dynamic vibration behavior changed significantly compared to the extent of the transient nonlinear features. This observation suggests the need to understand influencing factors on this test technique.
By comparing the changing linear dynamic vibration behavior with measured environmental parameters, strong correlations were observed. These correlations help identify what series of controls are required in order to properly characterize the repeatability of impact vibration testing. Specifically, ambient moisture and temperature must be controlled to reduce variability. Additionally, barometric pressure contributes toward the measurement variability, but we were not able to control barometric pressure in our experiments. In future studies we will attempt additional measurements where barometric pressure is controlled in an effort to better understand those effects.
An identical procedure of environmental correlation was carried out with the transient nonlinear resonant frequency shift. The strongest correlation existed with the measured relative humidity. The earlier research proposed that the softening behavior was believed to be entirely a factor of the solid components of the cementitious matrix where the humidity change would trigger the solid behavior to occur (Ten Cate et al., 2002). Our new observations suggest that the softening behavior should be described by a combined contact-moisture relationship. The correlation of the transient nonlinear magnitude with the ambient moisture vapor concentration provides a unique insight into the understanding of the slow dynamic conditioning behavior.
The sequential impact tests performed under controlled temperature and humidity environments exhibit a significant reduction in variability of the frequency of the transverse resonance mode. The reduction in variability enables both the linear frequency and the nonlinear shift in frequency with a sequential impact set to be visualized on the same vertical scale of frequency.
Significance of the moisture and damage experiment
The experimental exploration of environment control and damage exposure enabled a statistical approach to documenting the transient nonlinear slow dynamic behaviors observed in sequential impact testing.
The saturated pristine condition group displayed no statistically significant change in dynamic modulus during sequential impact testing. Because these samples were kept in an identical moisture and damage state for both tests, this group acts as a control and validates that there is no bias in the tests performed at different times (the initial before condition or 3 months later in the after condition). For the wet damaged condition group, a small uniform decrease in the median dynamic modulus was observed. This suggests that the thermal shocking did cause disruption (cracking) to the microstructure of the cement paste prism samples. For the naturally dry group, a large reduction in dynamic linear modulus was observed during sequential impact testing. The naturally dry group highlights the significance moisture plays in the role of the dynamic mechanical properties of porous solids. The loss of moisture in the naturally dry group had a relatively larger influence on the dynamic modulus than a significant thermal shocking event had in the wet damaged group. The final group tested was the dry damaged group, which showed the largest difference in median dynamic modulus of all groups between the before, Case 0, and the after, Case 1, treatment situations. The results from the dry damaged group confirmed that the addition of the damage and the loss of moisture both added unique components that led to a measured reduction in dynamic modulus.
The dynamic linear modulus measurements demonstrate the variability of testing a brittle porous material. The calculated modulus on identical prisms resulted in a 95% confidence interval of approximately 1.5 GPa, which for an undamaged prism represents approximately 18% of the total dynamic modulus. Because of this relatively large variance, identification of one saturated damaged block from one saturated pristine block, a change of approximately 2.6%, is not statistically valid using the dynamic linear modulus. Additionally, the influence of moisture loss on the absolute dynamic modulus is larger than the influence of microstructural damage. For example, a thermally damaged sample sprayed with water may have a higher linear dynamic modulus than a less thermally damaged sample that has not been exposed to water. The effect of pore moisture poses significant challenges for applying linear modulus based vibrational techniques to inspecting in situ (uncontrolled environment) structures for damage.
The sequential impact testing measurements of transient nonlinear slow dynamic behaviors were summarized by the conditioning shift in resonance frequency over an impact series. In all condition groups, except dry damaged, no significant change in the shift in resonance frequency over 100 impacts was observed. This result initially appears to be in contradiction to literature published on pristine sandstones and pristine concrete where transient nonlinear dynamic behaviors were observed (Ten Cate et al., 2000a). However, the materials from the literature in their “pristine” condition contained components that have both structural discontinuities (drying damage) and ambient environmental moisture levels. Additionally, due to the nature of geomaterials, such as stone and cementitious composites, the microstructure is highly disordered. This disordered microstructure can permanently trap moisture in inclusions and generates tortious pore pathways (Aligizaki, 2006), which makes an absolute comparison of environmental sensitivity difficult. The new observations in neat cement paste did not observe transient nonlinear behaviors in the case of a microstructure that has always existed in a saturated state regardless of damage condition. Additionally, once the identical samples were damaged and dried in an ambient environment, partially saturated, the transient nonlinear slow dynamic behaviors matched the previous literature’s findings on geomaterials.
In contrast to the linear dynamic modulus test, the sequential impact test was able to distinguish a dry damaged condition with 95% confidence against any of the other condition groups studied. If a test is designed so that the moisture state of the test specimens is controlled, the sequential impact testing measurement of the transient nonlinear slow dynamic behavior can provide improved damage classification over linear testing methods. The improved damage classifications can occur because the confidence intervals for each dried condition group of the transient frequency shift are distinct, whereas the confidence intervals of the linear dynamic modulus overlap between dried damaged and naturally dried condition groups.
Solid and cracked glass block experiments
The previous results section concluded that thermal shock damage/cracks and moisture appeared as the driving forces behind the manifestation of transient nonlinear slow dynamic behaviors. To confirm these observations, we chose to investigate a linear homogeneous non-porous material, soda-lime glass, that contains different levels of damage, cracking, exposed to different ambient humidity levels. Transient slow dynamic or memory behaviors were observed in the cracked non-porous media and were highly dependent upon both ambient moistures.
The additional NSIRAS processed data suggest that the instantaneous strain-dependent components of nonlinear fast dynamic material responses were also moisture dependent. These observations have been partially confirmed in recent studies (Van Den Abeele et al., 2002; Shokouhi et al., 2017). These moisture dependent observations highlight the critical need to understand the fundamental physical mechanism behind the transient slow dynamic material behaviors. Once a physical mechanism is defined, a testing protocol for safe, reliable damage estimation can be explored.
In contrast to natural or cementitious materials, the solid glass block has a domain of simplified chemistry and elasticity. The observation of slow dynamic behaviors in the simplified glass material proposes that the transient nonlinearity is due to an interface interaction between the solid matrix and an ambient moisture vapor state in the cracks. This simplification inspired the creation of a new slow dynamics model (Bittner and Popovics, 2021) focused on granular contract without the need for direct characterization of the complex pore structures present within geomaterials such as sandstone.
Conclusion
Transient nonlinear slow dynamic material behavior is observed by sequential mechanical events that set up material conditioning. To reduce the variability in the measured behavior, the sequence, timing and energy of the impact events must be strictly controlled. In particular, impact energy is a critical factor to consider when designing an experimental procedure for extracting repeatable transient slow dynamic behaviors. In the global experiments reported here, impact energy was suitably controlled through a fast-acting computer-controlled mechanical armature called the sequential impact test device. The ambient environment temperature and moisture condition of the test sample also affect the results. Use of this impact device within a controlled environment chamber enabled the identification of critical laboratory parameters and reliable measurement of transient dynamic material behaviors. Based on these observations, we deduce that nonlinear testing must consider mechanical event energy and the environmental moisture state if repeatable tests and reliable damage detection are desired.
Paste samples from saturated pristine, saturated damaged, and naturally dried condition groups displayed no significant transient slow dynamic behaviors. On the other hand, paste samples from the dried damaged condition group displayed significant transient slow dynamic behaviors. The results suggest that both cracking discontinuities and a partially saturated void (crack) space are needed to set up observable transient slow dynamic behaviors in porous solids such as cement paste. The results from the glass block sample demonstrate that the combination of crack discontinuities and partially saturated void (crack) space are needed for significant transient and instantaneous nonlinear dynamic behaviors in non-porous solids such as glass. This crack volume and internal moisture condition, but not necessarily the base makeup and microstructure of a material, should be considered in the formulation of a physically based slow dynamics model. The results furthermore demonstrate the universality of nonlinear dynamics as long as the required crack and internal moisture conditions are met.
Data availability statement
The raw data supporting the conclusion of this article will be made available by the authors, without undue reservation.
Author contributions
JB and JP contributed to conception and design of the study. JB carried out the experiments, data analysis, and wrote the first draft of the manuscript. All authors contributed to manuscript revision, read, and approved the submitted version.
Conflict of interest
The authors declare that the research was conducted in the absence of any commercial or financial relationships that could be construed as a potential conflict of interest.
Publisher’s note
All claims expressed in this article are solely those of the authors and do not necessarily represent those of their affiliated organizations, or those of the publisher, the editors and the reviewers. Any product that may be evaluated in this article, or claim that may be made by its manufacturer, is not guaranteed or endorsed by the publisher.
References
ACI Committee 228 (2013). ACI 228.2 report on nondestructive test methods for evaluation of concrete in structures. American Concrete Institute: Farmington Hills, MI.
Aligizaki, K. K. (2006). Pore structure of cement-based materials. 1st ed. New York, NY: Taylor & Francis Group.
ASTM C215 (2014). Standard test method for fundamental transverse , longitudinal , and torsional resonant frequencies of concrete specimens. West Conshohocken, PA: ASTM International. doi:10.1520/C0215-14.2
Bentahar, M., El Aqra, H., El Guerjouma, R., Griffa, M., and Scalerandi, M. (2006). Hysteretic elasticity in damaged concrete: Quantitative analysis of slow and fast dynamics. Phys. Rev. B 73 (1), 014116. doi:10.1103/PhysRevB.73.014116
Bittner, J., and Popovics, J. (2021). Mechanistic diffusion model for slow dynamic behavior in materials. J. Mech. Phys. Solids 150 (1), 104355. doi:10.1016/j.jmps.2021.104355
Carrión, A., Genovés, V., Pérez, G., Payá, J., and Gosálbez, J. (2018). Flipped accumulative non-linear single impact resonance acoustic spectroscopy (FANSIRAS): A novel feature extraction algorithm for global damage assessment. J. Sound Vib. 432, 454–469. doi:10.1016/j.jsv.2018.06.031
Eiras, J. N., Monzó, J., Payá, J., Kundu, T., and Popovics, J. S. (2014). Non-classical nonlinear feature extraction from standard resonance vibration data for damage detection. J. Acoust. Soc. Am. 135 (2), EL82–EL87. doi:10.1121/1.4862882
Guyer, R. A., McCall, K. R., and Boitnott, G. N. (1995). Hysteresis, discrete memory, and nonlinear wave propagation in rock: A new paradigm. Phys. Rev. Lett. 74 (17), 3491–3494. doi:10.1103/PhysRevLett.74.3491
Lobkis, O. I., and Weaver, R. L. (2009). On the Larsen effect to monitor small fast changes in materials. J. Acoust. Soc. Am. 125 (4), 1894–1905. doi:10.1121/1.3081530
Mindess, S., Young, J. F., and Darwin, D. (2002). Concrete. 2nd ed. Upper Saddle River, NJ: Prentice-Hall.
Ostrovsky, L. A., and Johnson, P. A. (2001). Nonlinear dynamics of rock: Hysteretic behavior. Radiophys. Quantum Electron. 44 (5/6), 450–464. doi:10.1023/A:1017953331645
Rivière, J., Renaud, G., Guyer, R. A., and Johnson, P. A. (2013). Pump and probe waves in dynamic acousto-elasticity: Comprehensive description and comparison with nonlinear elastic theories. J. Appl. Phys. 114 (5), 054905. doi:10.1063/1.4816395
Shokouhi, P., Rivière, J., Lake, C. R., Le Bas, P. Y., and Ulrich, T. J. (2017). Dynamic acousto-elastic testing of concrete with a coda-wave probe: Comparison with standard linear and nonlinear ultrasonic techniques. Ultrasonics 81, 59–65. doi:10.1016/j.ultras.2017.05.010
Snieder, R., Sens-Schönfelder, C., and Wu, R. (2017). The time dependence of rock healing as a universal relaxation process, a tutorial. Geophys. J. Int. 208 (1), 1–9. doi:10.1093/gji/ggw377
Somaratna, J. (2014). Evaluation of linear and nonlinear vibration methods to characterize induced microstructural damage in portland cement-based materials. Masters Thesis. Urbana, IL: University of Illinois at Champaign/Urbana. Retrieved from: http://hdl.handle.net/2142/50670
Ten Cate, J. A., Smith, E., Byers, L., and Shankland, T. (2000a). Slow dynamics experiments in solids with nonlinear mesoscopic elasticity. AIP Conf. Proc. 306, 303–306. doi:10.1063/1.1309228
Ten Cate, J. A., Smith, E., and Guyer, R. A. (2000b). Universal slow dynamics in granular solids. Phys. Rev. Lett. 85 (5), 1020–1023. doi:10.1103/PhysRevLett.85.1020
Ten Cate, J., Duran, J., and Shankland, T. (2002). “Nonlinearity and slow dynamics in rocks : Response to changes of temperature and humidity,” in Nonlinear acoustics at the beginning of the 21st century. Editors O. V. Rudenko,, and O. A. Sapozhnikov (Moscow State University), 2, 767–770.
Ten Cate, J. A., Pasqualini, D., Habib, S., Heitmann, K., Higdon, D., and Johnson, P. A. (2004). Nonlinear and nonequilibrium dynamics in geomaterials. Phys. Rev. Lett. 93 (6), 065501–065507. doi:10.1103/PhysRevLett.93.065501
Ten Cate, J. A., Malcolm, A. E., Feng, X., and Fehler, M. C. (2016). The effect of crack orientation on the nonlinear interaction of a P-wave with an S-wave. Geophys. Res. Lett. 43, 6146–6152. doi:10.1002/2016GL069219
Ten Cate, J. A. (2011). Slow dynamics of earth materials: An experimental overview. Pure Appl. Geophys. 168 (12), 2211–2219. doi:10.1007/s00024-011-0268-4
Van Den Abeele, K. E. A., and Visscher, J. De (2000). Damage assessment in reinforced concrete using spectral and temporal nonlinear vibration techniques. Cem. Concr. Res. 30 (9), 1453–1464. doi:10.1016/S0008-8846(00)00329-X
Van Den Abeele, K. E. A., Carmeliet, J., Ten Cate, J., and Johnson, P. (2000). Nonlinear elastic wave spectroscopy (NEWS) techniques to discern material damage, Part II: Single-mode nonlinear resonance acoustic spectroscopy. Res. Nondestruct. Eval. 12 (1), 31–42. doi:10.1080/09349840008968160
Keywords: nondestructive, impact, cement, glass, damage, slow dynamics, nonlinear vibration
Citation: Bittner JA and Popovics JS (2022) Transient nonlinear vibration characterization of building materials in sequential impact scale experiments. Front. Built Environ. 8:949484. doi: 10.3389/fbuil.2022.949484
Received: 21 May 2022; Accepted: 21 September 2022;
Published: 12 October 2022.
Edited by:
Ninel Alver, Ege University, TurkeyReviewed by:
Kentaro ohno, Tokyo Metropolitan University, JapanErnst Niederleithinger, Federal Institute for Materials Research and Testing (BAM), Germany
Copyright © 2022 Bittner and Popovics. This is an open-access article distributed under the terms of the Creative Commons Attribution License (CC BY). The use, distribution or reproduction in other forums is permitted, provided the original author(s) and the copyright owner(s) are credited and that the original publication in this journal is cited, in accordance with accepted academic practice. No use, distribution or reproduction is permitted which does not comply with these terms.
*Correspondence: James A. Bittner, amJpdHRuZXJAbXR1LmVkdQ==