 Didem Ozevin1*
 Seth Kessler2
- 1Civil, Materials and Environmental Engineering (CME), University of Illinois at Chicago, Chicago, IL, United States
- 2Metis Design Corporation, Boston, MA, United States
Fatigue cracks are a major concern for aging metallic structures, as they can cause unexpected catastrophic failure. They often occur on hidden surfaces, e.g., under paint and rust or on the interface between two structural layers, which makes visual detection difficult. Acoustic Emission (AE) is a passive nondestructive evaluation (NDE) method that measures the initiation and progression of defects when a structure is continuously monitored. While using this method, which has been successfully applied to monolithic and composite structures, the fatigue life is related to the cumulative AE count. However, if the method is applied after the fatigue crack is initiated, the relationship between the fatigue life and the cumulative AE count may not be applicable. In this paper, the dependence of AE behavior on the prior fatigue loading history is studied using modified compact tension specimens. The cumulative AE count, AE correlation plots, and waveform characteristics are shown to be dependent on loading conditions in addition to the coupling state. Relative behaviors between AE sensors and trends in the cumulative AE count are illustrated by two AE characteristics that are shown as being independent of prior loading history and coupling discontinuities.
1 Introduction
Acoustic emissions are elastic waves propagating due to the release of energy by the formation of inelastic deformation. The Acoustic Emission (AE) method has been utilized to detect fatigue cracks in metallic structures since the 1970s. Initial studies were based on correlating AE count with fatigue cycles, however recent studies concentrate on identifying unique AE signatures by utilizing numerical models or additional in-situ supplementary measurements, such as Digital Image Correlation and infrared thermography (Alam et al., 2014; Vanniamparambil et al., 2015). In addition to the parametric correlation of AE data with fatigue crack, waveform-based analyses have recently gained more attention (Bhuiyan and Giurgiutiu, 2017). However, the complexity of the AE measurement chain prevents the generalization of the AE correlation with fatigue crack from one laboratory condition to another. The major variables that influence AE data for the same source function and the same sensor-source distance are sensor type and data acquisition setting. Bhuiyan et al. (2017) showed the influence of sensor type: different frequency responses of AE sensors significantly influence the characteristics of AE signals (e.g., frequency content, amplitude, energy, duration, rise time). The major data acquisition variables are threshold, analog filter selected, timing variables that control the initiation and end of AE signal, and sampling rate. The major fatigue crack-related AE sources are crack jump, plastic deformation, crack rubbing and crack closure (Vanniamparambil et al., 2015). AE features are correlated to capture crack initiation, plastic deformation, and micro crack formation. The source function depends on the presence of inclusions in metal, material strength, and load rate (Gagar et al., 2015). Essentially, source characterization and waveform analysis of received signals is performed to further interpret the received signals and distinguish primary AE sources. Deep learning approaches and probabilistic frameworks have been proposed to leverage the reflection and reverberation patterns of AE waveforms to localize AE sources using a single sensor (Ebrahimkhanlou and Salamone, 2017).
A challenge of the AE method is the influence of secondary sources unrelated to crack growth that interferes with primary AE signals. For instance, friction released from loading fixtures and pins in a fatigue testing machine releases noise with frequency and amplitude like damage-related AE signals, which complicates the filtering procedure (Sauerbrunn et al., 2017). While post-test filters are typically applied to clean the data set from the friction-related signals, Yang et al. (2003) showed that friction signals have a wide spectral range. Therefore, friction emissions should be suppressed to prevent them from entering the AE data set to build a better correlation between AE characteristics and fatigue crack. Pre-processing attempts have been also reported in the literature to minimize the effect of background noise, such as employing mechanical dampers, and AE localization techniques to select the signals from the region of interest (Chen and Choi, 2004; Zarate et al., 2012). Another challenge is the dependence of AE behavior on the prior loading history. Unless the AE data is recorded from the beginning of service life of a structure, its prior loading history can modify the AE behavior collected from the field as compared to the laboratory measurement. Such dependence limits the applicability of laboratory-based AE theories to realistic structures which are already exposed to fatigue. While the influence of prior loading history to the AE behavior is known in the literature, there is no explicit study to demonstrate its effect on the AE features to the best knowledge of the authors.
In this paper, AE data is recorded from compact tension specimens fatigued with constant amplitude. The fatigue frequency, load range, AE sensors and positions, and data acquisition setting are held constant while the start of AE monitoring is varied. The AE data is recorded before and after the fatigue crack initiates to study the influence of prior loading history. First, typical AE features of fatigue crack monitoring are described in Section 2. The experimental design of fatigue testing, AE measurement, and in situ crack monitoring with the optical camera is presented in Section 3. The experimental results of existing AE features and new behavior are discussed in Section 4. The discussion and the conclusions of this study are presented in Section 5.
2 AE features of fatigue crack monitoring
Transient waves are represented by various time-dependent and frequency-dependent features. The relationship between AE count and fatigue life is demonstrated in the literature (Baram, 1984; Kumar et al., 2016; Barat et al., 2019; Shiraiwa et al., 2020). The typical empirical relationship between the stress intensity factor
where
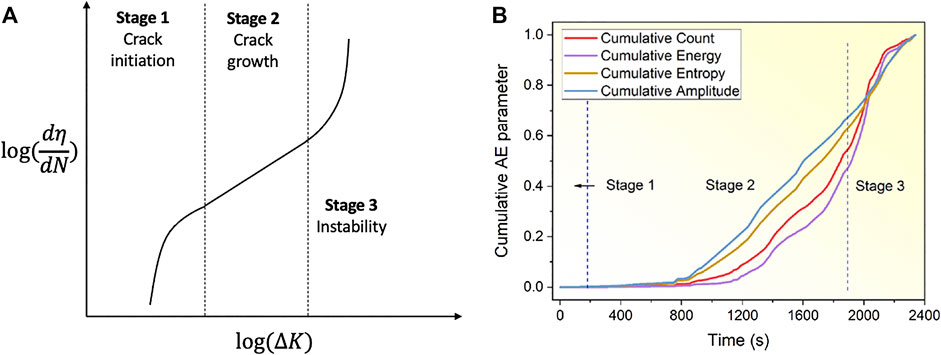
FIGURE 1. AE behavior with fatigue life, (A) three stages of fatigue life and (B) cumulative AE parameter published at (Chai et al., 2022).
The intensity of elastic waves due to the formation of new damage is related to the crack velocity. Structural steel is generally ductile and causes the release of low-energy acoustic emissions (Hamstad and McColskey, 1998). Various studies in the past relied on parametric-based AE analysis such as count and amplitude in order to show the relationship between the AE data and stress intensity factor (Blanchette et al., 1986). Additionally, correlations are highly specific to materials, geometry, and loading rate (Holford et al., 2001). Recently, AE entropy is introduced as a feature to track the fatigue states, defined as the disorder of the probability of amplitude distribution of each AE waveform (Tanvir et al., 2018; Chai et al., 2022). This calculation requires recording all AE waveforms, which can cause large data sets for a long duration of fatigue testing. The approach is applicable only if a couple of thousand fatigue cycles are recorded. Data size becomes significant if all the waveforms are recorded from a specimen exposed to more than ten thousand fatigue cycles. It is also questionable if this feature is applicable for the cases where AE monitoring is started when fatigue crack is already in stage 2. The count rate is another AE feature studied to understand the transition from stage 1 to stage 2. Babu et al. (2021) showed that there is a peak in the AE count rate curve in the transition region from stage 1 to stage 2. Similar to cumulative count behavior, this AE feature requires prior knowledge of AE loading history to detect the transition stage. AE waveforms and amplitudes are also correlated with the fatigue mechanisms. For example, higher amplitude AE is correlated with higher stress intensity factors (Babu et al., 2016). In this paper, cumulative AE count, amplitude histograms, waveform characteristics, and correlation plots are investigated for the repeatable measurement of fatigue crack using the AE method.
3 Experimental design
A modified version of the ASTM E647 (ASTM International, 2015) compact tension specimen made of A36 steel was designed and manufactured as shown in Figure 2. The geometry is selected similar to Zhang et al. (Zhang et al., 2017) to represent the key geometric features of a helicopter gearbox. The stress intensity factor for compact tension specimen is calculated as
where
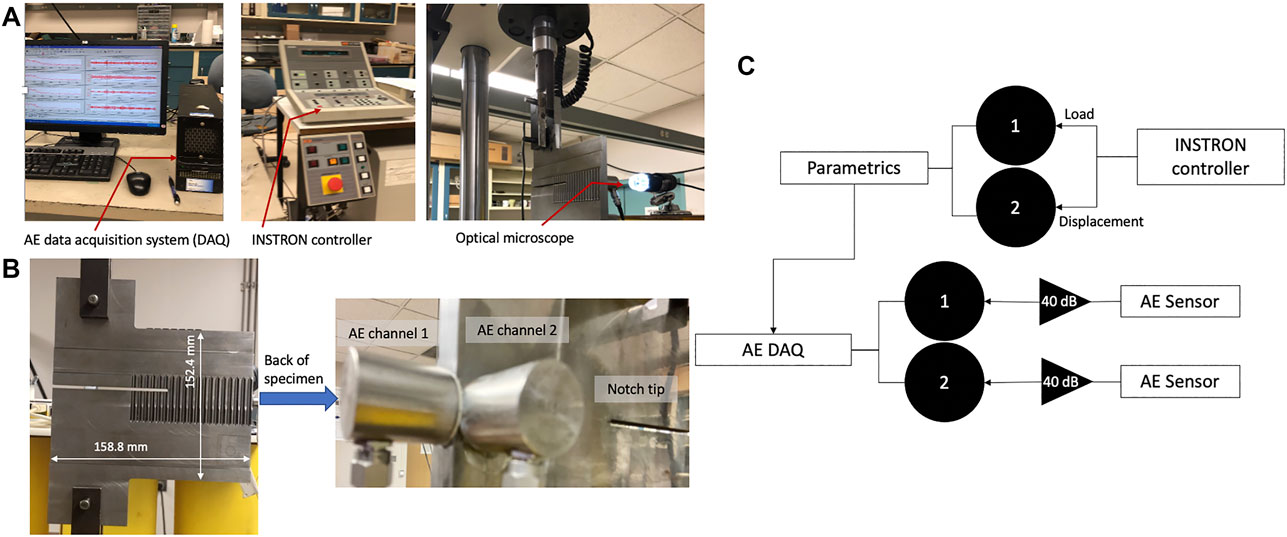
FIGURE 2. Experimental setup, (A) equipment, (B) specimen and AE sensor positions and (C) block diagram of experimental components.
The fatigue loading frequency was selected as 4 Hz for the Instron 8,500 servo-hydraulic fatigue testing machine. Table 1 presents the fatigue loading, the final crack length, and the approximate crack growth rate of the specimens. CT-1 was tested for up to 20,000 fatigue cycles, removed from the loading fixture, and then continued testing up to 30,000 fatigue cycles after a few days. CT-2 was tested continuously up to 30,000 cycles. CT-3 was tested for up to 11,000 fatigue cycles, removed from the loading fixture, and then continued testing up to 22,000 fatigue cycles after 1 day break. Each specimen was loaded 1,000 cycles and then unloaded for ultrasonic measurement (the results for which are not included in this paper). In general, the crack growth behavior was similar between specimens. An optical image was collected every 1,000 cycles while holding at a load of 6.5 kN and processed using the MATLAB Image Processing Toolbox to measure the crack length with respect to the notch tip. The average crack growth rate based on interpolation from optical data was
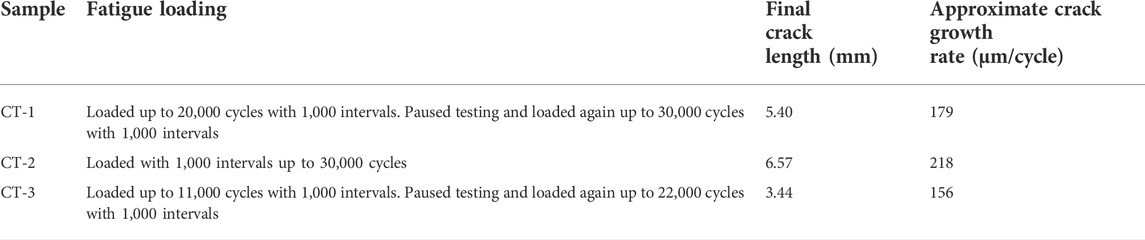
TABLE 1. Fatigue testing characteristics of three samples.
Each specimen was instrumented with two R15 AE sensors (R represents resonance, 15 represents peak resonance near 150 kHz), manufactured by MISTRAS Group Inc. They were coupled using adhesive and positioned parallel and perpendicular to the notch tip as shown in Figure 2B. Data was recorded using a PCI-8 data acquisition system manufactured by the same company. The hardware and software variables were 40 dB pre-amplifier, 100–400 kHz frequency filter, 3 MHz sampling rate, and default timing variables. Load and displacement values were recorded as parametric inputs from INSTRON loading machine as shown in the block diagram, Figure 2C. The hit-driven AE features of amplitude, energy, count, duration, rise time, peak frequency, and frequency centroid were collected in addition to the time-driven AE features of average signal level (ASL), absolute energy, and the parametric variables of load and displacement. The threshold was started at 60 dB, however, significant friction signals were observed initially and thus were increased to 67 dB. The threshold was kept the same for AE channel 1 for both CT-1 and CT-2, however, the AE hit durations of channel 2 reached to cover the entire peak load cycle after a certain number of fatigue cycles (discussed in more detail below), and thus its threshold was increased to 70 dB to prevent saturation. The threshold was set to 65 dB for CT-3 to demonstrate the influence of the threshold on the absolute AE features. The AE data was recorded after the fatigue crack was initiated for CT-1 (after 20,000 cycles) and CT-3 (after 11,000 cycles), while it was recorded from the beginning of fatigue loading for CT-2. The comparison of the three specimens provides the contribution of prior loading history to the AE behavior and feature characteristics.
3 Experimental results
3.1 Influences of structural geometry, sensor position, and coupling
AE sensor responses were recorded using pencil lead break (PLB) simulations before fatigue testing commenced. The PLB simulations were conducted at the notch tip using a 0.7 mm pencil with approximately a 30o angle. Figure 3 and Figure 4 show the time histories and frequency spectra of channels 1 and 2 for CT-1 and CT-2 as examples. Similar waveforms were obtained from CT-3. Channel 1 and channel 2 were positioned perpendicular and parallel to the wave propagation direction, respectively. As the specimens have complex geometric features, such as splines and varying cross-section thickness, multiple wave modes are triggered with the PLB simulations, which resulted in complex and long-duration AE waveforms without a clear decay time. Multiple reflections cause a train of burst signals recorded as a single AE signal. The amplitude differences are attributed to the coupling variations and the force introduced by the PLB simulation.
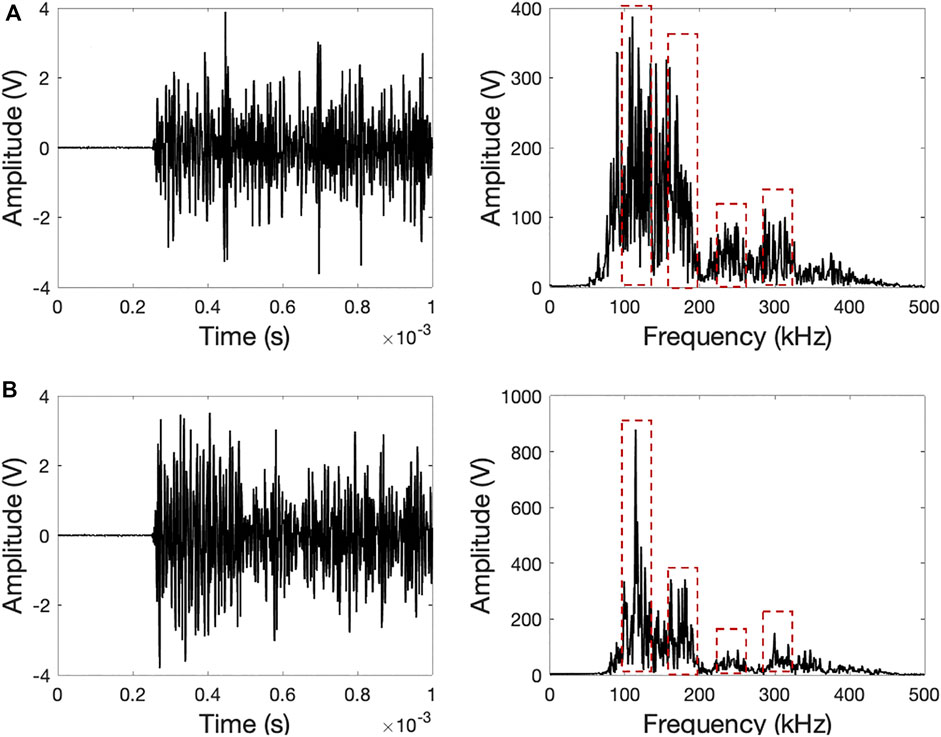
FIGURE 3. Pencil lead break waveforms and their frequency spectra of CT-1 (A) channel 1 and (B) channel 2.
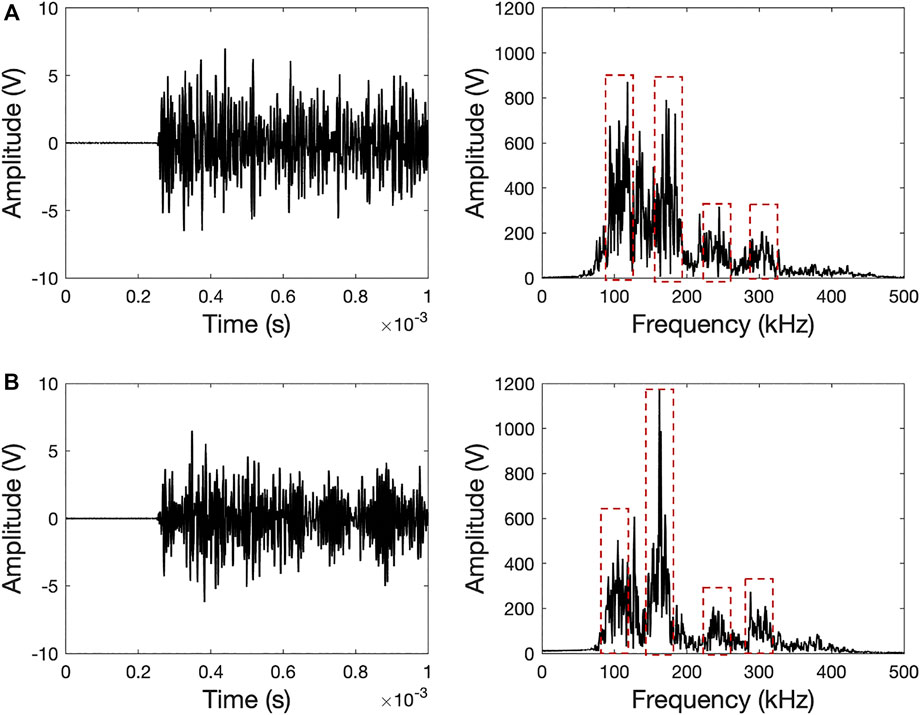
FIGURE 4. Pencil lead break waveforms and their frequency spectra of CT-2 (A) channel 1 and (B) channel 2.
The frequency spectra of two sensors have similar bandwidths as highlighted with red dashed rectangles in Figure 3 and Figure 4. However, they have different magnitudes, and slight shifts in the frequency peaks are observed. For instance, channel 2 has four major peak frequencies near 115, 175, 200, and 300 kHz with the peak amplitude at 175 kHz for CT-1. The frequency band centroids shift to 105, 160, 240, and 300 kHz with the peak amplitude at 160 kHz for CT-2. The sensor transfer function, its interaction with structure, the coupling state, and the sensor-source orientation are the factors that control the output frequency spectra. It is expected that the sensor response due to waves released by the fatigue crack growth is influenced by the sensor frequency spectrum due to the resonant behavior of the sensors selected.
3.2 History of cumulative AE count
Cumulative AE count has been demonstrated as a good indicator to understand the fatigue life of metallic structures in the literature. In this study, CT-1 was monitored with AE sensors after the fatigue crack was already passed the initiation stage. CT-2 was monitored entirely with the AE sensors from 0 fatigue cycles to 30,000 fatigue cycles. CT-3 was monitored between the fatigue crack initiation and growth. As the threshold of channel 2 varied due to the duration saturation, the cumulative AE count of channel 1 is studied in this section.
Figure 5 shows the cumulative AE counts with respect to fatigue cycles. The red circles provide optically measured crack lengths. The optical images at the final fatigue cycle are shown for each specimen. The cumulative AE count behavior of CT-2 is similar to the ones reported in the literature. A slow linear increase in the AE count occurs at the crack initiation stage. Then, an exponential increase follows at the transition of crack initiation and growth stages. Two statistical relationships occur: 1) linear behavior in stage 1 of fatigue life and 2) exponential behavior in stage 2 of fatigue life.
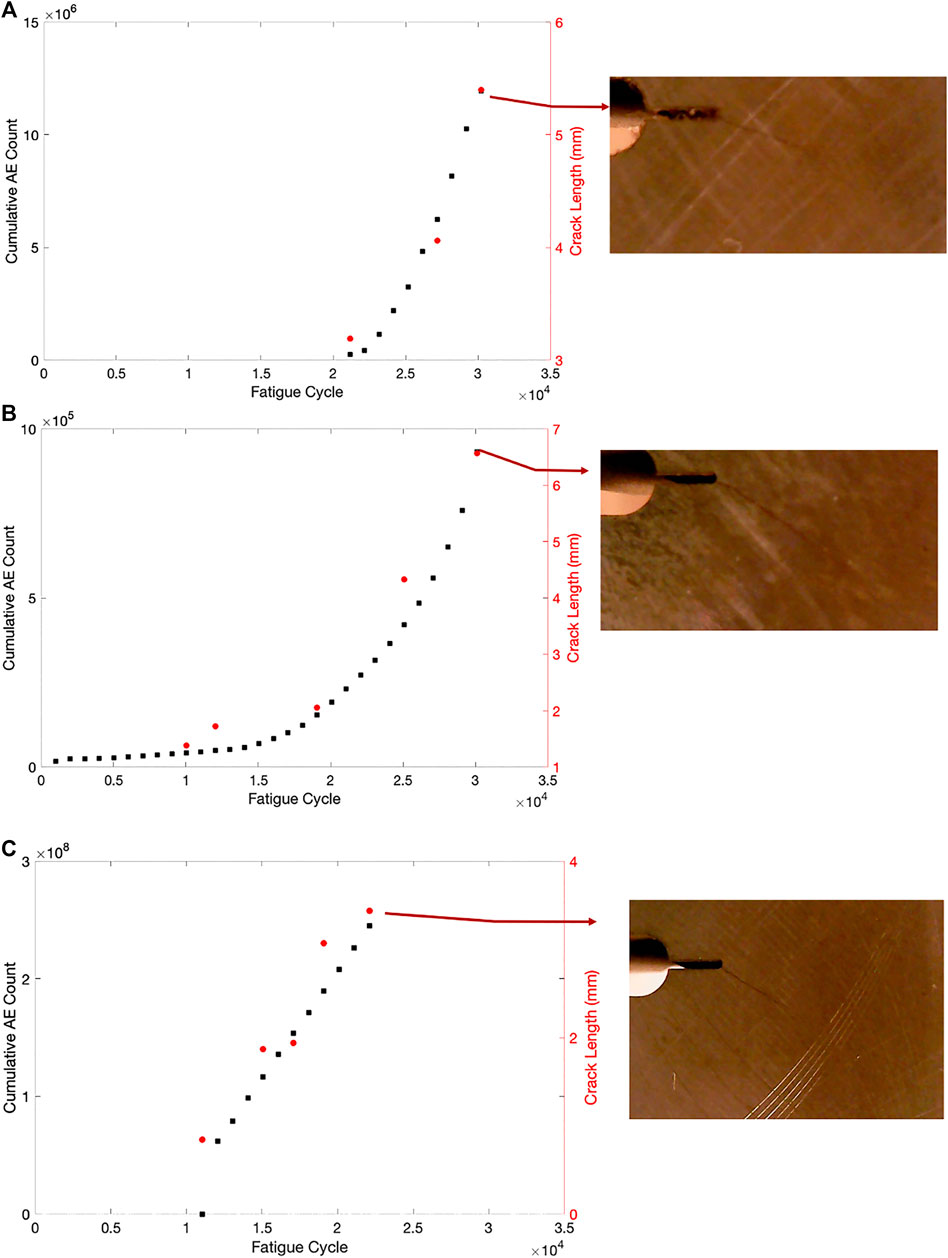
FIGURE 5. The cumulative AE counts of channel 1, (A) CT-1, (B) CT-2 and (C) CT-3.
As CT-1 and CT-3 were monitored with AE sensors after the samples were exposed to a certain number of fatigue cycles, the initial phase of cumulative AE count was not recorded. For CT-1, the cumulative AE count indicates an exponential increase as the fatigue crack is already in stage 2. When an exponential curve fit is applied to both data (for CT-1, the initial fatigue cycle is set as 20,000 as it is known in this study) as
The cumulative AE count of CT-3 is linear with respect to the fatigue cycle. This sample was monitored with AE sensors between the transition of stage 1 and stage 2 in the fatigue life. The results agree with the statistical linear relationship between fatigue cycle and cumulative AE count when the fatigue behavior is within the crack initiation phase. As the threshold was set 2 dB lower than CT-1 and CT-2, the absolute count value is significantly higher than those samples. The absolute AE features are controlled by the threshold in addition to geometry and sensor types, which are the main obstacles to developing a generalized approach using the feature-based analysis. However, the statistical behavior of AE features and their normalized properties (this may be performed relative to the sensors as absolute values to normalize may not be known prior) can be developed to generalize the relationship between the AE behavior and the fatigue crack. Observing the cumulative AE count behavior as linear or exponential can aid in defining the stage of fatigue life.
3.2 AE feature variability
AE amplitude is an important indicator of the AE source in addition to other AE features such as count, energy, and duration. Figure 6 shows the amplitude histograms of CT-1 and CT-2 for three fatigue cycle intervals. CT-1 has a higher number of hits, and the histogram is skewed towards higher amplitudes. This also explains why the cumulative AE count of CT-1 shown in Figure 5A is ten times more than CT-2 while only ten fatigue cycle intervals are recorded. All the AE amplitudes of CT-2 are bounded between 67–70 dB. The only difference between the two specimens is that CT-1 was rested for a few days after to the initial 20,000 fatigue cycles. This may have altered the stress intensity factor leading to higher amplitude AE signals.
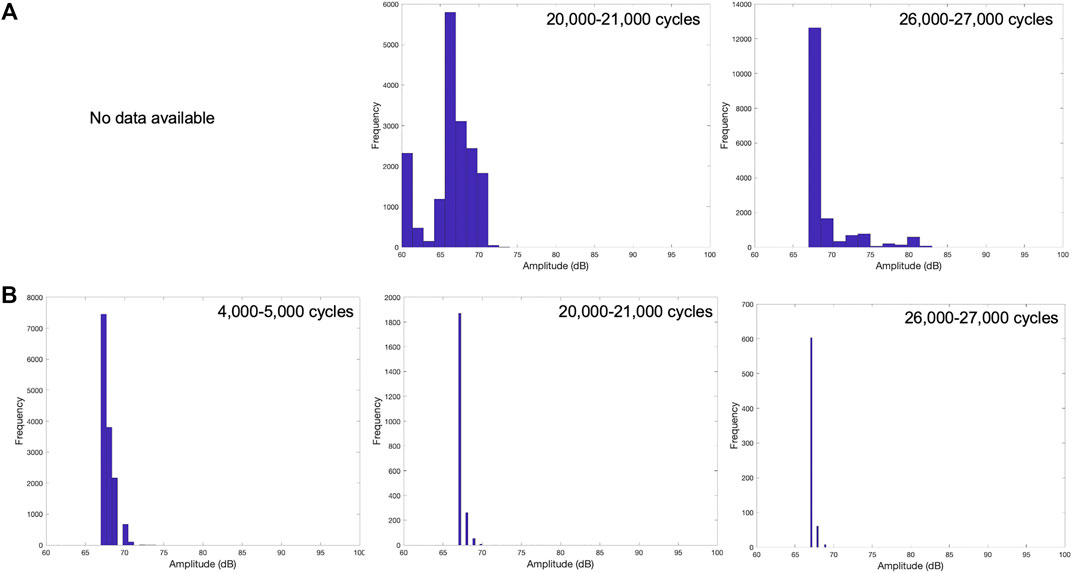
FIGURE 6. Examples of amplitude histograms of channel 1 at three different fatigue cycles recorded from (A) CT-1 and (B) CT-2.
The comparison of the 80 dB amplitude signal recorded from CT-1 (Figure 7) and the 68 dB amplitude signal (Figure 8) recorded from CT-2 reveals that higher amplitude signals are burst-type, and the signals right above the threshold are continuous-type. All the waveforms observed from CT-2 are continuous-type, with no discernable arrival, rise, or decay time. The same behavior was observed from CT-3. As shown in the PLB simulations, the specimen geometry yields complex wave modes that influence the AE signals recorded by the fatigue crack growth. The plastic deformation is characterized as a continuous-type AE signal, which is also observed in this study. In general, the peak frequencies of AE signals obtained from the fatigue testing are comparable to the PLB simulations. Therefore, they depend on the experimental variables in addition to the source function. The continuous-type signal has a dominant frequency near 155 kHz, which coincides with the expected peak frequency of the R15 sensor. AE source localization using conventional triangulation and threshold-based time of arrival determination becomes questionable when the AE signals are continuous-type in thick steel plates.
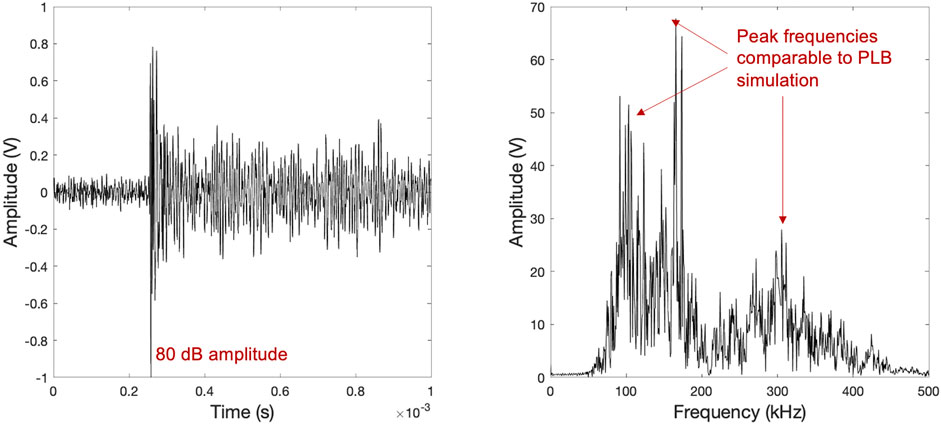
FIGURE 7. Burst-type AE signal detected from CT-1. Channel 1 signal recorded between 25,000 and 26,000 fatigue cycles.
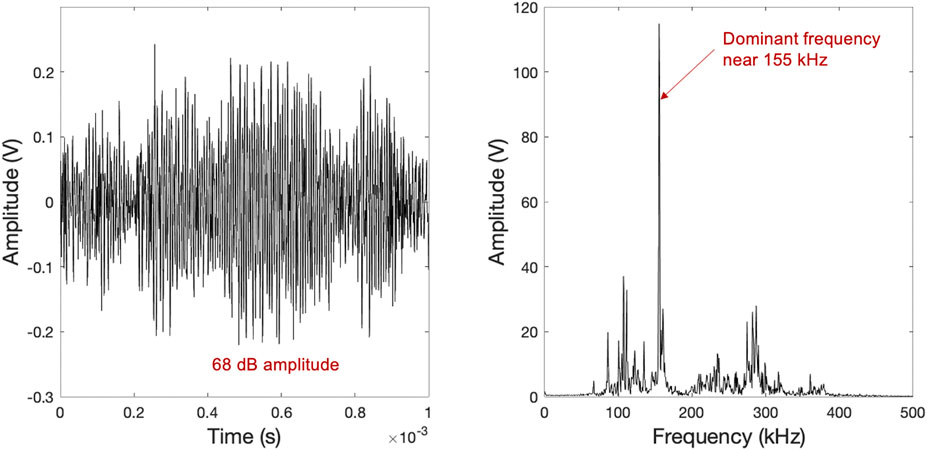
FIGURE 8. Continuous-type AE signal detected from CT-2. Channel 1 signal recorded between 25,000-26,000 fatigue cycles. Similar waveforms were detected from CT-3.
To generalize the individual waveform behavior, correlation plots are generated in Figure 9 and Figure 10 for two samples and channels. A cluster of high amplitude/short duration AE hits (cluster 1) appears at the later loading stage of CT-1. Two other clusters of low amplitude/high duration (cluster 2) and low amplitude/low duration (cluster 3) appear almost in all loading stages. The peak frequencies are similar to those observed in the pencil lead break simulations. Cluster 1 does not appear in the data of channel 1 for CT-2 testing. The number of AE hits detected by channel 1 is low. It is observed that similar correlation behavior is observed if channels have a similar hit rate. The correlation plots are controlled by the threshold, prior loading history, and hit rate. If the threshold is reduced, the hit rate increases, and cluster 2 starts to appear. The correlation plots depend on the threshold and hit rate in addition to the characteristics of AE sources. It is observed that the fatigue crack growth of relatively thick mild steel releases low amplitude and continuous type AE signals. CT-3 also exhibits only clusters 2 and 3 as this sample was in the transition stage of fatigue crack initiation and growth.
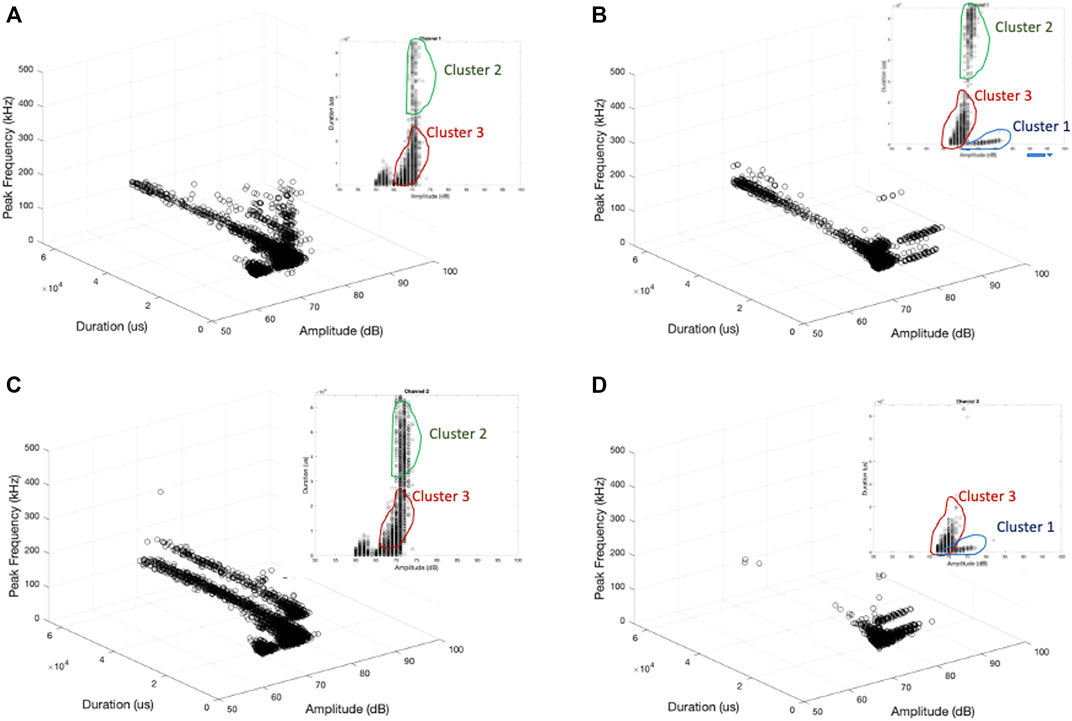
FIGURE 9. Amplitude-duration-peak frequency relationship of CT-1, (A) channel 1, 20,000–21,000 cycles, (B) channel 1, 24,000–25,000 cycles, (C) channel 2, 20,000–21,000 cycles, (D) channel 2, 24,000–25,000 cycles.
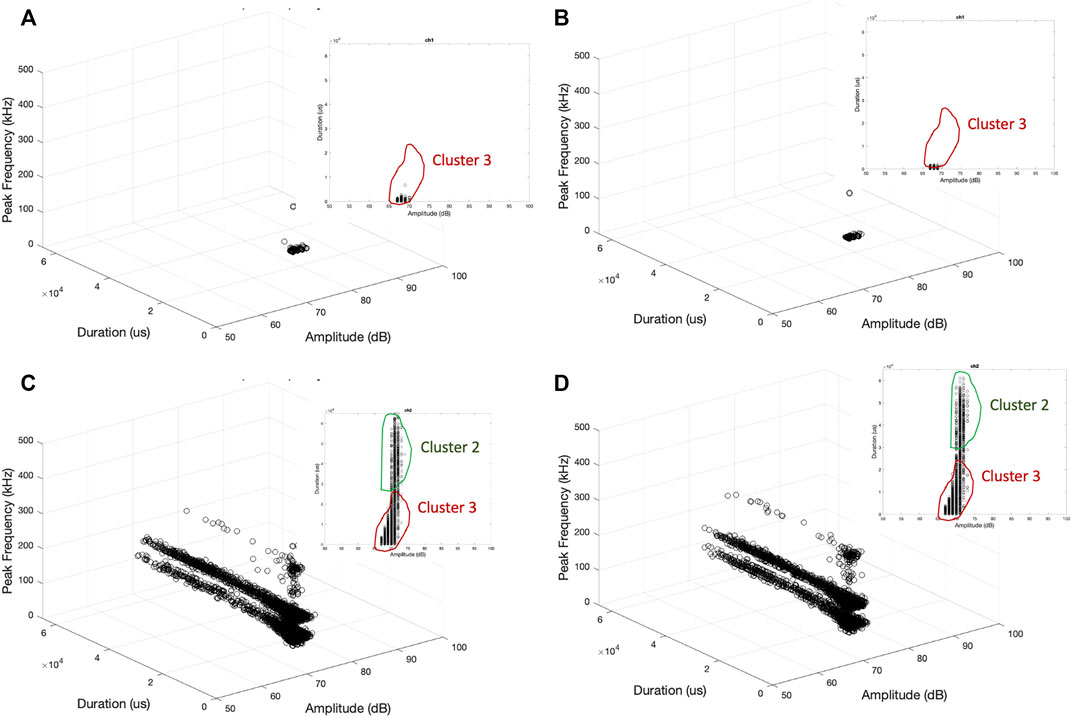
FIGURE 10. Amplitude-duration-peak frequency relationship of CT-2, (A) channel 1, 20,000–21,000 cycles, (B) channel 1, 24,000–25,000 cycles, (C) channel 2, 20,000–21,000 cycles, (D) channel 2, 24,000–25,000 cycles.
The reduction in the hit rate is attributed to the degradation in the coupling state as a similar behavior is expected from two sensors positioned nearby. Once a low hit rate was observed by one sensor, it was recoupled between fatigue cycles, and the hit rate leveled back similar to the other sensor. This indicates the importance of redundant AE measurement from a given point to detect the coupling issue at its earliest state.
As discussed above, the waveforms obtained from the PLB simulations indicate complex behavior without a clear wave rise and decay. As shown in the duration-amplitude correlation plots, there is a cluster of long-duration AE hits. In some cases, the durations are so long that it covers the entire load cycle. Figure 11 shows four load cycles and AE durations within these cycles recorded by channel 1 and from CT-3. The AE hit at the load rise has a duration of 110 ms, which covers the entire load peak and decay times. If the peak load filter was applied, these hits would be filtered. Therefore, tracking the duration of AE hits before applying the load filter is important to ensure not to filter out a long duration signal including the time of peak load. The features of such long-duration AE hits are similar to the waveform streaming approach to recording the signal representing the entire load cycle. However, AE features such as rise time, decay time, duration become insignificant for continuous type signals.
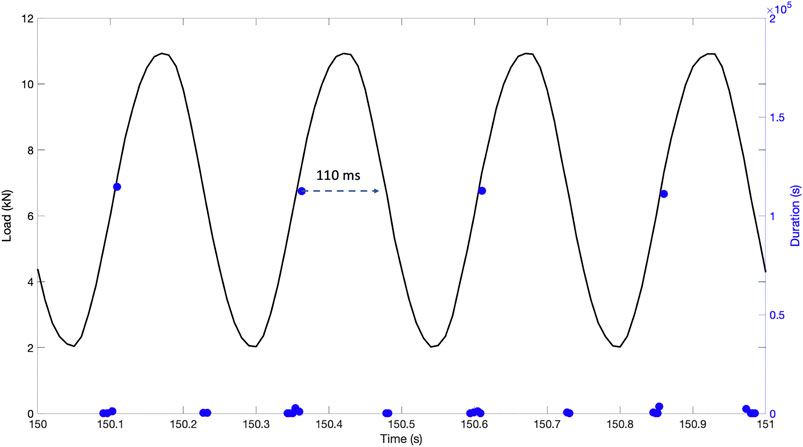
FIGURE 11. Four load cycles (black solid lines) and AE durations (blue circles) indicate that long-duration AE waveforms span the entire load cycle.
4 Discussion and conclusion
Monitoring of structures subject to long-duration fatigue loading using the AE method causes challenges of high hit-rate, duration saturation, and coupling issues. Having redundant AE sensors placed in close proximity to monitor fatigue crack allows detecting the coupling failure as it occurs in long-duration fatigue testing. High hit-rate limits the ability to record all AE waveforms, as it generates a massive amount of data and its processing takes a significant amount of time. Duration saturation means recording single AE hit for the major part of load cycle. This leads to collecting individual AE hits as a single AE hit that affects all AE features, especially cumulative AE hits. The variation of one experimental variable, such as threshold, completely changes the absolute values of AE features. Additionally, the AE signals as burst or continuous are influenced by the structural geometry. In this study, most AE signals are continuous type without any discernable arrival time. This is due to a specimen geometry with complex wave modes, the speed of fatigue crack growth rate, and the materials composition. Increasing the threshold is a solution to prevent the duration saturation, however, a high threshold reduces the resolution and limits the allowable dynamic range. In this study, the threshold of 67 dB allows the dynamic range of 67–99 dB. This may be acceptable as the specimens were small, however, for larger structures, such a high threshold limits the distance between the source and the AE signal.
The cumulative count behavior due to fatigue loading is consistent with the literature (linear then exponential increase) if the threshold and the sensor coupling state are consistent throughout the measurement and the AE data is recorded from the beginning of fatigue loading. However, such behavior deviates if AE data is recorded after the sample is exposed to fatigue loading. Statistical behavior or normalized characteristics of AE features can reduce the bias introduced by experimental variables. For fatigue characterization, observing the cumulative AE count behavior as linear or exponential can be selected in defining the stage of fatigue life.
Data availability statement
The raw data supporting the conclusions of this article will be made available by the authors, without undue reservation.
Author contributions
DO performed experiments, processed data, and wrote the first draft. SK helped with the design of the fatigue specimen and edited the manuscript.
Funding
This material is based upon work supported by the Naval Air Warfare Center under Contract No. N68335-20-C-0858, “Ultrasonic Measurement System for Gearbox Components” awarded to the Metis Design Corporation.
Acknowledgments
The support from the sponsoring organization is gratefully acknowledged. Any opinions, findings, conclusions, or recommendations expressed in this material are those of the authors and do not necessarily reflect the views of the sponsor.
Conflict of interests
SK is employed by Metis Design Corporation.
The remaining authors declare that the research was conducted in the absence of any commercial or financial relationships that could be construed as a potential conflict of interest.
Publisher’s note
All claims expressed in this article are solely those of the authors and do not necessarily represent those of their affiliated organizations, or those of the publisher, the editors and the reviewers. Any product that may be evaluated in this article, or claim that may be made by its manufacturer, is not guaranteed or endorsed by the publisher.
References
Alam, S. Y., Saliba, J., and Loukili, A. (2014). Fracture examination in concrete through combined digital image correlation and acoustic emission techniques. Constr. Build. Mater. 69, 232–242. doi:10.1016/j.conbuildmat.2014.07.044
ASTM International (2015). ASTM E647-15e1, Standard Test Method for Measurement of Fatigue Crack Growth Rates. West Conshohocken, PA: ASTM International.
Babu, M. N., Mukhopadhyay, C., Sasikala, G., Albert, S. K., Bhaduri, A., Jayakumar, T., et al. (2016). Study of fatigue crack growth in RAFM steel using acoustic emission technique. J. Constr. steel Res. 126, 107–116. doi:10.1016/j.jcsr.2016.07.007
Babu, M. N., Mukhopadhyay, C. K., and Sasikala, G. (2021). High-temperature fatigue crack growth study of P91 steel using acoustic emission. JOM (1989) 73 (12), 3950–3958. doi:10.1007/s11837-021-04879-5
Baram, J. (1984). Improved fatigue-life prediction by acoustic emission. Eng. Fract. Mech. 19 (1), 181–185. doi:10.1016/0013-7944(84)90077-8
Barat, V., Marchenkov, A., and Elizarov, S. (2019). Estimation of fatigue crack AE emissivity based on the palmer–heald model. Appl. Sci. 9 (22), 4851. doi:10.3390/app9224851
Bhuiyan, M. Y., and Giurgiutiu, V. (2017). The signatures of acoustic emission waveforms from fatigue crack advancing in thin metallic plates. Smart Mat. Struct. 27 (1), 015019. doi:10.1088/1361-665x/aa9bc2
Bhuiyan, M. Y., Lin, B., and Giurgiutiu, V. (2017). Acoustic emission sensor effect and waveform evolution during fatigue crack growth in thin metallic plate. J. Intelligent Material Syst. Struct. 29, 1275–1284. doi:10.1177/1045389x17730930
Blanchette, Y., Dickson, J. I., and Bassim, M. N. (1986). Acoustic emission behaviour during crack growth of 7075-T651 Al alloy. Eng. Fract. Mech. 25 (5), 647–656. doi:10.1016/0013-7944(86)90240-7
Chai, M., Hou, X., Zhang, Z., and Duan, Q. (2022). Identification and prediction of fatigue crack growth under different stress ratios using acoustic emission data. Int. J. fatigue 160, 106860. doi:10.1016/j.ijfatigue.2022.106860
Chai, M., Zhang, Z., Duan, Q., and Song, Y. (2018). Assessment of fatigue crack growth in 316LN stainless steel based on acoustic emission entropy. Int. J. fatigue 109, 145–156. doi:10.1016/j.ijfatigue.2017.12.017
Chen, H.-L. R., and Choi, J.-H. (2004). Acoustic emission study of fatigue cracks in materials used for avlb. J. Nondestr. Eval. 23 (4), 133–151. doi:10.1007/s10921-004-0820-6
Ebrahimkhanlou, A., and Salamone, S. (2017). A probabilistic framework for singlesensor acoustic emission source localization in thin metallic plates. Smart Mat. Struct. 26 (9), 095026. doi:10.1088/1361-665x/aa78de
Gagar, D., Foote, P., and Irving, P. (2015). Effects of loading and sample geometry on acoustic emission generation during fatigue crack growth: Implications for structural health monitoring. Int. J. Fatigue 81, 117–127. doi:10.1016/j.ijfatigue.2015.07.024
Hamstad, M. A., and McColskey, J. D. (1998). Detectability of slow crack growth in bridge steels by acoustic emission. Boulder, United States: National Institute of Standards and Technology.
Holford, K. M., Davies, A. W., Pullin, R., and Carter, D. C. (2001). Damage location in steel bridges by acoustic emission. J. Intelligent Mater. Syst. Struct. 12, 567–576. doi:10.1177/10453890122145311
Kumar, J., Ahmad, S., Mukhopadhyay, C. K., Jayakumar, T., and Kumar, V. (2016). Acoustic emission studies for characterization of fatigue crack growth behavior in HSLA steel. Nondestruct. Test. Eval. 31 (1), 77–96. doi:10.1080/10589759.2015.1070850
Sauerbrunn, C. M., Kahirdeh, A., Yun, H., and Modarres, M. (2017). Damage assessment using information entropy of individual acoustic emission waveforms during cyclic fatigue loading. Appl. Sci. 7 (6), 562. doi:10.3390/app7060562
Seitl, S., Pokorny, P., Miarka, P., Klusak, J., Kala, Z., and Kunz, L. (2020). Comparison of fatigue crack propagation behaviour in two steel grades S235, S355 and a steel from old crane way. MATEC Web Conf. 310, 00034. doi:10.1051/matecconf/202031000034
Shiraiwa, T., Takahashi, H., and Enoki, M. (2020). Acoustic emission analysis during fatigue crack propagation by Bayesian statistical modeling. Mater. Sci. Eng. A 778, 139087. doi:10.1016/j.msea.2020.139087
Shrestha, S., Kannan, M., Morscher, G. N., Presby, M. J., and Mostafa Razavi, S. (2021). In-situ fatigue life analysis by modal acoustic emission, direct current potential drop and digital image correlation for steel. Int. J. fatigue 142, 105924. doi:10.1016/j.ijfatigue.2020.105924
Tanvir, F., Sattar, T., Mba, D., Edwards, G., Eren, E., and Lage, Y. (2018). Identification of fatigue damage evolution in 316L stainless steel using acoustic emission and digital image correlation. MATEC Web Conf. 165, 22007. doi:10.1051/matecconf/201816522007
Vanniamparambil, P., Guclu, U., and Kontsos, A. (2015). Identification of crack initiation in aluminum alloys using acoustic emission. Exp. Mech. 55 (5), 837–850. doi:10.1007/s11340-015-9984-5
Yang, M., Manabe, K., Hayashi, K., Miyazaki, M., and Aikawa, N. (2003). Data fusion of distributed ae sensors for the detection of friction sources during press forming. J. Mater. Process. Technol. 139 (1-3), 368–372. doi:10.1016/s0924-0136(03)00533-8
Zarate, B. A., Caicedo, J. M., Yu, J., and Ziehl, P. (2012). Probabilistic prognosis of fatigue crack growth using acoustic emission data. J. Eng. Mech. 138 (9), 1101–1111. doi:10.1061/(asce)em.1943-7889.0000414
Zhang, H., Li, C., Xu, M., Dai, W., Kumar, P., Liu, Z., et al. (2021). The fatigue performance evaluation of additively manufactured 304L austenitic stainless steels. Mater. Sci. Eng. A 802, 140640. doi:10.1016/j.msea.2020.140640
Zhang, H., Xu, M., Kumar, P., Li, C., Liu, Z., and Zhang, Y. (2021). Fatigue life prediction model and entropy generation of 304L stainless steel fabricated by selective laser melting. J. Mater. Process. Technol. 297, 117279. doi:10.1016/j.jmatprotec.2021.117279
Keywords: acoustic emission, fatigue crack, cumulative count, repeatability, duration saturation
Citation: Ozevin D and Kessler S (2022) The dependence of acoustic emission behavior on prior fatigue loading history. Front. Built Environ. 8:981327. doi: 10.3389/fbuil.2022.981327
Received: 29 June 2022; Accepted: 09 August 2022;
Published: 31 August 2022.
Edited by:
Onur Avci, Iowa State University, United StatesReviewed by:
GuiYun Tian, Newcastle University, United KingdomLinsheng Huo, Dalian University of Technology, China
Copyright © 2022 Ozevin and Kessler. This is an open-access article distributed under the terms of the Creative Commons Attribution License (CC BY). The use, distribution or reproduction in other forums is permitted, provided the original author(s) and the copyright owner(s) are credited and that the original publication in this journal is cited, in accordance with accepted academic practice. No use, distribution or reproduction is permitted which does not comply with these terms.
*Correspondence: Didem Ozevin, ZG96ZXZpbkB1aWMuZWR1