 Mohanned S. Al-Sheriadeh
 Lubna K. Amayreh
- 1Civil Engineering, Jordan University of Science &Technology, Irbid, Jordan
- 2Civil Engineering, Applied Science Private University, Amman, Jordan
The Mujib Dam in Jordan experienced high seepage in 2004 in the right abutment. Initial examination of the cause blamed the rocks there and excluded the clay core hydro-fracturing. The problem later was resolved by grouting the right abutment heavily. This work believes that the grouting quantity was excessive and can be minimized if seepage paths were identified. For this purpose, the excavation cut photos were revisited during construction, the piezometric levels of wells drilled after the seepage event were examined, and the physio-chemical characteristics of seepage water were correlated to those in the reservoir. All those methods combined succeeded in finding the seepage paths and their percentage contribution to the total seepage volume. They found that three-fourths of the seepage water occurred through a small area circling the right abutment gallery stair shaft walls and suggested that the remaining one-fourth can be stopped over time by sediment deposition on the reservoir floor. Therefore, the previously applied grouting volume was high. In conclusion, the methods used in this work can identify the probable seepage paths and confine solutions to them.
1 Introduction
1.1 Problem statement
Seepage water flows in soils either through its bulk or through its fractures and caverns (Louis, 1969). If it flows in soil bulk, it obeys the Darcy law of saturated flow, and if it flows in fractures, it is usually conceptualized as a flow between two parallel plates or a Poiseuille-type flow. In fractures, Neuzil and Tracy (1981) developed theoretical relationships between the flow rate and mean fracture aperture. Romanov et al. (2003) extended the concept to flow in widening fractures by dissolution, and Murphy et al. (2004) applied it to fracture widening by pressure propagation.
Dams generally experience seepage in the underneath soil and through embankments, and abutments. The problem is manageable if it occurs in the soil bulk, but aggravates if it occurs in fractures and cavities as in karst formations. Under such circumstances, the reservoir storage and dam stability will be at risk of failure. Several researchers such as Mehr and Raeisi (2019), Bonacci and Rubinić. (2009), and Türkmen et al. (2002) blamed the karst formations for high dam seepage. Dashti et al. (2016) warned about the sitting dams on karst terrains because high seepage requires hefty grouting costs and threatens the dam’s feasibility. Sissakian et al. (2020) studied the high seepage problem of the Mosul Dam in northern Iraq and blamed the underneath karst formations for the cause. They stressed on the need for adequate geological investigation during the dam’s planning stage.
The Mujib dam is located 100 km south of Amman in Jordan (Figure 1). It is a roller compacted concrete dam and zoned earth-fill embankments. The dam bed and the maximum water level are 145 and 194 m above mean sea level (AMSL), respectively. The design storage is 20 million cubic meters of runoff water and used for drinking and industrial uses. The dam’s first filling was in 2003 and reached a 174 m level, and the second was on 25 November 2004 and reached a 191.5 m level. During the second dam filling and when the water level reached 177 m, seepage at a high rate appeared at the toe of the dam. In 2 weeks period, it reached the toe highest level near the new road culvert. Seepage started at a 140 L/s rate and increased to 240 L/s within 2 weeks period. The Jordan Dams Directorate of the Jordan Valley Authority investigated the causes and proposed methods to reduce the high seepage rate (Wiesner and Ewert (2013).
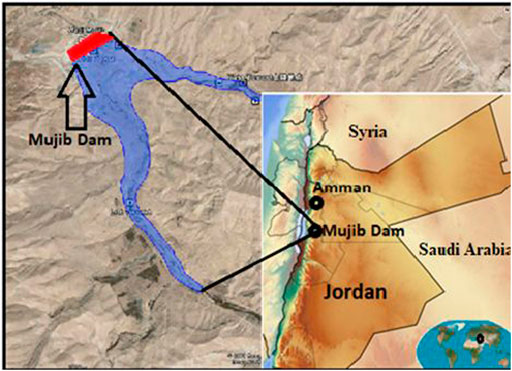
FIGURE 1. Mujib Dam location and its reservoir.
In May 2005, the right abutment was grouted extensively along a line that extended from under the right gallery stair shaft to the mountain. The seepage returned to 30 L/s normal rates, but at a high cost of grouting.
This work believes that the grouting quantity was excessive and could be reduced if the following methods were all used together to investigate the seepage causes, which are: the excavation cut photos at the time of dam construction, the water levels in the wells drilled in the right abutment in conjunction with the reservoir water, and the physio-chemical characteristics of seepage water in comparison with those in the reservoir.
2 Dam site
2.1 Geology
Abed (2017) and the Jordan Ministry of Water and Irrigation and Federal Republic of Germany (2008) described the geological formations across the dam axis as shown in Figure 2.
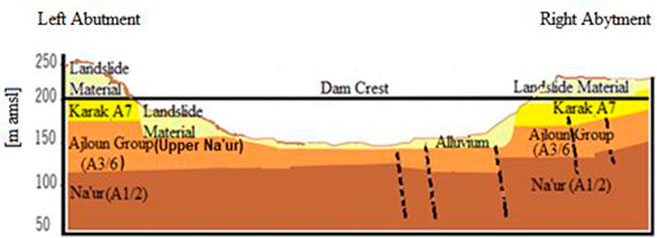
FIGURE 2. Dam site geological formations (faults are plotted in dotted lines).
On the valley floor, the top 4–8 m is composed of a material that slides from the valley flanks. It is underlaid by Fuheis/Hummar/Shueib formations of the Ajloun group (A3/6), which are basically a sequence of marl, limestone, and shale of low strength. They are well joined, and their pores are filled with residues of gypsum deposited from the top through stress relief joints. On the valley flanks, the Karak formation (A7) of the Ajloun group appears sitting underneath the sliding material and on the A3/6 formation. The A7 formation is 35 m deep and divided for simplicity into three layers: the top layer is massive limestone, marly limestone, and marl, with moderate strength; the middle layer is micritic limestone of 22 m thickness with intercalations of marly limestone, and it is moderate to strong in strength; and the bottom is a sequence of alternating layers of calcareous shale, calcareous mudstone, and lime with rough to smooth surfaces, slicken sided, and striated in some places.
The lowest formation bottomed all formations is Na’ur limestone (A1/2). It consists of two units: the top is thinly bedded limestone and marly limestone and can be described as strong along its 23 m depth. The bottom layer is a series of laminated mudstone and nodular limestone alternating with marl. It is weak in strength. Both the units extend for a total of 140 m thickness.
2.2 Hydrogeology
To understand the flow in and around the dam body, the hydrogeology of the dam surroundings must be described. According to the Jordan Ministry of Water and Irrigation and the Federal Republic of Germany report (2008), the Karak (A7) and Na’ur (A1/2) formations are aquifers, whereas the Ajloun group (A3/6) is an aquitard sandwiched between them. In fact, the Karak aquifer is a sub-aquifer of a larger aquifer system, named (A2/B7), which is basically the most productive one in Jordan. At the dam site, the groundwater flow lines diverge away from the dam site (blue arrows in Figure 3), which means that the aquifer outcrops there and the reservoir water could be a source.
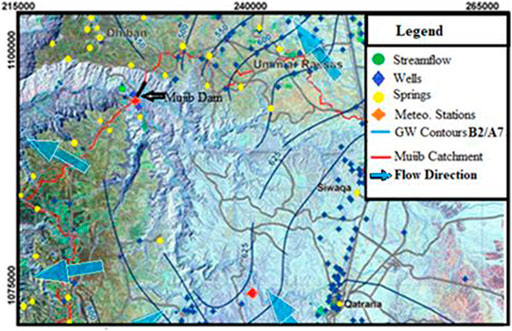
FIGURE 3. Groundwater contours and flow direction in the Mujib Dam aquifer system.
According to the Jordan Ministry of Water and Irrigation and the Federal Republic of Germany report (2008), the electrical conductivity (EC) of aquifers at the dam site varies between 750 and 11,400 μS/cm (Figure 4). The low EC describes the water that seeped from the reservoir and had constituents concentration (mean and standard deviation) in mg/L as reported: bicarbonates (136.3, 10.9), sulfate (138.1 m 10.3), chloride (59.6, 7.0), and sodium (40.4, 0.7), whereas the high value describes water rich in bicarbonates (141.27, 7.25), sulfate (2477, 230), chloride (2514, 717), and sodium (1466, 330) which describes Na’ur aquifer water.
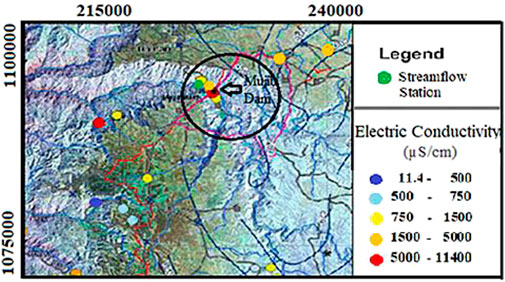
FIGURE 4. Electrical conductivity in the Mujib Dam aquifer system.
3 The seepage event
As mentioned previously, the dam’s first fill reached 174 m level (29 m depth) on 2 December 2003, and the seepage rate was below the designed rate of 30 L/s in the following year on 24 November 2004, the dam received over a one-night large quantity of runoff water, and once the level exceeded 177 m seepage water observed next morning at high rates (>140 L/s) inside the right gallery stairs shaft top steps and along the embankment toe line near the water draw-off structure. In 2 weeks, the situation aggravated, and seepage water appeared all along the embankment toe line up to the new road culvert head side and registered 240 L/s (Figure 5). The Jordan Valley Authority was obliged to drill holes in the training wall to dispose off safely the seepage water gushing out of the right embankment toe line and culvert.
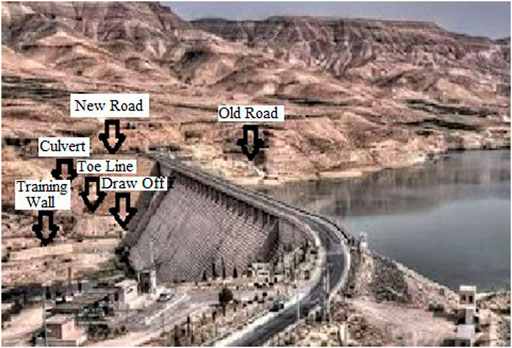
FIGURE 5. Location of various dam appurtenances.
4 Field investigation
To investigate the cause of high seepage, three approaches have been used: the rock content of discontinuities, the connectivity of groundwater in the right abutment with the reservoir water level, and the physio-chemical characteristics of the seepage water collected downstream of the dam.
4.1 Right abutment rock discontinuities
Initially, a geological mapping of the area near the right abutment along the new road excavation cut was conducted by Wiesner in December 2004 (Wiesner and Ewert, 2013). At least 258 discontinuities were documented, including fractures and cavities, and upon those, the right abutment rocks were described as karst and seepage was expected.
The photos of observed discontinuities, as shown in Figure 6B,C, were taken by them. By comparison with those taken during the dam construction, one concludes that the fracture’s aperture was so small (Figure 6A), and a zoom-out photo was needed to identify them. Even the construction workers were unable to identify them, and thus, no documentation was made of their presence.
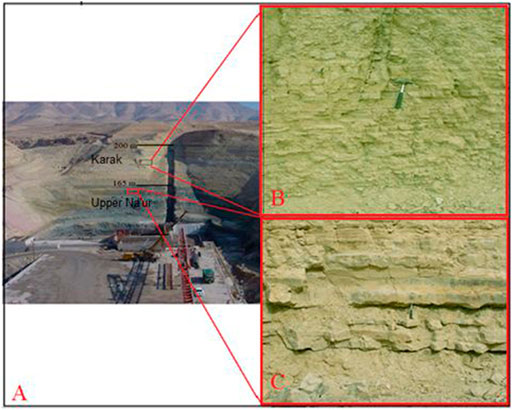
FIGURE 6. (A) Dam excavation cut in the right abutment. (B), (C) Wiesner pictures of discontinuities.
Additionally, a visit to the site was made in early December 2019, when the reservoir water level was low. It showed that the right abutment rocks, where dam cuts went through, contain shear cracks. Those cracks are a result of nodular limestone sliding on a harder micritic limestone, and the sliding process left behind cracks filled with pebbles in the space between the two rocks (Figure 7). It should be noted that the crack’s aperture is wide and can allow water to flow.
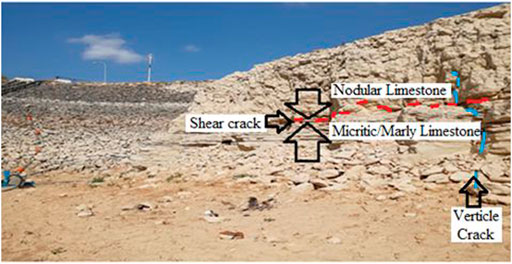
FIGURE 7. Shear cracks in the right abutment rock formations.
4.2 Connectivity of groundwater in the right abutment with the reservoir water level
To understand the groundwater connectivity with the reservoir water in the right abutment, 11 wells, as shown in Figure 8A tapping various rock formations, were drilled and the water level since then has been measured. In this study, the water level in nine of them was plotted against the reservoir water level for correlation (Figures 8B–D). The correlation plots were preferred over calculating the coefficient of correlation because the correlation and its variation with the levels in the reservoir can be seen. Based on those plots, the following can be inferred: 1) the wells SP14 and SP13, which tap the upper Karak formation but are located far away from the dam site, have a weak level correlation with the reservoir level, implying that the groundwater there did not originate from the reservoir (Figure 8B). On the contrary, the wells SP12, SP7, and M1 which tap the Karak formation and are located at a shorter distance from the reservoir in the right abutment, have a strong level correlation with the reservoir level (Figure 8B). Contrary to SP7 well levels, M1 and SP12 levels match the reservoir level fully, which means that their connectivity with the reservoir water is high, and this behavior cannot be explained without assuming the highly cracked Karak formation; 2) the wells SP6 and SP11, which tap the upper Na’ur, have a strong correlation with the reservoir level, and this means that the upper Na’ur formation is cracked like Karak. 3) The well SP5 tapping the lower Na’ur and is located within the M1, SP6, and SP7 wells field, and has a weak level correlation with the reservoir, but SP10, which is located within the wells SP9, SP11, and SP12 area, has a strong level correlation with the reservoir at reservoir’s levels below 187 m, above it, its level jumps to match the reservoir level. Such behavior is strange and cannot be explained without assuming that the well plastic tube was broken at levels above 187 m, which consequently made the upper Na’ur groundwater enter the well’s tube wall.
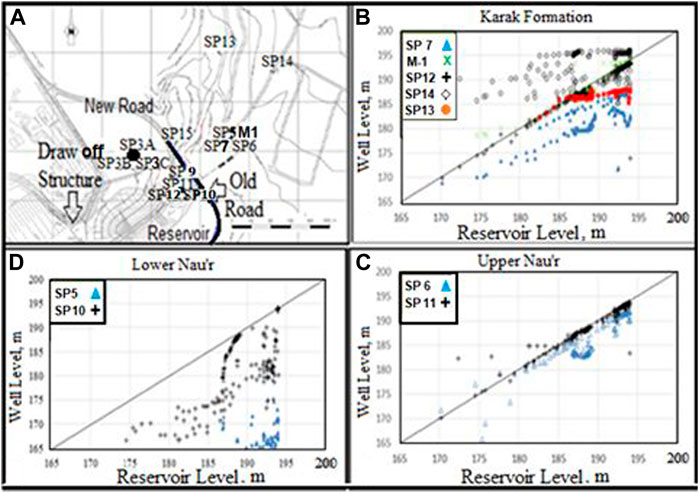
FIGURE 8. Correlation plots of right abutment wells level with the reservoir level. (A) Wells location, (B) The wells tapping Karak formation, (C) The wells tapping upper Na’ur formation, and (D) The wells tapping the lower Na’ur formation.
From the abovementioned details, one can conclude that both the Karak and upper Na’ur formations are highly cracked, and the lower Na’ur is not and has low permeability.
4.3 Physio-chemical characteristics of water samples
Seepage water samples collected on December 1 through 15, 2005, were analyzed for EC and temperature (T). The sampling sites were the dam toe near the draw-off structure, training wall weep holes, the new road culvert headwater side, and dam gallery drains. The analysis results are presented in Figures 9A,B and can be grouped based on the T and EC values into four groups. Group 1 is seepage water with T and EC like the reservoir water. The samples collected from the gallery stairs shaft belong to this group (blue circles, T = 15–15.5°C, and EC = 1,131–1,346 μS/cm). Group 2 are water samples collected from the right gallery ceiling and side walls’ drains (orange circles, T = 21–22°C, and EC = 1,425–1,969 μS/cm). Group 3 are water samples collected at the dam toe near the draw-off structure, training wall weep holes, ditch, or manhole (green circles, T = 18.5–21°C, and EC = 3,475–5,747 μS/cm). Finally, group 4 is water collected at the culvert headwater and right gallery bottom drains (red circles, T = 24°C, and EC = 9,150–13,848 μS/cm).
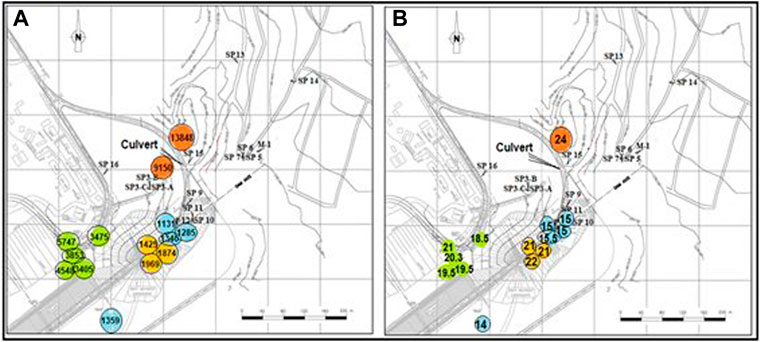
FIGURE 9. (A) Seepage water T (oC) and (B) EC (µS/cm) at various exit points. Samples of similar characteristics were grouped together and colored with the same color.
The T and EC values of each group reflected the path seepage water took during the event. Group 1 water represents the reservoir water which circled the contact area between the right abutment rocks and gallery stairs shaft wall. It is a short path as it did not seep into rocks. Group 2 water reflects the seepage water which seeped from the reservoir into the embankment soil, it was higher than the reservoir water in EC and T. Group 4 reflects the longest path that water took from the reservoir into the right abutment rocks till it emerged at the culvert headwater. Certainly, it was mixed with groundwater rich in residues of dissolved minerals as shown in Figure 4. Finally, group 3 water is a mixture of the three groups of water, all mixed together as they went downstream.
By inserting the average EC of each group (groups 1 + 2 together has 1,500 μS/cm, group 3 has 4,206 μS/cm, and group 4 has 1,1500 μS/cm) into the mass balance equation of seepage around the right abutment assuming the total seepage flow is 1 m3/s, and one can find that the seepage water through the gallery stairs shaft and ceiling and sidewalls drains represents 0.75 m3/s of the total seepage. Assuming that the ceiling and sidewall drains flow is small, seepage from water circling the stairs shaft is nearly 0.75 m3/s, and this might be the cause of the 2004 seepage event.
4.4 The seepage paths
Based on the field investigation presented in Section 4.3, seepage might take place in two areas: the area in the right abutment surrounding the stairs shaft, and another through the rocks of the right abutment far away from the stair shaft. A contour plot of the wells’ water level at times of seepage, excluding wells SP13 and SP14, is presented in Figure 10. The plot confirms what was found in Section 4.3. The contour gradient is much steeper in the area surrounding the stairs shaft than in those areas further away (Figure 10). On such a basis, one can delineate two areas through which reservoir water seeped: areas A and B (Figure 10). In area A, the reservoir water seeped through it and then diverged into two paths: the first went into the embankment soils and appeared in the gallery ceiling drains (blue arrows in Figure 10), and the second flooded the area around the gallery stairs shaft walls and emerged inside the gallery at the top stair steps (green arrows in Figure 10), and it seems a small portion of this water went further down to appear at the culvert headwater side. In area B, the reservoir water seeped through it and continued its way downstream to emerge in the culvert headwater side too. The analysis in Section 4.3, last paragraph, found that the seepage volume through areas B and A represented 25 and 75%, respectively, of the total seepage water.
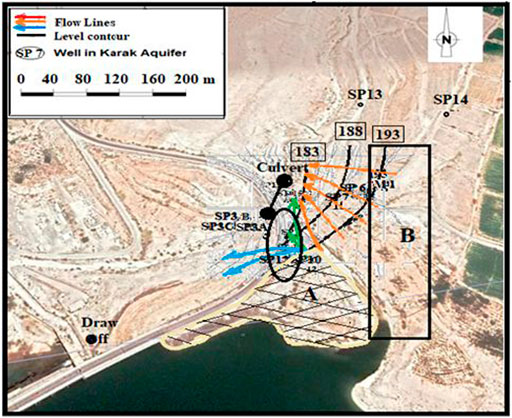
FIGURE 10. Probable seepage paths from areas (A), (B) colors indicate the different paths.
4.5 Ability of fractures in the right abutment to produce high seepage
The theory of laminar flow between two plates or Poiseuille type in the area surrounding the stairs’ shaft was applied to evaluate the observed crack production of 240 L/s of seepage rate. For simplicity, the following assumptions were made: 1) the reservoir was at its highest level of 194 m, the seepage water exit points were on average at 155 m level, and the rocks surrounding the stairs’ shaft have fractures of 1.5 mm aperture, on average (Figure 11). According to Louis theory of flow in fractures (1969), the water velocity v can be calculated for a fracture of, w, aperture as
where
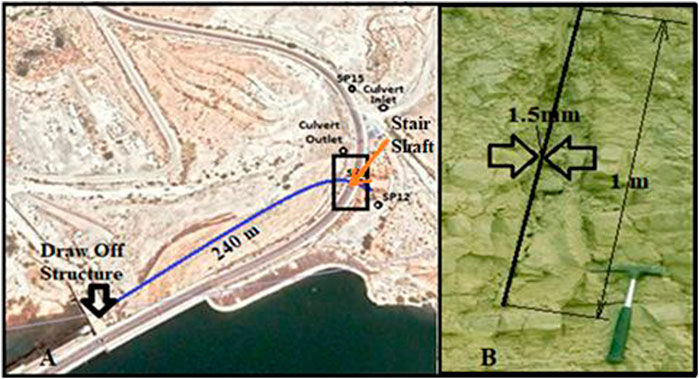
FIGURE 11. (A) The seepage assumed length from area A to draw off structure, and (B) the observed fracture dimensions as shotted by Wiesner.
Also, the flow rate Q for a fracture width H, will be
Now, let the fracture exists on average at 39 m depth (=194–155); then, the hydrostatic pressure difference
5 Discussion of results
To resolve whether the grouting quantity which was applied to reduce the Mujib Dam seepage was excessive or not, this work used three methods. The first one investigated the rocks’ discontinuities and their permeabilities to seepage. It utilized the previous work of Wiesner and Ewert. (2013) and a recent December 2019 site visit. Both works showed that the rocks of the right abutment are deeply fractured in the Karak and upper Na’ur formations, and the cracks are seemingly in the vertical and horizontal directions (see Figure 2, Figure 6B,C, Figure 7). The documented discontinuities, as proved in the calculations made in Section 4.3, were capable to produce the observed seepage (only 16 cracks, 1.5 mm apertures can produce 240 L/s or more seepage rate). Though this method clearly provides evidence of the existence of cracks in the right abutment, their extent and location remained unknown.
The second method used the water level of nine wells in the right abutment to display the interconnectivity of groundwater in the right abutment to levels in the reservoir. The wells tapped the three formations existing in the dam site: Karak, upper Na’ur, and lower Nau’r. The correlation plots of water levels in these wells and the reservoir were presented in Figure 8 and showed that all wells tapping the Karak and upper Na’ur formations and situated along the seepage paths in the right abutment have water levels correlated well with the reservoir water levels. The correlation seemed weak for the wells tapping lower Na’ur (Figure 8D, well SP 5), though well SP10 showed a good but strange behavior due to seemingly well plastic tube break up at levels higher than 187 m (Figure 8D, well SP10).
The abovementioned results proved again that the right abutment has discontinuities confined to two formations Karak and upper Na’ur, and seepage had occurred through them from the water in the reservoir. The problem remained on most probable paths of seepage water. To resolve it, the third method was used, which uses a physio-chemical analysis of seepage and reservoir waters, and a plot of water levels in wells to identify where most seepages occurred. The results presented in Figures 9, 10 proved that the seepages concentrated in the area surrounding the right abutment stair shaft walls. It seeped through area A and appeared in the stair shaft top steps. A small portion of it, which seeped through area B, went further down to appear in the culvert headwater area. The analysis made in Section 4.4 proved that the seepage water seeped from area A represents 75% of the total seepage rate or 180 of the 240 L/s measured in 2004, and the remaining could be resolved over time because it was through area B where sediment deposition on the reservoir side and bed can impede it.
6 The proposed solution
By rock analysis and site visits, it was proved that the right abutment in the Karak and upper Na’ur formations was highly cracked, and the 2004 seepage event was expected. It was also found that by analyzing the groundwater flow around the dam’s right abutment and the physio-chemical analysis of seepage water that 75% of seepage water was confined to a small area surrounding the right gallery stair shaft walls. On such a basis, the 2005 grout curtain (shown in red line in Figure 12) could be shortened to blue line length shown in Figure 12, and the cost would be much lower.
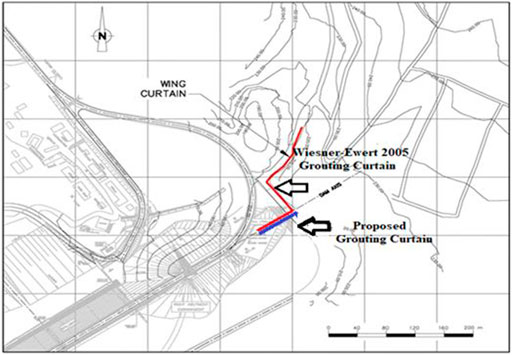
FIGURE 12. Grouting curtain length the one proposed by Wiesner and Ewer in 2005 (red line) and by this work (blue line).
7 Conclusion
This work has concluded the following:
1) The dam’s right abutment in the Karak and Na’ur formations is highly cracked, and the 2004 seepage was expected. It seems that the construction company’s grouting campaign was short to recognize them.
2) On various analyses made in this work, most of 2004 seepage volume (75%) went through the area close to the stair shaft walls and it seeped in rocks located at higher elevations.
3) The remaining 25% of the 2004 seepage volume seeped through an area further away from the dam body. However, sediment deposition on the reservoir floor can stop such seepage over time, and grouting was not necessary.
4) The length proposed by Wiesner and Ewert in 2005 for the grout curtain was too long and could be reduced appreciably.
5) Future dam construction in Jordan must avoid locations where highly cracked formations are expected. The upper formations are generally cracked which may result in nonfeasible dams.
Data availability statement
The original contributions presented in the study are included in the article/Supplementary Material. Further inquiries can be directed to the corresponding author.
Author contributions
All authors listed have made a substantial, direct, and intellectual contribution to the work and approved it for publication.
Acknowledgments
The authors are deeply thankful to Jordan University of Science and Technology, Jordan Valley Authority (JVA)/Dams Directorate, for providing data, pictures, and drawings and the Private University of Applied Sciences for cooperation. Special thanks go to End Feda Asweitee from JVA for her valuable insights and dam visit coordination.
Conflict of interest
The authors declare that the research was conducted in the absence of any commercial or financial relationships that could be construed as a potential conflict of interest.
Publisher’s note
All claims expressed in this article are solely those of the authors and do not necessarily represent those of their affiliated organizations, or those of the publisher, the editors, and the reviewers. Any product that may be evaluated in this article, or claim that may be made by its manufacturer, is not guaranteed or endorsed by the publisher.
References
Abed, A. M. (2017). An overview of the geology and evolution of wadi Mujib. Jordan J. Nat. Hist. 4, 6–28. doi:10.13140/RG.2.2.33625.98406
Bonacci, O., and Rubinić, J. (2009). Water losses from a reservoir Built in karst: The example of the boljunčica reservoir (istria, Croatia). Environ. Geol. 58 (2), 339–345. doi:10.1007/s00254-008-1599-z
Dashti, B. M., Rezaei, M., and Ashjari, J. (2016). Recognition of karst hydrology and water resources interaction in kazerun karstic zones, south of Iran. Arab. J. Geosci. 9, 54–13. doi:10.1007/s12517-015-2092-0
Jordan Ministry of Water and Irrigation and Federal Republic of Germany (2008).Delineation of surface water protection zones for Mujib dam. technical report no.10. Jordan: Amman, 132.
Louis, C. A. (1969). “Study of groundwater flow in jointed rock and its influence on the stability of rock masses,” in Rock mechanics research report # 10 (London, UK: Imperial College of Science and Technology), 90.
Mehr, S. S., and Raeisi, E. (2019). Investigation of seepage flow path(s) in the right embankment of sheshpeer dam, the zagros region, Iran. Carbonates Evaporites 34, 1321–1331. doi:10.1007/s13146-018-0426-1
Murphy, H., Huang, C., Dash, Z., Zyvoloski, G., and White, A. (2004). Semi-analytical solutions for fluid flow in rock joints with pressure-dependent openings. Water Resour. Res. 40 (12), 1–16. doi:10.1029/2004WR003005
Neuzil, C. E., and Tracy, J. V. (1981). Flow through fractures. Water Resour. Res. 17 (1), 191–199. doi:10.1029/WR017i001p00191
Romanov, D., Gabrovšek, F., and Dreybrodt, W. (2003). Dam sites in soluble rocks: A model of increasing leakage by dissolutional widening of fractures beneath a dam. Eng. Geol. 70, 17–35. doi:10.1016/S0013-7952(03)00073-5
Sissakian, V. K., Adamo, N., and Al-Ansari, N. (2020). The role of geological investigations for dam siting: Mosul dam a case study. Geotech. Geol. Eng. (Dordr). 38, 2085–2096. doi:10.1007/s10706-019-01150-2
Türkmen, S., Özgüler, E., Taga, H., and Karaogullarindan, T. (2002). Seepage problems in the karstic limestone foundation of the kalecik dam (south Turkey). Eng. Geol. 63, 247–257. doi:10.1016/S0013-7952(01)00085-0
Keywords: seepage paths, dam abutments, semi-arid region, clay core hydro-fracturing, Mujib Dam
Citation: Al-Sheriadeh MS and Amayreh LK (2022) Practical methods to identify seepage paths in dam abutments in semi-arid areas: The Mujib dam in Jordan. Front. Built Environ. 8:991296. doi: 10.3389/fbuil.2022.991296
Received: 11 July 2022; Accepted: 12 September 2022;
Published: 05 October 2022.
Edited by:
(Retired) Sudhakar Rao, Indian Institute of Science, Bangalore, IndiaReviewed by:
Ramakrishna Bag, Indian Institute of Technology, IndiaK Ravi, Indian Institute of Technology, India
Copyright © 2022 Al-Sheriadeh and Amayreh. This is an open-access article distributed under the terms of the Creative Commons Attribution License (CC BY). The use, distribution or reproduction in other forums is permitted, provided the original author(s) and the copyright owner(s) are credited and that the original publication in this journal is cited, in accordance with accepted academic practice. No use, distribution or reproduction is permitted which does not comply with these terms.
*Correspondence: Mohanned S. Al-Sheriadeh, YWxzaGVyaWFAanVzdC5lZHUuam8=