 Kieran Khamis1,2*‡
 Valerie Ouellet1,2†‡
 Danny Croghan1,2†
 Liliana M. Hernandez Gonzalez3†
 Aaron I. Packman3
 David M. Hannah1,2
 Stefan Krause1,2,4
- 1School of Geography, Earth and Environmental Sciences, University of Birmingham, Birmingham, United Kingdom
- 2Institute for Global Innovation, Edgbaston, Birmingham, United Kingdom
- 3McCormick School of Engineering, Northwestern University, Evanston, IL, United States
- 4LEHNA–Laboratoire d’ecologie des Hydrosystemes Naturels et anthropises, Villeurbanne, France
Urbanization and the increase in urban land cover are growing concerns associated with numerous negative impacts on surface water quality. Currently, many emerging contaminants are difficult to measure with no field deployable sensors currently available. Hence, discrete grab samples are required for subsequent laboratory analysis. To capture the spatiotemporal variability in pollution pulses, autosamplers can be used, but commercial offerings are both expensive and have a large footprint. This can be problematic in urban environments where there is a high density of point source inputs and risk of vandalism or theft. Here, we present a small and robust low-cost autosampler that is ideally suited for deployment in urban environments. The design is based on “off the shelf” open-source hardware components and software and requires no prior engineering, electronics, or computer programming experience to build. The autosampler uses a small peristaltic pump to enable collection of 14 small volume samples (50 mL) and is housed in a small footprint camera case. To illustrate the technology, we present two use cases for rapid sampling of stormwater pulses of: 1) an urban river channel and 2) green roof runoff. When compared with a commercial autosampler, our device showed comparable results and enabled us to capture temporal dynamics in key water quality parameters (e.g., dissolved organic matter) following rain events in an urban stream. Water quality differences associated with differing green roof design/maintenance regimes (managed and unmanaged vegetation) were captured using the autosampler, highlighting how unmanaged vegetation has a greater potential for mitigating the rapid runoff and peaked pollutant inputs associated with impervious surfaces. These two case studies show that our portable autosampler provides capacity to improve understanding of the impact of urban design and infrastructure on water quality and can lead to the development of more effective mitigation solutions. Finally, we discuss opportunities for further technical refinement of our autosampler and applications to improve environmental monitoring. We propose a holistic monitoring approach to address some of the outstanding challenges in urban areas and enable monitoring to shift from discrete point sources towards characterization of catchment or network scale dynamics.
1 Introduction
River pollution is a remarkably complex issue with multiple sources contributing across variable time scales, meaning that a high spatial density of sampling is required to facilitate understanding. Urban areas typically display a higher number of pollution sources and can have strong negative water quality impacts (Walsh et al., 2005; Booth et al., 2016; Ouellet et al., 2021). Urbanization is typically associated with increased pressure on urban streams as physical habitats are modified (e.g., channelization) and water quality impaired (e.g., by road runoff and effluent inputs) (Walsh et al., 2005; Palmer et al., 2010; Booth et al., 2016). In addition, modified heat exchange and hydrological process alterations create thermal habitat degradation (Somers et al., 2016; Croghan et al., 2019; Ketabchy et al., 2019; Timm et al., 2021). The impacts of changes in water quality cascade throughout a wide range of ecological processes, from stream functioning (nutrients cycle, etc.) to aquatic organisms’ repartition (Elmore and Kaushal, 2008; Grimm et al., 2008; Mantyka-Pringle et al., 2014; Jefferson et al., 2017). There is an increasing need to understand linkages between fine-scale environmental (site, reach) data and larger scale (network and watershed) patterns to unpick the impacts of water quality changes on stream ecology. This new knowledge is urgently needed in urban areas to improve mechanistic understanding of the ecological and biogeochemical responses to global water quality changes that are currently compounded by climate change.
The collection of water samples for subsequent laboratory analysis to assess river water quality is still central to many monitoring efforts for both scientific and legislative monitoring, particularly when considering emerging contaminants for which we have no field-deployable sensors (Chapman et al., 2016; Wells et al., 2016; Tyagi et al., 2020). Indeed, samples to monitor water quality are generally collected manually, and the logistics associated with manual samples can be complex, especially in remote areas where site accessibility and infrastructure access can complicate data acquisition. Furthermore, water quality often varies substantially in space (Kämäri et al., 2018) as well as time, requiring repeated sampling to identify their variability at a range of temporal scales (Krause et al., 2015; Blaen et al., 2017). A classic example is the monitoring of storm events (Lee et al., 2015; Lloyd et al., 2016), where it is necessary to sample before the event to establish pollutant concentrations during base flow conditions, as well as to conduct repeated sampling during and after the event to understand pollutant source and transport processes. Manual sample collection during such storm events is not viable, and autosamplers (i.e., devices that automatically collect water at predefined intervals) have facilitated high-frequency water quality sampling. However, they are costly (>1,500 USD) and are often over specified for many applications in terms of size (footprint and pump) and energy requirements. Even the recent open-source sampler designs can be relatively expensive (∼700 USD) and are not suitable for urban applications for various reasons, including over-specification for routine water quality analysis (e.g., developed for stable isotopes) or are only capable of single sample collection (Enochs et al., 2020). For example, designs for collecting water stable isotopes require sample chambers to be airtight and thus require expensive solenoid valves (e.g., Hartmann et al., 2018). Other designs have been developed for bench top water quality analysis and rely on robotic arms or gantries and, while can be viewed as portable, are not ruggedised or suitable for remote deployment (Carvalho & Eyre, 2013; Carvalho, 2020).
To date our understanding of urban watersheds is mainly based on extrapolating dynamics from the reach scale sampling, but there is a clear need to understand process dynamics across urban landscapes and watersheds (Kuhlemann et al., 2020). For example, heavily engineered headwaters (e.g., with gutters and drains; Fork et al., 2018) can represent important nutrient hotspots, creating signatures of water pollution that propagate downstream through complex, and often intensively managed river networks. However, due to the lack of suitable tools and replicable approaches, water quality sampling is typically restricted to single monitoring points representative at best of individual stream reaches or channel sections, precluding the possibility for river managers to make multiscale decisions (e.g., Santos Santos & Camacho, 2022). These data gaps are primarily due to a lack of low-cost and robust equipment to facilitate monitoring at spatial scales relevant to urban stream conservation and management. Current progress in environmental sensing technologies have increased the spatial and temporal resolution of monitoring, including in-situ monitoring (Blaen et al., 2016; 2017; Rode et al., 2016). However, data acquisition remains challenging and can be quite expensive depending on the site accessibility and the parameters being monitored. The capacity to increase the number of monitoring sites, while combining different spatial and temporal scales relevant to conservation and management is currently hindered by the prohibitive cost of existing sensing and sampling methods. However, the capacity to organize sampling at a higher spatial resolution along an organized network can allow us to track and trace different pollution sources and understand cumulative urbanization pollution impacts. Furthermore, the risk of vandalism and damage/loss due to high-flow events makes data collection in urban environments particularly challenging.
Rugged, easily-constructed, and low-cost autosamplers are essential to enable distributed sampling of urban stormwater event dynamics in cities around the globe (Hannah et al., 2022; Ward et al., 2022). We appreciate that the term “low cost” can be ambiguous and will differ depending on local socioeconomic factors. Here we aim to achieve an order of magnitude reduction in cost compared to commercially available autosamplers, i.e., 100’s rather than 1,000’s USD. In addition, it should be designed using “off-the-shelf” components, which are well documented and would be simple enough for a technician with no practical training in electronics to assemble. Such design should also avoid the need for a 3-d printer, as that can represent a significant barrier to uptake of open-source equipment. Open-source hardware (e.g., Arduino) has started to be utilized for a range of environmental monitoring applications (Mao et al., 2018), and offers largely unexplored potential for developing automatic water samplers. Based on these criteria, we developed a low-cost, modular autosampler, the Autobot-WQ, that environmental science researchers can recreate without requiring extensive electronics or programming experience. We demonstrate the utility of the Autobot-WQ through two urban case studies and show how our design can help address the pressing needs linked to: (1) the need for a higher monitoring density to understand point sources of pollution as well as cumulative impacts of urban features, and (2) assess how efficient different mitigating actions are. Our first case study shows the Autobot-WQ efficiency in monitoring urban stream water quality, while the second presents an application for assessing the efficiency of green infrastructure (green roofs) on runoff quality. We then discuss how the Autobot-WQ can be incorporated into a holistic monitoring plan of urban areas and global water quality issues, helping to improve the understanding of river systems water quality issues across gradients of climate and socioeconomic development across the globe.
2 Methods
2.1 Autobot-WQ design and bench testing
The design of the presented autosampler enables users to collect 14 × 50 mL samples and represents a trade-off between size, weight, number, and volume of samples to ensure the device is as portable as possible. The Autobot-WQ consists of a peristaltic pump, stepper motor, microcontroller, associated electronic components for driving motors and time keeping, suction hose, and sample tube holder (see Figure 1). All components are housed in a waterproof case (L = 46.2 cm, W = 29.0 cm, H = 15.9 cm), which makes transportation of the device convenient and installation quick. An Arduino Nano controls the pump and stepper motor via a L298N Dual H Bridge DC Motor Driver and ULN2003 Motor Driver, respectively. An Arduino based microcontroller was chosen as is open-source with an extensive user community with support forums coving a wide range of applications and use cases (Mao et al., 2018).
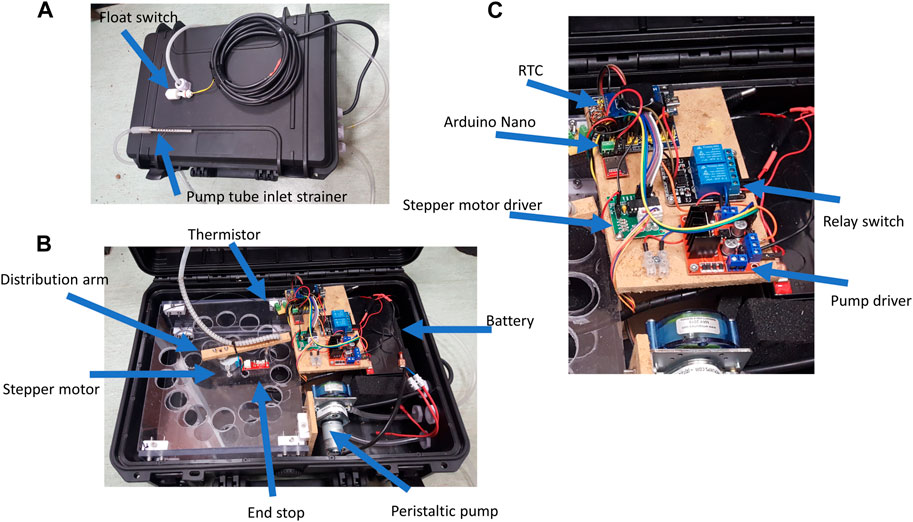
FIGURE 1. Autosampler design with (A) exterior (B) interior view with sample holder, and (C) key electronic components. Note RTC = Real Time Clock.
The Nano interfaces with a real-time clock (RTC) for accurate time keeping and a thermistor to enable internal temperature to be measured during sampling. Sample date, time, and temperature are then stored on an SD card using an openlog data logger over the serial line. A 7 ah lead acid battery supplies 12 v, which is either directly switched to the pump and stepper motor using a relay switch (5 v logic) or stepped down to ∼9 v for the Nano using a voltage regulator. The sample tube holder is constructed from two polycarbonate plastic sheets with 3.4 cm diameter, drilled circular holes (Supplementary Figure S1), and two supporting plastic sheets 9 cm high. The drilled sheets are attached to the support sheets using eight assembly joints (modesty blocks). The stepper motor is mounted centrally, with a distributor arm attached to the shaft. The pump tubing is threaded through a 10 cm spring to avoid kinking and attached to the distributor’s arm. A mechanical end stop, attached to the tube holder in alignment with the first sample tube location, is used to locate the home location prior to any sampling run. A short (3 cm) screw is inserted into the underside of the distributor’s arm enabling switch closure at the correct position. All other electronic components were attached to a wooden platform (12 cm high, i.e., above the height of the distributor arm). A support bracket for the peristaltic pump was attached to the sample tube holder using two joint connector blocks to enable easy pump maintenance. Three holes with M20 glands located on the side of the camera case are used for the pump tubing/suction hose (in and out of the peristaltic pump) and float switch cable (used to trigger the autosampler via an enable). The pump tubing is then fed to the distributor’s arm via a further M20 hole in the camera case lid. A 10 k thermistor is also connected to the Nano and is used to measure internal temperature. A voltage divider with a 10 k resistor is used to facilitate measurement via an analog pin on the microcontroller. Resistance is then converted to temperature using the Steinhart-Hart equation. Further information on the assembly components can be found in the Supplementary Information (e.g., dimensions of sample holder).
Operation of the autosampler requires a basic understanding of the Arduino computing platform. The firmware for the autosampler has been embedded in an Arduino sketch (https://docs.arduino.cc/built-in-examples/) which can be edited on a computer and then uploaded to the micro controller via a usb connection. A flowchart illustrating the operation of our autosampler is displayed in Figure 2. The sketch developed for this autosampler (see https://github.com/kkhamis/Autobot-WQ) has a number of variables that users can edit to meet their specific monitoring (Table 1). These can account for differences in pump tube length, head (i.e., height of the sampler above the water), potential for cross-contamination, and flashy flow regimes (e.g., enabling control over sampling frequency to capture stormwater first flush and hydrograph recession).
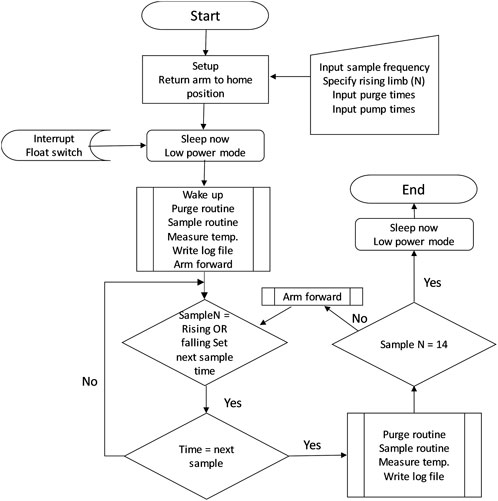
FIGURE 2. Flowchart outlining the autosampler’s operation for a standard configuration triggered by a float switch. The sampler automatically switches between sampling modes (i.e., rapid sampling during the rising limb and sparser sampling during the falling limb) based on user-defined parameters. Once the last sample has been collected, the program enters deep sleep mode.
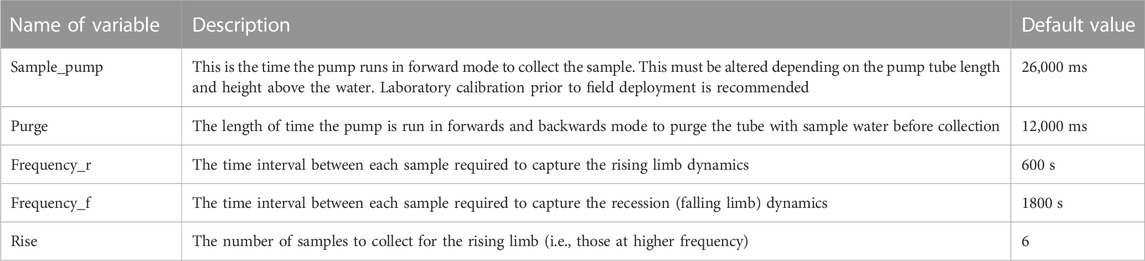
TABLE 1. Sampling variables that can be adjusted in the software.
Bench testing of the sensor was conducted at the University of Birmingham. Given the small sample size the potential for cross-contamination between high and low concentration samples was of immediate concern. A lab experiment was conducted to assess the potential for cross-contamination by alternating sampling between Bourn Brook River water (Dissolved Organic Carbon [DOC] = 3.58 mg L−1, electrical conductivity = 527 μS cm−1) and ultra-pure water (Milli-Q, 18.2 MΩ−1). Samples were filtered through pre-flushed Whatman GF/F filter papers (pore size = 0.7 μm) and then analyzed for spectral properties following methods outlined by Khamis et al. (2020). Peak T and Peak C fluorescence were specifically assessed as these have the potential to trace the source of organic matter; with Peak T associated with proteinaceous compounds (i.e., municipal wastewater) and Peak C associated with decomposed vascular plant material (i.e., from soil sources).
2.2 Case study 1: Urban stream water quality
The sampler was deployed adjacent to the Bourn Brook (Figure 3), a tributary of the River Rea, Birmingham, United Kingdom (52°27′N, 1°54′W). Khamis et al., 2018 provide a detailed description of the basin, but in summary, the catchment is 27.9 km2 and urban or suburban land use extends over ∼80% of the basin. There is no wastewater treatment work within the catchment, but an extensive, aging (>100 years) network of storm sewers and combined sewer overflows discharge to the main channel. Hence, the system is particularly dynamic (‘flashy’) in terms of river flow and organic pollution fluxes (Khamis et al., 2018). Sensors were installed in channel to measure river level (PDCR-830, vented pressure transducer, GE, Fairfield, United States) and turbidity (Cyclops 7, Turner designs, CA, United States) at 15 min intervals. A commercial automatic sampler (ISCO 3700, Teleydyne ISCO Lincoln, Nebraska, United States) was installed alongside low-cost sampler for comparison. For both samplers, 5 m of silicon tubing was run from the bank to the metal Unistrut brace supporting the sensors in the channel. For both samplers, 5 m of silicon tubing was run from the bank to the metal Unistrut brace supporting the sensors in the channel. It is important to note that the inlet tubes were located at the same height in the water column to ensure directly comparable samples were collected. Location of the inlet can be an issue in rivers that are not well mixed (not the case for the Bourn Brook) or during storm events when the suspended load varies with depth. Monitoring was conducted during summer 2019 (August 27), when a large storm was experienced. Samplers were trigged manually at the storm’s onset to ensure synchronicity between the two autosamplers, and samples were collected samples every 30 min (n = 14). All samples were processed as outlined in the previous section (i.e., filtered through Whatman GF/F and analyzed for fluorescence). All lab data were pre-processed using the staRdom package (Pucher et al., 2019) to account for inner filtering and instrument specific artifacts. Fluorescence peak picking was undertaken following Khamis et al. (2020), and linear regression was used to assess the relationship between the ISCO and low-cost autosampler. All data processing and analysis were carried out using R 4.0.3.
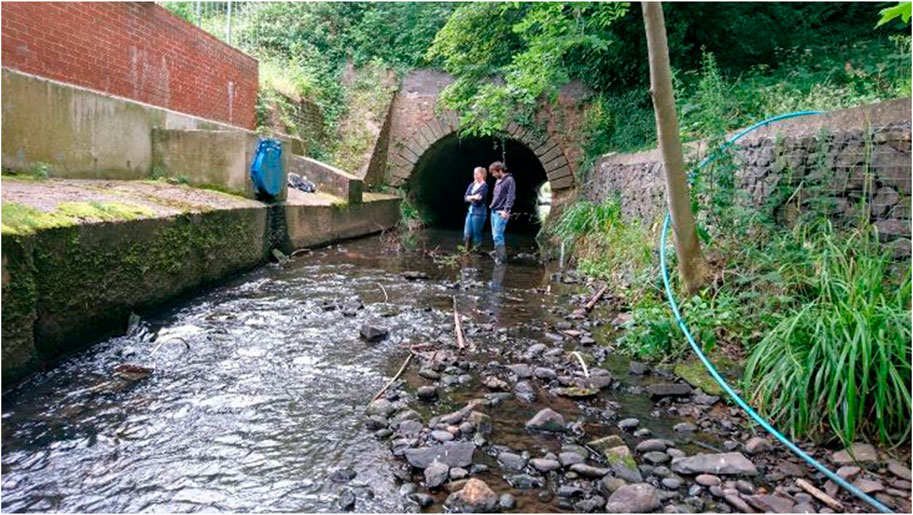
FIGURE 3. The monitoring location on the Bourn Brook during summer low-flow conditions.
2.3 Case study 2: Green roof efficiency to mitigate water quality issues
Three Autobot-WQ prototypes were built in Birmingham, United Kingdom, and transported without damage by plane to Chicago, United States, to test the efficiency of different actual-size green roofs (GR) designs. Due to the difficulty of sampling GR gutters, most green roof designs are assessed over small plots that are most likely newly built and unrepresentative of the dynamics over a full-size and established GR. Indeed, the Autobot-WQ were drawing water from roof drainage pipes, where the space was highly restricted, and the flow depths were small at the beginning and end of runoff, and where conventional autosamplers would not have worked for this application due to these constraints. Ouellet et al. (2021) provide the full detail of the green roof experiment realized in 2019, and here, we used unpublished results for the same study design. The study was conducted on two semi-intensive GR, adjacent to a non-vegetated roof from July to September 2019 and located at The Daniel F. and Ada L. Rice Plant Conservation Science Center at the Chicago Botanic Garden, Illinois, United States (42.14°N, −87.78°E). The North GR featured perennial native and non-native plants and a variety of sedums (Sedum spp.) planted in three linear ribbons that bisect the roof from east to west (hereafter referred to as the managed GR). In contrast, the South GR (herein referred to as the unmanaged GR) was planted with perennial native plants that are representative of a natural prairie in the Midwest United States (Figure 4; Hawke, 2015). The drainage panel on each roof drained 743 m2 and channeled water to the central roof drain that empties into a bioswale surrounding the building. The non-vegetated part of the roof consisted of concrete with a 93 m2 drainage area and was used as a baseline for evaluating the managed and unmanaged GR. An autosampler was installed at each GR and control (non-vegetated roof) drainage outlet (total of three) to collect the water samples. The volume of soil medium in the green roofs was relatively small leading to drainage flow only occurred episodically during and after storm events. Hence, the float switch was used to activate the autosamplers ensuring all runoff events were captured. Non-parametric Mann–Whitney tests were used to determine differences between storm events and were undertaken using R version 4.0.3.
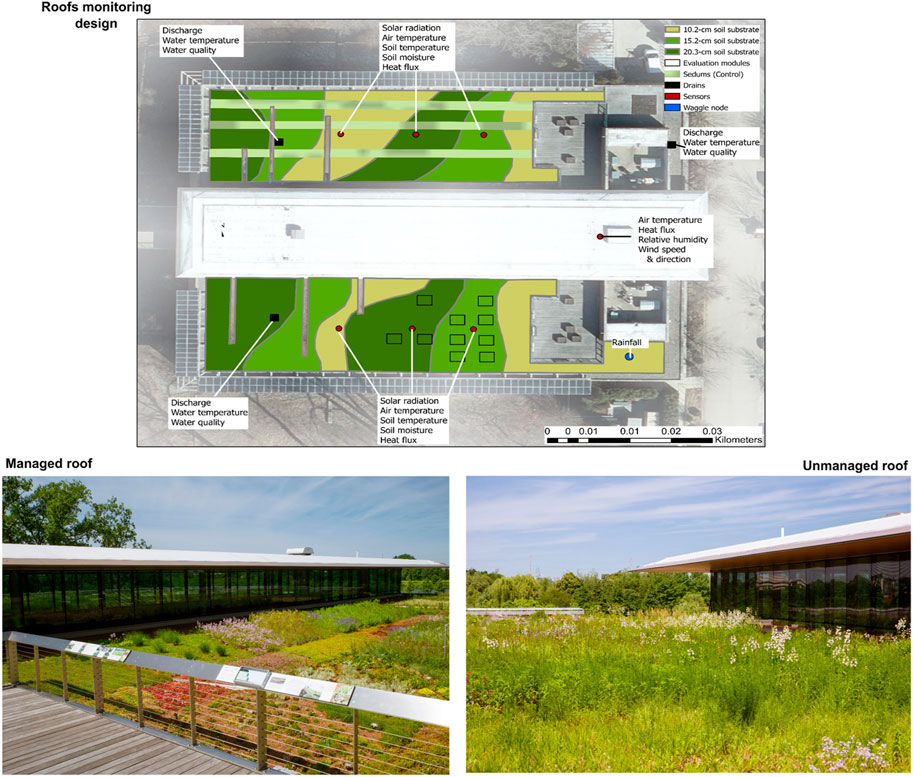
FIGURE 4. Schematic diagram of the green roofs sampling design and photographs from managed GR planted with native and non-native plants in three ribbons and unmanaged GR planted with regional native prairie plants (adapted from Ouellet et al., 2021).
3 Results
The bench testing highlighted the intensity of peak T fluorescence in the river water samples was an order of magnitude higher than in the ultra-pure water (mean ± SD; 1.37 ± 0.22 vs. 0.15 ± 0.03 R.U). The observed cross-contamination between high and low concentration samples was negligible, with no increase in the measurement of the deionized water/blank samples following river water sampling (mean change in blank = −0.02 R.U; Figure 5).
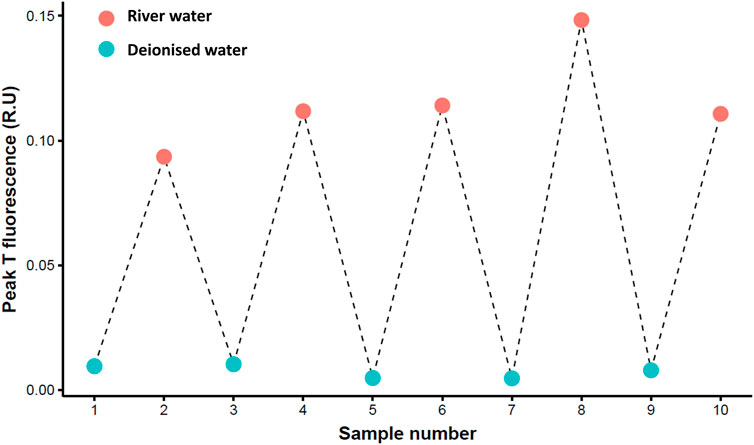
FIGURE 5. Results of laboratory testing to assess potential for cross-contamination between collected samples. A series of river water samples (Bourn Brook—red dots) were collected followed by deionized water (blue dots) with tryptophan like fluorescence (Peak T), a tracer of sewage contamination measured for each sample. Note R.U = Raman Units. This graph shows that there was no cross-contamination between river water and control samples.
3.1 Case study 1: Urban stream
The monitoring period coincided with a moderate sized, summer rainstorm. The total precipitation recorded for the event was 13.5 mm and the maximum intensity was 16.7 mm h−1 Water level varied by 0.7 m across the monitoring period from a low of 0.19 m prior to the onset of the precipitation event to a maximum of 0.89 m during the storm hydrograph (Figure 6). Turbidity increased with river level rising from 7.8 FNU during low flow conditions to 516 FNU during peak flow (Figure 6). This reflects typical response of urban river systems with a rapid increase in turbidity as the water level increased—i.e., a first flush of pollutants. In the observed storm event, material was likely transported from within the channel or from proximal sources with rapid routing, such as storm drains. The grab samples analyzed for peak T fluorescence displayed a rapid increase with discharge and peaked on the rising limb at 0.63 R.U from a low of 0.31 R.U during pre-event conditions. Interestingly peak T fluorescence and turbidity remained elevated above the base level during the recession period (Figure 6).
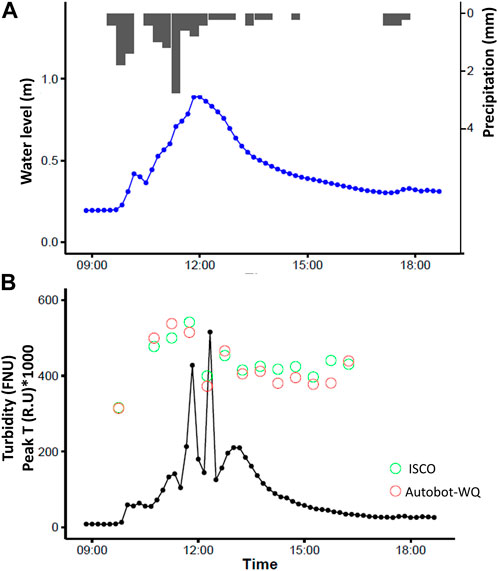
FIGURE 6. (A) Water level (blue line) and precipitation (grey bars) recorded during the autosampler deployment during an intense storm event on an urban river (B) Turbidity and tryptophan—like fluorescence (Peak T) recorded for samples collected using the low-cost autosampler (red circles) and an ISCO 3700 autosampler (green circles). Peak T fluorescence is reported in Raman units (R.U) multiplied by 1000.
When comparing the relationship between the ISCO sampler and our low-cost autosampler a strong linear relationship was apparent for both peak T and peak C fluorescence (Figure 7). A linear regression model exploring the relationship between the two samplers for peak T explained a large proportion of the variance (R2 = 0.9, p < 0.001). The slope was close to unity (1.01 ± 0.1), and the intercept small (−0.02 ± 0.04). For peak C the relationship was also strong, with a large proportion of variance explained by the model (R2 = 0.82, p < 0.001). The slope was slightly below unity (0.86 ± 0.12), but the intercept was small (0.06 ± 0.04).
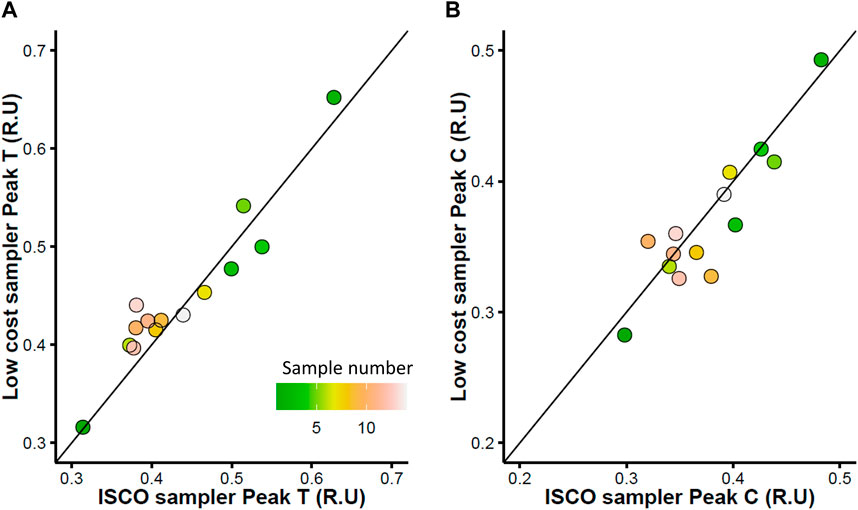
FIGURE 7. Relationship between samples collected using the low-cost autosampler and an ISCO 3700 autosampler for (A) Tryptophan—like fluorescence (Peak T) and (B) humic–like fluorescence (Peak C). Sample number denotes the sequencing of the sample collection in relation to the event denoted in Figure 5.
3.2 Case study 2: Green roof runoff
A total of 15 storms events were measured between July and September 2019 (Ouellet et al., 2021). Storm event characteristics were analyzed so each storm’s behaviour (e.g., intensity, total precipitation, magnitude) could be understood. For this case study, we selected two event, Storms 6 and 13, with contrasting conditions (Figure 8), highlighting how the Autobot-WQ can capture dynamics for different type of rain events, from a smaller amount of total precipitation (13.72 mm, storm 6) to higher precipitation (61.72 mm, storm 13). The lag time between the precipitation event and the start of the sampling period reflected the roof buffering capacity, which was highly dependent on the intensity of the precipitations and the time between rain events. The rainfall intensity was smaller during storm 6 (2.61 vs. 8.81 mm h−1, Mann–Whitney U = 5.8, p = 0.001), but there was also more time between these events compared to the time elapsed between storm 13 (88.8 vs. 36 h U = 5.8, p < 0.001) and its previous rain event, which was a low magnitude compared to the event before storm 6 (0.51 vs. 1.78 mm, U = 4.9, p = 0.002). The Autobot-WQ was able to capture rain dynamics for short and intense events (< than 1 h) as well as longer events (>1.5 days), highlighting its ability to monitor runoff for many hours after triggering, making it very good for storm-based sampling, enabling to captures rising and falling limb of during each rain event.
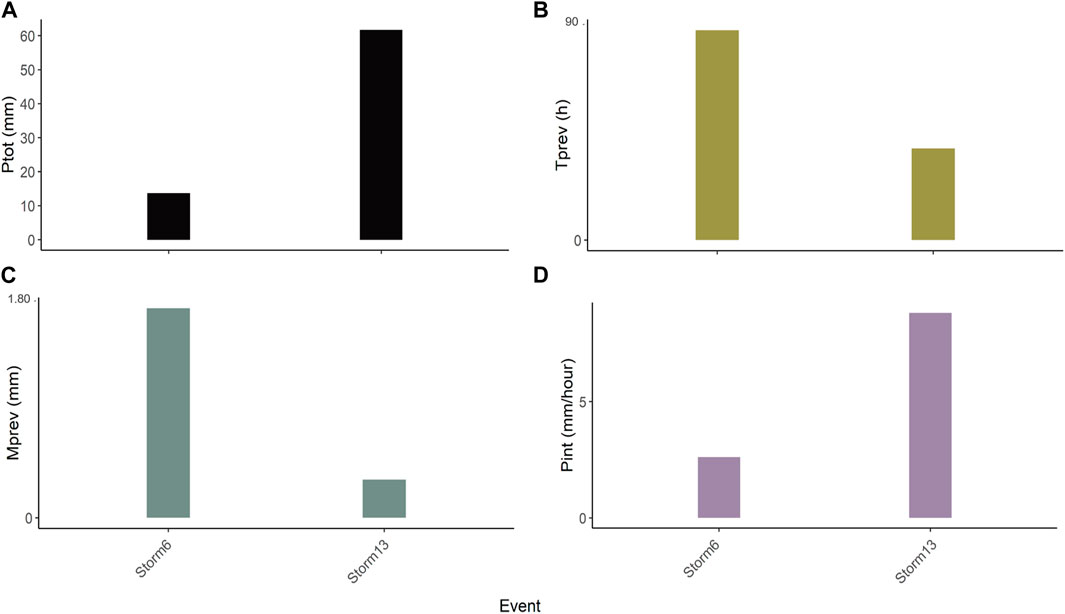
FIGURE 8. Antecedent conditions for rain events 6 and 13 in August 2019, where (A) Ptot = sum of event precipitation, (B) Tprev = time (h) since previous event, (C) Mprev = magnitude (total precipitation) of previous event, and (D) Pint = precipitation intensity.
The autosampler collected 14 samples for each storm event (Figure 9). The samples efficiently captured the water quality dynamics during the rising and falling limb of each storm, regardless of the timing, intensity, and duration of the precipitation, allowing to capture water quality dynamics for a wide range of events. It also enabled to compare the different surfaces, i.e., the control, the managed, and unmanaged GR to be observed. For storm 6, the nitrate was highest for the control roof (mean ± SD, control = 6.11 ± 0.70 mg L−1, unmanaged = 1.98 ± 0.33 mg L−1, and managed = 2.22 ± 0.68 mg L−1), most probably due to atmospheric deposition following the previous storm, which was of high magnitude (Figure 8). For storm 13, the nitrate levels are also higher on the control roof compared to unmanaged, but the manage roof displayed a higher value overall (control = 1.63 ± 0.35 mg L−1, unmanaged = 0.67 ± 0.29 mg L−1, and managed = 2.12 ± 0.59 mg L−1), except for the first flush on the managed green roof. Unsurprisingly, the DOC was lowest on the control GR (Storm 6 = 6.20 ± 0.66 mg L−1and Storm 13 = 4.72 ± 0.93 mg L−1) and higher for the unmanaged GR (Storm 6 = 11.10 ± 1.13 mg L−1and Storm 13 = 11.89 ± 1.64 mg L−1), while varying with the rain intensity during each storm event.
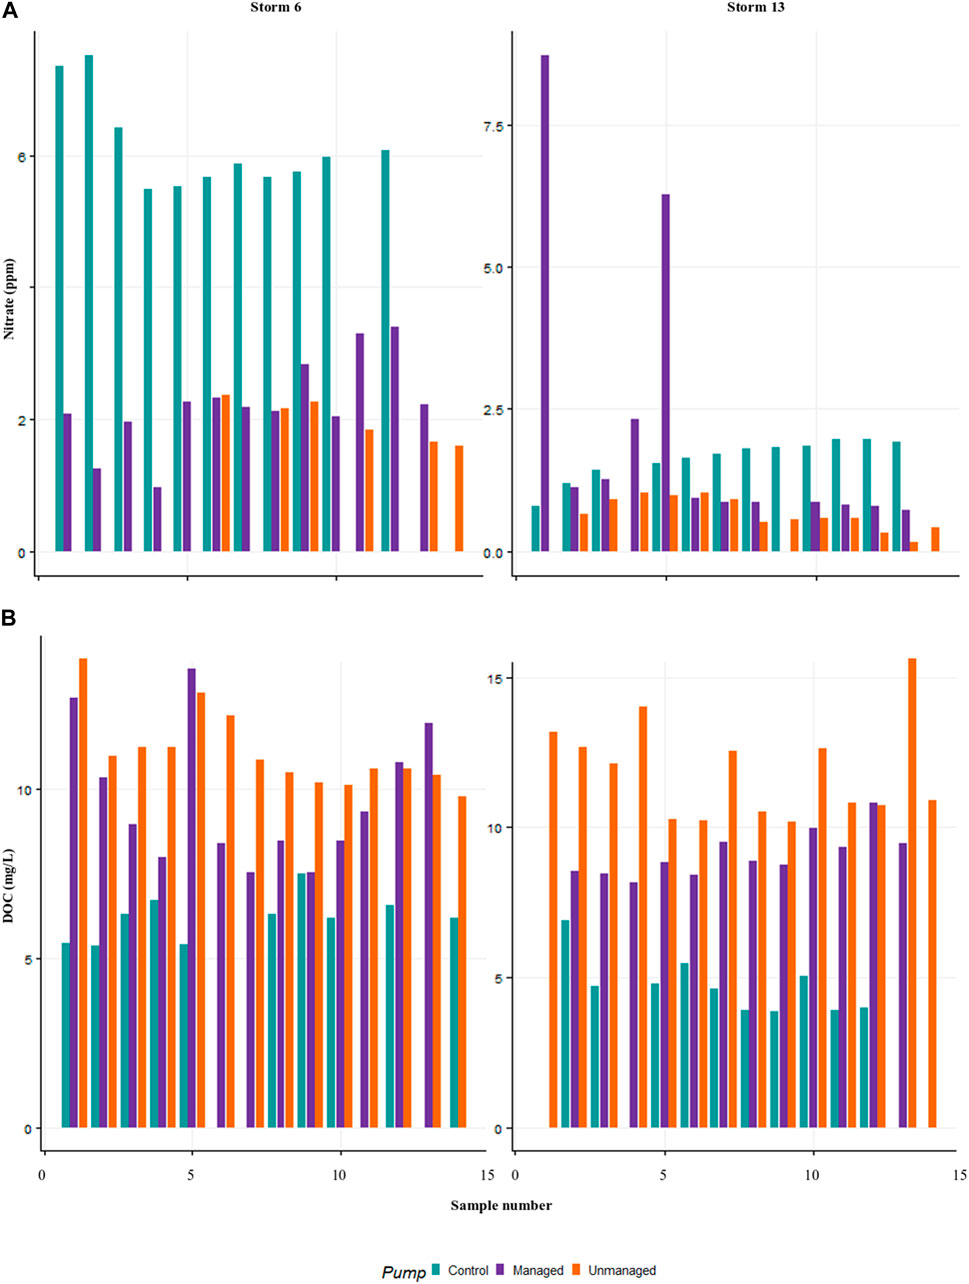
FIGURE 9. Water quality parameters (A) nitrate and (B) dissolved organic carbon—DOC, showing the difference between the exportation dynamics on the control, i. e., non-vegetated, managed, and unmanaged roofs for two contrasting rain events, storms 6 (total precipitation = 13.72 mm) and 13 (total precipitation = 61.72 mm).
4 Discussion
4.1 Autobot-WQ performance, considerations, and future developments
We have demonstrated the successful performance of a robust and reliable field-deployable autosampler developed using off the shelf, low-cost components. The construction does not require a 3-d printer and can be assembled by someone with no engineering or electronics background. Autobot-WQ has now been validated as a rapid urban water quality monitoring tool. The footprint of the device is many times smaller than commercial samplers, and subsequently, the sample volume collected is also less (e.g., 50 mL vs. 1 L; Table 2). Bench testing has shown minimal cross-contamination between sample events, with a relatively long purge cycle time (90 s). We compared the performance of the autosampler to the ISCO 3700, a well-established commercially available device that represents the current “state of the art”. While the ISCO 3700 is larger and more expensive (∼3000 USD, relative to ∼300 for the new locally constructed sampler). The key differences between the two autosamplers are outlined in Table 2. It is, however, important to note that the field comparison was conducted during a medium sized storm event. Further testing across a wider range of event types is planned to ensure clogging or damage (abrasion) of the pump tubing is not an issue during extreme high flow events when larger sediment sizes are likely to be mobilised (e.g., coarse silt).
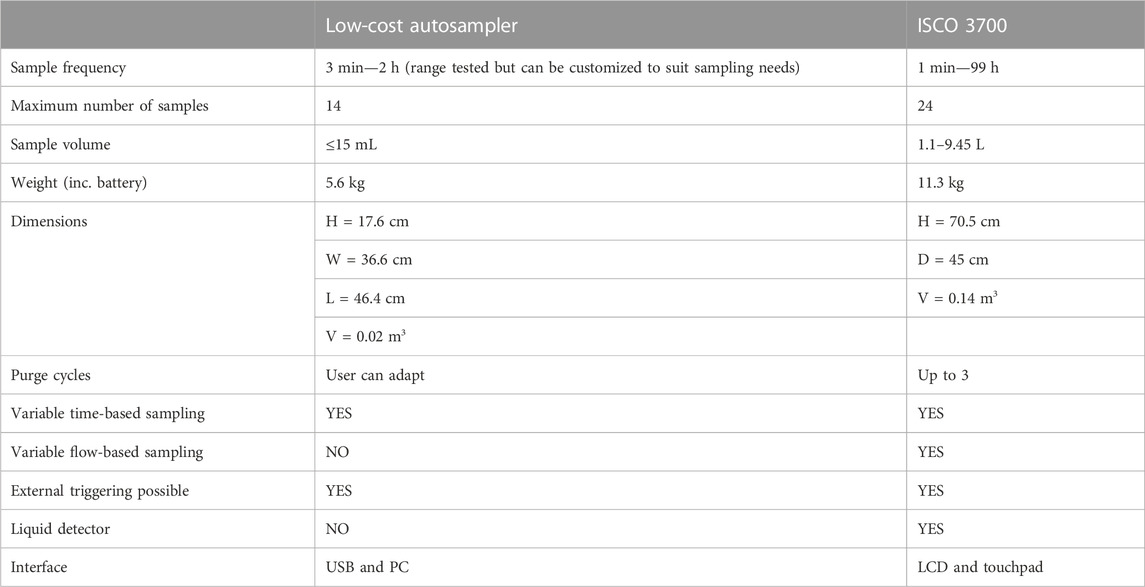
TABLE 2. Comparison of an ISCO 3700 sampler (i.e., industry-standard water quality sampler) vs. Autobot-WQ.
We have also demonstrated successful deployment of the autosampler in two use cases to measure water quality in engineered headwaters (e.g., gutters and drainpipes) and in urban river channels. The autonomous activation of the device through threshold triggered has enabled successful sampling of flashy, urban stormwater events. Furthermore, the small footprint enabled deployment within the urban fabric to capture highly localized (building-scale) precipitation events, which could not be adequately sampled using either conventional autosamplers or manual sampling. This resulted in new understanding of water quality dynamics at spatial resolutions of management relevance (Ouellet et al., 2021). The Autobot-WQ enabled us to, for the first time, determine the composition of dissolved organic matter rather than just a bulk measure (Ouellet et al., 2021). The absolute DOC concentrations for the green roofs in our study (11–17 mg/L) were lower than that observed for an experimental study in northern France (∼50 mg/L), but the relative differences between vegetated and non-vegetated roofs were comparable (Seidl et al., 2013), likely reflecting the differences in age and depth of the green roof soils.
4.1.1 Future developments and design improvements
The modular design means the microcontroller can be replaced by any of the expanding range of microcontrollers based on the Arduino platform, enabling specification and functionality to be matched to user requirements. For example, it would be possible to add wireless connectivity by using a microcontroller with cellular network capabilities (e.g., Arduino MKR GSM 140), enabling remote triggering of the autosampler. There is also the opportunity to incorporate an array of analog and digital water quality sensors (Méndez-Barroso et al., 2020). Having a dedicated device for both collecting water samples and logging high-frequency sensor data is particularly desirable from the perspective of adaptive monitoring and using threshold exceedance for specific water quality variables as a trigger for sample collection (Blaen et al., 2016). Furthermore, such an integrated monitoring platform can make it easier to calibrate and ground truth in-situ sensors (e.g., turbidity, nutrients), by targeting specific parts of the hydrograph or conditions associated with specific sensor readings.
The sample volume collected is relatively small (50 mL) and while this is suitable for measurement of macro-nutrient concentrations (N, P & C) and dissolved organic matter composition (fluorescence and absorbance), it means certain water quality variables cannot be measured (e.g., suspended sediment or Biochemical Oxygen Demand). Hence, careful consideration of the parameters to be measured is required and in some cases, it may be necessary to adapt the autosampler design. For example, the number of samples collected could be reduced and the sample holder platform redesigned to accept larger bottles (e.g., 500 mL). However, the size of the autosampler housing (0.02 m3) provides a hard limit to the maximum sample volume. The flow rate of the peristaltic pump (max of ∼0.5 L min−1 in the current design) and the resulting time required to collect larger volume samples may become problematic, particularly for the applications envisioned in the two use cases, which require rapid sampling to capture high-frequency stormwater response. The requirement for a PC and USB connection to interface with the device is a limitation, particularly for deployments during heavy rain. A future iteration with an LCD display and touchpad so user-defined parameters can be easily edited in the field and status of the autosampler (e.g., time and sample number) can be displayed would improve the user experience. An analog to a flow-based sampling routine could be developed by integrating an open-source water level sensor into the design (Paul et al., 2020), enabling full characterization of the storm hydrograph.
4.2 Potential applications in the context of urban pollution
So far, urban aquatic ecology has mainly focussed on describing patterns between levels of urbanization and urban stream water quality and ecology. We need to switch strategies if we genuinely want to create more resilient and sustainable urban ecosystems. Roche and Bogé, 1996 highlight the need for more explicit monitoring of urban physical and chemical conditions and associated ecological responses. This is essential to improve our understanding of the key urban drivers of ecological degradation and the mechanisms underlying the observed responses. This thinking also applies to global river pollution problems outside urban areas. We also need to do this across multiple cities and climates to compare results and put them in a broader global context, which is essential to creating more efficient mitigation solutions in the face of both urbanization and climate change. Although the applications of our autosampler are not limited to urbanization, and there is scope to utilize the Autobot-WQ for general river pollution issues, here we specifically discuss its use for addressing pressing questions regarding urban stream ecology (Figure 10).
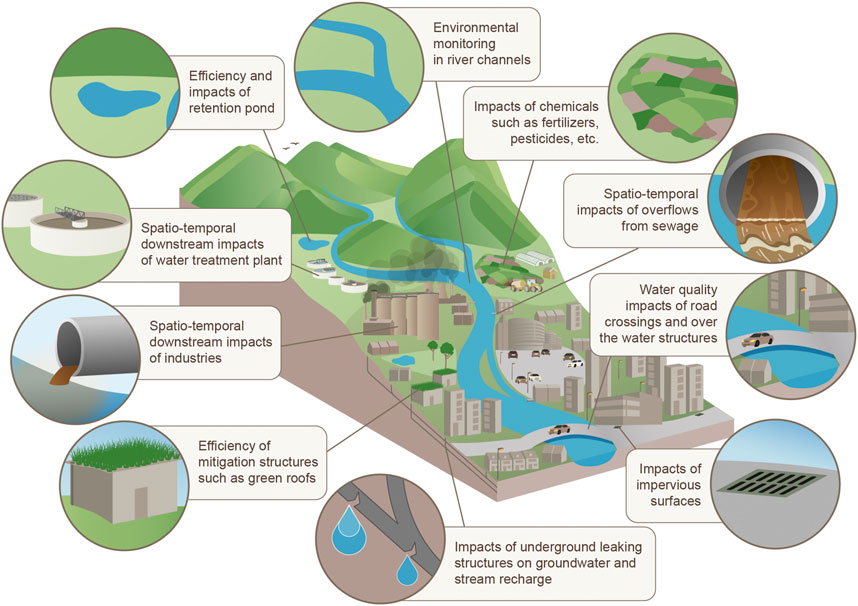
FIGURE 10. A conceptual representation of the varied monitoring scenarios required in heavily modified river catchments. The necessary high-density monitoring, which spans a gradient from the engineered headwaters to the main river channel, can be achieved using a lower-cost small footprint autosampler.
4.2.1 Cost-benefits efficiency of urban climate mitigation structures and strategies
Researchers and practitioners are considering the cost-benefits of restoring urban streams, building green infrastructures, and whether the investments are cost-effective (Liu et al., 2016; Mell et al., 2016). An adequate cost-benefit analysis of environmental engineering requires repeated fine-scale, and long-term monitoring. There is a need for easily deployable field equipment that is resilient to the demands of monitoring sampling sites that are difficult to access (e.g., the outflow of green infrastructures) (Figures 4, 10). Many outstanding research questions must be addressed to improve mitigation strategies to decrease urbanization’s impacts (Li et al., 2016; Kumar et al., 2020). To inform urban planning, there is a need to compare different designs at realistic scales (e.g., Ouellet et al., 2021). Building green infrastructures and implementing mitigation strategies should first target the most vulnerable areas but assessing vulnerability remains a challenge (Liu et al., 2016). Different frameworks account for mitigation strategies’ social, economic, and ecological values (Beatley, 2000; Mell et al., 2016). However, valuing the ecological cost is still daunting due to the lack of representative data for a wide range of structures and strategies. The Autobot-WQ helps address this issue since it facilitates direct sampling and subsequent measurement of water quality associated with different infrastructures, allowing for a direct evaluation of their efficiency, and factoring these data into ecological and economic cost-benefit analysis.
In our second use case, we showed that the Autobot-WQ can be used to compare different green infrastructure designs, such as different types of green roof, and assess their efficiency on a wide range of water quality parameters. Such data provide the needed information to support cost-benefit assessments of mitigation structures and strategies at different scales. Using the Autobot-WQ could also allow testing of the efficiency of paired green infrastructure to address specific urban challenges (e.g., to what extent do permeable pavements reduce the transport of road dust? What mitigation strategies are the most efficient in reducing delivery of road contaminants such as salt and tire-wear chemical compounds to urban streams? Johannessen et al., 2021). Our low-cost modular autosampler design enables replication across different climates to understand what adjustments need to be made to specific green infrastructures for different climate regimes (Vulova and Kleinschmit, 2019; Mullins et al., 2020).
4.2.2 Local to cumulative pollution sources
Urban landscapes are a mosaic of separated green areas, infrastructures, land uses, and pollution sources. This patchy distribution influences the strength of the cumulative impact of urbanization on aquatic systems, as well as the complexity of the interactions between urbanization and ecological responses (Grimm et al., 2008; Shen et al., 2014). Therefore, urban pollution must be understood at the local, regional and global scales (Grimm et al., 2008).
The Autobot-WQ can help move the monitoring of targeted urban features from point sources to watershed scales to build regional scale knowledge and understand cumulative pollution impacts (Figure 10). As it is low cost, easily deployed, and discrete (i.e., less visible), our autosampler can be deployed in urban areas to capture the spatio-temporal impacts of 1) effluents of water treatment and industries, 2) sewage plants and sewage overflow, and 3) drainage from streets, parks, and other urban surfaces. Having the possibility to simultaneously measure different sources of pollution along a gradient of urbanization is key to understanding the spatial distribution (i.e., how far downstream changes are being observed and what are the synergetic interactions) and the cumulative water quality impacts of pollution sources while gaining the spatially resolved insights to understand how each source is impacting urban stream water quality.
4.2.3 Modified hydrological dynamics
Impervious surfaces can cause water quality issues, including thermal pollution and change in runoff dynamics, impacting urban stream hydrological and thermal regimes (Croghan et al., 2019; Timm et al., 2020; 2021). The changes in these regimes are typically assessed by a handful of monitoring stations situated directly in the stream, making it challenging to tease apart the impacts of different sources and understand the spatio-temporal dimensions of their impacts.
By using the Autobot-WQ, it is possible to directly sample at the source, assessing the impacts of different urban features such as the drainage output of various impervious surfaces (e.g., parking lots, rooftops, and streets). Timm et al. (2021) pointed out that leaking underground pipe structures can impact baseflow conditions and thermal dynamics. However, it is challenging to detect where and when these leaks happen, but using adaptive sampling methods can help detect these anomalies (Blaen et al., 2016), which can then be monitored in more detail with our technology.
5 Conclusion and perspective
We have shown that the Autobot-WQ performance is comparable to a commercial autosampler and can thus be utilised to help answer pressing questions regarding water quality in urban areas. Autobot-WQ can facilitate finer scale monitoring (e.g., from gutter to river channel) to help identify various pollution sources and their cumulative impacts at the watershed scale. This new device can help realise recent calls to develop holistic understanding of the impacts of urbanization on natural resources such as water bodies (Elmqvist and Mcdonald, 2014). However, the utility of Autobot-WQ is wide reaching and not restricted to urban areas. The lightweight design and small size makes it also suitable for use in remote locations where it can be left for extended periods of time due to the low power sleep function and float switch trigger function. The size also makes it particularly useful for applications in logistically challenging environments; for example, where accessibility is difficult, space is restricted, there is a high risk of vandalism, or flow rates are small. The design can be adapted and modified to meet user specific requirements, including changing the number and volume of collected samples, or adding additional functionality such as water level or temperature sensors. Finally, given the relatively low cost, it is particularly suitable for Low-Middle Income countries where the cost of commercial alternatives is prohibitive and current information on water quality is particularly sparse (WHO, 2013; Capps et al., 2016).
Data availability statement
The datasets presented in this study can be found in online repositories. The names of the repository/repositories and accession number(s) can be found in the article/Supplementary Material.
Author contributions
KK, VO, DC, LH, AP, DH, and SK contributed to the conception and design of the studies. KK and VO designed the autosampler concept, while KK designed the mechanical and informatics components of the autosampler. DC and LH collected the data in Chicago, while KK and VO collected the data in Birmingham. KK and VO organized the database and performed the statistical analysis. KK and VO wrote the first draft of the manuscript. All authors read the manuscript and approved the submitted version.
Funding
The main funding for this project came from European Union’s Horizon 2020 Research and Innovation Programme under the Marie Sklodowska-Curie Grant Agreement number 34317 (HiFreq). This work was also supported by US National Science Foundation award number CBET-1848683.
Acknowledgments
The authors are thankful to the Chicago Botanic Garden and the University of Birmingham for allowing access. We also thank all researchers from the McCormick School of Engineering who supported field and laboratory activities associated with Case Study 2. Written informed consent was obtained from the individuals for the publication of any potentially identifiable images or data included in this article.
Conflict of interest
The authors declare that the research was conducted in the absence of any commercial or financial relationships that could be construed as a potential conflict of interest.
Publisher’s note
All claims expressed in this article are solely those of the authors and do not necessarily represent those of their affiliated organizations, or those of the publisher, the editors and the reviewers. Any product that may be evaluated in this article, or claim that may be made by its manufacturer, is not guaranteed or endorsed by the publisher.
References
Blaen, P. J., Khamis, K., Lloyd, C., Comer-Warner, S., Ciocca, F., Thomas, R. M., et al. (2017). High-frequency monitoring of catchment nutrient exports reveals highly variable storm event responses and dynamic source zone activation. J. Geophys. Res. Biogeosciences 122, 2265–2281. doi:10.1002/2017JG003904
Blaen, P. J., Khamis, K., Lloyd, C. E. M., Bradley, C., Hannah, D., and Krause, S. (2016). Real-time monitoring of nutrients and dissolved organic matter in rivers: Capturing event dynamics, technological opportunities and future directions. Sci. Total Environ. 569–570, 647–660. doi:10.1016/j.scitotenv.2016.06.116
Booth, D. B., Roy, A. H., Smith, B., and Capps, K. A. (2016). Global perspectives on the urban stream syndrome. Freshw. Sci. 35, 412–420. doi:10.1086/684940
Capps, K. A., Bentsen, C. N., and Ramírez, A. (2016). Poverty, urbanization, and environmental degradation: Urban streams in the developing world. Freshw. Sci. 35, 429–435. doi:10.1086/684945
Carvalho, M. C., and Eyre, B. D. (2013). A low cost, easy to build, portable, and universal autosampler for liquids. Methods Oceanogr. 8, 23–32. doi:10.1016/j.mio.2014.06.001
Carvalho, M. C. (2020). Portable open-source autosampler for shallow waters. HardwareX 8, e00142. doi:10.1016/j.ohx.2020.e00142
Chapman, D. V., Bradley, C., Gettel, G. M., Hatvani, I. G., Hein, T., Kovács, J., et al. (2016). Developments in water quality monitoring and management in large river catchments using the Danube River as an example. Environ. Sci. Policy 64, 141–154. doi:10.1016/j.envsci.2016.06.015
Croghan, D., Van Loon, A. F., Sadler, J. P., Bradley, C., and Hannah, D. M. (2019). Prediction of river temperature surges is dependent on precipitation method. Hydrol. Process. 33, 144–159. doi:10.1002/hyp.13317
Elmore, A. J., and Kaushal, S. S. (2008). Disappearing headwaters: Patterns of stream burial due to urbanization. Front. Ecol. Environ. 6, 308–312. doi:10.1890/070101
Elmqvist, T., and Mcdonald, R. I. (2014). Urbanization, biodiversity and ecosystem services: Challenges and opportunities: A global assessment. Springer, Heidelberg, Germany, doi:10.5860/choice.51-5590
Enochs, I. C., Formel, N., Shea, L., Chomiak, L., Piggot, A., Kirkland, A., et al. (2020). Subsurface automated samplers (SAS) for ocean acidification research. Bull. Mar. Sci. 96, 735–752. doi:10.5343/bms.2020.0018
Fork, M. L., Blaszczak, J. R., Delesantro, J. M., and Heffernan, J. B. (2018). Engineered headwaters can act as sources of dissolved organic matter and nitrogen to urban stream networks. Limnol. Oceanogr. Lett. 3, 215–224. doi:10.1002/lol2.10066
Grimm, N. B., Foster, D., Groffman, P., Grove, J. M., Hopkinson, C. S., Nadelhoffer, K. J., et al. (2008). The changing landscape: Ecosystem responses to urbanization and pollution across climatic and societal gradients. Front. Ecol. Environ. 6, 264–272. doi:10.1890/070147
Hannah, D. M., Abbott, B. W., Khamis, K., Kelleher, C., Lynch, I., Krause, S., et al. (2022). Illuminating the ‘invisible water crisis’ to address global water pollution challenges. Hydrol. Process. 36, e14525. doi:10.1002/hyp.14525
Hartmann, A., Luetscher, M., Wachter, R., Holz, P., Eiche, E., and Neumann, T. (2018). Technical note: GUARD -- an automated fluid sampler preventing sample alteration by contamination, evaporation and gas exchange, suitable for remote areas and harsh conditions. Hydrol. Earth Syst. Sci. 22, 4281–4293. doi:10.5194/hess-22-4281-2018
Jefferson, A. J., Bhaskar, A. S., Hopkins, K. G., Fanelli, R., Avellaneda, P. M., and McMillan, S. K. (2017). Stormwater management network effectiveness and implications for urban watershed function: A critical review. Hydrol. Process. 31, 4056–4080. doi:10.1002/hyp.11347
Johannessen, C., Helm, P., Lashuk, B., Yargeau, V., and Metcalfe, C. D. (2021). The tire wear compounds 6PPD-quinone and 1,3-diphenylguanidine in an urban watershed. Arch. Environ. Contam. Toxicol. 2, 171–179. doi:10.1007/s00244-021-00878-4
Kämäri, M., Tattari, S., Lotsari, E., Koskiaho, J., and Lloyd, C. E. M. (2018). High-frequency monitoring reveals seasonal and event-scale water quality variation in a temporally frozen river. J. Hydrol. 564, 619–639. doi:10.1016/j.jhydrol.2018.07.037
Ketabchy, M., Sample, D. J., Wynn-Thompson, T., and Yazdi, M. N. (2019). Simulation of watershed-scale practices for mitigating stream thermal pollution due to urbanization. Sci. Total Environ. 671, 215–231. doi:10.1016/j.scitotenv.2019.03.248
Khamis, K., Bradley, C., and Hannah, D. M. (2020). High frequency fluorescence monitoring reveals new insights into organic matter dynamics of an urban river, Birmingham, UK. Sci. Total Environ. 710, 135668. doi:10.1016/j.scitotenv.2019.135668
Khamis, K., Bradley, C., and Hannah, D. M. (2018). Understanding dissolved organicmatter dynamics in urbancatchments: Insights from in situufluorescence sensor technology. WIREs Water 5, 1–14.
Krause, S., Lewandowski, J., Dahm, C. N., and Tockner, K. (2015). Frontiers in real-time ecohydrology - a paradigm shift in understanding complex environmental systems. Ecohydrology 8, 529–537. doi:10.1002/eco.1646
Kuhlemann, L. M., Tetzlaff, D., and Soulsby, C. (2020). Urban water systems under climate stress: An isotopic perspective from Berlin, Germany. Hydrol. Process 34, 3758–3776. doi:10.1002/hyp.13850
Kumar, M., Deka, J. P., and Kumari, O. (2020). Development of water resilience strategies in the context of climate change, and rapid urbanization: A discussion on vulnerability mitigation. Groundw. Sustain. Dev. 10, 100308. doi:10.1016/j.gsd.2019.100308
Lee, H. J., Chun, K. W., Shope, C. L., and Park, J. H. (2015). Multiple time-scale monitoring to address dynamic seasonality and storm pulses of stream water quality in mountainous watersheds. WaterSwitzerl. 7, 6117–6138. doi:10.3390/w7116117
Li, Y., Zhang, X., Zhao, X., Ma, S., Cao, H., and Cao, J. (2016). Assessing spatial vulnerability from rapid urbanization to inform coastal urban regional planning. Ocean. Coast. Manag. 123, 53–65. doi:10.1016/j.ocecoaman.2016.01.010
Liu, W., Chen, W., Feng, Q., Peng, C., and Kang, P. (2016). Cost-benefit analysis of green infrastructures on community stormwater reduction and utilization: A case of beijing, China. Environ. Manage. 58, 1015–1026. doi:10.1007/s00267-016-0765-4
Lloyd, C. E. M., Freer, J. E., Johnes, P. J., and Collins, A. L. (2016). Using hysteresis analysis of high-resolution water quality monitoring data, including uncertainty, to infer controls on nutrient and sediment transfer in catchments. Sci. Total Environ. 543, 388–404. doi:10.1016/j.scitotenv.2015.11.028
Mantyka-Pringle, C. S., Martin, T. G., Moffatt, D. B., Linke, S., and Rhodes, J. R. (2014). Understanding and predicting the combined effects of climate change and land-use change on freshwater macroinvertebrates and fish. J. Appl. Ecol. 51, 572–581. doi:10.1111/1365-2664.12236
Mao, F., Clark, J., Buytaert, W., Krause, S., and Hannah, D. M. (2018). Water sensor network applications: Time to move beyond the technical? Hydrol. Process. 32, 2612–2615. doi:10.1002/hyp.13179
Mell, I. C., Henneberry, J., Hehl-Lange, S., and Keskin, B. (2016). To green or not to green: Establishing the economic value of green infrastructure investments in the Wicker, Sheffield. Urban For. Urban Green. 18, 257–267. doi:10.1016/j.ufug.2016.06.015
Méndez-Barroso, L. A., Rivas-Márquez, J. A., Sosa-Tinoco, I., and Robles-Morúa, A. (2020). Design and implementation of a low-cost multiparameter probe to evaluate the temporal variations of water quality conditions on an estuarine lagoon system. Environ. Monit. Assess. 192, 710. doi:10.1007/s10661-020-08677-5
Mullins, A. R., Bain, D. J., Pfeil-McCullough, E., Hopkins, K. G., Lavin, S., and Copeland, E. (2020). Seasonal drivers of chemical and hydrological patterns in roadside infiltration-based green infrastructure. Sci. Total Environ. 714, 136503. doi:10.1016/j.scitotenv.2020.136503
Ouellet, V., Khamis, K., Croghan, D., Hernandez Gonzalez, L. M., Rivera, V. A., Phillips, C. B., et al. (2021). Green roof vegetation management alters potential for water quality and temperature mitigation. Ecohydrology 14, 1–16. doi:10.1002/eco.2321
Palmer, M. A., Menninger, H. L., and Bernhardt, E. (2010). River restoration, habitat heterogeneity and biodiversity: A failure of theory or practice? Freshw. Biol. 55, 205–222. doi:10.1111/j.1365-2427.2009.02372.x
Paul, J. D., Buytaert, W., and Sah, N. (2020). A technical evaluation of lidar-based measurement of River Water levels. Water Resour. Res. 56, e2019WR026810. doi:10.1029/2019WR026810
Pucher, M., Wünsch, U., Weigelhofer, G., Murphy, K., Hein, T., and Graeber, D. (2019). staRdom: Versatile software for analyzing spectroscopic data of dissolved organic matter in R. Water 11, 2366. doi:10.3390/w11112366
Roche, H., and Bogé, G. (1996). Fish blood parameters as a potential tool for identification of stress caused by environmental factors and chemical intoxication. Mar. Environ. Res. 41, 27–43. doi:10.1016/0141-1136(95)00015-1
Rode, M., Wade, A. J., Cohen, M. J., Hensley, R. T., Bowes, M. J., Kirchner, J. W., et al. (2016). Sensors in the stream: The high-frequency wave of the present. Environ. Sci. Technol. 50, 10297–10307. doi:10.1021/acs.est.6b02155
Santos Santos, T. F., and Camacho, L. A. (2022). An integrated water quality model to support multiscale decisions in a highly altered catchment. Water 14, 374. doi:10.3390/w14030374
Seidl, M., Gromaire, M.-C., Saad, M., and De Gouvello, B. (2013). Effect of substrate depth and rain-event history on the pollutant abatement of green roofs. Environ. Pollut. 183, 195–203. doi:10.1016/j.envpol.2013.05.026
Shen, Z., Hou, X., Li, W., and Aini, G. (2014). Relating landscape characteristics to non-point source pollution in a typical urbanized watershed in the municipality of Beijing. Landsc. Urban Plan. 123, 96–107. doi:10.1016/j.landurbplan.2013.12.007
Somers, K. A., Bernhardt, E. S., Mcglynn, B. L., and Urban, D. L. (2016). Downstream dissipation of storm flow heat pulses: A case study and its landscape-level implications. J. Am. Water Resour. Assoc. 52, 281–297. doi:10.1111/1752-1688.12382
Timm, A., Ouellet, V., and Daniels, M. D. (2021). Riparian land cover, water temperature variability and thermal stress for aquatic species in urban streams. Water 13, 2732. doi:10.3390/w13192732
Timm, A., Ouellet, V., and Daniels, M. (2020). Swimming through the urban heat island: Can thermal mitigation practices reduce the stress? River Res. Appl. 36, 1973–1984. doi:10.1002/rra.3732
Tyagi, S., Sharma, B., Singh, P., and Dobhal, R. (2020). Water quality assessment in terms of water quality index. Am. J. Water Resour. 1, 34–38. doi:10.12691/ajwr-1-3-3
Vulova, S., and Kleinschmit, B. (2019). Thermal behavior and its seasonal and diurnal variability of urban green infrastructure in a mid-latitude city-Berlin. 2019 Jt. Urban Remote Sens. Event, JURSE 2019, 9–12. doi:10.1109/JURSE.2019.8809011
Walsh, C. J., Roy, A. H., Feminella, J. W., Cottingham, P. D., Groffman, P. M., and Morgan, R. P. (2005). The urban stream syndrome: Current knowledge and the search for a cure. J. North Am. Benthol. Soc. 24, 706–723. doi:10.1899/04-028.1
Ward, A. S., Packman, A., Bernal, S., Brekenfeld, N., Drummond, J., Graham, E., et al. (2022). Advancing river corridor science beyond disciplinary boundaries with an inductive approach to catalyse hypothesis generation. Hydrol. Process 36. 0–3. doi:10.1002/hyp.14540
Wells, Z. R. R., McDonnell, L. H., Chapman, L. J., and Fraser, D. J. (2016). Limited variability in upper thermal tolerance among pure and hybrid populations of a cold-water fish. Conserv. Physiol. 4, cow063. doi:10.1093/conphys/cow063
Keywords: environmental monitoring, water quality, hydrology, urban rivers, open source
Citation: Khamis K, Ouellet V, Croghan D, Hernandez Gonzalez LM, Packman AI, Hannah DM and Krause S (2023) The Autobot-WQ: A portable, low-cost autosampler to provide new insight into urban spatio-temporal water quality dynamics. Front. Built Environ. 9:1072757. doi: 10.3389/fbuil.2023.1072757
Received: 17 October 2022; Accepted: 20 March 2023;
Published: 13 April 2023.
Edited by:
Xian Yang, Hong Kong Baptist University, Hong Kong SAR, ChinaReviewed by:
Juan Pablo Rodríguez Sánchez, University of Los Andes, ColombiaAhmet Cilek, Arizona State University, United States
Copyright © 2023 Khamis, Ouellet, Croghan, Hernandez Gonzalez, Packman, Hannah and Krause. This is an open-access article distributed under the terms of the Creative Commons Attribution License (CC BY). The use, distribution or reproduction in other forums is permitted, provided the original author(s) and the copyright owner(s) are credited and that the original publication in this journal is cited, in accordance with accepted academic practice. No use, distribution or reproduction is permitted which does not comply with these terms.
*Correspondence: Kieran Khamis, ay5raGFtaXNAYmhhbS5hYy51aw==
†Present addresses: Valerie Ouellet, Integrated Statistics Contractor for National Oceanic and Atmospheric Administration, Northeast Fisheries Science Center, Orono, ME, United States;Danny Croghan, University of Oulu, Oulu, Finland;Liliana M. Hernandez Gonzalez, Lynker Contractor for National Oceanic and Atmospheric Administration, Office of Water Prediction, National Water Center, Tuscaloosa, AL, United States
‡These authors have contributed equally to this work and share first authorship