 Ishan Tripathi
 Thomas M. Froese
 Shauna Mallory-Hill
- 1Department of Civil Engineering, University of Victoria, Victoria, BC, Canada
- 2School of Architecture, University of Manitoba, Winnipeg, MB, Canada
Post Occupancy Evaluations (POE) provided a systematic methodology for determining the performance gap between expected and actual performance. Monitoring quality of the indoor environment is essential for understanding building performance in relation to occupant health, wellbeing, and comfort. Because of the global COVID-19 pandemic, researchers faced numerous issues accessing the building for collecting data and making spot measurements of the indoor environment. Technologies such as Building Information Modeling (BIM), Internet of Things (IoT), and Geographical Information Systems (GIS) have the potential to address existing challenges for data collection, analysis, and visualization in post occupancy evaluations. This study aims to explore the applications of a BIM-IoT-GIS-integrated digital twin for post occupancy evaluations. First, high-level use case scenarios are developed to derive system requirements for a digital twin platform. Second, four tests are conducted that provide a step-by-step procedure for BIM-IoT-GIS integration. Third, the integration is validated by geo-reference checks, data transfer checks, and visual checks. Based on the tests, a streamlined workflow is recommended for similar/future projects. The results demonstrate that Revit-ArcGIS Pro integration meets the system requirements for post occupancy evaluations. Moreover, as shown in the graphical abstract (Figure), the spatial-temporal capabilities of ArcGIS Pro enable continuous monitoring and visualization of building performance in 4D. In conclusion, BIM-IoT-GIS integration can provide a solid foundation for developing a centralized digital twin for post occupancy evaluations and enables researcher to collect and analyze the data without being physically present in the building.
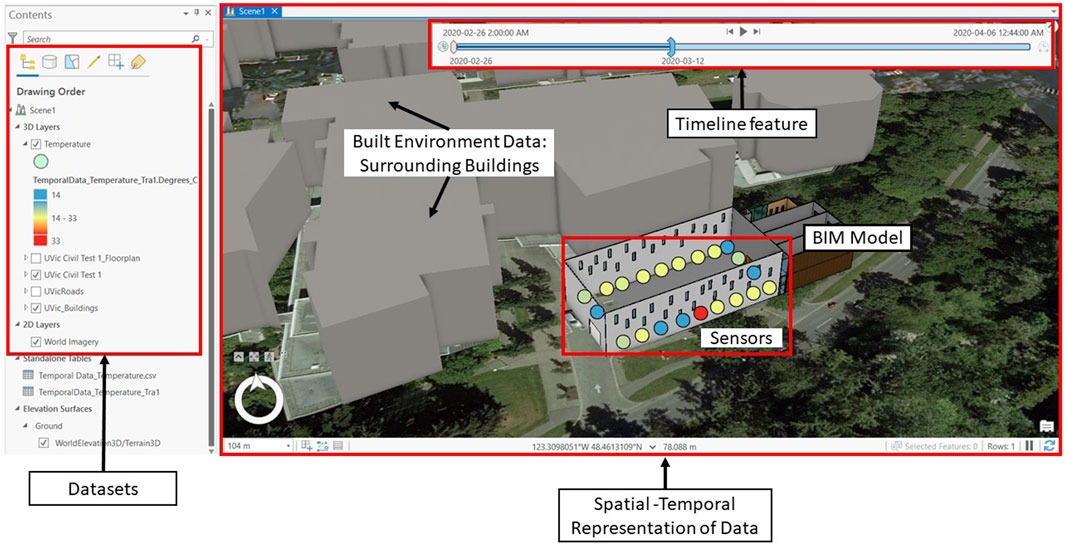
GRAPHICAL ABSTRACT | The integration of BIM model (Revit) and sensors’ data (Excel) with ArcGIS Pro.
1 Introduction
Standards and certification systems such as Leadership in Energy and Environmental Design (LEED), Green Globe, WELL, Passive House, and Living Building challenge have inspired designers to incorporate innovative solutions and newer technologies in the built environment. Green buildings are expected to reduce energy consumption and Greenhouse gas (GHGs) emissions while improving the quality of the built environment (Tripathi and Froese, 2020; Li, Froese, and Brager, 2018; Mallory-Hill, Preiser, and Watson, 2012). People spend the majority of their time indoors (Al Horr et al., 2016). The Indoor Environment Quality (IEQ) impacts occupants’ health, wellbeing, and productivity (P. Li, Froese, and Brager, 2018; Kim and de Dear, 2012; Leccese et al., 2021). Moreover, IEQ provides an insight into building performance in relation to occupant comfort and satisfaction (Pollard et al., 2021).
Factors such as energy consumption, GHG emissions, IEQ and occupancy make up a building’s overall performance. To determine the gaps between the design and the expected overall performance of a building, POE have gained more significance (Olivia and Christopher, 2015). Current methods of capturing performance data for key performance indicators (KPIs) such as water consumption, energy consumption, and IEQ factors: lighting, acoustics, temperature and humidity, air quality, etc., are not sufficient for determining spatial-temporal variations (Pollard et al., 2021). For example, the indoor thermal comfort data is often captured manually with spot measurements and presented in 2D graphs, making it difficult to associate with the space directly. The challenges of similar nature can be observed for other KPIs as well. Therefore, a paradigm shift from independent to continuous evaluations is required to improve the overall efficiency of POE. These continuous evaluations will enable the analysts to accumulate and visualize data relative to the space over the desired time. Furthermore, continuous monitoring of the built environment will capture detailed information about changes that may get overlooked during just high-level assessments (P. Li, Froese, and Brager, 2018).
Internet of Things (IoT)—based sensors offer cost-effective solutions for continuous monitoring of the built environment. Building Information Modeling (BIM) applications are evolving to accommodate the post-construction phases such as commissioning, operations, and facilities management (Kang and Hong, 2015; L; Li et al., 2021). In parallel, Geographical Information Systems (GIS) has evolved to become a robust science for analyzing and visualizing spatial-temporal information in urban and rural systems as well as the built environment (Song et al., 2017). Taking advantage of the strengths of each of these evolving technologies, integrating BIM and IoT data with a GIS environment provides a solid foundation for creating a virtual version of the physical asset–commonly referred to as a “digital twin” in the Architecture, Engineering and Construction (AEC) industry. Using digital twins for POE will not only address the ongoing challenges in data collection, analysis and visualization to improve the overall efficiency (Tripathi and Froese, 2020; P; Li, Froese, and Brager, 2018; Mallory-Hill and Gorgolewski, 2018) but also drive the transition towards continuous and detailed evaluations (Ammar et al., 2022).
This research explores the use of BIM-IoT-GIS integrated digital twin for POE. Section 1 highlights the need of digital twins for continuous monitoring and detailed analysis of the built environment. Section 2 defines key concepts in the context of this research and provides a review of related literature and similar studies. The core contribution of this research is presented in two main phases. Section 3 gives an overview of the methods used for both phases: deriving system requirements for POE and tests conducted for BIM-IOT-GIS integration. Section 4 discusses the use cases developed for deriving system requirements. Sections 5.2, 5.3 demonstrate a step-by-step procedure for BIM-GIS integration and validation. Section 5.4 recommends a streamlined BIM-IoT-GIS integration workflow for similar projects and Section 6 discusses the limitations.
2 Points of departure
2.1 Summary of key concepts
2.1.1 Facility management/facilities management (FM)
Facilities management generally refers to the management of built facilities during their operational phases, including tasks such as maintenance, repair, and renovation. As described by the International Facility Management Association, “Facility management (FM) is a profession that encompasses multiple disciplines to ensure functionality, comfort, safety, and efficiency of the built environment by integrating people, place, process, and technology.” (“IFMA - International Facility Management Association”, 2022)
2.1.2 Post Occupancy Evaluations (POE)
POE is a scientific method used for obtaining feedback about various parameters such as energy use, water use, IEQ, and occupant behaviour that influence the building performance (P. Li, Froese, and Brager, 2018; Roberts et al., 2019). The obtained data can be used to calculate KPIs to determine the differences between the designed and actual performance of the buildings.
2.1.3 Internet of things (IoT)
IoT refers to the network of interconnected sensors and software designed to communicate with other devices and people over the internet (“What Is the Internet of Things (IoT)?”, 2022). They offer cost-effective solutions for continuous monitoring of the built environment (Shahinmoghadam and Motamedi, 2019). IoT sensors are extensively used in the FM industry for predictive maintenance analysis of various assets (Villa et al., 2021).
2.1.4 Building information modeling (BIM)
BIM can be summarized as a system of creating, sharing, exchanging, and managing information among the stakeholder throughout the project lifecycle (Song et al., 2017). With the range of applications from design coordination to facilities management, BIM is leading the digital transformation of the AEC industry. As more information is added during each phase of the building lifecycle, the BIM model evolves from containing geometrical information to a data-rich model that can be used as a data source for developing the digital twin (Borrmann et al., 2018).
2.1.5 Digital twin
The digital twin can be defined as a digital representation of a physical asset. The physical asset and its digital twin are linked and constantly exchange data in real-time throughout the Plan–Build–Operate and Integrate of the lifecycle. Technologies such as IoT enable dynamic data gathering and exchange (buildingSMART international, 2020).
2.1.6 Geographic information system (GIS)
GIS is a system to collect, manage, modify and analyze geographical data (Martindale, 2022). GIS can provide information about the built environment, such as weather and surroundings. (D’Amico et al., 2020). It facilitates spatial-temporal data analysis in a 3D environment along with the management of large datasets.
2.2 Project dasher 360
Project Dasher is a multi-disciplinary research project conducted by Autodesk, and—as a tool that has been used for several research projects but is not currently available as commercial software—it is an example of the current state-of-the art in representing building performance data in a digital twin-type of format. It features a BIM-based platform created with APIs from Autodesk Forge that enables real-time visualization of building performance (“Project Dasher”, 2022). Figure 1 demonstrates the user interface of Dasher 360. Moreover, it has a time-liner feature for visualizing time-series data. Intuitive navigation features and enabling/disabling layers make the web-based model easier to operate. However, it does not feature any provisions for integrating the surrounding environment data. Also, integrating multiple BIM models over a large geographical area in the same interface would be challenging.
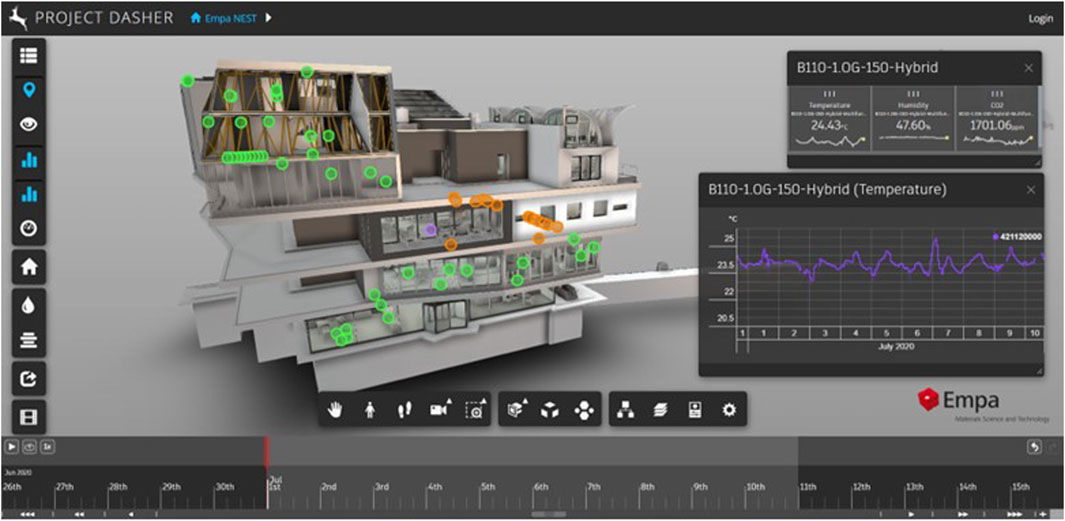
FIGURE 1. Project dasher 360 user interface (“Project Dasher”, 2022).
2.3 Interoperability between BIM and GIS
The main purpose of combining BIM with GIS is to integrate strong components of both systems for creating a data-rich virtual model of assets within the built environment (Song et al., 2017). BIM provides detailed information about the geometry, materials, and other parameters of the asset. GIS provides spatial information that can be used for in-depth analysis of the built environment. BIM is widely used for improving efficiency in design coordination and construction management. GIS has evolved into a robust system that supports spatial-temporal analysis and visualization of data sets for large-scale urban environments. Both BIM and GIS have tools and procedures for visualizing data in 3D environment. Considering BIM can add detailed semantic information to GIS, and GIS provides geospatial context to BIM models, integrating BIM-GIS has great potential for facilities management by providing spatial-temporal analysis and management tools (Ohori et al., 2017; Song et al., 2017).
BIM and GIS can be integrated at the data layer and the application layer. Data layer usually refers to the transfer of geometric and semantic information between the platforms, whereas the application layer extends the scope of both BIM and GIS by enhancing each of their capabilities (Zhu et al., 2019). BIM models can be automatically geo-referenced with appropriate GIS integration (Diakite and Zlatanova, 2020). Geo-referenced BIM models can then be imported into GIS with added built environment data such as surroundings, terrain, and weather (Zhu et al., 2019). The open-source BIM file format IFC is most frequently used in previous studies for importing BIM models into GIS (Zhu et al., 2019; Biljecki and Tauscher, 2019; D’Amico et al., 2020; Basir et al., 2020). Minor discrepancies related to data loss have been documented during the conversion from IFC file format to Multi-patch shapefiles (Biljecki and Tauscher, 2019; Basir et al., 2020).
The tools for BIM-GIS integration are constantly evolving over the past few years with the increase in the number of studies exploring the applications of this topic (Song et al., 2017). Indoor data mapping with BIM-GIS integration improves navigation in a complex environment (Pang et al., 2018) and can be used for indoor mobility analysis (Petrenko et al., 2014), and evacuation planning for emergency response (Tashakkori, Rajabifard, and Kalantari, 2015; Syed Abdul Rahman and Abdul Maulud, 2019). Moreover, the indoor mapping feature of BIM-GIS is useful for collecting data for assessing the impact of human behavior on building performance, which is a known challenge in previous POE studies (Wang, Pan, and Luo, 2019). Facilities management is the longest phase of a construction life cycle where applications of BIM-GIS integration can be used to manage large datasets. In the context of POE, a BIM-IOT-GIS integrated digital twin can be developed for continuous monitoring and visualization of building performance.
3 Materials and methods
This section explains the methodology for combining BIM and GIS to create a digital twin that integrates data collected by building performance monitoring sensors. The GIS integrated digital twin facilitates the visual representation of continuous monitoring within the corresponding 3D space in the BIM model.
The key contributions of this paper are presented in two phases. Phase 1 represents the use case scenarios developed for capturing the system requirements to create a digital twin for POE. Phase 2 represents the actual step-by-step tests conducted for integrating the BIM model and sensors’ data into GIS. Findings from Phase 2 are summarized and converted into a workflow that can be replicated for future projects.
3.1 Phase 1: system requirements for POE
Use case scenarios created with the Unified Modeling Language (UML) are a proven approach for capturing system requirements (O’Neill, 2018). They are made of simple diagrams and texts that describe the interactions of users and external factors with the system for carrying out specific tasks (Grover, Li, and Froese, 2015). For this research, use cases scenarios are developed to depict high-level activities to be performed by potential users in a system that incorporates a digital twin for POE. Then, the use cases are used to derive specific requirements for a system that can host a digital twin that can integrate BIM, GIS, and sensors’ data.
3.2 Phase 2: BIM–IoT–GIS integration
3.2.1 Tests
The tests are designed to represent the tasks to be conducted by potential users of BIM-GIS integration for POE-related activities. They provide a systematic procedure for integrating BIM and sensors’ data with the GIS ecosystem.
3.2.2 Validation
A geo-referenced BIM model is the foundation of a GIS integrated digital twin. As summarized in the literature review section, loss of data during integration is one of the main challenges of BIM-GIS interoperability. There are no established methods for the validation of BIM-GIS integration. Moreover, the BIM-GIS integration should meet the system requirements for POE. Table 1 describes the three types of checks used for this study.
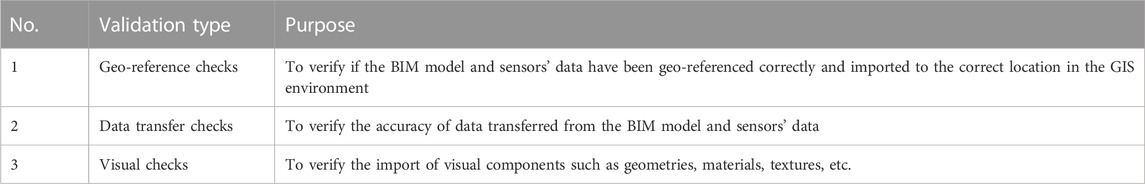
TABLE 1. Validation of BIM-GIS integration.
4 Phase 1: system requirements for POE
A digital twin platform that integrates the BIM model, IoT sensors’ data, and GIS will improve the overall efficiency of POE (Tripathi and Froese, 2020). The focus of this integration targets three applications that improve the data collection, management, data analysis, and data visualization for POE. Figure 2 describes the potential applications of this integration.
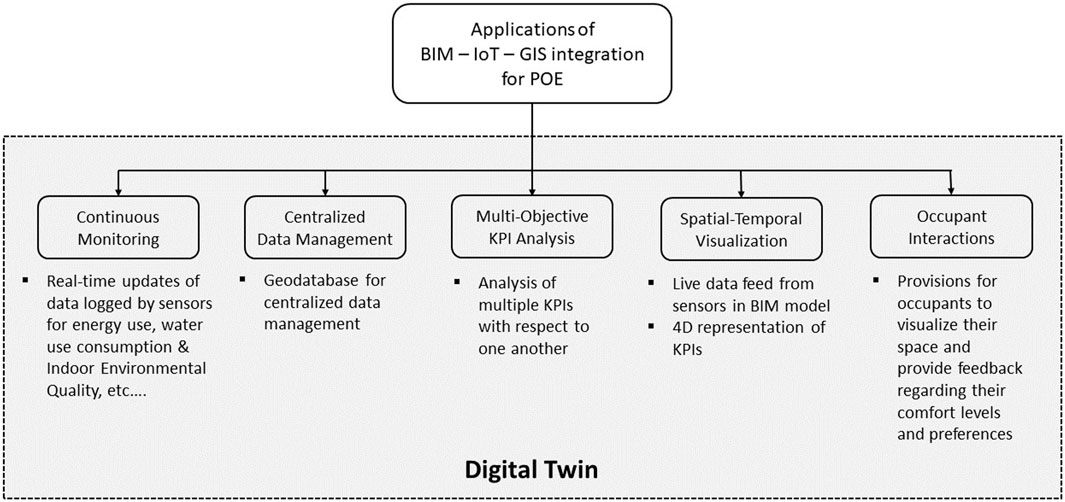
FIGURE 2. Applications of BIM-IOT-GIS integration for POE.
IoT-based sensors for monitoring building performance constantly collect data about key performance indicators (KPIs) such as energy use, water use, and indoor environmental quality. Spatial and temporal analysis tools in GIS can use geometric data extracted from BIM models and sensors’ data to calculate the values for KPIs. A geo-referenced BIM model located in the built environment incorporating real-time sensors’ data creates a 4D spatial-temporal visualization that can be used for preliminary analysis and decision-making. Spatial-temporal analysis and visualization enable the possibilities of multi-objective analysis where multiple parameters or calculated KPIs can be visualized relative to one another. With the muti-objective analysis, visible co-relations among multiple KPIs can be established.
For example, visualizing weather data, indoor thermostat data, building façade data for R values, natural lighting, and roof monitoring can help researchers establish a correlation between the impact of the indoor and the outdoor environment on the environment energy expenditure with relation to occupant comfort. The potential of such digital twins can exceed the typical applications of digital twins, POE and FM.
4.1 Use case scenarios for POE
This section presents four high-level use case scenarios for creating a digital twin using BIM-GIS integration for POE. Scenarios 1, 2, and 3 illustrate the individual tasks to be performed by potential users. Scenario 4 is developed to demonstrate an application that involves the interaction of potential users and external datasets with the system.
4.1.1 System users
The operations/FM phase is the longest phase of a building life cycle. Facility managers and building operators often make decisions about the building operations. Also, occupant behaviour has an influence on building performance. The majority of the POE studies have been conducted by academic researchers. Therefore, the potential users of the digital twin for POE are enlisted below:
Facility managers/building operators
POE analysts (Academic researchers and/or industry professionals)
Occupants
4.1.2 Scenario 1: data integration for building operations/facilities management
In the first use case (Figure 3), the facility manager and/or building operator initiates the process by linking sensors’ data, spot measurements, and occupant survey responses with the curated BIM model of the facility. The integrated data creates a virtual representation of the physical building. These datasets are used for creating workflows for performance analysis and visualization. The results are used to create an index that shows occupant satisfaction within the built environment. If there are multiple facilities involved, this scenario also extends to comparing the performance of similar facilities for various purposes of POE.
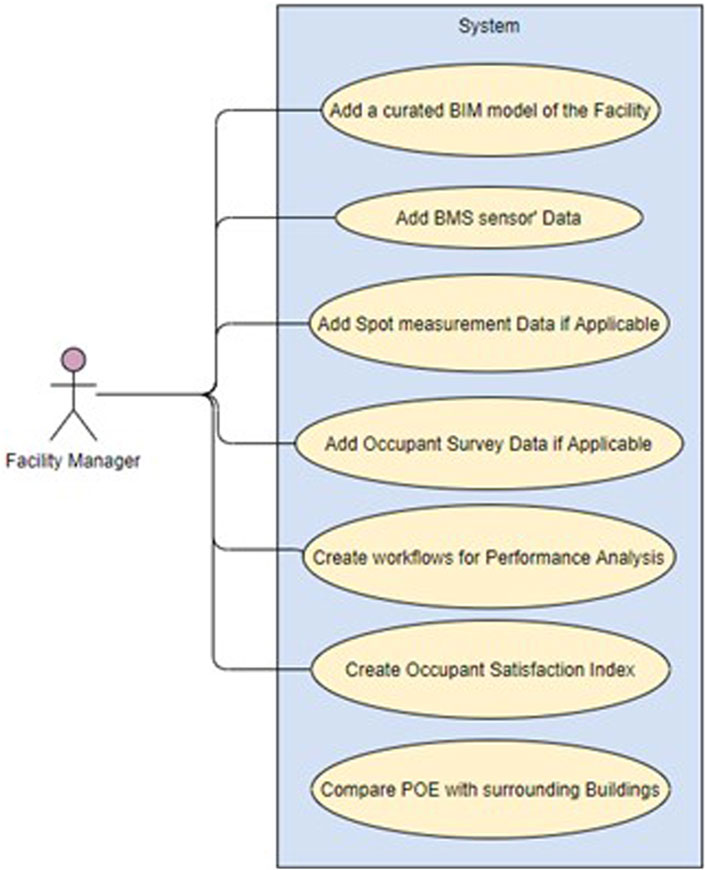
FIGURE 3. Use case for the facility manager.
4.1.3 Scenario 2: data analysis for POE
In the second use case (Figure 4), analysts create their own profiles to view the digital twin. They can navigate the BIM model and visualize the sensors’ data easily. Moreover, they have the option to perform in-depth analysis. They can also create custom visualization and produce different charts. The results are used to communicate the findings and make decisions for operational changes and/or retrofits. However, they do not have access to editing the data entered by the facility manager.
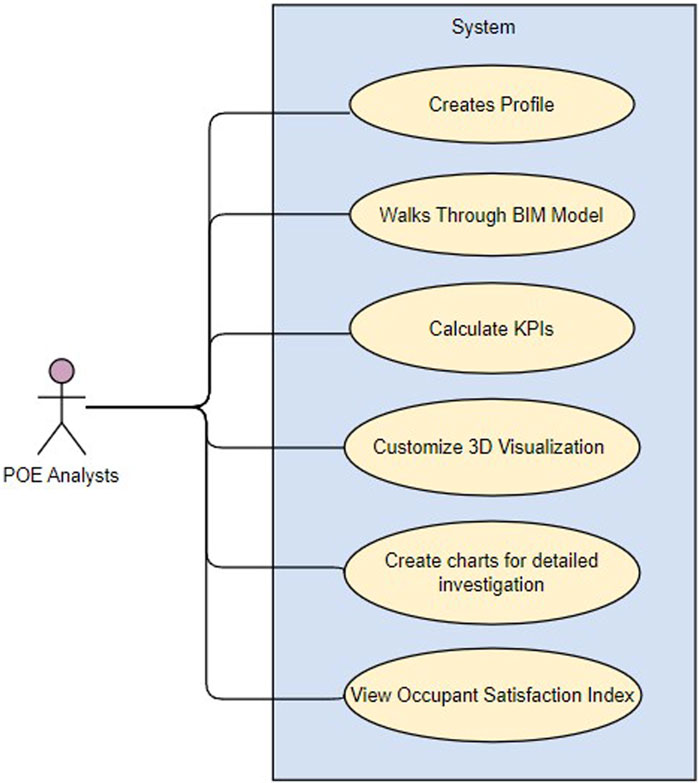
FIGURE 4. Use case for POE analysts.
4.1.4 Scenario 3: occupant feedbacks for comfort levels
In the third use case (Figure 5), the occupants are given access to walk through the BIM model. They can navigate to their corresponding areas to visualize the KPIs. Furthermore, they have the option to provide feedback through survey forms that are used to create the occupant satisfaction index.
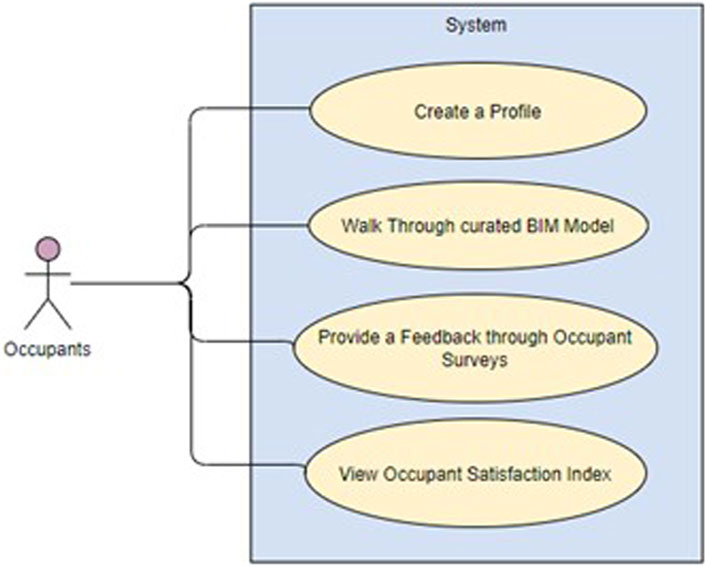
FIGURE 5. Use case for occupants.
4.1.5 Scenario 4: example: visualizing thermal comfort
This use case (Figure 6) illustrates the interactions between end-users and external datasets with the system for the task of “calculating and visualizing thermal comfort” within the building. The facility manager creates a digital twin by integrating and categorizing indoor thermostat data with the curated BIM model. POE analysts can walk around the BIM model and perform analysis to identify any potential gaps. Furthermore, the occupants can navigate the BIM model and have the option to provide feedback on their temperature comfort levels. The feedback is used as a data source to create the occupant satisfaction index that can be viewed by all the end-users (Facility managers, researchers, and occupants). Similar use cases can be developed for scenarios such as water use, energy use, and monitoring of IEQ.
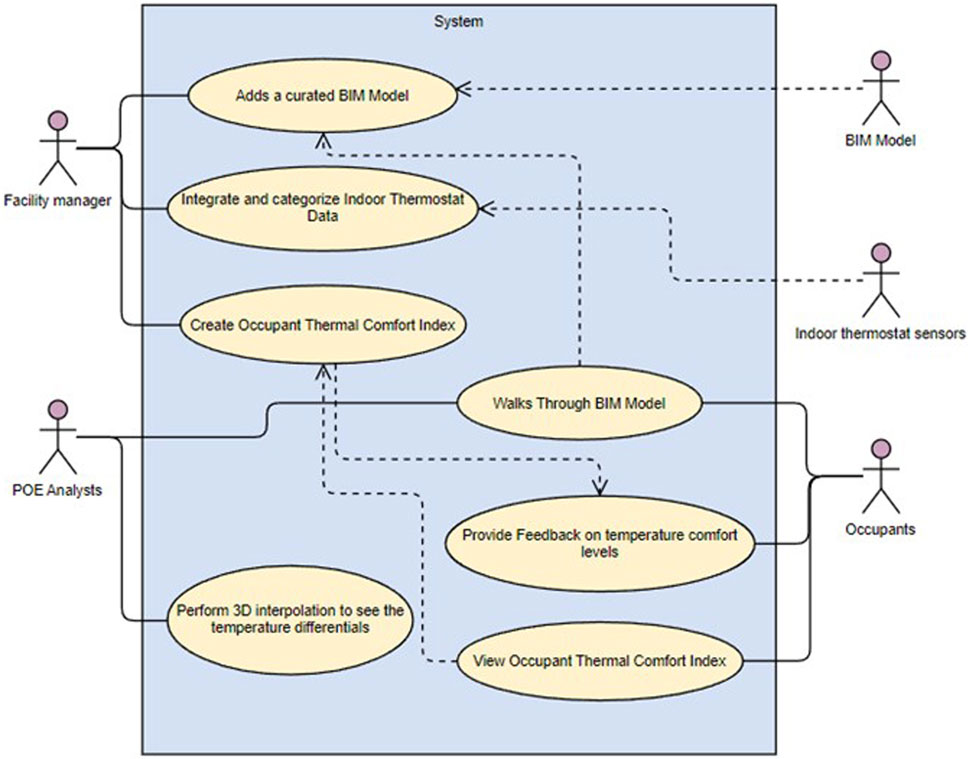
FIGURE 6. A use case example for visualizing and calculating thermal comfort within the building.
4.2 List of system requirements
From the use case scenarios, the requirements of a system that can integrate BIM, GIS, and sensors’ data are listed below:
• Integrate geo-referenced BIM Model
• Integrate building management sensors’ data from database or spreadsheet
• Categorize and co-relate the sensors data within appropriate space
• Create 3D visualization based on KPI threshold values
• Visualize KPI with respect to time and space. i.e., able to see different values at user-defined time intervals
• Create charts for KPI calculations
• Customize visualization to demonstrate desired threshold levels for different KPIs
• Incorporate occupant’s feedback and provide a subjective occupant comfort index
5 Phase 2: BIM–IoT–GIS integration
This section describes the detailed procedure followed for the integration of a BIM model created in Revit and sensors’ data from a spreadsheet to ArcGIS Pro. The series of experiments are conducted in alignment with use cases. The test results are used to recommend an optimized workflow (Section 5.4) that can be replicated for other projects.
5.1 Digital infrastructure
The laptop used for hosting STTC digital twin has the following configurations: Intel i5 8th generation processor, 16 GB RAM, 512 GB SSD, and 4 GB Nvidia GTX 1050Ti GPU.
All the software mentioned below have academic licenses distributed through the University of Victoria.
First, Revit 2020 is used as a preferred software to create and manage BIM model. It is one of the most used parametric modeling software within the AECO industry. Second, MS Excel is used as a source provider software for building sensors data. Most of the sensors log their data into the database format. And that database can be exported into the comma-separated file format (.csv) that can be opened via Excel. Third, ArcGIS Pro (version 2.6 onwards) is used as a platform to integrate Revit model and Excel data is a GIS software that supports visualization, advanced analysis, and data management in 2D, 3D, and 4D.
5.2 Tests
This section describes four tests conducted for demonstrating the development of a digital twin by integrating BIM model (Revit) and sensors’ data (Excel) to ArcGIS Pro. These tests demonstrate the step-by-step procedure followed to achieve the goal for use case scenario #4: visualizing thermal comfort (Section 4.1, Scenario 4).
5.2.1 Project scenario
A hypothetical project scenario has been considered for the tests. The building located on the campus of the University of Victoria is modeled using Revit. The largest area of the building is equipped with indoor thermostat sensors. The auxiliary sensor dataset is created in excel. The coordinate system WGS 84 UTM Zone 10 N is used for geo-referencing both ArcGIS Pro and Revit models (Appendix A).
5.2.1.1 Test 1: adding the revit model to ArcGIS pro
5.2.1.1.1 Procedure
• Geo-reference Revit Model using Project Base Point and Survey Point as shown in step 1, Figure 7. ArcGIS Pro is not usually part of the BIM workflows in the AEC industry; therefore, the values of these reference points are taken from Google Earth Pro. However, ArcGIS can also provide the value of the coordinates.
• Create a new local scene in ArcGIS Pro and assign WGS 84 UTM Zone 10 N as the projected coordinate system for this project. Refer to Appendix A for types of coordination systems.
• Import the Revit Model into ArcGIS Pro and place it at the correct location by using the Define Projection tool.
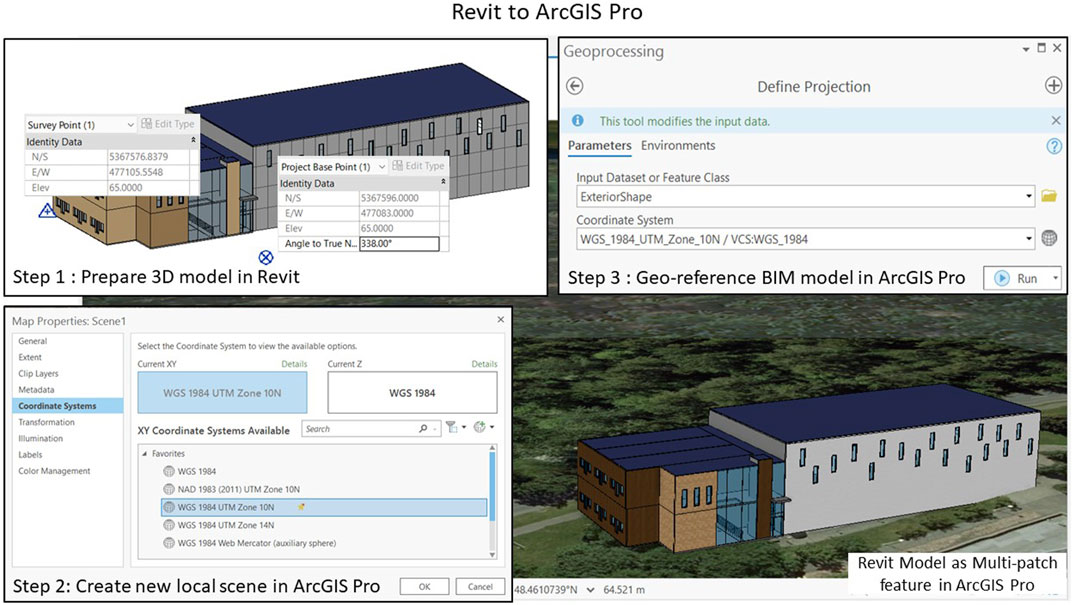
FIGURE 7. Procedure for importing Revit model to ArcGIS Pro.
5.2.1.1.2 Results and discussions
• From version 2.6, ArcGIS Pro automatically converts Revit Files to multi-patch features. As shown on the bottom right of Figure 7, the Revit model has been imported at the correct location in ArcGIS Pro.
5.2.1.2 Test 2: adding sensors’ locations to ArcGIS pro
Modeling sensors’ locations in a BIM model is not a part of a regular workflow for most BIM projects in the AEC industry. Moreover, POE involves a lot of spot measurement data. The purpose of this test is to determine how to import the sensors’ locations in ArcGIS Pro in such a way that it can be used for various analyses and visualization for POE.
5.2.1.2.1 Procedure
• Determine coordinates of indoor thermostat sensors in ArcGIS Pro and prepare an excel file containing X, Y, and Z values of the locations as shown in Step 1, Figure 8. X value, Y value and Z value corresponds to latitude, longitude, and elevation, respectively.
• Import sensors’ locations as a point feature class in ArcGIS Pro by using XY Table to Point geoprocessing tool
• Place the imported sensors to the correct location by using the Define Projection tool and assign the same project coordination system as the project.
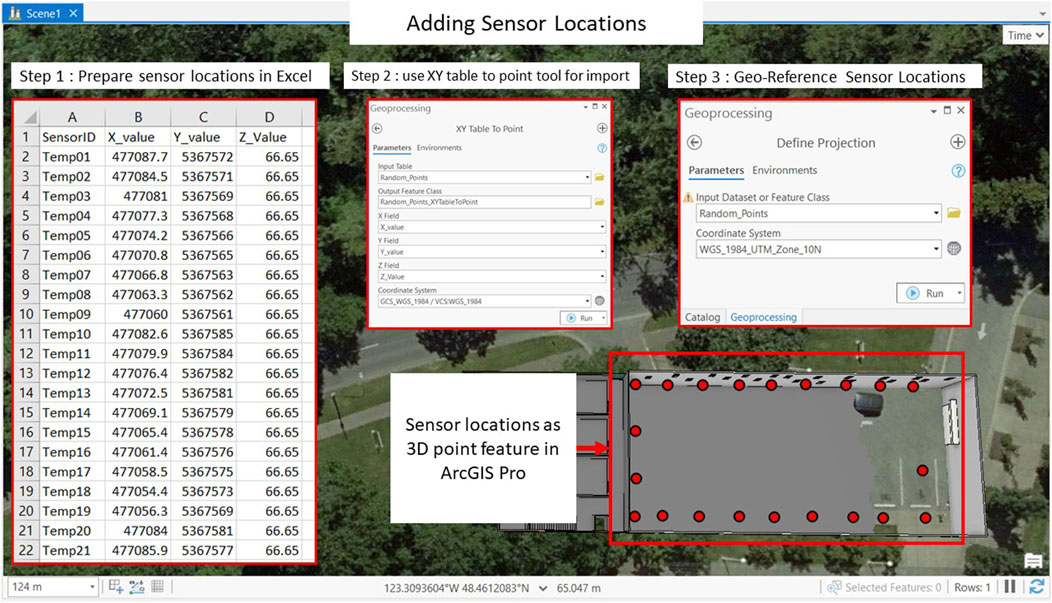
FIGURE 8. Adding sensor locations as 3D point features.
5.2.1.2.2 Results and discussions
• As shown in Figure 8, the sensors’ data imported as a point feature class are very useful in categorizing and distinguishing between various sensor types. Therefore, adding sensors as 3D points would be useful for attaching values to correct sensor locations and streamline the integration process in ArcGIS Pro. The sensors imported as 3D location points represent the value measured and logged by sensors. The same procedure can be followed for the spot measurements taken for different IEQ parameters for POE.
5.2.1.3 Test 3: adding sensors’ data and enabling spatial-temporal visualization
IoT sensors log the measurement values at specified intervals of time. The spot measurements taken by an IEQ cart (P. Li, Froese, and Brager, 2018; Mallory-Hill and Gorgolewski, 2018) also log multiple values over a short period of time. Therefore, visualizing time-series datasets is essential for analysis in POE. This test describes the procedure followed for attaching time-dependent values to sensor locations and visualizing time-series datasets in 4D.
5.2.1.3.1 Procedure
• Prepare a database in Excel that contains measured temperature values with time. Please refer to Appendix B for further details.
• Import the excel file as a standalone table in the ArcGIS pro.
• Transpose the table in ArcGIS pro to get the temperature for each sensor at a given timestamp
• Perform a spatial joint to connect the Transposed table containing time-dependent temperature values with sensor locations (imported in step 2)
• Enable time in the feature layer and set the desired configuration to see the time-series data.
5.2.1.3.2 Results and discussions
• The measured indoor temperature data with time in the desired area within the BIM model can be seen in Figure 9. Visualizing time-series datasets of indoor temperature values in 3D has created a digital twin and enabled 4D visualization. The values can be categorized to determine the acceptable threshold values for indoor thermal comfort. The 4D visualization can be used to communicate the issues at a non-technical level.
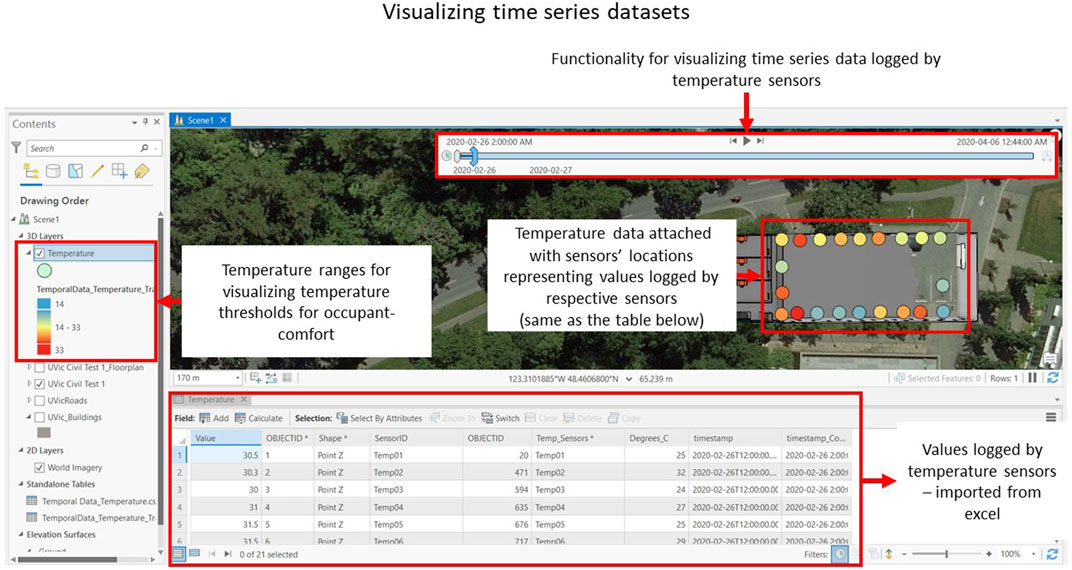
FIGURE 9. Adding and visualizing time-series data in ArcGIS Pro.
5.2.1.4 Test 4: adding built environment data
BIM-based digital twin platforms have limited ways to incorporate information about the built environment. Adding more information also affects the performance of the model. BIM-GIS integration can overcome this limitation by adding the built environment data alongside the BIM model. This test aims to demonstrate that adding built environment data enhances the capacity of the digital twin for POE purposes.
5.2.1.4.1 Procedure
• Import the shapefiles for surrounding buildings.
• Note: The shapefiles are provided by the Geography Department from the University of Victoria
• Add the elevation to the shapefile for converting them from 2D to 3D
5.2.1.4.2 Results
As shown in Figure 10, the buildings surrounding the BIM model have been added to the BIM-GIS integrated digital twin. ArcGIS Pro can import numerous amounts of data types that can add more information to the digital twin. Moreover, more than one BIM model can be incorporated into the same ArcGIS Pro local scene. This feature addresses the scalability issues of existing digital twin platforms and can be used to compare the performance of multiple buildings within the same built environment. Moreover, it enables the possibility of conducting daylight and shadow analysis to assess the impact of the surrounding buildings on the building of interest.
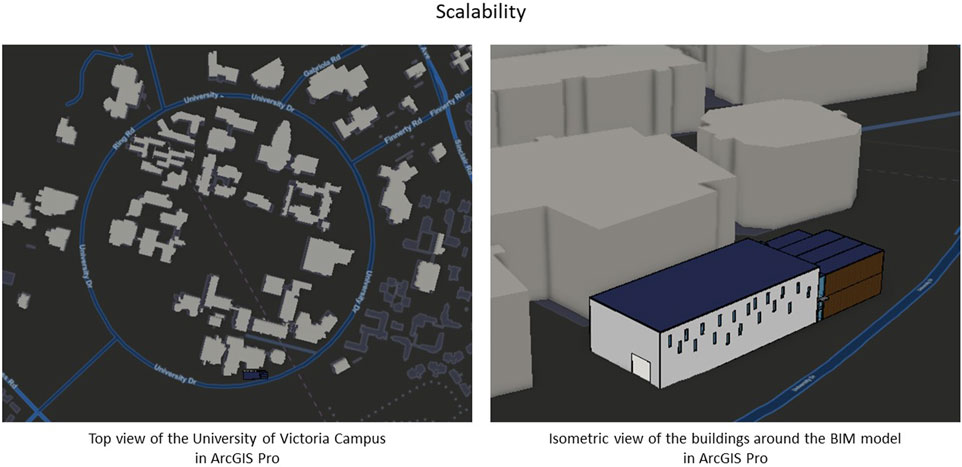
FIGURE 10. Adding surroundings in ArcGIS Pro.
5.3 Validation
This section discusses the validation techniques used to verify the accuracy and reliability of the information during and after the tests.
5.3.1 Geo-reference check
The Revit model is geo-referenced by using the project base point and survey point. These points are also carried over in ArcGIS Pro while importing the BIM model from Revit. Figure 11 compares the value of both Project Base Points and Survey Points. The differences in Project Base Point and Survey Point are approximately 1 and 0.5 m, respectively. The difference in elevation of the Survey Point is also approximately 0.4 m.
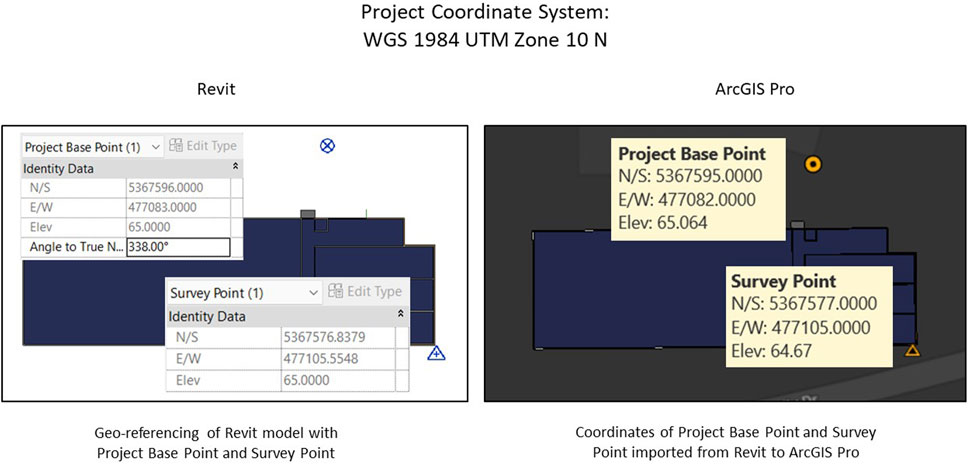
FIGURE 11. Comparison of the reference points.
Usually, the values of these reference points are provided by certified surveyors. Considering the values are taken from Google Earth Pro, the minor differences in the reference points are acceptable for this study.
5.3.2 Data transfer check
Revit maintains two types of parametric information about the component:
• Geometry and location
• Material properties
Not all the parametric information gets transferred to ArcGIS Pro from the Revit model. A data transfer check was performed for this study to ensure that ArcGIS Pro contains all the necessary information from the Revit model for the analysis and visualization related to POE.
From Figure 12, it is evident that the analytical properties of the materials are not carried over during the Revit-ArcGIS Pro import. Moreover, ArcGIS Pro converts the Revit model into the multi-patch format that contains the geometry and location data of the component. Material properties do not get transferred over to ArcGIS Pro. However, ArcGIS Pro creates a spatial extent of Revit components that might be useful for the analytics. Refer to Appendix C for more information on how ArcGIS Pro displays parametric information of Revit Components.
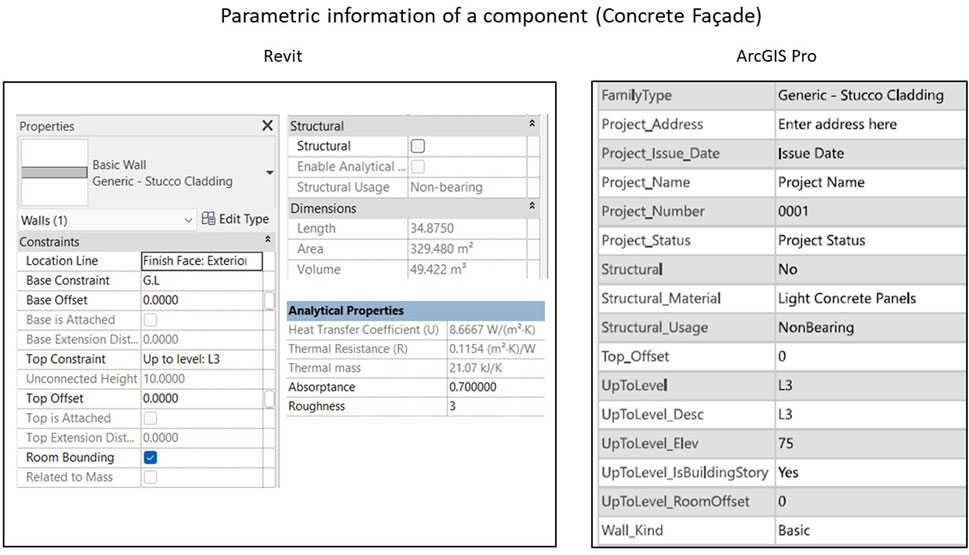
FIGURE 12. Comparison of parametric information of a concrete façade component.
5.3.3 Visual checks
Revit’s material library is data-rich and contains information about the texture and appearance of thousands of materials. Visual checks are used to verify if the visual representation of the data corresponds to their respective values. These checks are essential and frequently conducted for this project because 4D visualization of KPIs is essential for POE.
Visual checks confirmed that most of the data are transferred successfully. However, as compared in Figure 13, ArcGIS Pro could not render the texture of the concrete panels imported from Revit model.
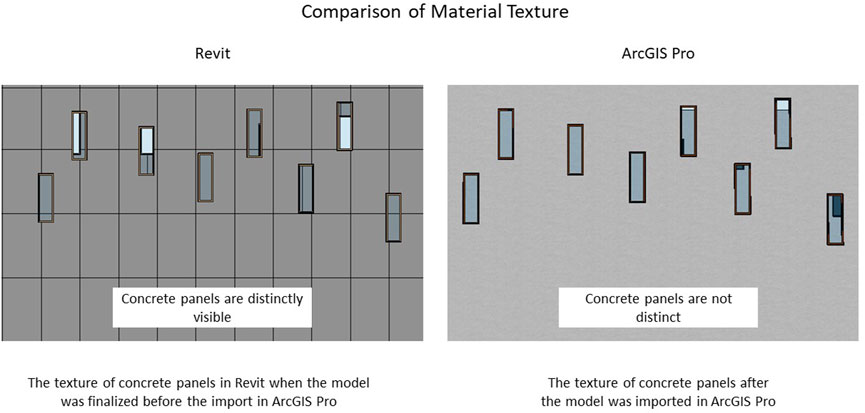
FIGURE 13. Comparison of the material texture of a concrete façade.
5.4 Workflow recommendations
Based on the tests conducted in alignment with use case scenarios, an optimized workflow is based on the tests conducted in alignment with use case scenarios, an optimized workflow is recommended. The workflow can be used to create BIM-IoT-GIS-based digital twins for any building, facility, or infrastructure project.
Figure 14 illustrates the recommended workflow for integrating BIM models and sensors’ data into ArcGIS Pro. Geo-database facilitates the editing and management of various data formats within the GIS environment (“What Is a Geodatabase?—ArcGIS Help | ArcGIS Desktop”, 2022). Importing the Revit model and sensors’ data to geo-database is the first step towards creating a digital twin for ArcGIS Pro. After the validation procedure, a digital twin can be established in the spatial-temporal 3D environment of ArcGIS Pro. Then, the spatial-temporal analytical tools can be used to analyze and visualize various key performance indicators in 4D. Overall, this workflow facilitates all three major applications of digital twin for POE: Continuous Monitoring, Data Analysis and Management, and Spatial-Temporal visualization of KPIs.
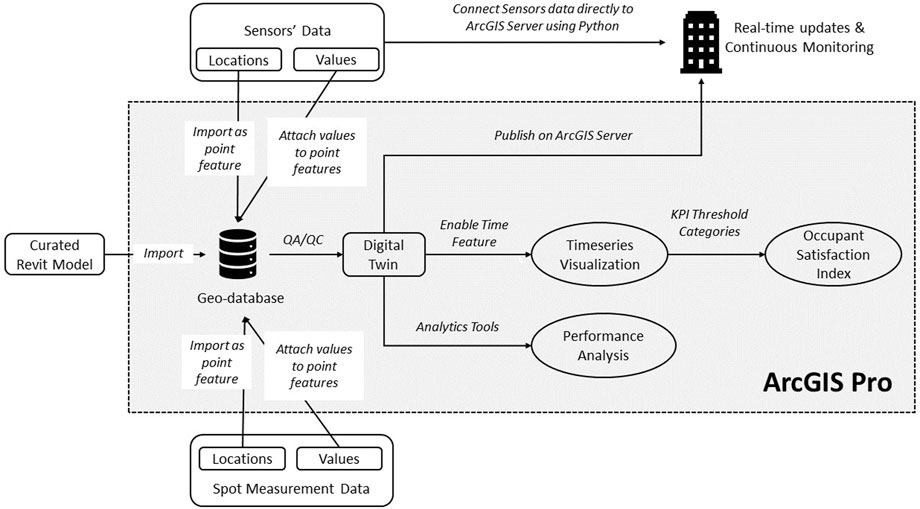
FIGURE 14. Streamlined workflow recommended for BIM-IOT-GIS integrations.
Although it was outside of the scope of this project, it would be possible to publish the ArcGIS model to an online server, establishing a web-based digital twin that could enable the sensors’ data monitoring in real-time with the use of python script in ArcGIS Pro.
6 Limitations
This section describes the limitations experienced during the BIM-GIS integration.
6.1 Hardware
Even though geo-database provides data management tools that enable the turning off of the data sets that are not required for specific tasks for POE, Revit and ArcGIS Pro both require high CPU and GPU power. When working with large datasets, appropriate breakdowns of the BIM model and the sensors’ data suited to the POE requirements are recommended to mitigate the hardware limitations. Moreover, publishing the project on the ArcGIS server transfers some of the load from the hardware to the cloud computing server.
6.2 Software
ArcGIS Pro provides a suite of tools for spatial-temporal analysis. 3D interpolation tools are useful for calculating a distribution of a KPI, such as temperature over the desired area. Therefore, an attempt has been made to visualize the temperature distribution by using the hypothetical temperature values used in Test 3 (Appendix B). However, as shown in Figure 15, the 3D interpolation exceeded the extent of the area of the BIM model. Further investigation is required to determine the causes and potential solutions for this issue.
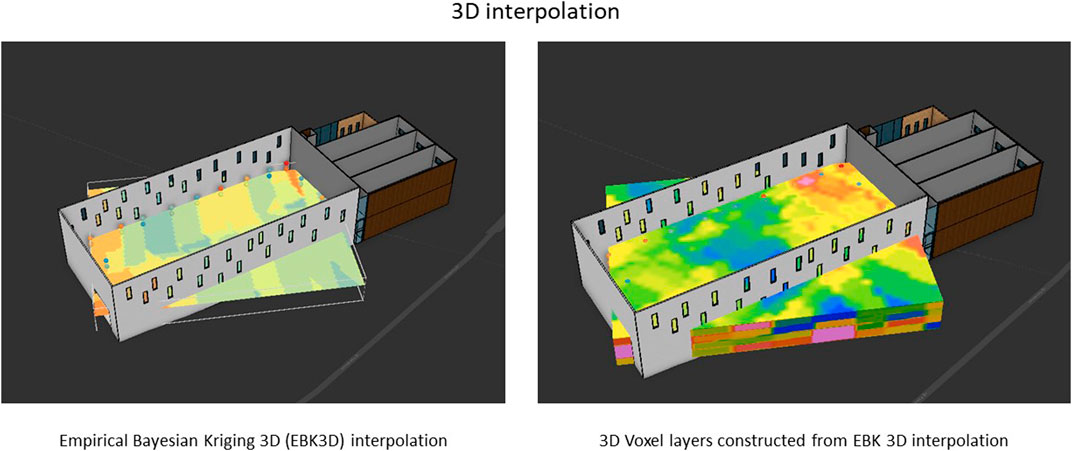
FIGURE 15. Errors encountered during EBK-3D interpolation.
6.3 Other
The application of using BIM-GIS integration for hosting digital twins is relatively new. Also, there were only a few studies have considered using BIM-GIS as a preferred platform for sustainable facilities management. Therefore, the validation techniques used for this study were limited to the data transferred from Revit and Excel only. For BIM data, the open-sourced IFC file format is popular, as summarized in the literature review section; however, due to the direct import capabilities from ArcGIS Pro 2.6 onwards, Revit’s native file format (.RVT) is used in this project.
7 Conclusion
Digital twin is an evolving concept in the AEC industry. It provides a centralized platform for data collection, modification, analysis, and visualization. Digital Twin is envisioned to have a geo-located and real-time weather data model, improving the accuracy in analysis compared to the simulation-based analysis. To address the limitations in data collection and analysis following the global pandemic, using IoT-based sensors helps eliminating the need of an IEQ cart by facilitating spot measurements at specified intervals. Moreover, by setting up digital twins, researchers don’t have to be physically present to take measurements. However, digital twins do not incorporate the addition of human behavior to determine its impact on the building performance and quantifying it would be challenging without the presence of an observer (researcher) in the building.
Integration of BIM and GIS technologies enhances the capabilities of the digital twin by adding comprehensive geometric, semantic, parametric, and built environment data. Moreover, high-level applications and use case scenarios have clarified the requirements of a digital twin platform for POE. However, developing detailed use case scenarios will help create a customized system UI catered to POE. The tests explain the step-by-step procedure followed for BIM-IOT-GIS integration. There were no significant errors, discrepancies, or data loss during the integration. The results demonstrate that ArcGIS Pro is interoperable with Revit and sensors’ database. Furthermore, it can handle large datasets and offers a wide range of tools and features for spatial-temporal data analysis and 4D visualization. Therefore, ArcGIS Pro can be used as a suitable digital twin platform that fulfills the system requirements for POE. Publishing the digital twin on the cloud-based server will help in mitigating some of the hardware and software limitations experienced during the tests. Also, the recommended workflow can be streamlined and reproduced for similar projects. Klokan Technologies; Natural Resources and Canada, 2008,
8 Next steps
• The BIM-GIS integrated digital twin will be used in the high-level framework for the proof of concept for the next iteration of POE.
• A digital-twin integrated POE study will be conducted on the STTC building of Red River College located in Winnipeg, Manitoba.
Data availability statement
The raw data supporting the conclusion of this article will be made available by the authors, without undue reservation.
Author contributions
All authors listed have made a substantial, direct, and intellectual contribution to the work and approved it for publication.
Conflict of interest
The authors declare that the research was conducted in the absence of any commercial or financial relationships that could be construed as a potential conflict of interest.
Publisher’s note
All claims expressed in this article are solely those of the authors and do not necessarily represent those of their affiliated organizations, or those of the publisher, the editors and the reviewers. Any product that may be evaluated in this article, or claim that may be made by its manufacturer, is not guaranteed or endorsed by the publisher.
Abbreviations
AECO, architecture engineering construction and operations; BIM, building information modeling; BPE, building performance evaluations; GIS, geographic information systems; IEQ, indoor environmental quality; IFMA, international facility management association; IoT, internet of things; iiSBE, international institution of sustainable built environment; LEED, leadership in energy and environmental design; POE, post occupancy evaluations.
References
Al, Horr, Arif, Mohammed, Katafygiotou, Martha, Ahmed, Mazroei, Amit, Kaushik, et al. (2016). Impact of indoor environmental quality on occupant well-being and comfort: A review of the literature. Int. J. Sustain. Built Environ. 5 (1), 1–11. doi:10.1016/j.ijsbe.2016.03.006
Ammar, Ashtarout, Nassereddine, Hala, AbdulBaky, Nadine, AbouKansour, Anwar, Tannoury, Juliano, Urban, Harald, et al. (2022). Digital twins in the construction industry: A perspective of practitioners and building authority. Front. Built Environ. 8 (June), 834671. doi:10.3389/fbuil.2022.834671
Biljecki, F., and Tauscher, H. (2019). Quality of BIM-GIS conversion. ISPRS Ann. Photogrammetry, Remote Sens. Spatial Inf. Sci. doi:10.5194/isprs-annals-IV-4-W8-35-2019
Borrmann, André, König, Markus, Koch, Christian, and Beetz, Jakob (2018). “Building information modeling: Why? What? How?,” in Building information modeling: Technology foundations and industry practice. André Borrmann, Markus König, and Christian Koch (Cham: Springer International Publishing). doi:10.1007/978-3-319-92862-3_1
buildingSMART international, . 2020.How to unlock economic, social, environmental and business value for the built asset industry. Build. SMART Int. https://www.buildingsmart.org/wp-content/uploads/2020/05/Enabling-Digital-Twins-Positioning-Paper-Final.pdf.
D’Amico, Fabrizio, Calvi, Alessandro, Schiattarella, Eleonora, Di Prete, Mauro, and Veraldi, Valerio (2020). BIM and GIS data integration: A novel approach of technical/environmental decision-making process in transport infrastructure design transportation research procedia, transport infrastructure and systems in a changing world. Towards a more sustainable, reliable and smarter mobility. TIS Roma 2019 Conf. Proc. 45 (January), 803–810. doi:10.1016/j.trpro.2020.02.090
Diakite, Abdoulaye A., and Zlatanova., Sisi (2020). Automatic geo-referencing of BIM in GIS environments using building footprints. Comput. Environ. Urban Syst. 80 (March), 101453. doi:10.1016/j.compenvurbsys.2019.101453
Grover, Raghav, Li, Peixian, Thomas, M., and Froese, T. M. (2015). The interface between building information models and the public. doi:10.14288/1.0076373
Kang, Tae Wook, and ChangHong, Hee (2015). A study on software architecture for effective BIM/GIS-Based facility management data integration. Automation Constr. 54 (June), 25–38. doi:10.1016/j.autcon.2015.03.019
Kim, Jungsoo, and de Dear, Richard (2012). Nonlinear relationships between individual IEQ factors and overall workspace satisfaction. Build. Environ. 49 (March), 33–40. doi:10.1016/j.buildenv.2011.09.022
Klokan Technologies, (2022). Coordinates on a map - pick GPS lat and long or coordinates in a projection system. http://epsg.io.
Leccese, Francesco, Rocca, Michele, Salvadori, Giacomo, Belloni, Elisa, and Buratti, Cinzia (2021). Towards a holistic approach to indoor environmental quality assessment: Weighting schemes to combine effects of multiple environmental factors. Energy Build. 245 (August), 111056. doi:10.1016/j.enbuild.2021.111056
Li, Lingzhi, Yuan, Jingfeng, Tang, Meiling, Zhao, Xu, Xu, Wei, and Cheng, Yusi (2021). Developing a BIM-enabled building lifecycle management system for owners: Architecture and case scenario. Automation Constr. 129 (September), 103814. doi:10.1016/j.autcon.2021.103814
Li, Peixian, Froese, Thomas M., and Brager, Gail (2018). Post-occupancy evaluation: State-of-the-Art analysis and state-of-the-practice review. Build. Environ. 133 (April), 187–202. doi:10.1016/j.buildenv.2018.02.024
Mallory-Hill, Shauna, and Gorgolewski, Mark (2018). “Mind the gap: Studying actual versus predicted performance of green buildings in Canada,” in Building performance evaluation. Editors Wolfgang F. E. Preiser, and Andrea E. Hardy (Ulrich Schramm: Springer International Publishing). doi:10.1007/978-3-319-56862-1_20
Mallory-hill, S., Wolfgang, F. E. Preiser, and Watson, Chris (2012). 1 introduction to building performance evaluation: Milestones in evolution.
Martindale, Jaime. (2022). Research guides: Mapping and geographic information systems (GIS): What is GIS? https://researchguides.library.wisc.edu/c.php?g=178144&p=1169699.
Natural ResourcesCanada (2008). Utm-grid-universal-transverse-mercator-projection. Nat. Resour. Can. 18. https://www.nrcan.gc.ca/earth-sciences/geography/topographic-information/maps/utm-grid-map-projections/utm-grid-universal-transverse-mercator-projection/9779.
Ohori, K., and Stoter, J. (2017). Towards an integration of GIS and BIM data: What are the geometric and topological issues? ISPRS Ann. Photogrammetry, Remote Sens. Spatial Inf. Sci. doi:10.5194/isprs-annals-IV-4-W5-1-2017
Olivia, Guerra-SantinTweed Aidan Christopher (2015). In-use monitoring of buildings: An overview and classification of evaluation methods. Energy Build. 86 (January), 176–189. doi:10.1016/j.enbuild.2014.10.005
O’Neill, Ian (2018). In praise of use cases – A paean with a software accompaniment. Comput. Sci. Educ. 28 (1), 65–86. doi:10.1080/08993408.2018.1472949
Pang, Yueyong, Zhang, Chi, Zhou, Liangchen, Lin, Bingxian, and Lv, Guonian (2018). Extracting indoor space information in complex building environments. ISPRS Int. J. Geo-Information 7 (8), 321. doi:10.3390/ijgi7080321
Petrenko, Anastasia, Anton, Sizo, Qian, Winchel, Dylan Knowles, A., Amin, Tavassolian, Stanley, Kevin, et al. (2014). Exploring mobility indoors: An application of sensor-based and GIS systems. Trans. GIS 18 (3), 351–369. doi:10.1111/tgis.12102
Pollard, Brett, Held, Fabian, Engelen, Lina, Powell, Lauren, and de Dear, Richard (2021). Data fusion in buildings: Synthesis of high-resolution IEQ and occupant tracking data. Sci. Total Environ. 776 (July), 146047. doi:10.1016/j.scitotenv.2021.146047
Project Dasher, (2022). https://www.autodesk.com/research/projects/project-dasher.
Roberts, C. J., Edwards, D. J., Hosseini, M. R., Mateo-Garcia, M., and Owusu-Manu, D. G. (2019). Post-occupancy evaluation: A review of literature. Eng. Constr. Archit. Manag. 26 (9), 2084–2106. doi:10.1108/ecam-09-2018-0390
Shahinmoghadam, M., and Motamedi, A. (2019). Review of BIM-centred IoT deployment: State of the art, opportunities, and challenges. ISARC. Proc. Int. Symposium Automation Robotics Constr. Waterloo 36, 1268–1275.
Song, Yongze, Wang, Xiangyu, Tan, Yi, Wu, Peng, Sutrisna, Monty, Jack, C., et al. (2017). Trends and opportunities of BIM-GIS integration in the architecture, engineering and construction industry: A review from a spatio-temporal statistical perspective. ISPRS Int. J. Geo-Information 6 (12), 397. doi:10.3390/ijgi6120397
Syed Abdul Rahman, S. A. F., and Abdul Maulud, K. N. (2019). Approaching BIM-GIS integration for 3D evacuation planning requirement using multipatch geometry data format. IOP Conf. Ser. Earth Environ. Sci. 385 (November), 012033. doi:10.1088/1755-1315/385/1/012033
Tashakkori, Hosna, Rajabifard, Abbas, and Kalantari, Mohsen (2015). A new 3D indoor/outdoor spatial model for indoor emergency response facilitation. Build. Environ. 89 (July), 170–182. doi:10.1016/j.buildenv.2015.02.036
Tripathi, Ishan, and Froese, Thomas M. (2020). Post occupancy evaluation in Canada: Challenges, potential improvements and new Frontiers. https://dspace.library.uvic.ca/handle/1828/12338.Proceedings of the 2nd International Conference on New Horizons in Green Civil Engineering (NHICE-02)Victoria, CanadaAugust 2020
Wan Nor Fa’aizah Wan Abdul Basir Ujang, Uznir, Majid, Zulkepli, Azri, Suhaibah, and TanChoon, Liat (2020). The integration of BIM and GIS in construction project – a data consistency review. Int. Archives Photogrammetry Remote Sens. Spatial Inf., 107–116. doi:10.5194/isprs-archives-XLIV-4-W3-2020-107-2020
Villa, Valentina, Naticchia, Berardo, Bruno, Giulia, Aliev, Khurshid, Piantanida, Paolo, and Antonelli, Dario (2021). IoT open-source architecture for the maintenance of building facilities. Appl. Sci. 11 (5374), 5374. doi:10.3390/app11125374
Wang, Hao, Pan, Yisha, and Luo, Xiaochun (2019). Integration of BIM and GIS in sustainable built environment: A review and bibliometric analysis. Automation Constr. 103 (July), 41–52. doi:10.1016/j.autcon.2019.03.005
What Is a Geodatabase, (2022). https://desktop.arcgis.com/en/arcmap/10.3/manage-data/geodatabases/what-is-a-geodatabase.htm.
What Is the Internet of Things (IoT)?, (2022). https://www.oracle.com/internet-of-things/what-is-iot/.
Zhu, Junxiang, Wang, Xiangyu, Wang, Peng, Wu, Zhiyou, and Kim, Mi Jeong (2019). Integration of BIM and GIS: Geometry from IFC to shapefile using open-source technology. Automation Constr. 102 (June), 105–119. doi:10.1016/j.autcon.2019.02.014
Appendix A: Projection system used for geo-referencing
• Image courtesy: Government Canada (Canada 2008) and espg. io (GmbH (https://www.klokantech.com/), 2022)
As shown in Figure A1, the location of this project corresponds to the WGS 84: UTM Zone 10 N. This projection system is used to geo-reference both the Revit model and ArcGIS Pro local scene.
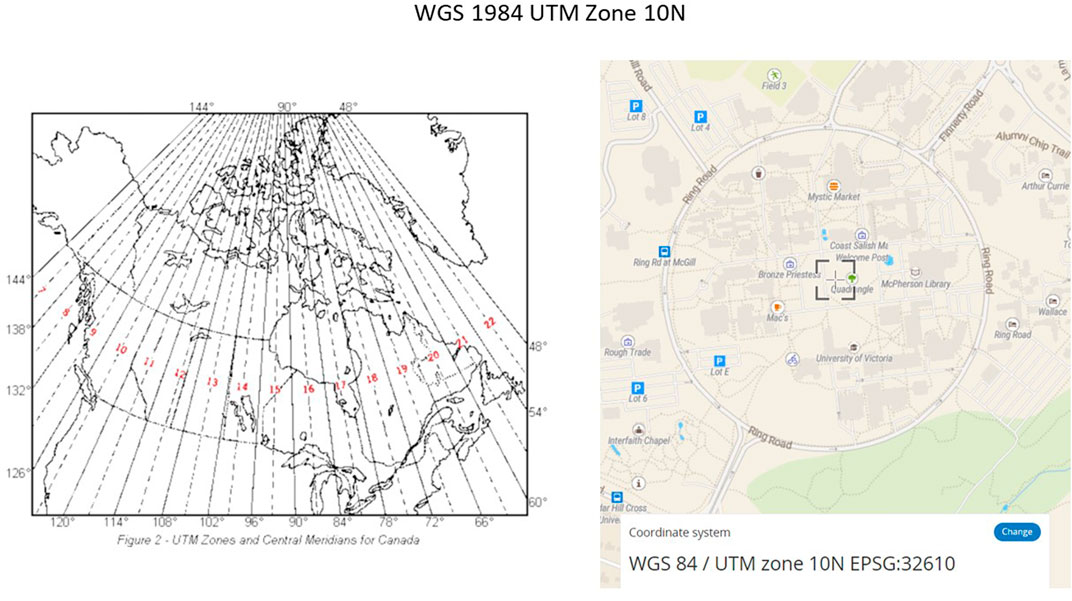
FIGURE A1. Projection system used for geo-referencing Revit model and ArcGIS Pro local scene.
Appendix B: Sensor Dataset used for Test 3
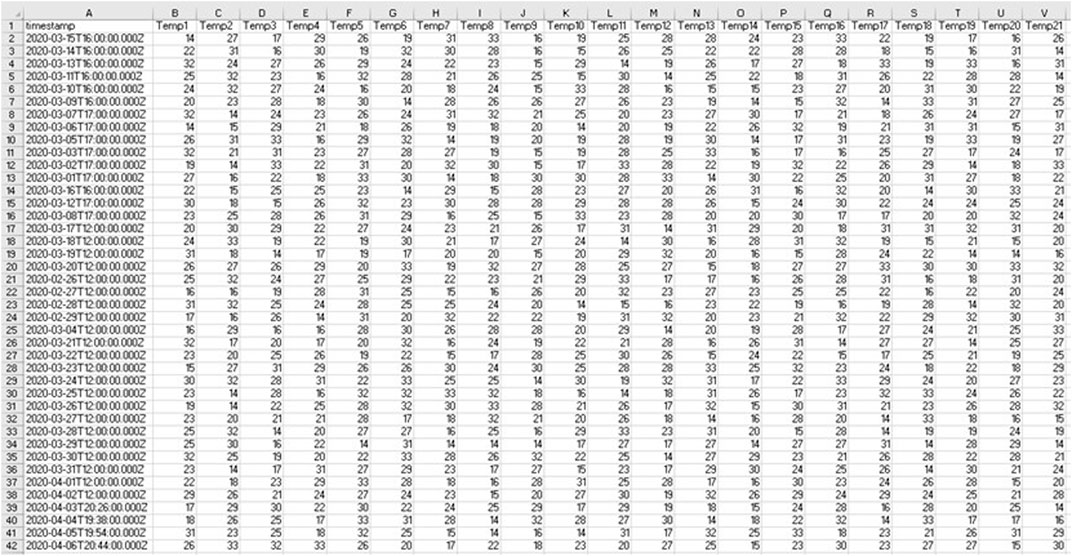
FIGURE B1. Timeseries data containing temperature values used for Test 3.
Appendix C: Information Transferred from revit to ArcGIS Pro
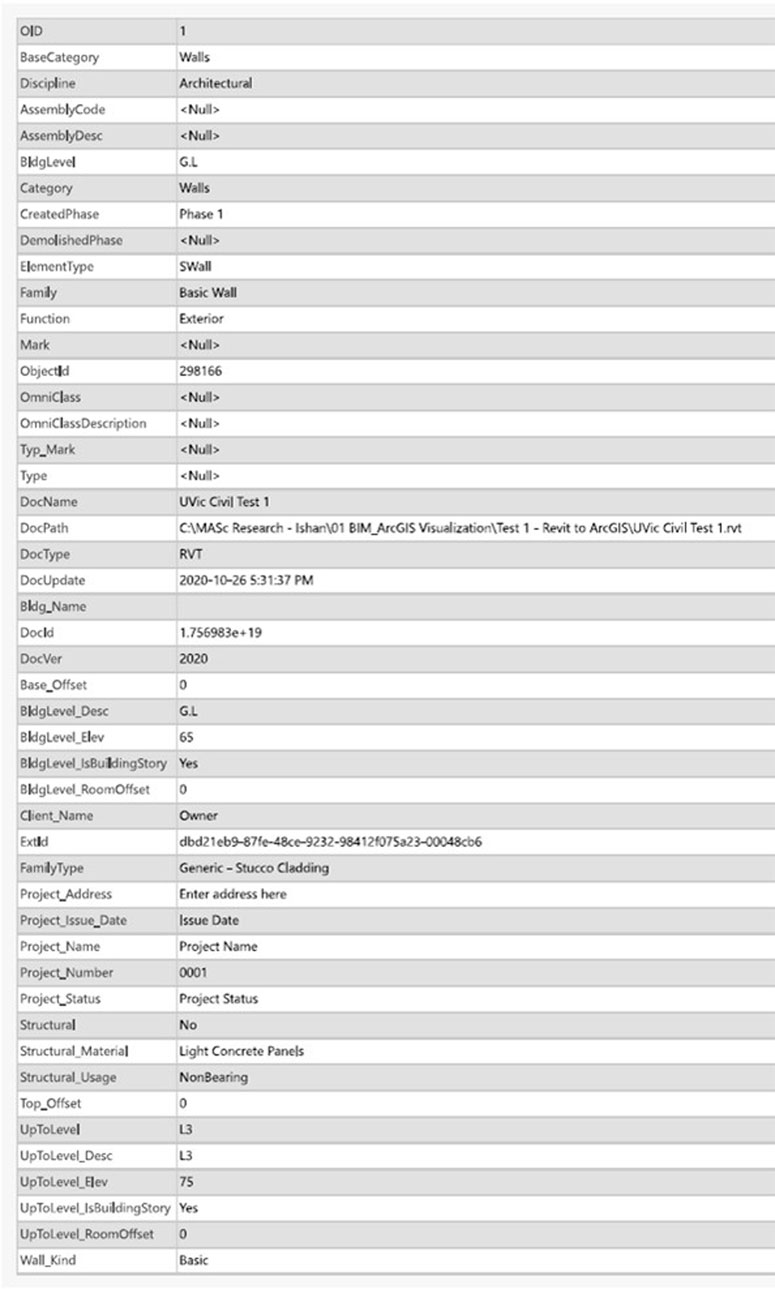
FIGURE C1. Parametric data of concrete façade in ArcGIS Pro.
Keywords: post occupancy evaluation (POE), building information modeling (BIM), internet of things-IoT, GIS-geographic information system, digital twins (DT)
Citation: Tripathi I, Froese TM and Mallory-Hill S (2023) Applicability of BIM-IoT-GIS integrated digital twins for post occupancy evaluations. Front. Built Environ. 9:1103743. doi: 10.3389/fbuil.2023.1103743
Received: 20 November 2022; Accepted: 24 May 2023;
Published: 09 June 2023.
Edited by:
Hasim Altan, Prince Mohammad bin Fahd University, Saudi ArabiaReviewed by:
Giacomo Salvadori, University of Pisa, ItalyNadine Wills, Technische Hochschule Mittelhessen, Germany
Copyright © 2023 Tripathi, Froese and Mallory-Hill. This is an open-access article distributed under the terms of the Creative Commons Attribution License (CC BY). The use, distribution or reproduction in other forums is permitted, provided the original author(s) and the copyright owner(s) are credited and that the original publication in this journal is cited, in accordance with accepted academic practice. No use, distribution or reproduction is permitted which does not comply with these terms.
*Correspondence: Ishan Tripathi, aXNoYW50cmlwYXRoaTI0QGdtYWlsLmNvbQ==