 Hamid Khodadadi Koodiani
 Arsalan Majlesi
 Adnan Shahriar2
- 1Civil Engineering Department, The University of Texas at San Antonio, San Antonio, TX, United States
- 2Department of Mechanical Engineering, The University of Texas at San Antonio, San Antonio, TX, United States
Modeling parameters (MP) of reinforced concrete columns are a critical component of performance-based seismic assessment methodologies because in these approaches damage is estimated based on element deformations calculated using non-linear models. To ensure model fidelity and consistency of assessment results, performance-based seismic assessment methods in ASCE 41, ACI 369.1, and ACI 374.3R prescribe modeling parameters calibrated using experimental data. This paper introduces a new set of equations to calculate reinforced concrete column non-linear modeling parameters optimized for design verification of new buildings using response history analysis. Unlike modeling parameters provided in ACI 369.1 and ASCE 41, intended for columns of older non-ductile buildings, the equations for modeling parameters anl and bnl presented in this study were calibrated to simulate the load-deformation envelope of reinforced concrete columns that meet the detailing requirements of modern seismic design codes. Specifically, the proposed equations are intended for use with provisions in ACI 374.3R, Chapter 18 and Appendix A of ACI 318-19 and Chapter 16 of ASCE/SEI 7-16. The proposed equations were calibrated using the ACI Committee 369 column database, which includes column configuration parameters, material properties, and deformation capacity modeling parameters inferred from the measured response of columns under load reversals. Dimension reduction techniques were applied to visualize different clusters of data in 2D space using the negative log-likelihood score. This technique allowed decreasing the non-linearity of the problem by identifying a subset of columns with load-deformation behavior representative of new construction conforming to current codes requirements. A Neural Network model (NN) was calibrated and used to perform parametric variations to identify the most relevant input parameters and characterize their effect on modeling parameters, and to stablish the degree of non-linearity between each input variable and the model output. Developing equations for modeling parameters applicable to a wide range of columns is challenging, so this research considered subsets of the database representative of new construction columns to calibrate simple practical equations. Linear regression models including the most relevant features from the parametric study were calibrated for rectangular and circular columns. The proposed linear regression equations were found to provide better estimates of new construction column modeling parameters than the available tables in ACI 374.3R and ASCE 41-13, and the equations ASCE 41-17.
Introduction
The ASCE/SEI 7 Standard (ASCE, 2007) and the ACI 318 (318-19, 2019) Building Code recently introduced provisions for design and verification of new building structures using response history analysis. The goal of these provisions is to provide guidance to engineers seeking to go beyond the prescriptive design approach in the main body of the 318 Building Code by implementing performance-based design. The provisions for response history analysis in Appendix A of 318-19 (318-19, 2019) give engineers significant latitude in choosing modeling parameters and acceptance criteria. Section A.6.2 of ACI 318-19 (318-19, 2019) stipulates that “modeling of member non-linear behavior, including effective stiffness, expected strength, expected deformation capacity, and hysteresis under force or deformation reversals, shall be substantiated by applicable physical test data and shall not be extrapolated beyond the limits of testing.” The commentary of Section RA.6.2 of ACI 318-19 (318-19, 2019) states that “multiple element formulations and material models are appropriate for use in inelastic dynamic analysis of concrete structures. ASCE/SEI 41 (Elwood et al., 2007), ACI 374.3R (374, 2016), ACI 369.1 (ACI-369.1-17, 2017), and NIST GCR 17-917-46 (NIST) provide guidance on modeling and defining model parameters.”
Among the references cited in Section RA.6.2 of ACI 318-19 (318-19, 2019), ACI 374.3R-16 (374, 2016) provides two sets of modeling parameters for columns. Table 4 of ACI 374.3R-16 (374, 2016) provides modeling parameters for flexure-shear and flexure critical rectangular columns adopted from Tables 8–10 of ASCE 41-13 (41–13, 2013), which only provided modeling parameters for rectangular columns. Furthermore, values for MPs a and b in Tables 8–10 of ASCE 41-13 (41–13, 2013) were chosen to be conservative. The probability of MP a being lower than the value in Tables 8–10 was set to 15% for columns expected to fail in shear and 35% for columns expected to fail in flexure. The probability of MP b being lower than the value in Tables 8–10 was set to 15%. Target limits for probabilities of exceedance were selected based on the judgment of the ASCE/SEI 41 (Elwood et al., 2007) Supplement 1 Ad Hoc Committee responsible for the development of Tables 8–10.
Alternatively, Table 4 of ACI 374.3R-16 (374, 2016) provide column MP values derived using linear regression analysis of a subset of the ACI 369 column database (Ghannoum et al., 2012) that met detailing requirements in Chapter 18 of the 318 Building Code (318-19, 2019). The column subset used in the calibration consisted of 38 rectangular columns and 25 circular columns, and the linear regression analysis was used the same input variables used by Ghannoum and Matamoros (2014).
Modeling parameters in the ASCE 41-17 (Engineers, 2017) Standard, adopted from Chapter 10 of ACI 369.1-17 (ACI-369.1-17, 2017) and developed through a more complex analysis of the ACI 369 column database by Ghannoum and Matamoros (2014), are intended to be representative of a wide range of columns, including non-ductile columns with detailing deficiencies.
MPs provided in the standards and documents referenced in Section RA.6.2 of the ACI 318 (318-19, 2019) Building Code are based on outdated information or were developed based on a data set that included non-ductile columns. The main objective of this paper is to address this gap by developing MP equations for new building columns based on a more in-depth analysis of well-detailed column data than performed for Table 4 in ACI 374.3R, and optimized for a narrower subset of column data than the equations developed by Ghannoum and Matamoros for ACI 369.1-17 (ACI-369.1-17, 2017).
Developing equations for MPs applicable to a wide range of columns is challenging because parameters that affect component behavior change depending on their configuration and the magnitude of the actions that components are subjected to. For example, columns subjected to high axial load are susceptible to compression failure, so axial load and compressive strength are important parameters. At low axial loads, the behavior is governed by transverse reinforcement and diagonal tension properties of the concrete instead. Reinforced concrete column MP equations in the ACI 369.1/ASCE 41 (ACI-369.1-17, 2017; Engineers, 2017) standards were calibrated through linear regression of an experimental data set that lumped all component configurations and actions, with the objective of minimizing the coefficient of variation for the totality of the experimental data set. As a result of this calibration approach, ACI 369.1/ASCE 41 (ACI-369.1-17, 2017; Engineers, 2017) equations are inherently underfitted (they have a high training and testing error), smoothing out behaviors specific to element subsets by eliminating complex non-linear relationships between input variables and MPs (Lynn, 2001; Elwood and Moehle, 2005b; a; Sezen and Moehle, 2006; Elwood et al., 2007; Matamoros et al., 2008; Woods and Matamoros, 2010; Ghannoum and Matamoros, 2014). Equations for modeling parameters in ACI 374.3R (374, 2016) are less susceptible to underfitting because they were calibrated with and intended to be used on a smaller data set of columns with similar mode of failure, where the relationship between input variables and column MPs is significantly less non-linear. The main limitation of the provisions of ACI 374.3R (374, 2016) is that they are based on simple regression of a limited data set, which adopted the same input parameters used in ACI 369.1 for non-ductile columns even though the mode of failure is different, and where non-linear interactions between input and output parameters were not considered.
In recent years, there has been extensive research on the use of Machine Learning (ML) tools in the field of structural engineering. These tools have found diverse applications in various aspects of structural engineering such as structural analysis, design, health monitoring, mechanical behavior and capacity of structural elements, and optimization. A comprehensive overview of the broad spectrum of ML applications in structural engineering was presented by Thai (2022) in their review. By employing computer-based vision and object detection algorithms, Shahin et al. (2023) monitored and detected instances of workers failing to comply with standard safety practices, such as not wearing personal protective equipment (PPE). In 2022 Dabiri et al. (2022) used NN, Random Forest and regression-based models to predict the displacement ductilitu ration of RC joints. This paper seeks to address a research gap in the literature, namely, the lack of references that explore the usage of machine learning tools for studying non-linear modeling parameters of reinforced concrete columns.
In this paper, reinforced concrete column MP equations were developed for use in non-linear dynamic analyses using a methodology that addresses the limitations of provisions in ACI 374.3R. Unlike MPs provided in ACI 369.1 and ASCE 41, intended for columns of older non-ductile buildings, the equations for MPs anl and bnl presented in this study were calibrated to simulate the load-deformation envelope of reinforced concrete columns that meet the detailing requirements of modern seismic design codes. Specifically, the proposed equations are intended for use with provisions in ACI 374.3R, Chapter 18 and Appendix A of ACI 318-19 and Chapter 16 of ASCE/SEI 7-16.
In performance-based seismic assessment methodologies, non-linear numerical models are used to simulate component behavior using lateral force versus lateral deformation envelopes (Figure 1) and hysteresis rules. The shape of the envelopes is defined using element MPs provided in ACI 369.1/ASCE 41 (ACI-369.1-17, 2017; Engineers, 2017) standards and the ACI 374.3R guide (374, 2016). Two critical parameters that define the shape of load-deformation envelopes are non-linear modeling parameters a and b, defined as the plastic deformation at incipient lateral-strength degradation (loss of lateral load capacity) and at incipient axial degradation (loss of the ability to carry axial load in columns), respectively (Figure 1). These two parameters are used to characterize the force-deformation relationship beyond the proportional limit (point B in Figure 1). The study proved that the implemented algorithm had higher accuracy than the equations and tables provided in previous design standards and guides.
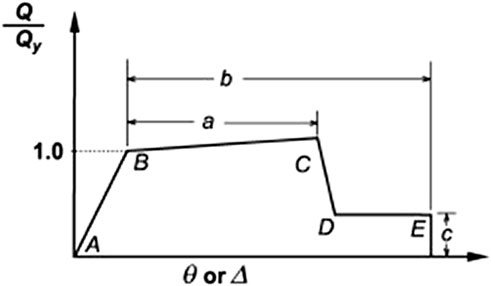
FIGURE 1. ASCE 41 (41–13, 2013) force-displacement envelope for non-linear modeling of deformation-controlled RC components.
Data analytics
The database included 319 rectangular column tests and 171 circular column tests for a total of 490 tests (Ghannoum and Matamoros, 2014). The data set included only quasi-static tests of experimental models. Of all the columns in the database, 37 rectangular columns and 24 circular columns satisfied ACI 318-11 Building Code criteria for columns of Special Moment Resisting Frames (SMRF). A limited number of rectangular columns (25 out of 171) were reported to have ties with 90o hooks, not allowed for SMRF systems according to the provisions of the 318 Building Code. The tie hook-angle was unknown for 26 rectangular columns, while 269 rectangular columns had ties with 135o hooks or welded ends. A limited number of circular columns had ties with lapped ends (13 out of 171), and except from one case, all circular columns had spirals, ties with welded ends, or hooks anchored into the core. Columns in the data subsets used to calibrate the equations were chosen based on their behavior and mode of failure instead of strict adherence to the provisions in Chapter 18 of the ACI 318 Building Code for SMRF. Code provisions are very complex and change with every code cycle, so it was deemed more important to capture behavior and mode of failure patterns in the data to gain statistical significance. Filtering based on strict compliance with the 318 Building Code would have resulted in a very small data set to calibrate the equations. This approach to filtering the data provided a data set sufficiently large to allow the use of machine learning techniques, although a larger set would untroubledly be preferrable.
The experimental data set used in this study included six non-dimensional input variables and two output MPs, a and b, for each column test. The input variables are column span-to-depth ratio (
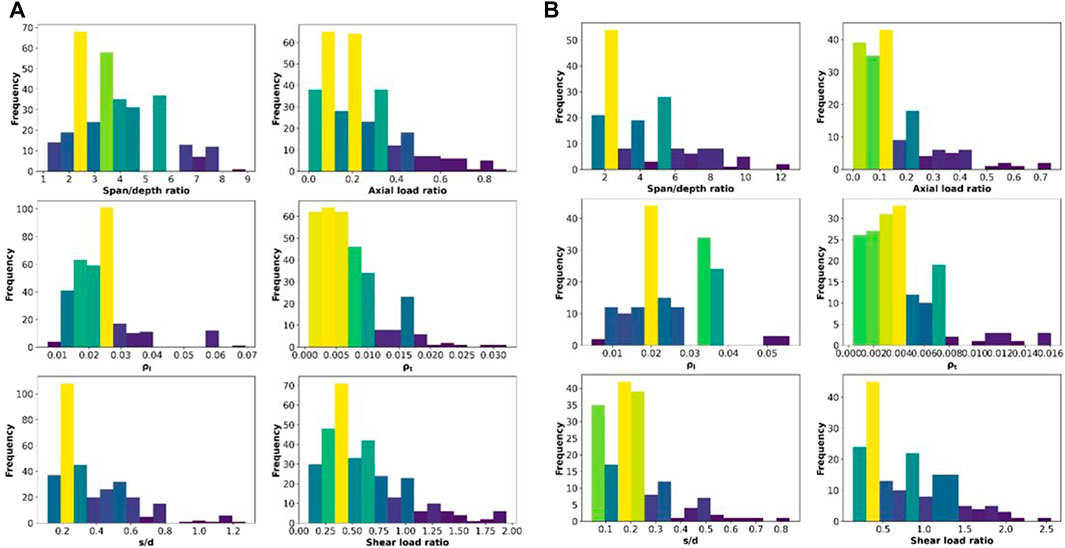
FIGURE 2. Histogram of input variables in column database for (A) rectangular and (B) circular columns.
The correlation matrix for input and output parameter a of rectangular columns is shown in Figure 3. Values of 1 and −1 indicate the highest correlation and inverse correlation between two variables. The first and second highest correlation between input variables was found between
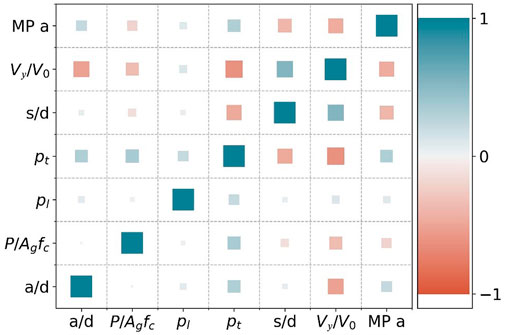
FIGURE 3. Correlation matrix of the input and output (Mp a) variables used in this study.
The input variables with the first and second highest correlation with MP a were
Data visualization and different machine learning algorithms
The TSNE algorithm (Van der Maaten and Hinton, 2008) was used as a dimension reduction method to reduce the six features in the dataset to two features and facilitate visualization in 2D space. The Gaussian Mixture Model (GMM) (Duda and Hart, 1973) was then used to visualize the non-linear separability of clusters of data. Four different clusters of data were identified using these techniques, shown in Figure 4A, where the center of each cluster is identified with a red dot. The black dots in Figure 4A correspond to individual data points, and the clouds around each cluster center show the distribution of the data. Areas of Figure 4A with similar background color indicate that relationships among the data are linear, and changes in the background color are indicative of non-linear behavior. Figure 4A shows that there is a high degree of non-linearity in the column dataset which necessitates the use of non-linear models to accurately capture the relationships between inputs and outputs if a single equation is used to estimate MPs of columns in all four clusters.
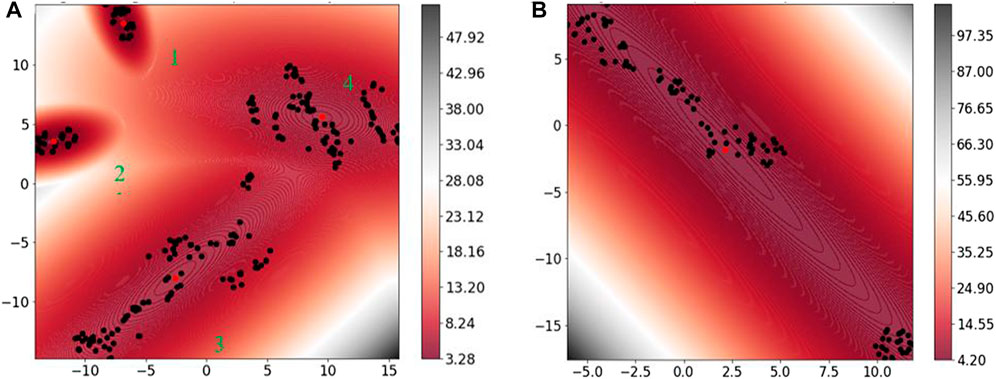
FIGURE 4. The Negative log-likelihood predicted by GMM for (A) the whole dataset and (B) flexure-critical empirical subset for rectangular columns.
Four different clusters were identified for the complete dataset in Figure 4A. The data was tracked back to identify the salient characteristics of each cluster, including the number of specimens and the mode of failure. These and minimum, maximum and mean of each input variable are reported in Table 1, where mean values are shown in parenthesis. The last two rows in Table 1 show statistically significant input variables for parameters a and b based on a p-value analysis. Among the clusters, the (
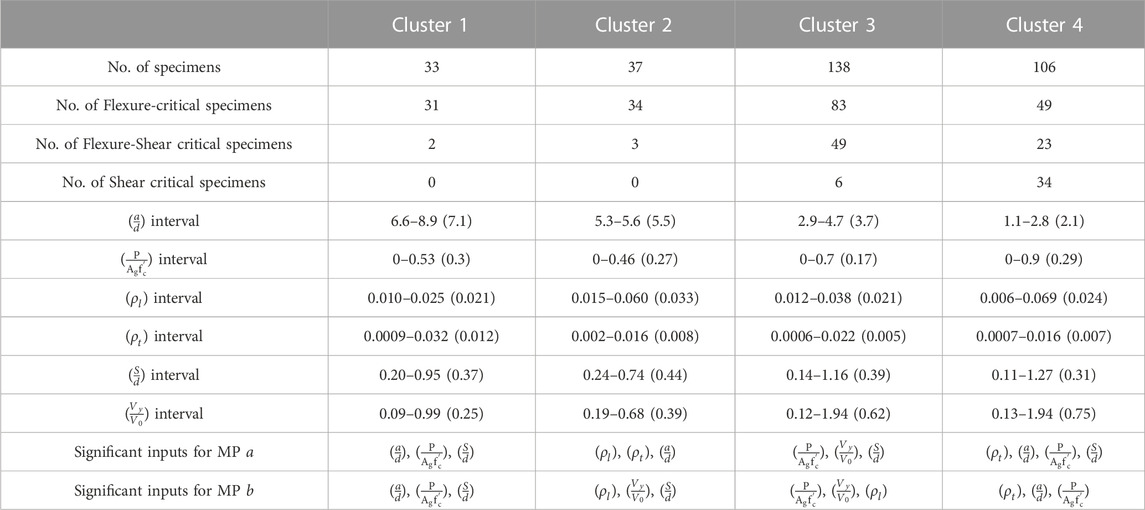
TABLE 1. Data analytics of rectangular column clusters.
Of the four data clusters in Figure 4A and Table 1, clusters 2 and 3 are of most interest for this study. These clusters correspond to intermediate columns with shear span-to-depth ratios between 3 and 6, and with a large percentage of columns failing in flexure (Table 1). Among clusters 2 and 3, cluster 2 had the largest percentage of columns identified as failing in flexure while cluster 3 columns had smaller shear span-to-depth ratios.
Figure 4B shows the same analysis for another subset of data including flexure critical columns with span-to-depth ratio between 3–7 and axial load ratio less than 0.5. This subset was created through trial and error to be representative of new construction building columns considering commonly used column dimensions, axial load limits in the 318 Building Code, amount of transverse reinforcement, and mode of failure, and is designated throughout this study as the flexure-critical empirical subset. Figure 4B shows that the background color was similar for all columns in the flexure-critical empirical subset, which is indicative of linear relationships between inputs and outputs.
The goal of the cluster analysis and the creation of the flexure-critical empirical subset was to identify larger sets of data to develop MP equations than subsets including columns that strictly complied with the provisions in Chapter 18 of the 318 Building Code. Larger sets improve statistical significance and improve the opportunity to capture the effects of input variables on MPs, while constraining the analysis to columns with large deformation capacities.
The next step in the process was to choose and calibrate a machine learning model that captured the effect of input variables on MPs. We also evaluated the accuracy of different machine learning algorithms to estimate column non-linear modeling parameters a and b. We found that deep Neural Networks (NNs) were the most accurate machine learning models to match experimentally measured values in a database of 490 pseudo-static column tests. The analysis showed that NN models provided the most accurate estimates and that NN accuracy did not diminish at the periphery of the experimental data set. The NN models are available to users through a GUI script in GitHub1 and also through a web service2.
Different linear regression and non-linear models like Decision Tree (DT), Polynomial Regression Model (PRM) and Neural Network (NN) were used to identify the machine learning algorithm that provided the most accurate estimates of MPs a and b. All models were trained using 85% of the data selected at random and evaluated using the remaining 15%. Accuracy metrics R2 and MSE for MP a of rectangular columns are presented in Table 2 for both the complete column set, including all clusters, and the subset including only columns identified as having failed in flexure. A combination of high accuracy for the training subset and low accuracy for the evaluation subset is indicative of a tendency to overfit the data. Low accuracy for both the training and evaluation subsets are indicative of a tendency to underfit the data.
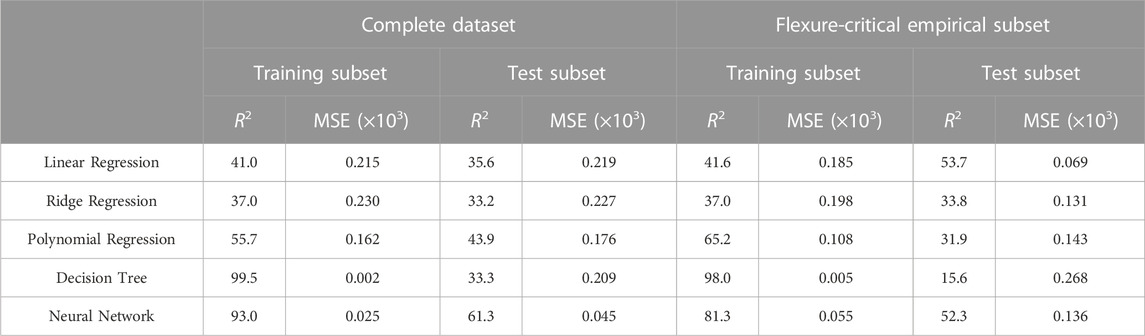
TABLE 2. Accuracy metrics R2 and MSE for MP a of rectangular columns calculated with different machine learning algorithms.
Accuracy metrics in Table 2 indicate that for the complete dataset the DT model had a tendency to overfit that data while the linear regression models had a tendency to underfit the data. The NN and PRM performed the best capturing the non-linearity of the complete dataset. The most accurate estimates of MP a for rectangular columns were provided by the NN model, which did not exhibit tendencies to overfit or underfit the data.
For the flexure-critical empirical subset the analysis illustrated in Figure 4 indicates that non-linearity of the data set decreased by choosing columns with similar behavior, which reduced the tendency of linear regression models to underfit the data and improved their accuracy as indicated by the metrics in Table 2. For this subset, the accuracy of the linear regression models for the evaluation set improved so much that it was comparable or better to that of the NN model for MP a. These linear regression models were used to create the equations to calculate new construction column MPs proposed in this study.
Partial dependence plots (PDP)
Partial Dependence Plots (PDPs) (Friedman, 2001) are presented to illustrate the marginal effect that each feature had on the predicted outcome of the NN model, and to identify mathematical expressions that adequately represent their effect on MPs. These plots show the relationship between the NN model output and each input variable for different sets of data in the database. The optimal statistical distribution of each input was determined using the Kolmogorov-Smirnov test in Scipy (Virtanen et al., 2020). After that, 100,000 samples were generated for each point of the PDP (Friedman, 2001) using the optimal statistical distribution. For each point, the input variable under study was kept constant and combined with variations of the remaining input variables to generate an input set, which was fed to the NN model. The average of the outputs of all input sets along with the average plus and minus two times the standard deviation are plotted in Figure 5 for MP a of rectangular columns for the complete dataset (Figure 5A) and the flexure-critical empirical subset (Figure 5B).
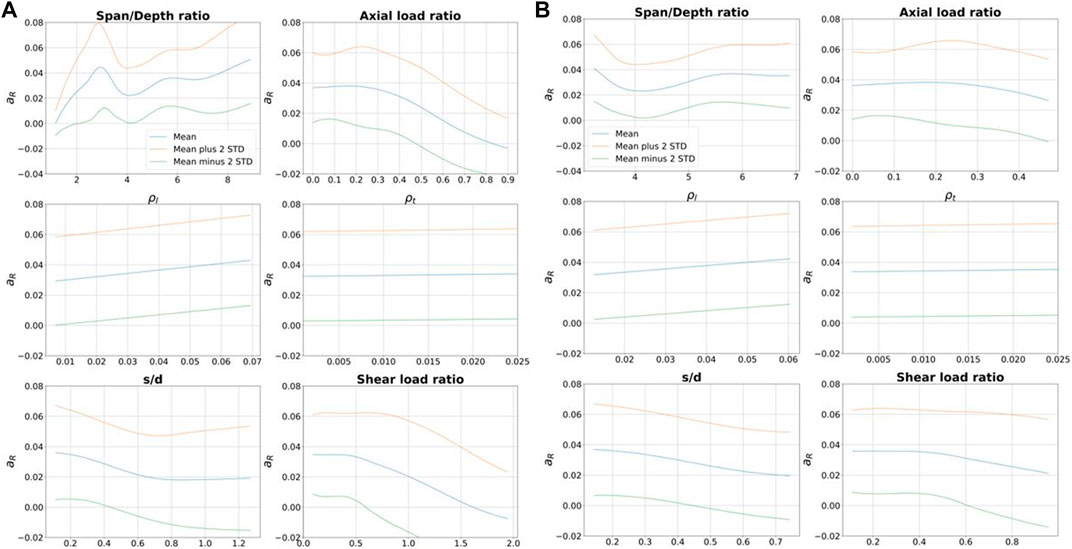
FIGURE 5. PDPs for MP a of rectangular columns for (A) the whole data set and (B) flexure-critical empirical subset.
Figure 5A shows that for the complete dataset, the relationships between input variables and NN model output are non-linear, except for
A p-value analysis was performed to control the degree of importance of each input variable. In this type of analysis lower p-values are indicative of higher statistical significance. Calculated p-values for each variable presented in Table 3 indicate that the
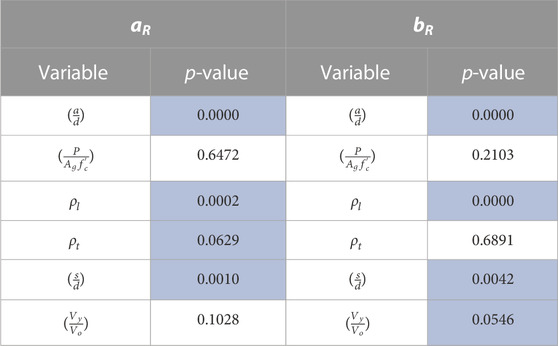
TABLE 3. p-value analysis for the flexure-critical empirical column subset.
Using the most influential parameters, linear regression models were fitted to offer a simple set of formulas (Eqs 1, 2) to estimate non-linear MPs of flexure-critical rectangular columns.
Accuracy metrics R2, Mean Squared Error (MSE), and standard deviation, mean and coefficient of variation of the measured to calculated ratio for Eqs 1, 2 were compared with metrics for Table 4 in ACI 374.3R (374, 2016) and the column MP equations in ASCE 41-17 (Engineers, 2017) in Table 4. As it shown in Table 4, for all the metrics, the proposed formula provided much more accurate estimates of MPs a and b than ACI 374.3R and ASCE 41-17 (374, 2016; Engineers, 2017).
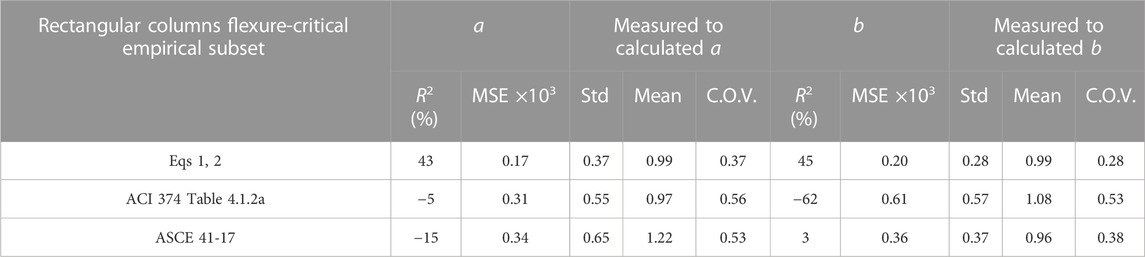
TABLE 4. Accuracy metrics for proposed equations, ACI 374.3R and ASCE 41-17 for rectangular columns in the flexure-critical empirical subset.
A similar analysis was performed for columns in clusters 2 and 3 to provide a measure of how the different procedures perform for a broader set consisting of columns with flexure-shear and flexure-critical columns that with a significant number of specimens that although had ductile behavior did not meet the detailing requirements in Chapter 18 of the ACI 318 Building Code. For example, Table 1 shows that clusters 2 and 3 included some columns with hoop spacing exceeding d/2. The 2D visualization of the cluster 2 + cluster 3 dataset and the negative log-likelihood is presented in Figure 6. Although all the specimens (black dots) appear in a fringe with similar background color, they are clearly grouped in two different clusters.
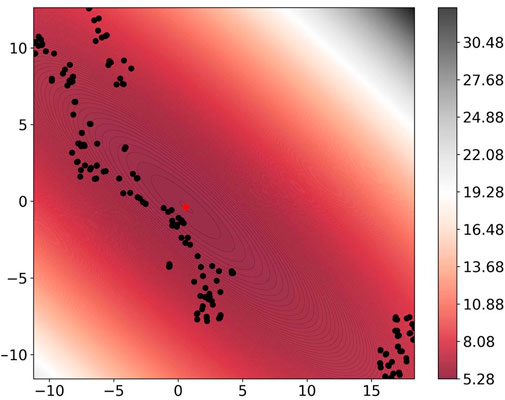
FIGURE 6. The Negative log-likelihood predicted by GMM for clusters 2 and 3.
The PDPs for MP a of columns in clusters 2 and 3 are presented in Figure 7. As it shown in the figure, all input variables with the exception of
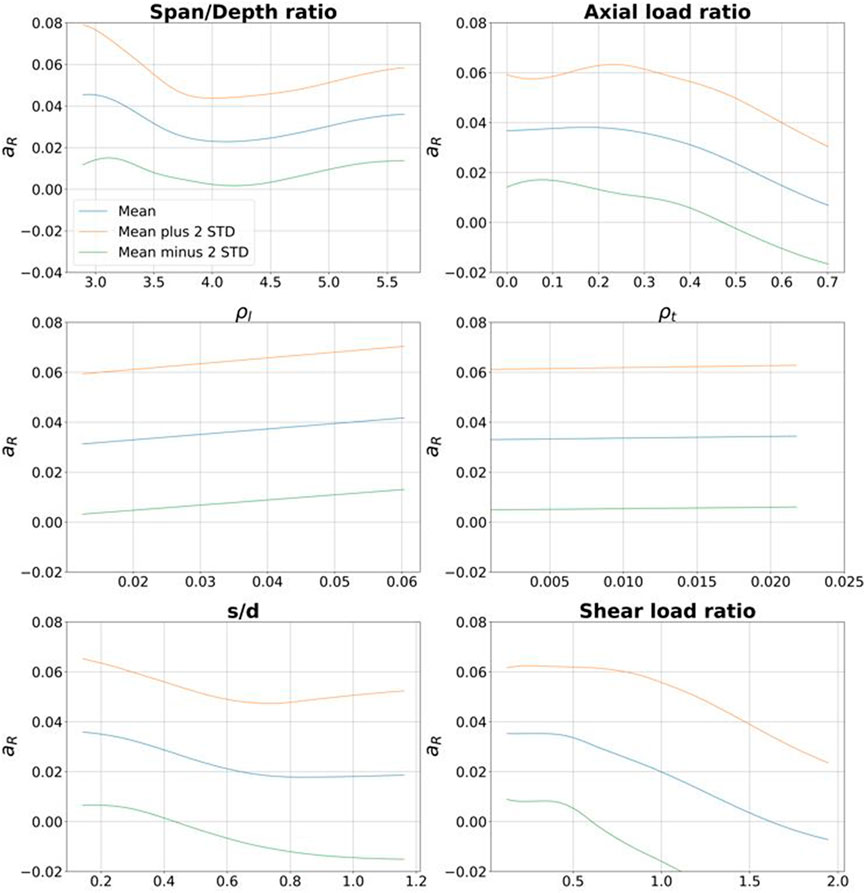
FIGURE 7. PDPs for MP a of rectangular columns for clusters 2 and 3.
A p-value analysis was performed (Table 5) to determine the statistical significance of input variables in the presence of the new features introduced to capture non-linearity (the second order of all input variables except
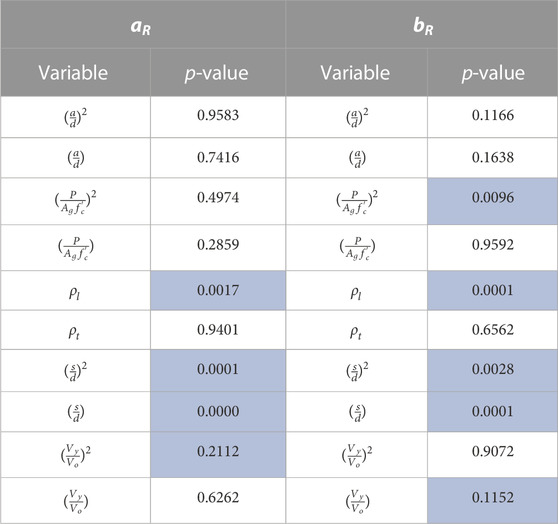
TABLE 5. p-value analysis for cluster 2 and 3 subset.
Using the most influential parameters, Polynomial Regression Models (PRM) were fitted to develop a set of formulas (Eqs 3, 4) to estimate non-linear MPs of new construction rectangular columns.
Accuracy metrics R2, Mean Squared Error (MSE) and standard deviation, mean and coefficient of variation of the measured to calculated ratio for Eqs 3, 4 are compared with those from Eqs 1, 2, calibrated based on the flexure-critical empirical data set, and ASCE 41-17 (Engineers, 2017) in Table 6.
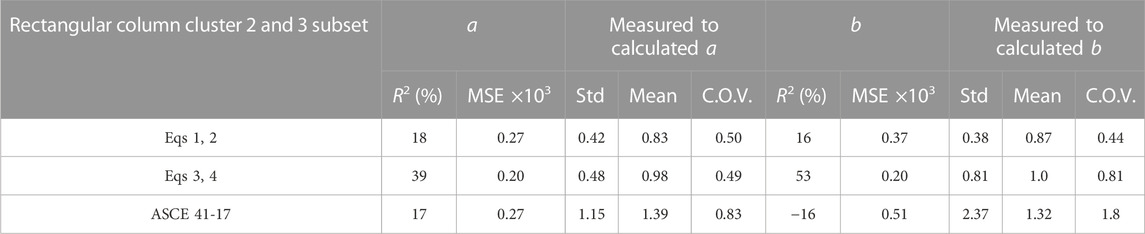
TABLE 6. Accuracy metrics for Eq. 1 through Eq. 4 and ASCE 41-17 (Engineers, 2017) for cluster 2 + cluster 3 subset.
The PRM models performed better at capturing the non-linearity of the broader dataset and provided the most accurate estimates of MPs a and b for data in clusters 2 and 3. Also, the linear regression models calibrated using the flexure-critical empirical subset (Eqs 1, 2) provided more accurate estimates of MPs a and b than ASCE 41-17 in terms of standard deviation, mean and coefficient of variation of measured to calculated target outputs, as well as a lower MSE for MP b. The lower flexibility of Eqs 1, 2 and the ASCE 41-17 equations with respect to Eqs 3, 4 is also reflected in the mean measured-to-calculated ratios for MPs a and b. Equations 1, 2, calibrated on the basis of the most ductile data set, had the lowest mean values (0.83 and 0.87 for MPs a and b). Equations 2, 3, calibrated on the basis of less ductile columns than Eqs 1, 2, had mean values of approximately 1.0. The equations in the ASCE 41-17 provisions (Engineers, 2017), calibrated using the largest number of non-ductile columns, had the highest mean values (1.39 and 1.32 for MPs a and b).
The cumulative distribution of column total rotation for the three data sets (the complete database, clusters 2 and 3, and the flexure-critical empirical subset) are shown in Figure 8. Section 16.4 of ASCE 7 (ASCE, 2007) states that mean drift ratio must not exceed two times the limits in Table 12.12-1, which for most structures in Risk categories I or II is 2%. The vertical line in Figure 8, designated minimum allowable drift capacity, corresponds to a total rotation of 4% (2 times 2%) and all columns to the right of the vertical line exceed this limit. Figure 8 shows that the flexure-critical empirical subset had the lowest percentage of columns not meeting this limit (approximately 25%), followed by the cluster 2 + cluster 3 subset (approximately 32%) and the complete dataset (approximately 50%).
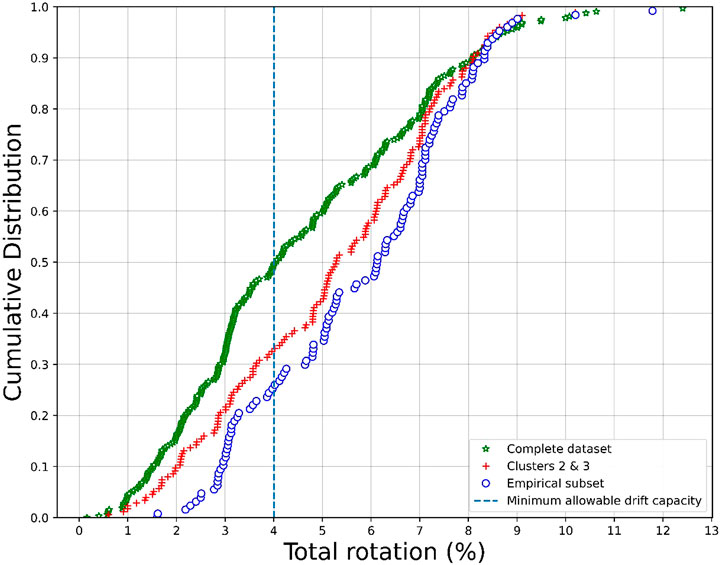
FIGURE 8. Cumulative distribution of the total rotation of rectangular columns.
A simplification was performed by eliminating input variable a/d from Eqs 1, 2 taking advantage of the fact that the effect of this parameter is relatively small for columns with a/d ratios between 3 and 5 of typical building columns (Figures 5A, B). The simplified Eqs 5, 6 for MPs or rectangular columns include only 3 input variables.
Accuracy and precision metrics for Eqs 1–6, ACI 374R3 Table 4 and ASCE 41-17 equations for the subset of specimens showing total rotation capacity exceeding 4% are presented in Table 7. Simplified Eqs 5, 6 had similar MSEs to Eqs 1–4, and much lower MSEs than existing provisions. Similarly, Eqs 5, 6 had significantly lower COVs than existing provisions.

TABLE 7. Performance metrics for Eqs 1–6, ACI 374.3R Table 4 and ASCE41-17 equations for rectangular columns with rotation capacity greater than 4%.
Circular column analysis
Log-likelihood scores of circular column data is presented in Figure 9. The procedure to create Figure 9 is the same used for rectangular columns. Figure 9A shows that there were two distinct clusters for circular columns, with the center of each shown with a red dot. Salient features of the two clusters are presented in Table 8. The mean (

FIGURE 9. The Negative log-likelihood predicted by GMM for (A) the whole dataset and (B) flexure-critical subset for circular columns.
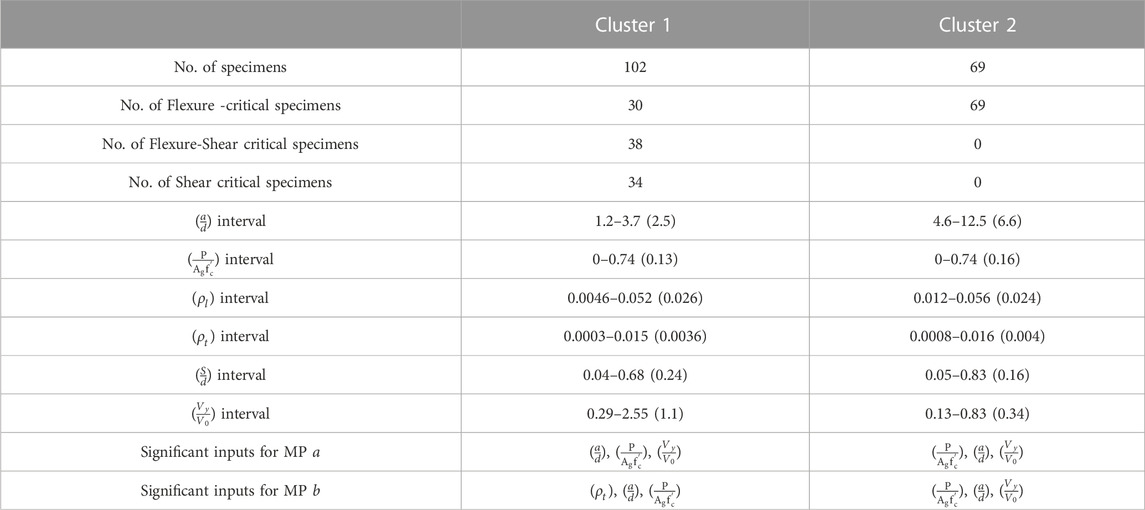
TABLE 8. Data analytics for circular column clusters.
Figure 9B shows the log-likelihood score of circular columns labelled as flexure critical in the database, without any constraint on the span-to-depth and axial load ratios. Figure 9B shows that all black dots had similar scores, indicative of linear behavior of all the data in the flexure-critical subset, which was taken as representative of new construction columns.
Following the same procedure used for rectangular columns a p-value analysis was conducted to the significance of each input variable. The results of the p-value analysis are presented in Table 9. These values indicate that
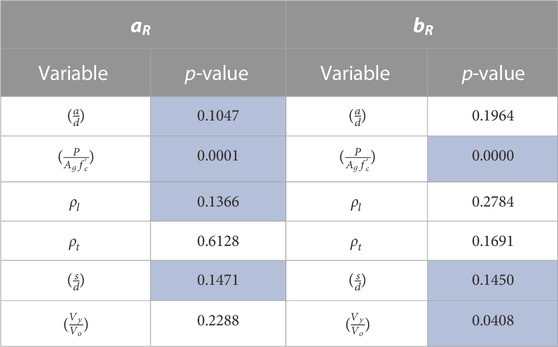
TABLE 9. p-value analysis for the flexure-critical circular column subset.
Linear regression models including the most influential parameters were fitted to the test data, resulting in Eqs 7, 8 to estimate non-linear MPs of new construction circular columns.
Accuracy metrics R2, Mean Squared Error (MSE) and standard deviation, mean and coefficient of variation of the measured to calculated ratio for Eqs 7, 8 are compared with performance metrics for Table 4 of ACI 374.3R and ASCE 41-17 (374, 2016; Engineers, 2017) equations in Table 10.
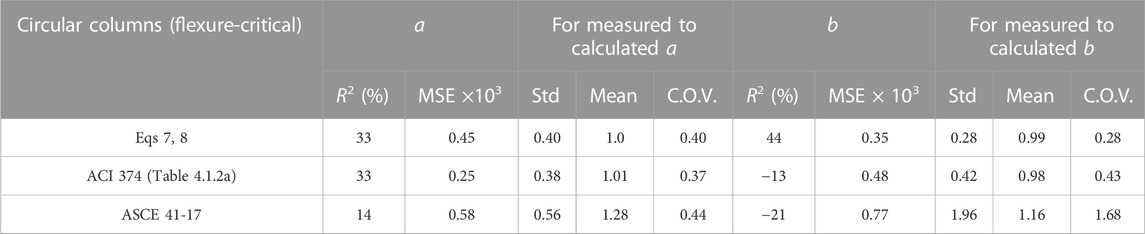
TABLE 10. Performance metrics for Eqs 7, 8; Table 4 of ACI 374.3R and ASCE 41-17 equations for new construction circular columns.
As it shown in Table 9, for all the metrics, the proposed equations provided better estimates than ASCE 41-17 (Engineers, 2017) estimates, especially for the MP b. The proposed equations had similar performance metrics as Table 4 for MP a, but significantly better performance for MP b.
Following the same procedure adopted for rectangular columns a simpler set of equations was created for columns with span-to-depth ratios between 3–5, typical of building structures. The regression model was recalibrated based on the new empirical subset. Simplified Eqs 9, 10 for MPs of circular columns include only the three most significant parameters.
The cumulative distribution of column total rotation for the three data sets (the complete database, clusters 2, and the flexure-critical subset) are shown in Figure 10. The vertical line in Figure 10 corresponds to a total rotation of 4%, or 2 times 2%, and all columns to the right of the vertical line exceed this limit. Figure 10 shows that the cluster 2 subset had the lowest percentage of columns not meeting this limit (approximately 11%), followed by the flexure-critical subset (approximately 32%) and the complete dataset (approximately 41%). Figure 10 shows that in general columns in the circular column set have higher deformation capacities than columns in the rectangular column set.
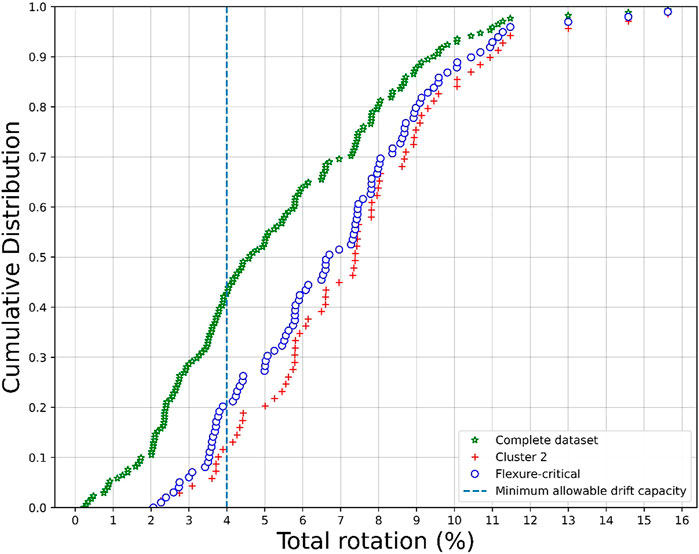
FIGURE 10. Cumulative distribution of the total rotation for circular column set and subsets.
Performance metrics for Eqs 7–10 and the equations for circular columns in ASCE 41-17 (Engineers, 2017) for the subset of specimens showing total rotation capacity more than 4% in the database is presented in Table 11. On the basis of this column subset, the performance of Eqs 7–10 is better than existing code provisions.
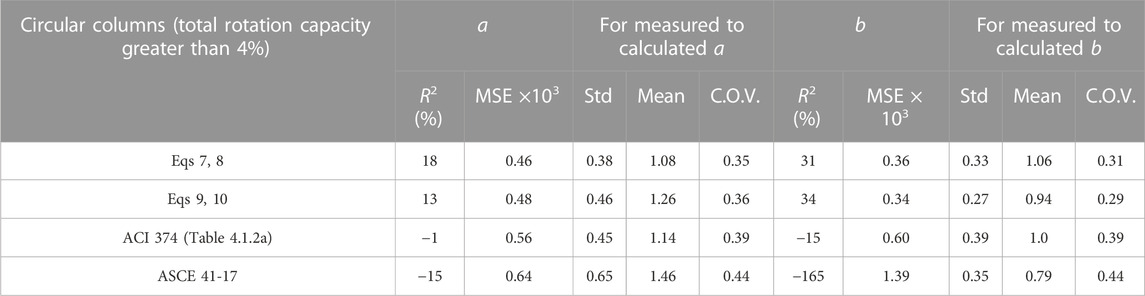
TABLE 11. Performance metrics for Eqs 7–10 and ASCE 41-17 equations for MPs of circular columns with rotation capacity exceeding than 4%.
Conclusion
The main hypothesis of the study was that the machine learning methodology adopted could produce more accurate equations for new-construction column MPs and increase their statistical significance by identifying a larger training subset with a lower degree of non-linearity between input parameters and model output. It was found that the accuracy of modeling parameters calculated with the simplified proposed Eqs 5, 6, 9, 10, for rectangular and circular columns respectively, was better than existing provisions in ACI 374.3R and ASCE 41-17. It was also found that equations calibrated using data from older and new construction columns, such as the provisions in ASCE 41-17, produce significantly more conservative estimates of new construction column modeling parameters than equations calibrated solely with experimental data from new construction columns. This observation is important because ACI 374.3R, Appendix A of the 318-19 Building Code and ASCE-7 allow the use of column modeling parameters in ASCE 41-17 to create non-linear models, and their conservatism may lead to bias in calculated element deformations and estimates of damage. For this reason it is recommended that the proposed equations be used to create non-linear models for new construction instead of the provisions in ASCE 41-17.
In regards to the machine learning methodology used in the study, it was found that visualizing data in the 2D space and clustering the specimens in bins was a successful approach to reduce the non-linearity of relationships between input variables and MPs for new construction columns. It was also found that reducing the degree of non-linearity by taking advantage of machine learning to choose better calibration sets for linear regression improved the accuracy and precision of MP estimates within the range of interest. Using this approach, the study produced simple and accurate formulas to estimate non-linear MPs of new construction columns (Eqs 5, 6, 9, 10) with better performance than ACI 374.3R and ASCE 41-17. The study showed that both trial and error and the combined use of the TSNE algorithm (Van der Maaten and Hinton, 2008) the Gaussian Mixture Model (GMM) can be successfully used as a means to calculate log-likelihood scores and visualize the non-linearity of the data in 2D space for the purpose of identifying subsets with similar characteristics. PDPs generated with machine learning models were used to confirm that subsets identified in this manner had linear relationships between model inputs and outputs.
An evaluation of different machine learning algorithms showed that NN models provided the best estimates of MPs for the complete column dataset, which encompassed columns with different modes of failure and had highly non-linear relationships between input parameters and model output. It was found that the clustering approach adopted in this study was successful in reducing the degree of non-linearity in the relationships between input parameters and model output. To that effect, it was found that simple linear regression models were as effective as NN models for estimating MPs of the flexure-critical empirical column subset, where non-linearity between input parameters and model output is not significant, and did not exhibit tendencies to overfit or underfit the data. The effect of column set non-linearity on the accuracy of linear regression models was confirmed through the calibration of linear and polynomial regression models. It was shown that linear models lost precision as the non-linearity of the data set increased, and that polynomial regression models including higher order features of input variables became more effective than simple regression models as the non-linearity of the problem increased. It was also shown that NN models were the most effective in adapting to the non-linearity of the column data set and provided the best estimates of column modeling parameters.
Data availability statement
The original contributions presented in the study are included in the article/supplementary material, further inquiries can be directed to the corresponding author.
Author contributions
HK performed writing-original draft, conceptualization, methodology, and programming. AdM performed writing review and editing, conceptualization, and methodology. ArM performed data curation. AS performed investigation.
Conflict of interest
The authors declare that the research was conducted in the absence of any commercial or financial relationships that could be construed as a potential conflict of interest.
Publisher’s note
All claims expressed in this article are solely those of the authors and do not necessarily represent those of their affiliated organizations, or those of the publisher, the editors and the reviewers. Any product that may be evaluated in this article, or claim that may be made by its manufacturer, is not guaranteed or endorsed by the publisher.
Footnotes
1H, K. K. GitHub repository address. Available at; https://github.com/hamidkhodadadi/NN-models_MPs.
2H, K. K. The NN and classification model web service at. Available at; https://cloudcomputing-web-331222.uc.r.appspot.com.
References
318-19 A, 2019 318-19, A, (2019). Building code requirements for structural concrete (ACI 318-19) and commentary, Farmington Hills, United States: ACI Committee.
374 A, 2016 374, A, (2016). Guide to nonlinear modeling parameters for earthquake-resistant structures. ACI Report No. 374.3 R-16. Farmington Hills, United States: American Concrete Institute Farmington Hills.
41–13 A, 2007 41–13, A, (2007). Asce 41-13: Seismic evaluation and upgrade of existing buildings. Virginia, United States, American Society of Civil Engineers Reston.
Aci-369. 1-17, (2017). Standard requirements for seismic evaluation and retrofit of existing concrete buildings. Farmington Hills, United States: America Concrete Institute Farmington Hills.
Asce, (2017). Seismic rehabilitation of existing buildings. Virginia, United States: American Society of Civil Engineers.
Dabiri, H., Rahimzadeh, K., and Kheyroddin, A. (2022). “A comparison of machine learning-and regression-based models for predicting ductility ratio of RC beam-column joints,” in Structures (Amsterdam, Netherlands: Elsevier), 69–81.
Duda, R. O., and Hart, P. E. (1973). Pattern classification and scene analysis. New York, United States: Wiley.
Elwood, K. J., Matamoros, A. B., Wallace, J. W., Lehman, D. E., Heintz, J. A., Mitchell, A. D., et al. (2007). Update to ASCE/SEI 41 concrete provisions. Earthquake Spectra 23 (3), 493–523. doi:10.1193/1.2757714
Elwood, K. J., and Moehle, J. P. (2005a). Axial capacity model for shear-damaged columns. ACI Structural Journal. 102 (4), 578. doi:10.14359/14562
Elwood, K. J., and Moehle, J. P. (2005b). Drift capacity of reinforced concrete columns with light transverse reinforcement. Earthquake Spectra 21 (1), 71–89. doi:10.1193/1.1849774
Engineers, A. S. o. C. (2017). Seismic evaluation and retrofit of existing buildings. Virginia, United States: American Society of Civil Engineers.
Friedman, J. H. (2001). Greedy function approximation: A gradient boosting machine. Annals of Statistics, 1189–1232. 29, doi:10.1214/aos/1013203451
Ghannoum, W. M., and Matamoros, A. (2014). Nonlinear modeling parameters and acceptance criteria for concrete columns. ACI Special Publication. 297 (1), 1–24. doi:10.14359/51686898
Ghannoum, W., Sivaramakrishnan, B., Pujol, S., Catlin, A., Fernando, S., Yoosuf, N., et al. (2012). ACI 369 rectangular column database. Network for Earthquake Engineering Simulation (database), Dataset 10, D36688J50. doi:10.4231/D36688J50
Lynn, A. C. (2001). Seismic evaluation of existing reinforced concrete building columns. California, United States, Berkeley: University of California.
Matamoros, A., Matchulat, L., and Woods, C. (2008). “Axial load failure of shear critical columns subjected to high levels of axial load,” in The 14th World Conference on Earthquake Engineering,Citeseer: Citeseer). October 2008, Beijing, China,
NIST GCR 17-917-46 v1, (2017). Guidelines for nonlinear structural analysis for design. Applied Technology Council. doi:10.6028/NIST.GCR.17-917-46v1
Sezen, H., and Moehle, J. P. (2006). Seismic tests of concrete columns with light transverse reinforcement. ACI Structural Journal. 103 (6), 842. doi:10.14359/18236
Shahin, M., Chen, F. F., Hosseinzadeh, A., Khodadadi Koodiani, H., Bouzary, H., and Shahin, A. (2023). Enhanced safety implementation in 5S+ 1 via object detection algorithms. The International Journal of Advanced Manufacturing Technology in press, 1–21. doi:10.1007/s00170-023-10970-9
Thai, H.-T. (2022). “Machine learning for structural engineering: A state-of-the-art review,” in Structures (Elsevier), Amsterdam, Netherlands, 448–491.
Van der Maaten, L., and Hinton, G. (2008). Visualizing data using t-SNE. Journal of Machine Learning Research. 9 (11).
Virtanen, P., Gommers, R., Oliphant, T. E., Haberland, M., Reddy, T., Cournapeau, D., et al. (2020). SciPy 1.0: Fundamental algorithms for scientific computing in Python. Nature Methods 17 (3), 261–272. doi:10.1038/s41592-019-0686-2
Keywords: machine learning, dimension reduction, modeling parameters, non-linear responce, Asce 41, ACI 374, concrete columns, deformation capacity
Citation: Khodadadi Koodiani H, Majlesi A, Shahriar A and Matamoros A (2023) Non-linear modeling parameters for new construction RC columns. Front. Built Environ. 9:1108319. doi: 10.3389/fbuil.2023.1108319
Received: 25 November 2022; Accepted: 28 February 2023;
Published: 27 March 2023.
Edited by:
Mohammad Salehi, Rice University, United StatesReviewed by:
Afaq Ahmad, University of Engineering and Technology, PakistanMohammad Abbasi, University of Nevada, Reno, United States
Copyright © 2023 Khodadadi Koodiani, Majlesi, Shahriar and Matamoros. This is an open-access article distributed under the terms of the Creative Commons Attribution License (CC BY). The use, distribution or reproduction in other forums is permitted, provided the original author(s) and the copyright owner(s) are credited and that the original publication in this journal is cited, in accordance with accepted academic practice. No use, distribution or reproduction is permitted which does not comply with these terms.
*Correspondence: Hamid Khodadadi Koodiani, aC5rb29kaWFuaUBnbWFpbC5jb20=