 Pierino Lestuzzi
- Earthquake Engineering and Structural Dynamics Laboratory (EESD), School of Architecture, Civil and Environmental Engineering (ENAC), Swiss Federal Institute of Technology Lausanne (EPFL), Lausanne, Switzerland
This paper provides a simplified tool for preliminary seismic assessment of the out-of-plane behavior of non-structural walls, such as unreinforced masonry partition walls, based on non-linear time-history analyses. The studies are performed using equivalent single-degree-of-freedom systems and trilinear hysteretic models. The out-of-plane stability is investigated through statistical assessment of computed non-linear displacement demand related to spectrum-compatible ground motions. The trilinear model developed by Doherty and Griffith is used in the investigations. This hysteretic model is based on a rigid body behavior assumption and its accuracy was extensively validated using experimental results. Four sets of 12 recorded earthquakes, slightly modified to match design response spectra of different soil conditions, were used as ground motions for the non-linear time-history analyses. Non-structural walls located at the ground level as well as in the upper floors were also examined. The obtained results show that the static stability criterion provides an accurate estimate of the seismic resistance of non-structural rocking walls (i.e., vertical cantilevers with rigid body behavior). According to that criterion the ground acceleration threshold corresponds to the product of the wall aspect ratio by the acceleration of gravity (g). Compared to non-linear results, the corresponding calculated limit ground acceleration is on the safe side. Moreover, considering floor response spectra, this approach may be easily extended to non-structural walls situated in the upper storeys.
1 Introduction
Unreinforced masonry elements subjected to large dynamic lateral forces due to strong earthquake ground motions are prone to out-of-plane failure when lateral bearing is scarce and gravity loads are small (D’Ayala and Sperenza, 2002). This is generally the case for unreinforced masonry buildings with flexible floors but non-structural partition walls in other structural systems are also affected by this issue. The seismic vulnerability of unreinforced masonry elements is well established and is unfortunately demonstrated by every post-earthquake survey (e.g., Penna et al., 2014; Güney et al., 2015; Sorrentino et al., 2019). Out-of-plane failures always represent an important part of the damage for both structural and non-structural elements. Non-structural elements are seismically vulnerable and they even constitute the essential part of the damages by moderate earthquakes (Basset-Salom and Guardiola-Villora, 2014). Life safety may of course be compromised by the failure of non-structural walls and, in the industrial context, business interruptions may also arise and lead to significant related costs.
The behavior of rocking structures subjected to earthquake excitation is not obvious. In spite of its apparent simplicity, its behavior is actually non-linear and requires advanced methods to analyze it accurately. The seismic stability of rigid blocks has been investigated by several studies, mostly performed by Greek researchers, because this problem arises by the seismic safety evaluation of ancient temples (e.g., Makris and Roussos, 1998; Makris and Zhang, 2000; Psycharis et al., 2000). Many experimental investigations were also performed to study the seismic stability of rigid blocks with different configurations and aspect ratios (e.g., Griffith et al., 2004; Al Shawa et al., 2012; Sironi et al., 2023). Several analytical investigations are also available. Among them, Dimitrakopoulos and DeJong (2012) derived analytical relationships for the block rotation and for the signal features needed to overturn the block. The researchers studied both sinusoidal and cosinusoidal signals. According to that study, the critical parameters for the seismic behavior of rigid blocks are the length of the block semi-diagonal (R), the aspect ratio (i.e., the ratio between the block width and the block height), the frequency content of the ground motion, the intensity of the seismic action, and the damping. For a constant aspect ratio, the larger the blocks are, the more stable they are.
2 Rigid bodies behavior
Based on experimental findings, the out-of-plane seismic response of masonry walls may be analyzed assuming a rigid body behavior (Figure 1). Such an approach may be used for both non-structural and structural brick masonry walls. Moreover, this approach may be extended to the investigation of stone masonry walls built with good craftmanship.
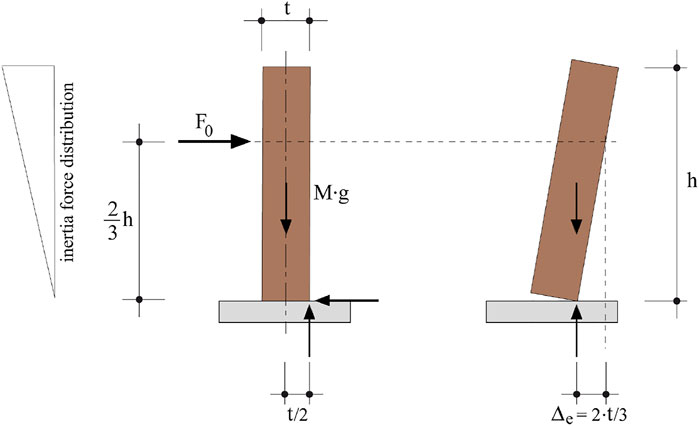
FIGURE 1. Rigid body diagram for the out-of-plane behavior of non-structural cantilevered masonry walls (Doherty et al., 2002).
According to this model, the dynamic characteristics for both non-structural cantilever and simply supported structural walls may be expressed as follows (Doherty et al., 2002):
with M: wall mass t: wall thickness
2.1 Trilinear hysteretic model
Based on extensive experimental results, Doherty and Griffith (Doherty et al., 2000 and; 2002; Griffith et al., 2004) developed a trilinear hysteretic model in order to simulate the out-of-plane behavior of masonry walls. Figure 2 shows the proposed hysteretic model (Doherty et al., 2002).
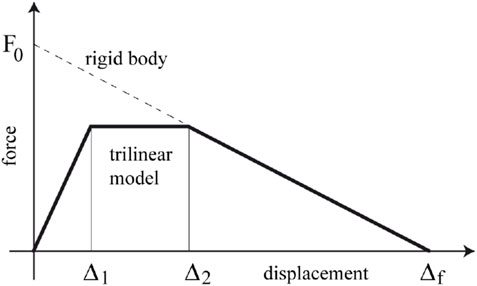
FIGURE 2. Trilinear hysteretic model (Doherty et al., 2002).
The displacements (Δ1 and Δ2) defining the hysteretic model curve are specified with respect to the maximal displacement (Δf = Δe) in function of the state of degradation at cracked joints (Doherty et al., 2002), as given in Table 1.

TABLE 1. Empirically derived trilinear F-Δ defining displacements in the related model (Doherty et al., 2002).
The corresponding natural frequency may be determined by considering an effective stiffness corresponding to a secant stiffness that intersects the hysteretic curve at Δ2 (Doherty et al., 2002) (see Figure 3). With this assumption, the natural frequency is a function of the degradation state of the joints (see Table 1).
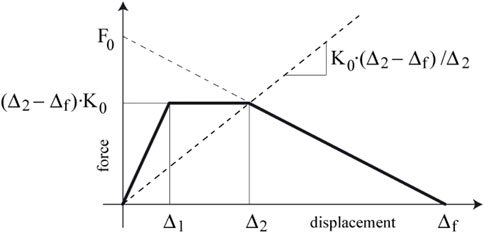
FIGURE 3. The natural frequency is determined considering a secant stiffness (Doherty et al., 2002).
According to the above assumption, the natural frequency and natural period in case of moderate degradation of the cracked joints are as follows:
with h: wall height g: acceleration of gravity
According to a limited development in Taylor’s series for a height around 2.25 m, it could be shown that the natural period may be approximated using Eq. 4, resulting in an estimate of the natural period with an exceedance of less than10% for wall heights up to 5.5 m.
with h: wall height
As the trilinear hysteretic curve does not include the effects of energy dissipation (hysteretic loops without included area), damping is the key parameter controlling the seismic response within the non-linear domain. Based on experimental results on masonry walls, Doherty and Griffith proposed to consider a viscous damping ratio with a value between 3% and 5% (Doherty et al., 2002; Griffith et al., 2004).
2.2 Validation
For this study, the trilinear hysteretic model has been implemented in the numerical computation software MatLab. The solution of the equation of motion is performed using the central difference method (Chopra, 2001).
The trilinear model was developed based on a series of experimental tests (Griffith et al., 2004). One of these tests was recalculated in order to validate the results of the non-linear computation obtained with MatLab. The considered experimental test is a dynamic test performed with a wall of 1.5 m high and 110 mm and thick, supported at the top and bottom and subjected to the El Centro earthquake (Griffith et al., 2004). A maximum displacement of 44 mm was measured for an earthquake scaled to 50%, while the wall overturned at 66% of the full earthquake. The calculations were performed for moderately degraded joints and a viscous damping ratio of 5%. The results obtained with MatLab are in very good agreement with the peak displacement of 45 mm for a 50% earthquake found in the experimental investigation (Figure 4) and with the overturning limit for 62% of the El Centro earthquake (Figure 5).
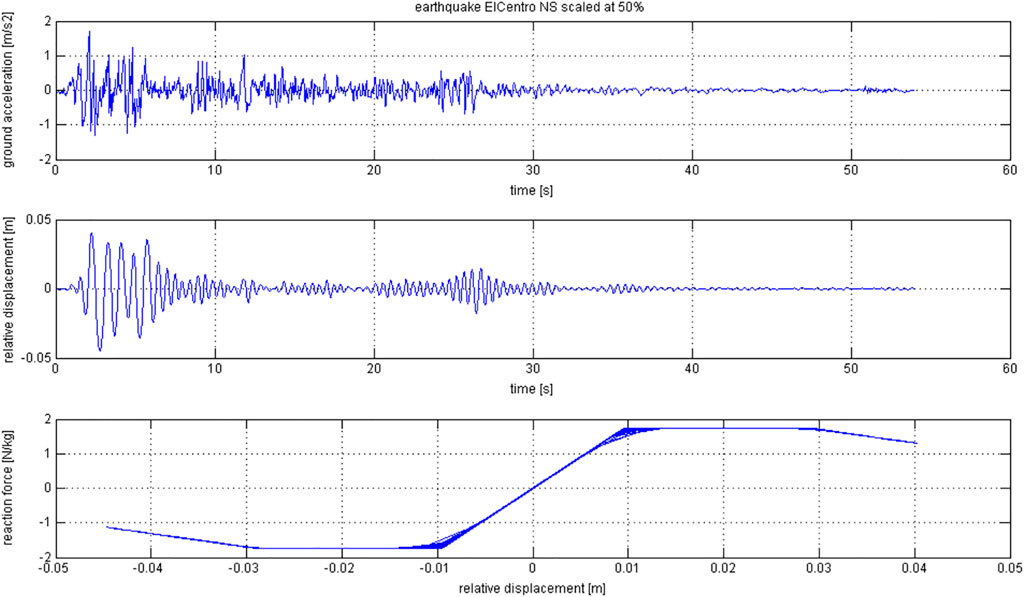
FIGURE 4. Non-linear computed response for 50% of El Centro. The peak displacement is 45 mm.

FIGURE 5. Non-linear computed response for 62% of El Centro. The wall practically reaches the onset of overturning.
3 Non-linear time-history analysis
The methodology used in this study consists in the computation of the non-linear responses for the equivalent SDOF systems subjected to earthquake records as illustrated in Figure 6. The first step investigated the case for which the non-structural walls is located at the ground level. Several sets of 12 records selected from the European Strong Motion Database (Ambraseys et al., 2002), slightly modified to match design response spectra for different soil conditions, were used in the non-linear time-history analysis (NLTHA).

FIGURE 6. Schematic description of the methodology for the case of non-structural walls located at the ground level.
The cases for which the non-structural walls are not located at the ground level but in the upper floors of the main structure were examined next, in a second step, according to the schematic description of Figure 7. The main structure is considered as the primary structure and the non-structural wall as subsystem. Assuming that subsystem-primary structure interaction can be neglected, the analysis of subsystem response can be simplified using an uncoupled analysis. In this simplified analysis, the floor response spectrum method is used to obtain the total acceleration at the subsystem attachment point (Oropeza et al., 2010). For each ground motion (Figure 7A), the seismic response of the primary structure is firstly computed. This response of the primary structure, expressed as a relative acceleration is then added to the ground acceleration to obtain the total acceleration at the top of the primary structure (Figure 7B), and finally introduced as input to the subsystem (Figure 7C). The latter has a unique seismic response from which the corresponding acceleration response spectrum (called floor acceleration response spectrum) may be computed.
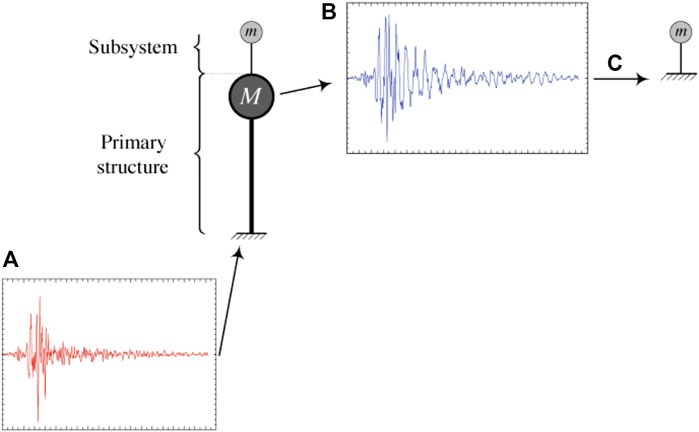
FIGURE 7. Schematic description of the used methodology for the case of non-structural wall situated at the upper floors of the main structure (Oropeza et al., 2010) (A) ground motion (B) top acceleration of the primary structure (C) input to the subsystem.
Several analytical expressions for the floor response spectrum are available. According to NTC (2008), an usual amplification with respect to the period ratio (TS/T1) may be expressed by Eq. 5.
with TS: natural period of the non-structural wall T1: fundamental period of the main structure
3.1 Design spectra
Design spectra corresponding to Eurocode 8 (2004) response spectrum are used in this study. More specifically, the Swiss building code SIA 261 (2020) parameters for different soil conditions are used. In Switzerland the type 1 EC8 response spectrum is used and 5 soil conditions are defined according to soil classes A to E of EC8. The main parameters of the elastic response spectra are listed in Table 2. The plateau is defined by the corner periods TB and TC and the soil parameter (S) for its level. The corresponding maximum value (Se,max = 2.5·S·agd) is related to the ground acceleration (agd) and a constant amplification value of 2.5. The period TD is equal to 2 s for all soil classes and defines the beginning of the constant displacement spectral range. The related response spectra are plotted in Figure 8 for a ground acceleration (agd) of 1 m/s2 corresponding to the seismic zone Z2 in the Swiss building code SIA 261 (2020).

TABLE 2. Parameters defining the response spectrum for the different soil classes SIA 261 (2020).

FIGURE 8. Elastic response spectra for the different soil classes in a seismic zone Z2 (SIA 261 2020).
Soil classes B to E are considered in the investigations. Soil class A was not included in the calculations because the corresponding shape of the response spectrum is practically identical to the one of soil class E since only the S values are different (TC values are equal for both soil classes).
3.2 Ground motion records
Ground motion records were first selected in order to match the considered response spectrum (target spectrum), explained in the previous section. Records were ordered through a ranking process that considered the cumulative difference between the response spectrum and the target spectrum for the records in the database. The twelve recordings with the lowest cumulative difference scored higher and were selected.
The selected recordings were modified afterwards with the non-stationary spectral matching method of Abrahamson (1992) in order to match the target spectrum individually. This technique has the important advantage that it only introduces small modifications of the records, hence the related structural response in the non-linear domain is not significantly affected. As shown by statistical characteristics of response spectra for the sets of twelve records before and after modification, the process is very efficient for matching target spectra. Response spectrum average and mean values plus and minus one standard deviation are plotted in Figure 9 for soil classes B, C, D, and E. These plots show that the selection performed on the twelve recordings for each set already leads to a good match with respect to mean values. The plots after slight modification using the method of Abrahamson show the improvement in matching the target spectrum, as well as the significant reduction in the variability.
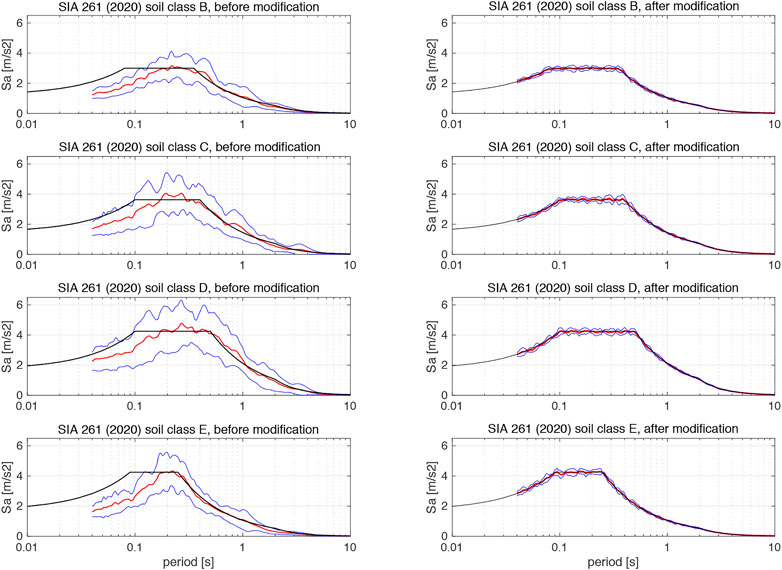
FIGURE 9. Statistical characteristics of the response spectra for the sets of the twelve records selected for the best fit to the response spectrum of the soil classes B to E of SIA 261 2020 before (left) and after (right) modification for matching target spectrum.
3.3 Parameters and results assessment
The calculations are achieved for a reference cantilever wall with a height of 2.4 m corresponding to a typical height in partition walls. The wall thickness is taken as a parameter varying in a range from 0.10 m to 0.40 m in order to cover a wide range of the wall aspect ratio (tw/hw = 0.042—0.167). Computation is repeated for different soil classes (B to E) under the corresponding 12 recordings. According to the rigid bodies approach, the rocking behavior of the wall is not uniquely controlled by its aspect ratio since the natural period is only related to the wall height (see Eq. 3). Thus, the wall height was considered as an additional parameter. Consequently, calculations were also performed with walls of 2.1 m, 2.7 m, and 3 m, however by keeping the same wall aspect ratio as the one of the reference wall of 2.4 m in order to assess the influence of wall height only.
The results of the non-linear time history analyses are assessed statistically by taking into account the average of the displacement demands (peak displacements) related to the corresponding 12 recordings. Similar to the approach given in the Italian standard (NTC, 2008), the ultimate displacement is considered to be reached when the average displacement demand exceeds 40% of the displacement capacity. According to the rigid bodies approach, overturning occurs when lateral displacement exceeds 2/3 of the wall thickness (Δe > 2/3 t, see Figure 1). Therefore, the displacement capacity is equal to 2/3 of the wall thickness. Considering only 40% of that value may be interpreted as a safety margin associated to this collapse mechanism.
As for an incremental dynamic analysis, starting from a low acceleration, the computations are performed by progressively increasing the records amplitudes till the average displacement demand reaches the considered ultimate displacement (see Figure 10). The obtained maximum amplification multiplied by the reference acceleration value (1 m/s2) related to the used design spectrum may be thus considered as the ultimate ground accelerations. The calculations were performed for three different values of viscous damping ratio, namely, 3%, 4%, and 5% (see Figure 11).
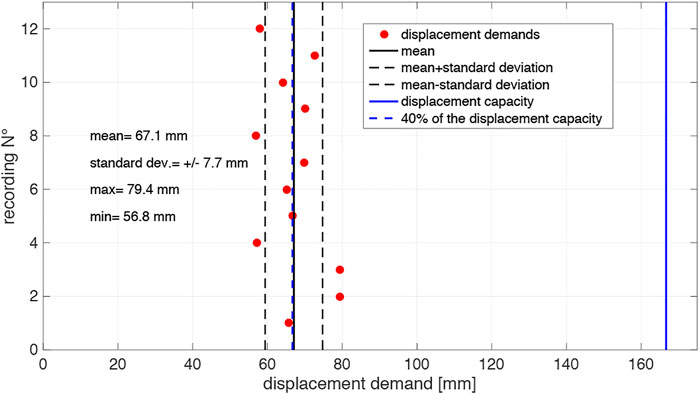
FIGURE 10. Non-linear displacement demands for the 12 time-histories (TH). The ultimate displacement is considered to be reached when the average exceeds 40% of 2/3 of the wall thickness (mean 12 TH > 0.4·2/3·tw).
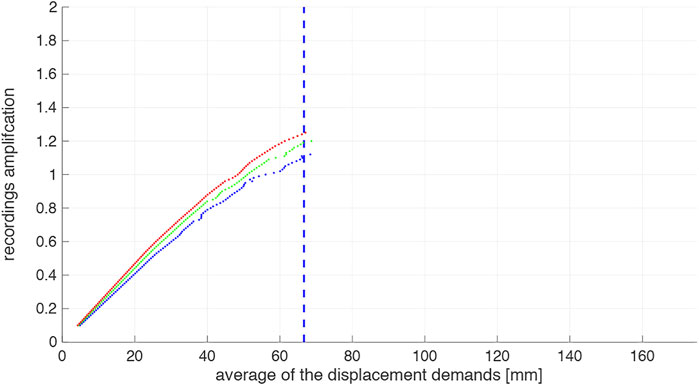
FIGURE 11. Non-linear computations were performed by progressively increasing the recording amplitudes until the ultimate displacement was reached (mean 12 TH > 0.4·2/3·tw). They were repeated for damping ratio values of 3%, 4% and 5%.
4 Results
4.1 Results for wall situated at the base level
The obtained results corresponding to the case in which the wall is located at the ground level are summarized in Table 3. The rows related to each soil class (from B to E) give the maximum amplification of the time-histories (i.e., ultimate ground accelerations) obtained for viscous damping ratios of 3% and 5%. Soil classes B and E give similar results with the highest values. By contrast, soil class D gives systematically the lowest values. Intermediate values are obtained for soil class C. In the third row of Table 3 the multiplication of the wall aspect ratio (α = tw/hw) by the acceleration of gravity (g) is provided for comparison with the obtained results. This figure indicates the maximum horizontal acceleration which may be applied statically to the wall before reaching rocking (overturning) instability since it corresponds to the maximum possible inclination of the acceleration gravity vector. This condition serves as a threshold value for wall out-of-plane verification (ah ≤ α g), known as the static stability condition (Figure 12). The results show that, except for soil class D, the ultimate ground accelerations are close but larger than α g, even for the lowest value of damping ratio (3%). This finding indicates that α g may be used as a simple out-of-plane stability index. Note that this is not obvious because the static stability condition does not include any safety margin while the safety margin is taken into account in the non-linear time-history analysis, as previously explained (i.e., the ultimate displacement is considered to be reached when the average displacement demand exceeds only 40% of the displacement capacity). Even with the included safety margin, the obtained results are more favourable than the static stability condition. This apparent paradox issue may be explained by the dynamic features of rocking behavior in which the onset of rocking does not represents the ultimate state since a sufficient energy content of the ground motion is needed to actually lead to the overturning of the wall (Dimitrakopoulos and DeJong, 2012).
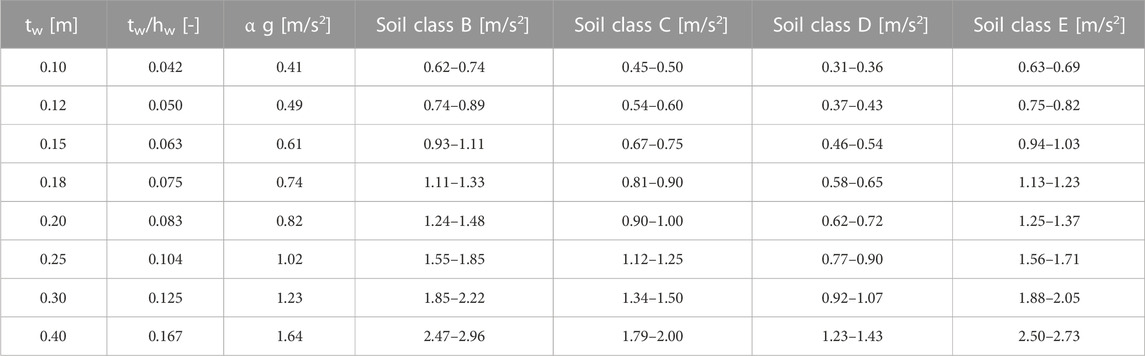
TABLE 3. Results of NLTHA for a wall height of 2.4 m and different soil classes with respect to the wall thickness (tw). The figures provide considered ultimate ground accelerations (mean 12 TH > 0.4·2/3·tw) for damping ratios between 3% and 5%.
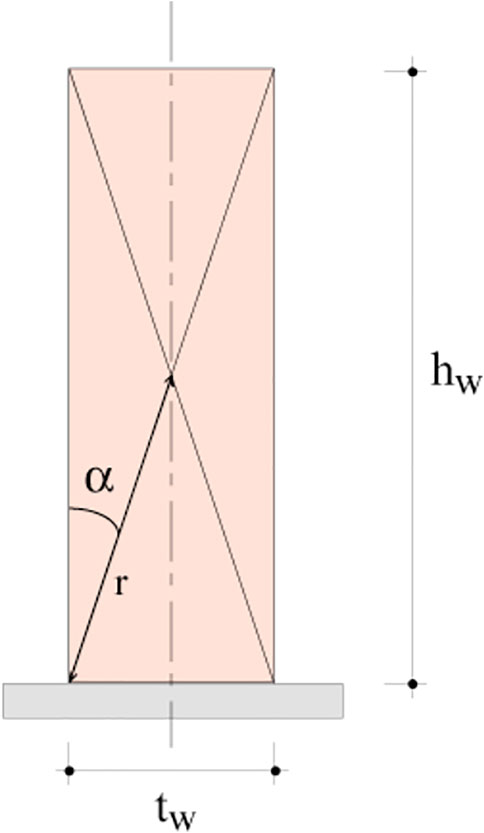
FIGURE 12. Dimension notations for the cantilever wall.
Table 4 summarizes the results obtained for different wall heights. The ultimate ground accelerations were computed for soil class C. Note that the column related to a wall height of 2.4 m is identical to the corresponding one in Table 3. For the other wall heights, namely, 2.1 m, 2.7 m and 3 m, the wall thickness was adapted in order to keep the same wall aspect ratios as the ones for the wall height of 2.4 m. The results are therefore comparable and show that taller wall heights are favourable since these can resist larger ultimate ground accelerations. This issue may be easily explained by considering the related natural period. According to Eq. 3, taller wall heights result in shorter natural periods and therefore shorter displacement demands. However, the column corresponding to the shorter wall height of 2.1 m shows that the ultimate ground accelerations are still larger than α g, even for the lowest value of damping ratio (3%). This finding confirms that α g may be used as a simple out-of-plane stability index, even with shorter wall height.
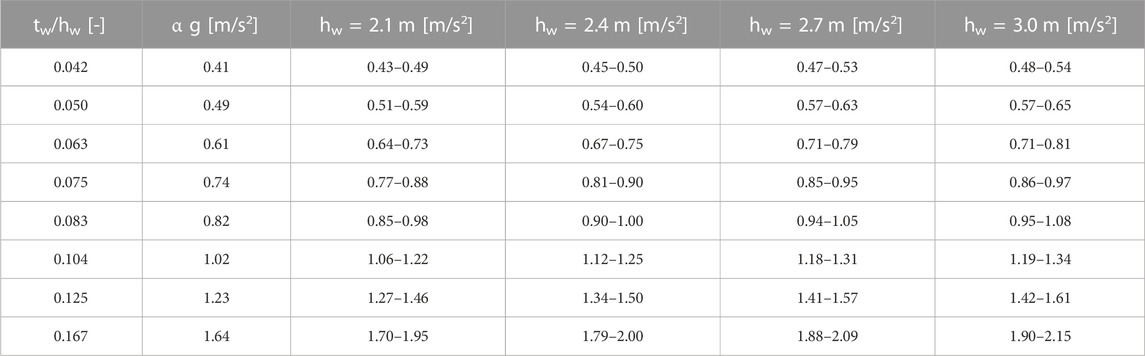
TABLE 4. Results of the NLTHA for different wall heights by keeping the wall aspect ratio constant. The figures provide considered ultimate ground accelerations (mean 12 TH > 0.4·2/3·tw) for damping ratios between 3% and 5%.
4.2 Results for upper floor level wall
The obtained results corresponding to the case in which the wall is situated in the upper floors are summarized in Tables 6, 7, 8. Three fundamental periods of the primary structure, namely, T1 = 1.0 s, 1.5 s, and 0.5 s, were considered. Each table corresponds to one of these three periods. For the subsystem, the reference non-structural wall of 2.4 m in height was again used with different aspect ratios. The calculations are performed for the records set corresponding to the design spectrum for soil class C. According to the methodology shown in Figure 7, the acceleration time-histories at the top of the primary structure are first computed. The related response spectra was then determined. As an example, Figure 13 shows the corresponding average response spectrum for the case of the primary structure with a period of T1 = 1.0 s. The curve corresponding to a usual prediction of the floor response spectrum according to Eq. 5 is also plotted for comparison. That curve is multiplied by the spectral acceleration corresponding to the period of the primary structure. This prediction covers well the average response spectrum with a small excess only. The amplification at the period related to the reference non-structural wall of 2.4 m height, namely, 2.07 s may be then determined for both the average response spectrum and the amplification prediction. The related values for the considered three periods of the primary structure are summarized in Table 5.
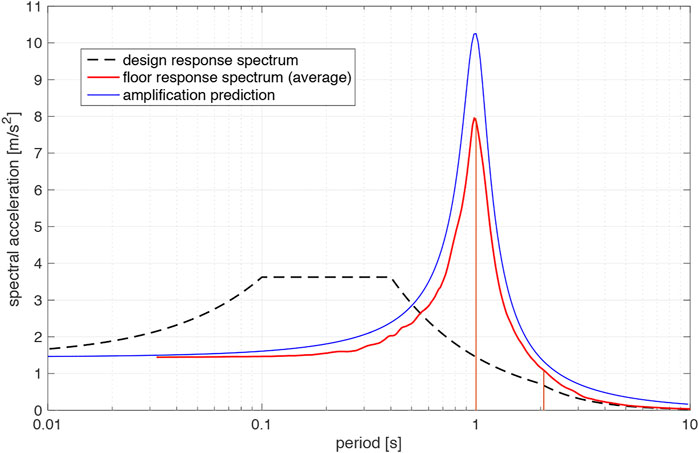
FIGURE 13. Floor response spectra, comparison of the obtained average response spectrum and the amplification prediction according to Eq. 5.
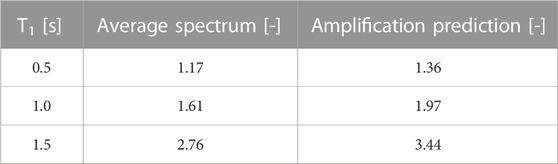
TABLE 5. Amplification of the spectral acceleration with respect to the design spectrum of soil class C for the computed floor response spectrum (average spectrum) and the amplification prediction according to Eq. 5 for the natural period of the subsystem (i.e., 2.07 s for non-structural wall of 2.4 m height).
The results for a period of the primary structure of T1 = 1.0 s are indicated in Table 6. The values of the considered ultimate ground accelerations obtained for viscous damping ratio values of 3% and 5% are given in the last row. Those values should be compared to the ones related to the static stability condition reduced by the corresponding amplifications of the spectral acceleration of the design spectrum of soil class C of Table 5. The comparison shows that the reduced static stability conditions related to the actual amplification according to the average spectrum (α g/1.61) are close to the ultimate values. However, the values are systematically larger and, therefore, not at the safe side. By contrast, the reduced static stability conditions related to the amplification prediction (α g/1.97) match much better the obtained ultimate values.

TABLE 6. Results for a wall height of 2.4 m situated in the upper floors in case of soil class C and a period of the primary structure of T1 = 1.0 s. The considered ultimate ground accelerations for damping ratio between 3% and 5% (last row) compare well with the reduced static stability condition.
The above considerations about the reduced static stability conditions are further supported by the results of Table 7 and Table 8, for primary structure periods of T1 = 1.5 s and T1 = 0.5 s respectively. Note that even for the T1 = 0.5 s case (Table 8), the reduced static stability conditions related to the actual amplification (α g/1.17) lead to lower values than the considered ultimate ground accelerations (last column).
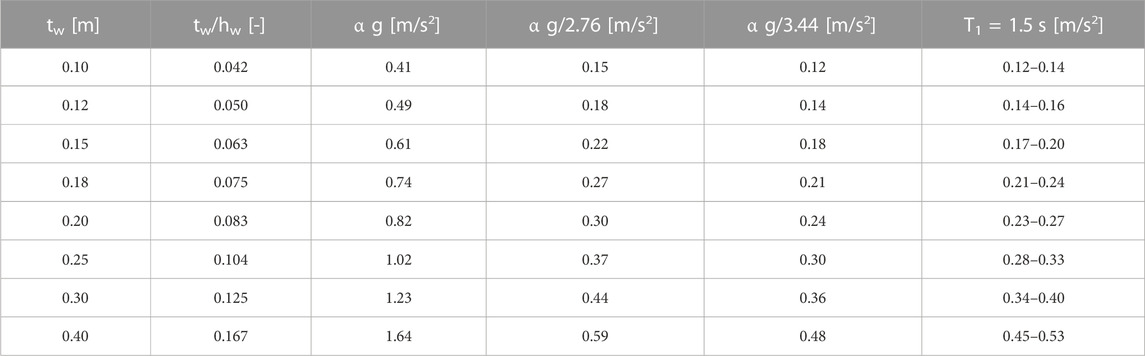
TABLE 7. Results for a wall height of 2.4 m located in the upper floors in case of soil class C and a period of the primary structure of T1 = 1.5 s. The considered ultimate ground accelerations for damping ratio between 3% and 5% (last column) compare well with the reduced static stability condition.

TABLE 8. Results for a wall height of 2.4 m located in the upper floors in case of soil class C and a period of the primary structure of T1 = 0.5 s. The considered ultimate ground accelerations for damping ratio between 3% and 5% (last column) compare well with the reduced static stability condition.
5 Assessment and findings
For non-structural walls located at the ground level (i.e., vertical cantilever walls) the obtained ultimate ground accelerations calculated using NLTHA are higher than the threshold values corresponding to the product of the wall aspect ratio (α = tw/hw) by the acceleration of gravity (g). This issue is true for damping ratios larger or equal to 3%, for different wall heights, and for different soil classes with the exception of soil class D. For constant wall aspect ratios, the higher the wall is the larger the ultimate ground acceleration it can withstand. The obtained results indicate therefore that for non-structural rocking walls the static stability criterion (ah ≤ α g) provides accurate estimate of the collapse safety related to the seismic out-of-plane behavior, except for soft soils. Even if the threshold is related to the ground acceleration, the rocking behavior is mainly controlled by the medium and the long period range of the design spectrum. In other words, the velocity and displacement controlled part of the design spectrum is more relevant than the left side. It is then important to note that the limit ground acceleration should be related to the ground acceleration of the seismic zone without using the soil parameter (S). The threshold could be further refined using both the soil parameter (S) and the corner period of the design spectrum (TC) to improve its accuracy but this is not the objective of the proposed simplified approach because more accurate results may be obtained by using refined methods such as the ones of the Italian building code (NTC, 2008) based on the virtual work principle or with NLTHA.
In other words, the NLTHA analyses show that the reserve regarding overturning related to the actual rocking behavior of rigid bodies compared to a too simplistic static approach roughly corresponds to the usually prescribed safety margin. However, attention should be paid in the presence of soft soils because the safety margin is significantly reduced in that case.
For non-structural walls located in the upper floors, the obtained ultimate ground accelerations computed using NLTHA are logically lower than the ones related to the same walls situated at the ground level. The results are essentially dependant on the value of the natural period of the primary structure. However, considering floor response spectra, the threshold values for limit ground accelerations may be modified by reducing the static stability criterion using the corresponding amplification of the spectral acceleration at the natural period of the non-structural wall. For that purpose, the usual amplification prediction according to Eq. 5 may be employed.
6 Conclusion
The obtained results show that for non-structural rocking walls (i.e., vertical cantilevers with rigid body behavior) the static stability criterion (ah ≤ α g) provides accurate estimate of the collapse safety related to the seismic out-of-plane behavior. According to that criterion the ground acceleration threshold corresponds to the product of the wall aspect ratio (α) by the acceleration of gravity (g). The obtained ultimate ground accelerations calculated using NLTHA are higher than the threshold values for damping ratios larger or equal to 3%, for different wall heights, and for different soil classes with the exception of soil class D. For constant wall aspect ratios, the higher the wall is the larger the ultimate ground acceleration it can withstand. Therefore, the corresponding calculated limit ground acceleration is on the safe side, except for soft soil conditions. Such a simplified approach based on the static stability criterion for the seismic out-of-plane assessment of non-structural walls may be used for preliminary investigations in order to have a quick overview and to identify potentially vulnerable elements. More accurate results, and therefore a more refined assessment, may be obtained by using more elaborated methods such as the ones of the Italian building code (NTC, 2008) for instance.
The proposed simplified approach may be extended to non-structural walls located in the upper storeys of the main structure by using floor response spectra. The static stability criterion should be reduced using the corresponding amplification of the spectral acceleration at the natural period of the non-structural wall. However, using the values corresponding to the actual amplification according to the calculated average response spectrum are close to the ultimate values but not at the safe side. By contrast, the reduced static stability conditions related to the amplification prediction according to Eq. 5 match much better the obtained ultimate values. Therefore, the usual amplification prediction depending on the ratio of the fundamental period of the main structure and the natural period of the non-structural wall should be employed for that purpose. The fundamental period of the main structure may be estimated using a common empirical relationship (e.g., T1 = 0.05·H0.75) with the total height (H), calculated using for instance Rayleigh Quotient or, more accurately by using in situ measurements (e.g., ambient noise measurement).
Data availability statement
The raw data supporting the conclusions of this article will be made available by the authors, without undue reservation.
Author contributions
PL wrote the paper, performed the non-linear time-history analyses and the related statistical assessment. PL formulates the conclusions and the corresponding recommendations for using the proposed simplified assessment.
Conflict of interest
The author declares that the research was conducted in the absence of any commercial or financial relationships that could be construed as a potential conflict of interest.
Publisher’s note
All claims expressed in this article are solely those of the authors and do not necessarily represent those of their affiliated organizations, or those of the publisher, the editors and the reviewers. Any product that may be evaluated in this article, or claim that may be made by its manufacturer, is not guaranteed or endorsed by the publisher.
References
Al Shawa, O., De Felice, G., Mauro, A., and Sorrentino, L. (2012). Out-of-plane seismic behaviour of rocking masonry walls. Earthq. Eng. Struct. Dyn. 41 (5), 949–968. doi:10.1002/eqe.1168
Ambraseys, N., Smit, P., Sigbjornsson, R., Suhadolc, P., and Margaris, B. (2002). Internet site for European strong-motion data, European Commission, Research Directorate General, Environment and Climate Program.
Basset-Salom, L., and Guardiola-Villora, A. (2014). Seismic performance of masonry residential buildings in Lorca’s city centre, after the 11th May 2011 earthquake. Bull. Earthq. Eng. 12, 2027–2048. doi:10.1007/s10518-013-9559-8
Chopra, A. (2001). Dynamics of structures: Theory and applications to earthquake engineering. Englewood-Cliffs: Prentice Hall. ISBN: 0-13-086973-2.
D’Ayala, D., and Speranza, E. (2002). “An integrated procedure for the assessment of seismic vulnerability of historic buildings,” in 12th European conference on earthquake engineering (London. Paper No. 561.
Dimitrakopoulos, E., and DeJong, M. (2012). Revisiting the rocking block: The closed-form solutions and simlarity laws. Proceedings of the royal society A.
Doherty, K., Griffith, M. C., Lam, N., and Wilson, J. (2002). Displacement-based seismic analysis for out-of-plane bending of unreinforced masonry walls. Earthq. Eng. Struct. Dyn. 31 (4), 833–850. doi:10.1002/eqe.126
Doherty, K., Rodolico, B., Lam, N., Wilson, J., and Griffith, M. C. (2000). “The modelling of earthquake induced collapse of unreinforced masonry walls combining force and displacement principals,” in 12WCEE proceedings. paper 1645.
Eurocode 8 (2004). Design provisions for earthquake resistance of structures – Part 1: General rules, seismic actions and rules for buildings. CEN (Comité Européen de Normalisation. EN 1998-1:2004.
Griffith, M. C., Lam, N., Wilson, J., and Doherty, K. (2004). Experimental investigation of unreinforced brick masonry walls in flexure. ASCE J. Struct. Eng. 130 (3), 423–432. doi:10.1061/(asce)0733-9445(2004)130:3(423)
Güney, D., Aydin, E., and Öztürk, B. (2015). The evaluation of damage mechanism of unreinforced masonry buildings after Van (2011) and Elazig (2010) Earthquakes. J. Phys. Conf. Ser. 628 (1), 012066. doi:10.1088/1742-6596/628/1/012066
Lestuzzi, P., Belmouden, Y., and Trueb, M. (2007). Non-linear seismic behavior of structures with limited hysteretic energy dissipation capacity. Bull. Earthq. Eng. 5 (4), 549–569. doi:10.1007/s10518-007-9050-5
Makris, N., and Roussos, Y. (1998). Rocking response and overturning of equipment under horizontal pulse-type motions. Berkeley, PEER CENTER: University of California. REPORT NO. 1998/5 OCT.1998.
Makris, N., and Zhang, J. (2000). Rocking response and overturning of equipment. Berkeley: University of California. PEER CENTER REPORT NO. 2000/13.
NTC (2008). Decreto Ministeriale 14 Gennaio 2008: Norme tecniche per le costruzioni”, S.O. No. 30 alla G.U. del 4 Febbraio 2008, No. 29. Rome, Italy: Ministero delle Infrastrutture e dei Trasporti. [in Italian].
Oropeza, M., Favez, P., and Lestuzzi, P. (2010). Seismic response of nonstructural components in case of nonlinear structures based on floor response spectra method. Bull. Earthq. Eng. 8 (2), 387–400. doi:10.1007/s10518-009-9139-0
Penna, A., Morandi, P., Rota, M., Manzini, C. F., da Porto, F., and Magenes, G. (2014). Performance of masonry buildings during the Emilia 2012 earthquake. Bull. Earthq. Eng. 12 (5), 2255–2273. doi:10.1007/s10518-013-9496-6
Psycharis, I. N., Papastamatiou, D. Y., and Alexandris, A. P. (2000). Parametric investigation of the stability of classical columns under harmonic and earthquake excitations. Earthq. Engng Struct. Dyn. 29, 1093–1109. doi:10.1002/1096-9845(200008)29:8<1093:aid-eqe953>3.0.co;2-s
Sironi, L., Andreini, M., Colloca, C., Poehler, M., Bolognini, D., Dacarro, F., et al. (2023). Shaking table tests for seismic stability of stacked concrete blocks used for radiation shielding. Eng. Struct. 283, 115895. doi:10.1016/j.engstruct.2023.115895
Sorrentino, L., Cattari, S., da Porto, F., Magenes, G., and Penna, A. (2019). Seismic behaviour of ordinary masonry buildings during the 2016 central Italy earthquakes. Bull. Earthq. Eng. 17, 5583–5607. doi:10.1007/s10518-018-0370-4
Sorrentino, L., D'Ayala, D., De Felice, G., Griffith, M. C., Lagomarsino, S., and Magenes, G. (2017). Review of out-of-plane seismic assessment techniques applied to existing masonry buildings. Int. J. Archit. Herit. 11 (1), 2–21.
Keywords: non-structural elements, simplified seismic assessment, rocking walls, out-of-plane seismic behavior, non-linear time-history analysis, hysteretic model, spectrum-compatible ground motion
Citation: Lestuzzi P (2023) Simplified out-of-plane seismic behavior assessment of non-structural rocking walls. Front. Built Environ. 9:1113847. doi: 10.3389/fbuil.2023.1113847
Received: 01 December 2022; Accepted: 20 March 2023;
Published: 31 March 2023.
Edited by:
Daniele Perrone, University Institute of Higher Studies in Pavia, ItalyReviewed by:
Baki Ozturk, Hacettepe University, TürkiyeAntonio Formisano, Polytechnic and Basic Sciences School, University of Naples Federico II, Italy
Copyright © 2023 Lestuzzi. This is an open-access article distributed under the terms of the Creative Commons Attribution License (CC BY). The use, distribution or reproduction in other forums is permitted, provided the original author(s) and the copyright owner(s) are credited and that the original publication in this journal is cited, in accordance with accepted academic practice. No use, distribution or reproduction is permitted which does not comply with these terms.
*Correspondence: Pierino Lestuzzi, cGllcmluby5sZXN0dXp6aUBlcGZsLmNo