 Yasutoshi Moteki
- School of Humanities and Social Sciences, Hiroshima University, Higashihiroshima, Hiroshima, Japan
This study clarifies the main factors affecting user satisfaction in public facilities using a two-part questionnaire, specifically, the determinants of service satisfaction among users of a ward office in Tokyo. The questionnaire comprised three main categories of multiple-choice questions: A) facility equipment (physical elements in the government office), B) staff responses, and C) service delivery (e.g., promptness of services, whether visitors completed their scheduled errands). In addition, the questionnaire investigated the users’ personalities of each facility. During a 1-day survey, responses were collected from 400 women aged 30–59 years who had visited a ward office in the Tokyo Metropolitan Area within the previous month. This age segment was studied because it is the major segment of the panel of the internet research firm used. First, a factor analysis was used to check if the question groupings were appropriate based on eigenvalues and scree plots, and it was confirmed. Next, principal component and multiple regression analyses were conducted for each question category to examine the determinants of counter-service user satisfaction. The regression analysis, using the three main question categories and three other respondents’ personality-related question categories, shows that category C (service delivery quality) strongly influenced the dependent variable, followed by categories B and A. The adjusted R2 value was .70. This is consistent with the author’s surveys of government offices in urban areas conducted for Higashihiroshima City Hall and Osaka ward offices. Concerning the hardware aspect, the principal component loadings, the analysis results show that 1) indoor atmosphere, 2) ease of following the layout of the floors and offices inside the building, and 3) ease of understanding the building’s locations and entrances at the site of the ward office, are important factors for overall satisfaction at the ward office.
1 Introduction
This paper focuses on user satisfaction with government facilities. As discussed in detail in the Literature Review section, research based on the SERVQUAL scale spreads beyond the private corporate sector to the public management sector, including user satisfaction with government facilities. There is criticism against studies based on the SERVQUAL scale, which calculates the difference between the expected and actual perceived outcomes, regarding the method of gauging the difference (Brown et al., 1993). Cronin and Taylor (1992) argue that service quality can be measured by examining only perceived outcomes under SERVPERF. Studies like SERVPERF that investigate service quality by measuring only perceived outcomes, without measuring the difference between expected and perceived outcomes, are emerging in the public sector (Martins et al., 2015). Babakus and Boller (1992) conducted a confirmatory factor analysis and showed that the service quality questionnaire items are not necessarily divided into five dimensions, depending on the characteristics of the services provided. In their study on the field of public administration, Talib and Shukor (2016) conducted a factor analysis and found that three dimensions were appropriate for the sample data. The present study is the pilot for a simplified method that does not measure expected outcomes, only perceived outcomes. It uses a three-dimension question structure to assess public administration in Japan. Through the results of confirmatory factor analysis and the coefficient of determination of multiple regression analysis after the principal component analysis (PCA), the author seeks to verify whether the simplified method proposed by the author can accurately investigate service quality that leads to customer satisfaction. Johnson and Gustafsson’s (2000) book is well known for explaining multi-regression methods after PCA to analyze determinative factors of satisfaction. The same book has been translated and published in Japan, where the author lives.
The subject of this study is user satisfaction with services at the counters of ward offices, the front line of the Tokyo Metropolitan Government. In line with the introduction of private-sector management methods into government services, outsourcing local administrative counter services to private contractors has been progressing in Japan. Under these circumstances, an exploration of the determinants of administrative counter services is expected to lead to practical suggestions on the pros and cons of outsourcing to private contractors for local government counter services, as well as the points to keep in mind when introducing such a service. Therefore, in collaboration with Rakuten Insight, an online survey company, this study conducted an online questionnaire survey on 1 December 2021, among 30–59-year-old female residents of the 23 special wards of the Tokyo Metropolitan Area who visited a ward office in Tokyo over the month. Considering the difficulty in conducting a rigorous randomized controlled trial (RCT) in an internet survey, the survey design focused on the age group that best represented the characteristics of the company’s survey panel. The middle-aged women responded to questions regarding their satisfaction with the counter services provided at these ward offices. Rakuten Insight had registered the respondents as panel members in advance from among Rakuten Ichiba shopping mall members. The Rakuten Group originated with a Japanese internet shopping mall site that had a large proportion of middle-aged female members; this is also why this study focused on this age group. It has been noted that internet surveys have an inherent sample bias (Tanner, 2018). Accordingly, to help generalize the results of this research, the study targeted middle-aged women to gain a representative demographic of the panel, the internet research firm.
The Tokyo Metropolitan Area is the largest urban area in Japan, organized under the To system (“Special Treatment System for the Capital City”), which differs in organization from other large cities. The Tokyo Metropolitan Government system is a notable exception to most major cities under the Local Autonomy Law, a two-tier system (prefectures/municipalities). The Tokyo Metropolitan Government is the upper tier of wide-area municipalities that correspond to prefectures, and special wards are placed in the lower tier corresponding to municipalities. The administrative City of Tokyo was abolished in July 1943 during World War II. At that time, wards subject to the special metropolitan government system (To system) were newly established, limiting Tokyo’s capital autonomy (Tokyo Metropolitan Government, 2020). Consequently, the City of Tokyo, headed by a publicly elected mayor, was abolished (for the history of the special districts, see Public Interest Incorporated Foundation Special Wards Council (2019). Each ward was merely an administrative division, not a municipality, as the public did not elect its head. Tokyo’s wards regained much of their autonomy after World War II and were named special wards in 1952. The status of special wards was positioned in the Local Autonomy Law as internal organizations of the Tokyo Metropolitan Government. In April 1975, as a result of the amendment of the Local Autonomy Law, a new special ward system was initiated, and ward mayors were publicly elected, similar to other basic municipalities in cities, towns, and villages. Therefore, the special wards of the Tokyo Metropolitan Government now have almost the same authority as city municipalities with publicly elected mayors, and they perform the same functions for residents. As of March 2018, 9,482,125 people lived in the 23 wards of Tokyo, while the population of Tokyo was 13,754,043 (Tokyo Metropolitan Government, 2018). More than 10% of Japan’s total population is concentrated in Tokyo. Therefore, this study examines user satisfaction with services at ward office counters, the front line of the Tokyo Metropolitan Government. In particular, this study focuses on female user satisfaction with government facilities.
In this two-tiered system of local autonomy, the Tokyo Metropolitan Government is responsible for the administrative services of the upper-tier prefectural governments (e.g., hospital approvals, operation of high schools), while the lower-tiered local governments (municipalities equivalent to cities, towns, and villages in other prefectures)—the special wards—provide familiar administrative services such as resident registration, garbage collection, and operation of elementary and junior high schools. Ward office facilities are available for procedures and consultations related to the authorities listed here. For example, the following URL lists seven procedures and consultation services handled by the facilities at the Koto Ward Office (https://www.city.koto.lg.jp/tetsuduki/index.html). These are as follows. 1. Resident and family registration procedures; 2. My Number (Social Security Number) system; 3. Pension; 4. Tax; 5. National Health Insurance; 6. Late-Stage Medical Care System for the Elderly; and 7. Long-term care insurance.
In this study, in addition to the three categories of questions (used in previous studies by Moteki (2022)—A (facility equipment), B (staff response), and C (service delivery)—three additional question categories related to the personalities and thoughts of the facility users were added. B (staff response) relates to the explanation of the counter staff and their treatment of customers, and C (service delivery) concerns the status of service delivery related to the completion of errands at the ward office, the speed of those errands, and waiting time. Research on customer satisfaction in both private and government sectors is no longer limited to providing services and the quality of those services. However, it includes the attributes and psychological state of service providers and purchasers (users) as a factor in customer satisfaction (e.g., Nazi, 2010). The current study focuses on analyzing the physical aspects of the built environment, particularly the building. The results of the multiple regression analysis shown in Table 8 indicate that the principal components of each category A ∼ C are significant for overall satisfaction (this result is similar to the author’s previous study). In addition, this paper focuses on the A category of hard aspects and examines which elements are essential based on the principal component loadings of each question item (Table 10).
Research on customer satisfaction in private-sector management studies has begun incorporating customer and employee attributes, particularly personality traits, into the research model. Concerning research in public management in Japan, (Noda, 2013; Noda, 2014; Noda, 2019; Noda, 2021), has published extensive research in English on Japanese citizen satisfaction with public administration. This study shares Noda’s awareness of the problem but is more specific and differs in terms of methodology. Specifically, it employs a questionnaire survey to examine the determinants of customer satisfaction, with the counter services provided at local government offices. It uses a multi-category questionnaire developed by SERVQUAL to quantitatively examine factors contributing to its satisfaction. It applies to public administration, the multi-category question survey method with a 7-point scale, widely used in business administration, and conducts empirical research at the level of specific government facilities. Everitt (2005) also mentions performing PCA on multiple question items belonging to several categories before the multiple regression analysis to avoid the risk of multicollinearity between question items. This study surveys Japanese government office users about their experiences with a questionnaire. The questionnaire contains three categories of questions (a simplified version of SERVQUAL that uses five categories), and in doing so, the study aims to demonstrate that the service quality evaluation methods widely applied in the private sector can be used in the public sector. This is accomplished by examining the results of a confirmatory factor analysis and a regression analysis, especially for the coefficients of determination and standardized partial regression coefficients.
2 Literature review
Research on citizen satisfaction in public administration has been influenced by similar studies in the private sector. Several such important studies have been reviewed by Moteki (2022). This review focuses on significant and newer literature that was not previously covered. Wagenheim and Reurink (1991) explained the difference between internal and external customers (employees in other departments; citizens) and discussed that the satisfaction of the service needs of these two groups leads to organizational efficiency and effectiveness. Parasuraman et al.’s (1985) SERVQUAL methods are widely used in both public and private organizations to examine service quality and customer satisfaction. SERVQUAL first appeared in 1985 (Buttle, 1996), and represented five dimensions of service quality (tangibles, reliability, responsiveness, assurance, and empathy), and is well-established and mentioned in the latest edition of the service marketing textbook (Wilson et al., 2021). In public administration, researchers have been increasingly using SERVQUAL methods (Wisniewski, 2001; Bente, 2014; Ocampo et al., 2019; Afroj et al., 2021) and have focused on the satisfaction of citizens and customers in various countries (Huque and Hayllar, 1999; Cripps et al., 2004; Agus et al., 2007; Rhee and Rha, 2009; Mansor and Che Mohd Razali, 2010; Akinloye Akinboade et al., 2012). The present study refers to the framework used by Mansor and Che Mohd Razali (2010) in Malaysia. It uses the questionnaire from an earlier study (Moteki, 2022), in which specific question items were grouped into three categories, originally developed by the authors who provide groupings and a broad description of each but do not provide details within the paper of the specific questions for each group or how the survey was conducted.
A growing body of research examines the relationship between customer or citizen satisfaction and other policy variables. Bouckaert and Van de Walle (2003) examine the appropriateness of using citizen trust and user satisfaction as indicators for measuring good governance and conclude that it is appropriate to include citizen trust, rather than user satisfaction, as a soft indicator, for this purpose. Using a general mass survey of Norwegian citizens conducted in 2001, Christensen and Lægreid (2005) clarify several points concerning trust in government, which included that citizens satisfied with public services tended to trust public institutions. Similarly, assuming that citizen trust and confidence in public institutions are generated by citizen/client service satisfaction, Heintzman and Marson (2005) argue that service satisfaction, employee satisfaction, and commitment are mutually influential, as shown in Figure 1, which shows the public sector service value chain. Korunka et al. (2007), using their scale of customer orientation through long-term questionnaire surveys in Australia and the United States, show that customer orientation among employees is essential for customer satisfaction. Mouwen (2015) used data from 2010 to 2011 in the Netherlands on public transportation, including buses, subways, trams, and ferries, to examine whether user satisfaction is affected by the characteristics of the transportation mode and/or user attributes.
3 Methodology
To examine the determinants of satisfaction with administrative counter service, the author prepared a questionnaire divided into three sections related to the explanatory variables. It had three main categories: physical aspects of facility equipment, counter-staff responses, and service delivery conditions. The classification was based on the three explanatory categories used by Mansor and Che Mohd Razali (2010). Ten survey questions and two screening questions were used to assess respondents’ conformity to the survey conditions. Table 1 illustrates the main question items regarding counter-service satisfaction in government offices, classified into three concept groups. The elements headed by Z represent the first and second principal components calculated by PCA from the individual question items. For example, ZA1 represents the numerical value of the first principal component calculated via PCA from the five question items in category A. The questionnaire also asked for responses to items on individual personality and characteristics—(M) thoughts about management aspects of public administration (I) international tendency, and (F) authoritarian tendency—and posed a final open-ended question regarding how to improve ward offices (Table 2). The name of question category F was drawn from the scale of authoritarianism presented by Adorno et al. (1950), called the F Scale. These three additional sets of questions were used for exploratory analysis to inform more detailed studies in the future.
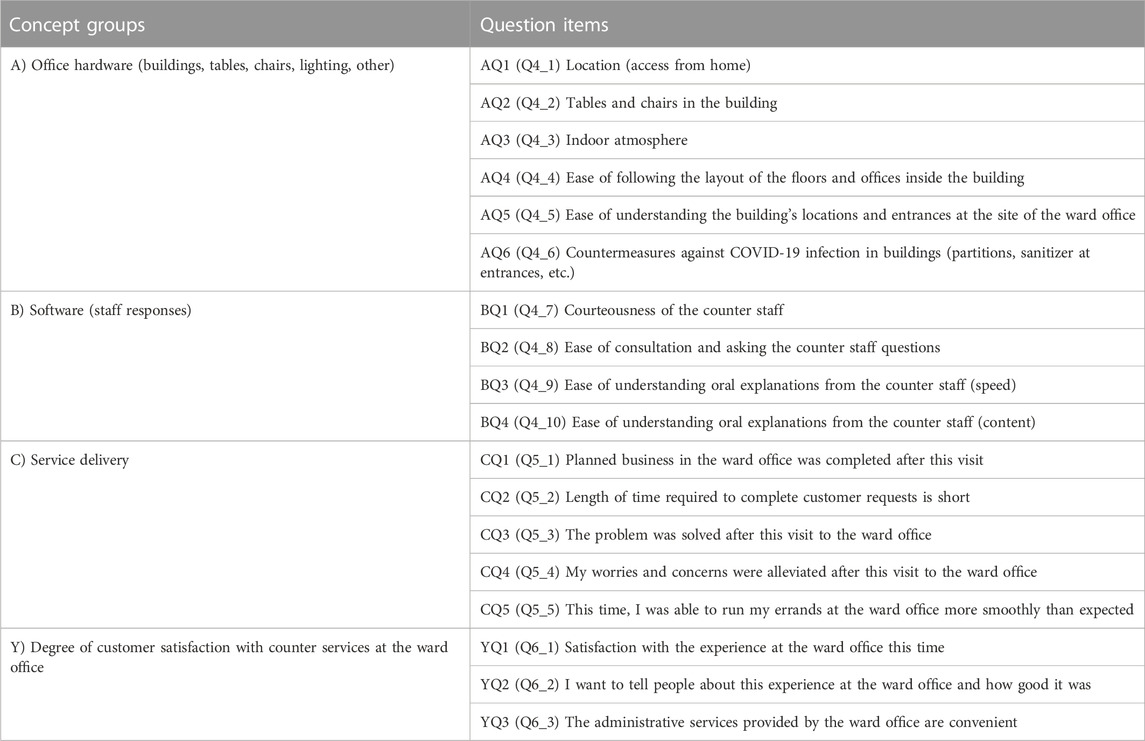
TABLE 1. Outline of the basic question items.
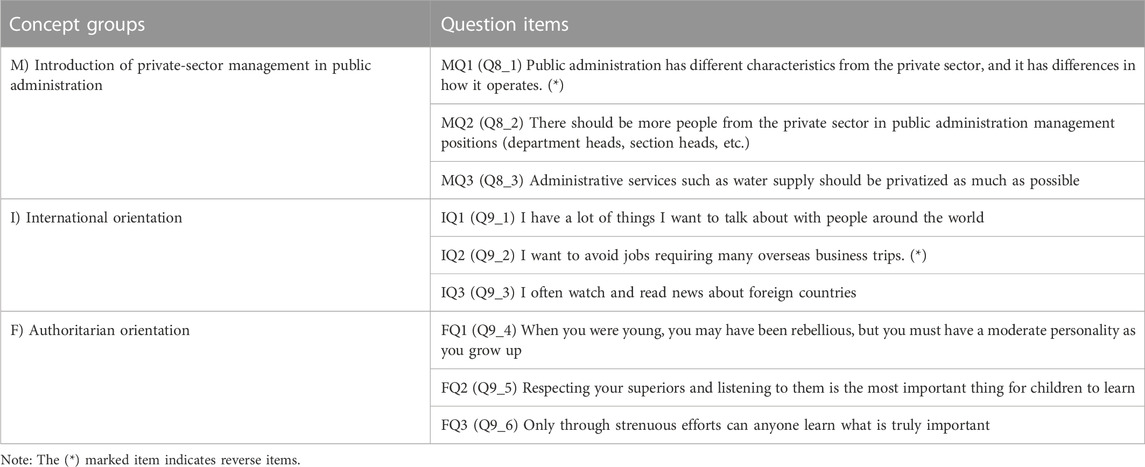
TABLE 2. Outline of survey question items concerning respondents’ personality traits.
The intent behind using these three scales follows. Harun et al. (2021) and Massey (2019) have pointed out that the NPM’s management orientation is consistent with the authoritarian orientation among people and the populist tendencies in democracy. Jung and Mittal (2020) discuss the disparity between right-wing authoritarianism (RWA) and social dominance orientation (SDO), and examine the impact of such political identities on customer behavior and characteristics in consumption. As a measure of the authoritarian personality, Yonamine (1960) translated Adorno et al.’s (1950) questionnaire into Japanese and implemented it in the Okinawa Prefecture, some of which were used in this study. The reason for using the F scale described above is to investigate whether the authoritarian tendencies of citizens, one of their political identities, affect customer satisfaction with the public administration.
Regarding international orientation, Wang et al. (2010) found that the nature of customer extraversion influences customer behavior, such as customer loyalty. As a surrogate measure of extraversion, the internationality of the Japanese (Yashima, 2002), formulated in Japan with the assumption that it was the Japanese who were surveyed, is used in this paper. As for the questions on international orientation (I), the author used items from Yashima’s (2002) psychological scale. To investigate private-sector management orientation (M), where the government is run like a private company, the author of the present study developed a set of original questions. The M scale is taken from a previous study by Moteki (2021a). In that study, the subjects were the regional Osaka Restoration Party, which promoted administrative reforms that apply private-sector business management to administrative management, and received support from the residents of that region. Therefore, we wanted to examine if such a private-sector business management orientation affects customer satisfaction. The three scales, M, I, and F, were used in the author’s 2021 online survey for the users of Osaka City ward offices via the Internet (Moteki, 2021a).
Online surveys were distributed to residents of the 23 special wards of the Tokyo Metropolitan Area through Rakuten Insight. Members of Rakuten Insight’s general survey panel agreed with the Monitor Agreement and Privacy Policy; these terms and conditions are posted on the company’s website and are available for public review. The company has a system to protect personal information when conducting surveys and holds a Privacy Mark Certification from the JIPDEC foundation. Before the screening questions regarding respondents’ attributes, the following information was displayed on the screen: 1) the author is responsible for carrying out the survey and willing to answer questions about it (including questions about the results of the survey, to be published in academic journals), through a web form, and 2) survey participation is voluntary and not related to the city government, and respondents would not be judged unfavorably based on their survey responses; an explanation of the privacy protection policies and terms was provided at the beginning of this online survey.
4 Results
The survey was conducted on a weekday (1 December 2021). There were a total of 400 respondents: 162 (40.5%) were in their 30s; 129 (32.3%) in their 40s; and 109 (27.3%) were in their 50s (the total does not add up to 100% because they have been rounded up). The collection time was just after the typical lunch break in Japan, from 13:03 to 14:20, a little over an hour, until the planned number of respondents was gathered. Table 3 shows the respondents’ reasons for visiting the ward office (they were asked to choose only one); the largest percentage of residents visited the ward office for matters related to family registration or resident registration.
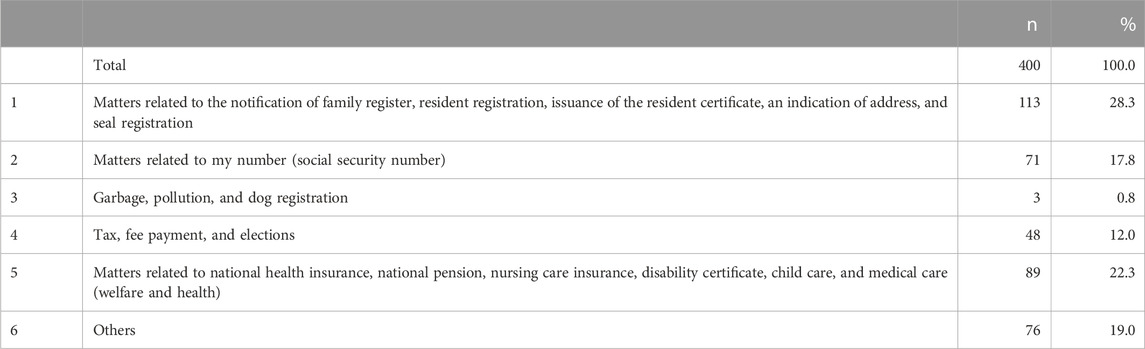
TABLE 3. Which of the following is the main business for which you visited the ward office this time?
First, a factor analysis was conducted to check whether grouping the three categories of explanatory variables, A through C, was appropriate. This method of confirming the appropriateness of the grouping of the questionnaire by factor analysis follows Kawasaki et al. (2014), Takahashi and Kawasaki (2019), and Takahashi (2020). Using the same set of questions as SERVQUAL, Talib and Shukor (2016) conducted a factor analysis for each question and found that it was appropriate to divide the questionnaire into three categories. Using question items A–C, the maximum likelihood method was used for factoring, and the Varimax method was used for factor rotation. The eigenvalues were, beginning with the first factor, 7.732, 1.992, 1.229, and 0.796. Up to the third factor, the eigenvalue is greater than or equal to 1 (the Kaiser–Guttman criterion). Both the Kaiser–Guttman criterion and scree plot criterion determined three factors. The scree plot of Figure 1 shows that up to the third factor is valid. Considering the factor analysis results in Table 4, the three classifications based on the factor scores of each question item are consistent with those assumed by the author. For Q4_6 regarding infection control measures, such as sanitizing solutions and acrylic plates for COVID-19, factor scores calculated from factor analysis exceeded 0.4 for the first and second factors. This means that question Q4_6 is an item that relates to both first and second factors (Categories A and B in the author’s questionnaire classification). This means that infection control measures involve questions about hardware and the nature of the responses by staff; infectious diseases can be passed from person to person, and staff members sometimes talk to each other about sanitizing. In addition, both government agencies and private establishments often have problems regarding disinfection and saliva spray, reflecting recent pandemic circumstances.

FIGURE 1. Scree plot of the factor analysis.
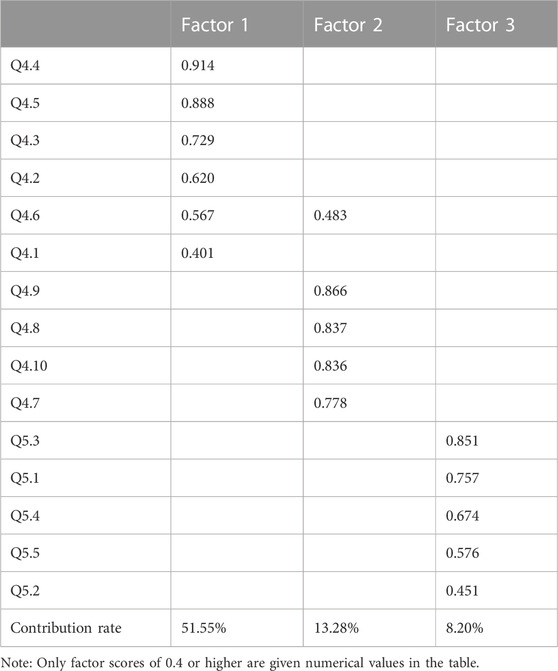
TABLE 4. Results of the factor analysis.
Table 5 shows that the correlation coefficient between the second and third factors is. 060, but the other correlation coefficients between different factors are not significant at the 5% level. From this, we assume that each factor is independent. The factor analysis results so far are similar to those of Talib and Shukor (2016), indicating that the grouping of three is appropriate in terms of content homogeneity across questions, less than SERVQUAL’s five categories.
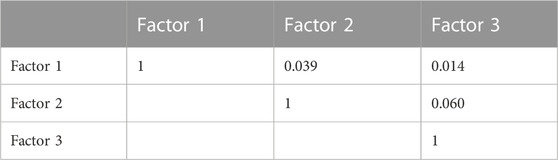
TABLE 5. Factor correlation matrix.
Next, a principal component regression analysis was performed using the three categories of questions (main items), whose grouping had been confirmed as appropriate by the factor analysis. First, the PCA for each question in category Y was conducted (Figure 2). Figure 2 shows the positioning of the three questions on overall satisfaction (Y category) concerning the first and second components from the results of the PCA. For variable naming, Z is used at the beginning of the variable name for the principal component score variable; Y derives its name from the Y category of the objective variable. The new variables ZY1 and ZY2 from the principal component scores were added to the dataset. YQ1, YQ2, and YQ3 experienced a similar trend for component 1. YQ3 (Q6_3) has a marginally higher value for component 1, interpreted as “delivered service convenience; ” YQ2 (Q6_2) and YQ3 exhibit a similar trend concerning the second principal component, interpreted as “long-term/short-term satisfaction.”
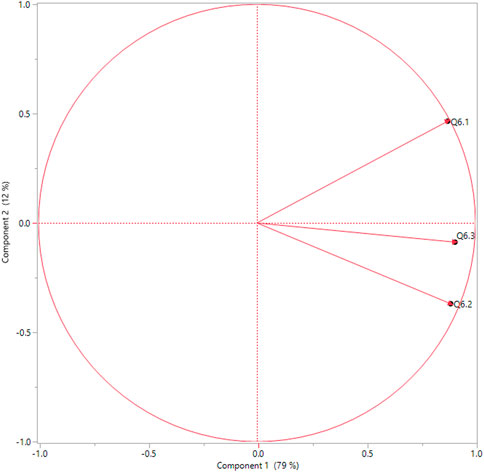
FIGURE 2. Factor loadings related to Y (overall user satisfaction with counter services).
Table 6 shows the correlation coefficients between each question item in categories A to C and ZY1. The following principal components analysis for each category uses the marked question items with a correlation coefficient of 0.4 or higher. However, for categories I, M, and A, which are additional questions, all question items are used as they are for the PCA because the structure and content of the questions for each of the three scales have not been fully explored and will be used for exploratory purposes only (the results of the correlation analysis with ZY1 are shown in Table 7).
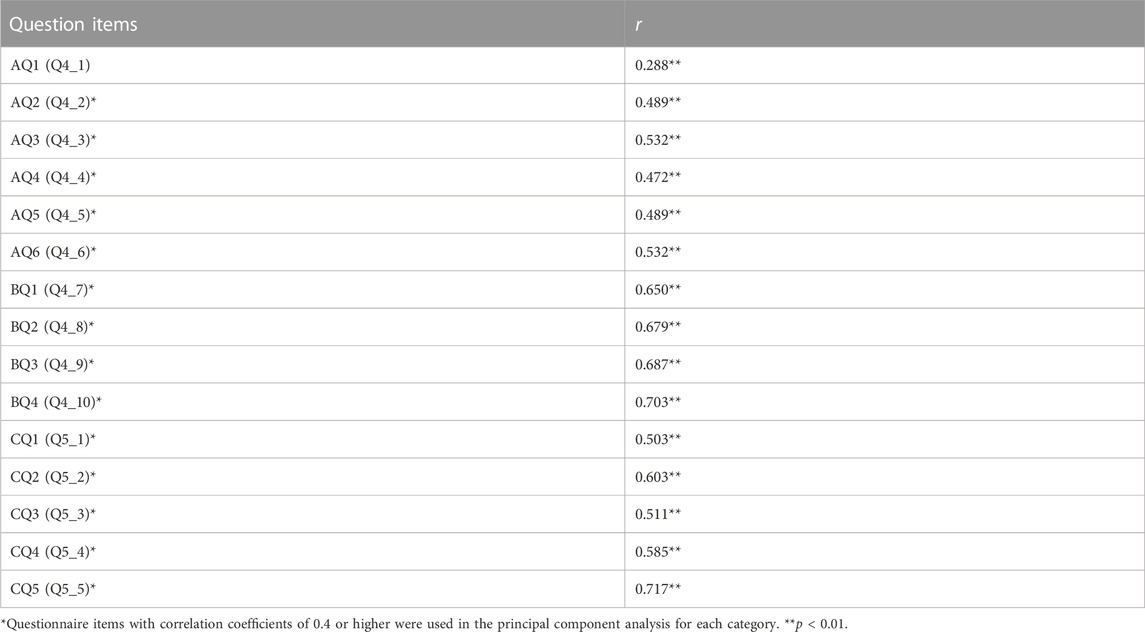
TABLE 6. Co-relationship between Component ZY1 and the basic question items.
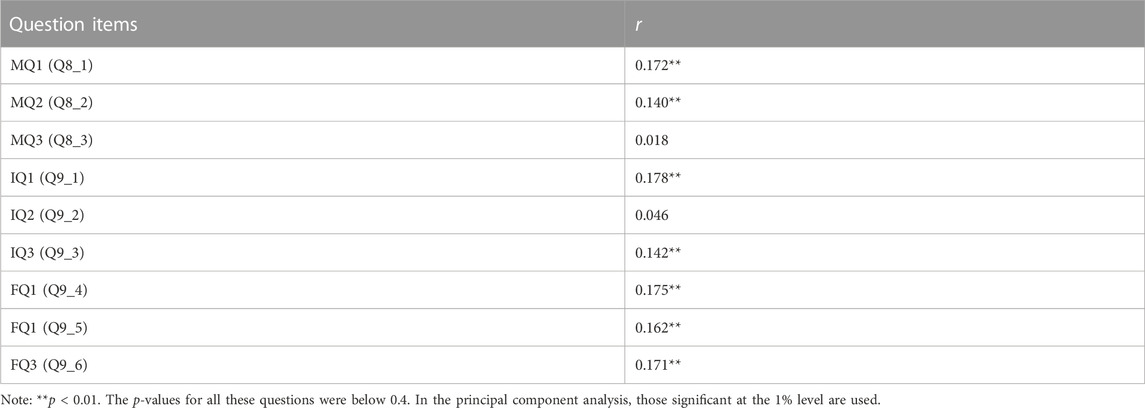
TABLE 7. Co-relationship between component ZY1 and the question items concerning respondents’ personality traits.
PCA was conducted for each category (A–C) using the selected question items, and composite variables for explanatory variables used later in the regression analysis were created. The PCA was conducted for each question in category A (Figure 3). The scores for the first and second components were added to the dataset as variables ZA1 and ZA2, respectively. The point slightly above Q4_5, where the caption disappears owing to the drawing of the figure, is Q4_4. As shown, AQ3 (Q4_3) has one of the most significant effects on the first principal component. Q4_4 and Q4_5 are also located on the right side of the figure. Based on these points, component 1 can be interpreted as “the building atmosphere, ease of finding the location in general.” Q4_2 is about office furniture, such as desks and chairs, and Q4_3 is about the physical atmosphere of the facility equipment. Component 2 can be interpreted as “office furniture” looking at the position of AQ2 (Q4_2).
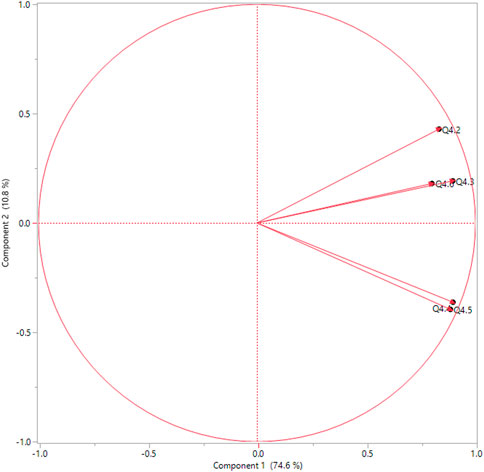
FIGURE 3. Factor loadings related to A.
The results of the PCA for each question in category B are shown in Figure 4. New variables ZB1 and ZB2, calculated from principal component scores, were added to the dataset. Figure 4 shows that BQ1 (Q4_7) to BQ4 (Q4_10) had almost the same significant effects on component 1 (ZB1), interpreted as “Ease of consultation with the counter staff and clarity of explanations in general.” Component 2 (ZB2) can be interpreted as “Ease of asking questions of the counter staff/ease of understanding oral explanations” if focusing on the combination of Q4_7–Q4_8 and Q4_9–Q4_10. Both Q4_9 and Q4_10 are related to the ease of understanding the oral explanations by the counter staff.
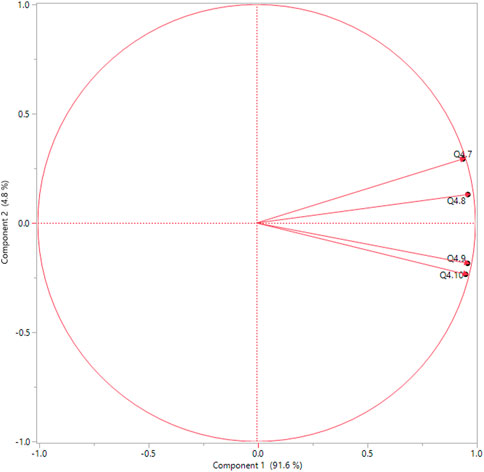
FIGURE 4. Factor loadings related to B.
Figure 5 presents the results of PCA for each question in category C. As indicated, the scores for the first and second components were added to the dataset as variables ZC1 and ZC2. Q5_3 and Q5_5 are located to the right. The other variables are also positive for the first principal component and are positioned on the right. Component 1 can be interpreted as “Solving customer problems and concerns; ” then, focusing on the position of CQ2 (Q5_2) and Q5_5, both of which concern time for work and processing, component 2 can be interpreted as “Service promptness at the ward office.” The first and second principal components from questions concerning respondents’ personality traits were added to the dataset and included ZM1, ZM2, ZI1, ZI2, ZF1, and ZF2.
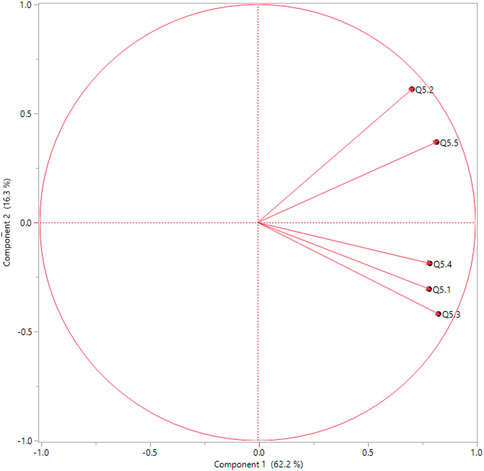
FIGURE 5. Factor loadings related to C.
First, as in the author’s previous studies, multiple regression analysis was conducted using the principal component scores of the three categories A–C. The results of the multiple regression analysis on ZY1, using the variable increasing and decreasing method with synthetic variables generated from the categories of explanatory variable questions (ZA1, ZA2, ZB1, ZB2, ZC1, and ZC2), are displayed in Table 8. The adjusted R-squared value of the model’s coefficient of determination is.69, the highest among all of the authors’ studies. The standardized partial regression coefficients of ZC1, too, are the highest at.50 (significant at the 1% level). Thus, ZC1 was the most important variable for the explained variable (ZY1). When comparing the first principal components, the first component of B (customer service provided by staff) and the first component of A (office hardware) follow. The variance inflation factor (VIF) of ZB1 is slightly greater than 2.00. This indicates an overlap between the set explanatory variables (i.e., the risk of multicollinearity) in category B. The VIF for category B, the human aspect, is somewhat high, so the composition of this category will need to be reconsidered if a similar study is conducted in the future.
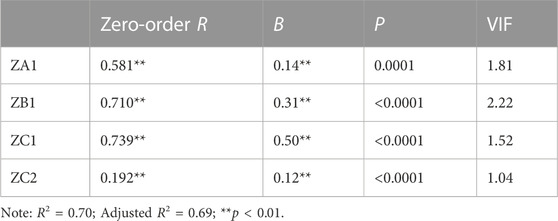
TABLE 8. Multiple regression predicting overall customer satisfaction (Component ZY1): Model 1.
Next, a multiple regression analysis (Model 2) was conducted by adding the principal component scores of the variables related to the personalities and thoughts of the users (M, I, and F) in addition to the explanatory variables of the three categories (A–C). Table 9 shows the results of the regression analysis in Model 2. The adjusted R-squared value of the model’s coefficient of determination is .71, which is higher than that of Model 1. At the 1% level, ZC1 and ZA1 had positive effects on the explained variable ZY1 in that order. The VIF for VB1 was slightly over 2.00; therefore, some concerns remain regarding independence among the selected explanatory variables. The principal component score variables calculated from the I and F categories (ZI1, ZI2, and ZF1) had coefficients significant at the 1% level in this model. The first principal component of category I (international orientation) had a positive coefficient, and the second principal component had a negative coefficient; the standardized partial regression coefficient (B) was small but statistically significant. Because the adjusted R-squared value of the model’s coefficient of determination is higher than that of Model 1, we can say that Model 2, with the respondent’s personality and thoughts variables, has more explanatory power than Model 1. However, the magnitude of its explanatory power is not remarkable. Customer satisfaction research often considers customer-side factors in its model of satisfaction factors. The results of this study showed a certain usefulness as an explanatory variable of personality traits, which are part of the customer-side factors for customer satisfaction. However, an important future consideration should be how to incorporate customer-side factors consistently in survey design.
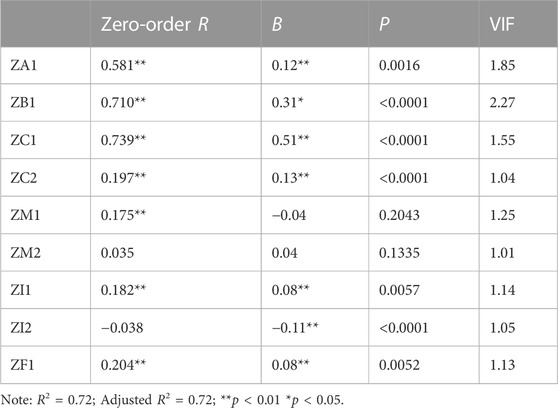
TABLE 9. Multiple regression predicting overall customer satisfaction: Model 2 (including users’ personality traits M, I, and F).
5 Discussion
The results of this survey of Tokyo Metropolitan Area ward office users were consistent with the author’s surveys conducted at Osaka City Ward Office (Moteki, 2021a) and Higashihiroshima City Hall (Moteki, 2021b). This study conducted an online survey targeting female users of the ward offices. Similar to previous surveys, a two-step statistical analysis was conducted, comprising PCA and multiple regression analysis. The main question items as explanatory variables for the analysis were presented in three specific categories: A, B, and C. Multiple regression analysis was used on two principal components calculated from each category. This analysis (Table 3) demonstrated that ZC1 from category C (service delivery) was the most influential, followed by ZB1 (the first component of customer service provided by the counter staff) and ZA1 (the first component of office hardware).
For explanatory variables A–C, the most influential variable was ZC1. The regression coefficients for each variable indicated that service delivery quality (category C) was the most important variable. This result was consistent with Moteki’s (2021a; 2021b) results in Japan, which revealed that service delivery was more important than administrative services. In contrast, the results of the 2020 survey at the Kurose branch office of the Higashihiroshima city government showed that the human factor was the most influential. This difference highlights the regional factors of urban and rural areas and the different authorities at the government offices. In the COVID-19 pandemic era, both private and public organizations were increasingly required to improve their service delivery methods and service quality (Sheth, 2020). Considering the pros and cons of outsourcing local government counter services in Japan to private companies, it would be important to note the differences in the most important determinants of user satisfaction among the different types of service provided at the counters, as indicated by this study and others. All four studies share that the physical aspects of public facilities are not the most critical factors for user satisfaction. A situation often arises in Japan where public facilities need to be reconstructed due to aging buildings and the need for earthquake resistance. However, the author’s studies suggest that hardware is not the most important in securing user satisfaction. Administrative practitioners will need to consider this point.
Here, a detailed analysis of category A of the hardware aspect is performed as an additional analysis. Table 10 lists the principal component loadings based on the results of the PCA for category A. This is the principal component loadings of the original values when each question item is positioned with the first and second principal components in Figure 3. Values of Q4_3 Indoor atmosphere; Q4_4 Ease of following the layout of the floors and offices inside the building; and Q4_5 Ease of understanding the building’s locations and entrances at the site of the ward office do not differ much and are important questions for the first principal component. For the second principal component, which was not chosen as an explanatory variable in the multiple regression analysis presented in Table 8, fixtures such as tables and chairs in the building were the most influential question items. Therefore, future in-depth surveys of the hardware aspects of satisfaction with government facilities will need to design questions that view fixture aspects—such as desks and chairs—and aspects—such as location guidance and atmosphere—having separate characteristics.
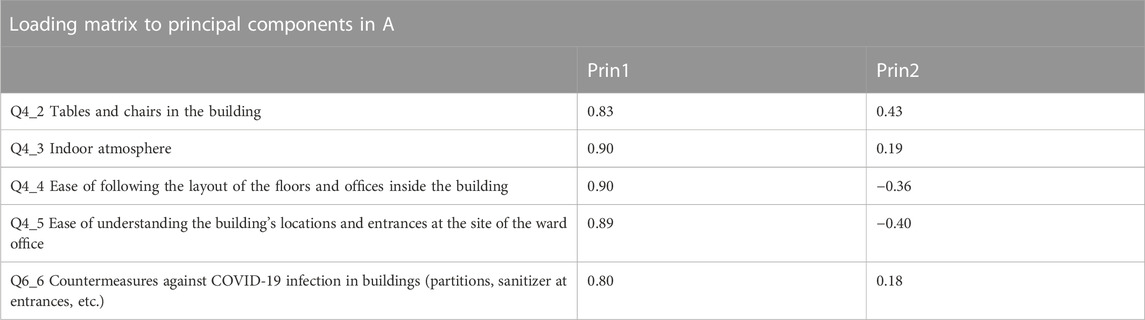
TABLE 10. Loading matrix to principal component A (hardware).
This study reveals the usefulness of the satisfaction scale for local public administration in the three categories of questions presented by the author. This was confirmed academically and statistically by principal component regression analysis and confirmatory factor analysis based on the author’s current internet survey of users of ward offices in Tokyo. Another important finding was confirmed by the high coefficient of determination in the regression analysis that, similar to SERVPREF, studies using only perceived outcomes adequately captured customer satisfaction without asking about expected outcomes. For practitioners, it is meaningful to survey only perceived outcomes and understand user satisfaction with a relatively small number of questions from only three categories as explanatory variables.
In this study, three categories of questions (I, M, and F) relating to the respondents’ personalities and thoughts were used in the multivariate analysis. For the first time, confirmatory factor analysis was conducted to examine the appropriateness of grouping explanatory variables. The three categories were found to be appropriate in light of the criteria consisting of eigenvalues and the Kaiser–Guttman criterion. Thus, we wrapped up each as a compound variable through PCA and analyzed their correlation with the explanatory variable ZY1.
Next, we conducted a multiple regression analysis of user satisfaction, considering the personality and thoughts of the facility users. We constructed a model with a higher explanatory power in terms of the coefficient of determination (Model 2: Adjusted R2 .72) than when analyzing only the variables of the administrative side involved in the service (Model 1). As mentioned earlier, factors contributing to user satisfaction are the service quality and the circumstances and attributes of the users and service providers/counter staff. The results of the regression analysis, especially the statistical significance of its coefficient of determination and standardized partial regression coefficients, show that it is possible to use the service quality evaluation method widely applied in the private sector. Differences between public and private organizations include the strength of regulation by law and the ambiguity of goals (Rainey, 2010). In the future, we would like to consider and explore more appropriate and effective methods of surveying service quality, focusing on the characteristics of public organizations. In addition, perspectives on employee satisfaction are beneficial in exploring the conditions of user satisfaction in government offices. For public administrative facilities, human factors significantly affect user satisfaction.
This study set three main categories: hardware, counter-officer responses, and service delivery quality (categories A–C). Additional aspects related to other user satisfaction factors may be needed for future research to develop a more explanatory model. We need to conduct a follow-up survey with renewed and refined question items to explore models and questionnaires that can better grasp user satisfaction at government offices. The determinants of user satisfaction can be explored in detail by comparing the results of these surveys with those of future studies.
The author conducted two on-site surveys in government buildings and two internet surveys on user satisfaction in public administration in Japan. On-site and internet surveys each have advantages and disadvantages. The advantages of on-site surveys are that the researcher can 1) answer respondents’ questions about the questionnaire directly and 2) check the actual situation at the government office during the survey period and identify unexpected events, such as upset users. Internet surveys have their merits, the most important being the ability to eliminate the time and effort involved in processing data, including data entry and tabulation. Another advantage, as shown in this study, is the relative ease of conducting surveys covering matters related to the respondent’s personality and attributes, which are difficult to obtain in face-to-face surveys. Although we could not investigate this in detail in this analysis, a future task would be to examine whether the mode (on-site or internet) affects the satisfaction survey results.
The author conducted a quantitative survey in the field of Japanese local governments using a questionnaire consisting of three original categories of questions, a simplified version of the five categories of SERVQUAL. In this regard, there are ways to focus on the exceptional case of angry customers, as in Bougie et al. (2003). These people are called “claims” or “claimers” in the Japanese language, with a negative meaning. Such problems between citizens and counter staff, developing from customer complaints, are increasingly prevalent at administrative offices in Japan. The troubles accrue due to 1) long waiting times, 2) unfulfilled wishes, 3) innate citizens’ distrust of government agencies, 4) users’ dissatisfaction with society and government agencies, and 5) users’ bad health conditions. One customer’s problem can often affect the other’s satisfaction and the motivation of the administrative staff, and the presence of an angry user on the floor could upset other users. Service recovery, that is, recovery or resolution from a failure in service delivery that caused customer outrage or dissatisfaction, has begun to be discussed in business administration as a way to deal with customer complaints, service failures, and errors (Johnston and Michel, 2008). Studies on customer complaints and service recovery in public administration would benefit from qualitative research involving a detailed investigation of individual cases and interviews with staff and citizens. In addition to the quantitative methods using questionnaires applied so far, the author would like to add qualitative methods, such as interviews, to future studies of customer/user satisfaction in public administration in Japan.
6 Limitations and future research agenda
The findings regarding user satisfaction with ward office counter services in Tokyo, Japan, are limited in generalizability due to the challenges posed by the internet survey methodology. The responses for this study reflect a subset of registrants in a panel from an internet research firm obtained on a single day during the survey implementation period. Like many commercial internet survey firms, the survey firms used in this study provide financial rewards to respondents through points. Moreover, our experience with this survey gave us the impression that respondents were not responding as thoughtfully as they would in a regular paper-based questionnaire survey. Online surveys frequently have the problem of sample bias, such as difficulty extracting a sample that is adequately representative of the assumed population, also referred to as inherent coverage bias (Tanner, 2018, p. 187). Specifically, those who are economically weak and do not have the skills or environment to use the internet are essentially left out of the sample. Depending on the details of how the online survey company recruits participants, it will also attract respondents with a strong interest in the surveyed topic. Another limitation is that examining user psychographic attributes using the three scales is within the scope of an exploratory study. Although the study utilizes the same framework as the previous survey of Osaka City ward offices, it does not examine the relationship among the three scales, particularly the correlation. Additionally, the study was initiated without sufficient consideration of multicollinearity and its position in the overall model of user satisfaction. To address these points, the method of variance structure analysis, often used in social psychology research today, should be used in future studies. Nevertheless, the fact that the coefficient of determination was slightly higher in the model using the three psychological attributes in the present analysis may provide suggestions for future research.
The online survey was limited to those who visited the facility and to a limited number of gender/age groups in the survey to suppress the sample bias inherent in online surveys maximally. Nevertheless, the limitations endemic to online surveys remain and can only be addressed through follow-up studies based on current results. The author would like to examine further the generalizability and significance of the results by conducting future on-site surveys at actual ward offices in Tokyo based on the same results, as well as how the changes introduced by COVID-19, including the infection prevention measures in the facilities discussed here, affect the factors that contribute to user satisfaction and improve service quality, as well as the psychological conditions and behavior of users and employees in the facilities.
7 Contribution to the field statement
Customer satisfaction surveys used in the private sector, both in practice and research, are also being conducted in the government sector nowadays. Managerial principles and methods are increasingly emphasized in government operations as well. The author’s research aims to demonstrate that the service quality evaluation methods widely applied in the private sector can also be used in the public sector. This study conducted an online survey targeting female users of ward offices in the Tokyo Metropolitan Area. This survey of Tokyo ward office users was consistent with the results of the author’s surveys conducted at the Osaka City Ward Office and Higashihiroshima City Hall. Similar to previous surveys, a two-step statistical analysis was conducted, comprising PCA and multiple regression analysis. The regression analysis demonstrated that the service delivery factor was the most influential, followed by the employee-related or staff-related factor. Hardware aspects, such as building interior, were also statistically significant with respect to user satisfaction. So far, this series of studies have shown that the most important factors for user satisfaction change with the different natures of government facilities; consequently, the targets that government facilities should address to improve their operations will vary with their nature and environment.
8 Ethical approval
This study is not biomedical research directly covered by the Declaration of Helsinki and has not undergone ethical review at our institution. The survey is within the scope of a typical social survey, and the question items in the questionnaire are not invasive. However, referring to the three principles outlined in the Declaration, we prepared a survey implementation plan and questionnaire that were confirmed by the implementing internet research company, especially regarding conformity with the respective terms and conditions of the company.
9 Informed consent statement
Respondents are registered as Rakuten Insight monitors in advance. Rakuten Insight’s monitors joined the general survey panel by agreeing to the Monitor Agreement and Privacy Policy. These terms and conditions are posted on the company’s website and are available for public review. Explanations of these privacy protection policies and terms were included in the online survey used in the research.
Data availability statement
The datasets generated and/or analyzed during this study are not publicly available due to the data anonymity guarantee given to the survey participants per the terms and conditions of the internet research company used. The terms of service of this company prohibit researchers from providing obtained raw data to third parties (https://member.insight.rakuten.co.jp/explanation/security/). The aggregated statistics of each variable within the dataset are available from the corresponding author upon reasonable request. Inquiries regarding data related to this study should be made to the Ethics Review Committee of Hiroshima University (Website: https://www.hiroshima-u.ac.jp/gshs/research-ethics E-mail: ZWQta2VuLXphaUBvZmZpY2UuaGlyb3NoaW1hLXUuYWMuanA=). As another point of contact for any data requests, the ethics review committee will handle the requests on aggregated statistics through the publicly available e-mail address.
Author contributions
The author confirms being the sole contributor of this work and has approved it for publication.
Funding
This work was supported only by a subsidy program for English editing services provided by the affiliated university.
Conflict of interest
The author declares that the research was conducted in the absence of any commercial or financial relationships that could be construed as a potential conflict of interest.
Publisher’s note
All claims expressed in this article are solely those of the authors and do not necessarily represent those of their affiliated organizations, or those of the publisher, the editors and the reviewers. Any product that may be evaluated in this article, or claim that may be made by its manufacturer, is not guaranteed or endorsed by the publisher.
References
Adorno, T. W., Frenkel-Brunswik, E., Levinson, D. J., and Sanford, R. N. (1950). The authoritarian personality. New York: The American Jewish Committee.
Afroj, S., Hanif, F., Hossain, M. B., Fuad, N., Islam, I., Sharmin, N., et al. (2021). Assessing the municipal service quality of residential neighborhoods based on SERVQUAL, ahp and citizen’s score card: A case study of dhaka north city corporation area, Bangladesh. J. Urb. Mgmt. 10 (3), 179–191. doi:10.1016/j.jum.2021.03.001
Agus, A., Barker, S., and Kandampully, J. (2007). An exploratory study of service quality in the Malaysian public service sector. Int. J. Qual. Rel. Mgmt. 24, 177–190. doi:10.1108/02656710710722284
Akinloye Akinboade, O., Chanceline Kinfack, E., and Putuma Mokwena, M. (2012). An analysis of citizen satisfaction with public service delivery in the Sedibeng district municipality of South Africa. Int. J. Soc. Econ. 39, 182–199. doi:10.1108/03068291211199350
Babakus, E., and Boller, G. W. (1992). An empirical assessment of the SERVQUAL scale. J. Bus. Res. 24, 253–268. doi:10.1016/0148-2963(92)90022-4
Bente, F. M. (2014). Ethnicity and citizen satisfaction: A study on local public administration. Procedia Econ. Fin. 15, 1324–1330. doi:10.1016/S2212-5671(14)00595-4
Bouckaert, G., and Van de Walle, S. (2003). Comparing measures of citizen trust and user satisfaction as indicators of “good governance”: Difficulties in linking trust and satisfaction indicators. Int. Rev. Admin. Sci. 69, 329–343. doi:10.1177/0020852303693003
Bougie, R., Pieters, R., and Zeelenberg, M. (2003). Angry customers don’t come back, they get back: The experience and behavioral implications of anger and dissatisfaction in services. J. Acad. Mark. Sci. 31, 377–393. doi:10.1177/0092070303254412
Brown, T. J., Churchill, G. A., and Peter, J. P. (1993). Improving the measurement of service quality. J. Retail. 69, 127–139. doi:10.1016/S0022-4359(05)80006-5
Buttle, F. (1996). Servqual: Review, critique, research agenda. Eur. J. Mark. 30, 8–32. doi:10.1108/03090569610105762
Christensen, T., and Lægreid, P. (2005). Trust in government: The relative importance of service satisfaction, political factors, and demography. Public Perform. Manag. Rev. 28, 487–511. doi:10.1080/15309576.2005.11051848
Cripps, H., Ewing, M., and McMahon, L. (2004). Customer satisfaction in local government: The case of the restructured city of perth, Australia. J. Nonprofit Public Sect. Mark. 12, 1–22. doi:10.1300/J054v12n01_01
Cronin, J. J., and Taylor, S. A. (1992). Measuring service quality: A reexamination and extension. J. Mark. Qual. Meas. Serv. Qual. Meas. Serv. 56, 55–68. doi:10.1177/002224299205600304
Everitt, B. S. (2005). An R and S-plus companion to multivariate analysis. Berlin: Springer Science and Business Media.
Harun, H., Graham, P., Kamase, H. P., and Mir, M. (2021). A critical analysis of the impacts of financial literacy and NPM on Village Funds Initiative in Indonesia. Int. J. Public Admin. 44, 336–345. doi:10.1080/01900692.2020.1722165
Heintzman, R., and Marson, B. (2005). People, service and trust: Is there a public sector service value chain? Int. Rev. Admin. Sci. 71, 549–575. doi:10.1177/0020852305059599
Huque, A. S., and Hayllar, M. R. (1999). The limits of customer satisfaction: The case of the companies registry trading fund in Hong Kong. Asian Rev. Public admin. 11, 100–113.
Johnson, M., and Gustafsson, A. (2000). Improving customer satisfaction, loyalty and profit: An integrated measurement and management system. San Francisco: John Wiley and Sons.
Johnston, R., and Michel, S. (2008). Three outcomes of service recovery: Customer recovery, process recovery and employee recovery. Int. J. Oper. Prod. Manag. 28, 79–99. doi:10.1108/01443570810841112
Jung, J., and Mittal, V. (2020). Political identity and the consumer journey: A research review. J. Retail. 96, 55–73. doi:10.1016/j.jretai.2019.09.003
Kawasaki, S., Takahashi, T., and Suzuki, K. (2014). The effect of autonomous career actions on self-career formation from the viewpoint of quality management. Proc. Int. Conf. Qual. ’14 Tokyo 2014, 152–163.
Korunka, C., Scharitzer, D., Carayon, P., Hoonakker, P., Sonnek, A., and Sainfort, F. (2007). Customer orientation among employees in public administration: A transnational, longitudinal study. Appl. Ergon. 38, 307–315. doi:10.1016/j.apergo.2006.04.019
Mansor, N., and Che Mohd Razali, C. H. (2010). Customers’ satisfaction towards counter service of local authority in Terengganu, Malaysia. Asian Soc. Sci. 6, 197–208. doi:10.5539/ass.v6n8p197
Martins, A. L., Carvalho, J. C., Ramos, T., and Fael, J. (2015). Assessing obstetrics perceived service quality at a public hospital. Procedia Soc. Behav. Sci. 181, 414–422. doi:10.1016/j.sbspro.2015.04.904
Massey, A. (2019). Persistent public management reform: An egregore of liberal authoritarianism? Public Money Manag. 39, 9–17. doi:10.1080/09540962.2018.1448160
Moteki, Y. (2022). Customer satisfaction with branch office services in Higashihiroshima, Hiroshima Prefecture. Public Organ. Rev. 2022. doi:10.1007/s11115-021-00574-w
Moteki, Y. (2021a). Customer satisfaction with services at the ward offices of Osaka City Government. J. Urb. Manag. Loc. Gov. Res. 36, 91–103.
Moteki, Y. (2021b). Factors determining customer satisfaction with counter services of local government offices: On-site survey examining service quality at Higashihiroshima city Hall. Jpn. Res. Sq. 2021. doi:10.21203/rs.3.rs-1118972/v1
Mouwen, A. (2015). Drivers of customer satisfaction with public transport services. Transp. Res. A 78, 1–20. doi:10.1016/j.tra.2015.05.005
Nazi, K. M. (2010). Veterans’ voices: Use of the American customer satisfaction index (ACSI) survey to identify my HealtheVet personal health record users’ characteristics, needs, and preferences. J. Am. Med. Inf. Assoc. 17 (2), 203–211. doi:10.1136/jamia.2009.000240
Noda, Y. (2019). Citizen expectations and satisfaction of service performance: Lessons from subnational governments in Japan. Asia Pac. J. Public Admin. 41, 142–156. doi:10.1080/23276665.2019.1658361
Noda, Y. (2014). Nonlinear effects on citizen satisfaction and different levels of governments in Japan. Asian Rev. Public Adm. 25, 74–91. doi:10.1007/978-3-319-31816-5_3265-1
Noda, Y. (2021). Performance information and learning effects on citizen satisfaction with public services. Public Manag. Rev. 23, 1833–1855. doi:10.1080/14719037.2020.1775281
Noda, Y. (2013). Shimin manzoku-do no kenkyu [research on citizen satisfaction. Tokyo: Nippon Hyoronsha.
Ocampo, L., Alinsub, J., Casul, R. A., Enquig, G., Luar, M., Panuncillon, N., et al. (2019). Public service quality evaluation with SERVQUAL and AHP-TOPSIS: A case of philippine government agencies. Socio Econ. plann. Sci. 68, 100604. doi:10.1016/j.seps.2017.12.002
Parasuraman, A., Zeithaml, V. A., and Berry, L. L. (1985). A conceptual model of service quality and its implications for future research. J. Mark. 49, 41–50. doi:10.1177/002224298504900403
Public Interest Incorporated Foundation Special Wards Council. (2019). Tokubetsu-ku to wa what is a special ward? Available at: https://www.tokyo-23city.or.jp/chosa/tokubetsuku/whats.html [Accessed October 10, 2022].
Rainey, H. G. (2010). “Goal ambiguity and the study of American bureaucracy,” in The oxford handbook of American bureaucracy. Editor R. F. Durant (Oxford: Oxford University Press), 231–251.
Rhee, S. K., and Rha, J. Y. (2009). Public service quality and customer satisfaction: Exploring the attributes of service quality in the public sector. Serv. Ind. J. 29, 1491–1512. doi:10.1080/02642060902793441
Sheth, J. (2020). Business of business is more than business: Managing during the covid crisis. Ind. Mark. Manag. 88, 261–264. doi:10.1016/j.indmarman.2020.05.028
Takahashi, T. (2020). Shitsumon-su no ooi anketo chosa no tame no ryogawa Inga bunseki [Dual-sided causal analysis for questionnaire survey with a large number of questions about cause and result] [Paper presentation]. Discov. Summit, Jpn. Novemb. 17, 2020.
Takahashi, T., and Kawasaki, M. (2019). Anketo Ni yoru chosa to kaso jikken: Kokyakumanzoku-do No haaku to kojo [survey and virtual experiments by questionnaire: Understanding and improving customer satisfaction]. Tokyo: Nikkagiren.
Talib, M. A., and Shukor, N. J. A. (2016). “Quality measurement of public payment counter service: A statistical approach,” in Reg. Conference on science, Technology and social sciences (RCSTSS 2014) (Singapore: Springer), 1053–1062. doi:10.1007/978-981-10-1458-1_94
Tanner, K. (2018). “Survey designs,” in Research methods: Information, systems, and contexts. Editors K. Williamson, and G. Johanson 1st ed. (Cambridgeshire: Chandos Publishing), 159–192.
Tokyo Metropolitan Government. (2018). Tokunai shichoson mappu [Map of wards, cities, towns, and villages in Tokyo Metropolitan Government]. Available at: https://www.metro.tokyo.lg.jp/tosei/tokyoto/profile/gaiyo/kushichoson.html [Accessed January 1, 2022].
Tokyo Metropolitan Government. (2020). Tokyo-to nenpyo. Chronological table Tokyo metrop gov. Available at: https://www.metro.tokyo.lg.jp/tosei/tokyoto/profile/gaiyo/nenpyo.html [Accessed October 10, 2022].
Wagenheim, G. D., and Reurink, J. H. (1991). Customer service in public administration. Public admin. Rev. 51, 263–269. doi:10.2307/976950
Wang, X., Chen, Y. H., and Tsai, S. C. (2010). “Personality traits as moderators of the relationship between customer satisfaction and loyalty,” in 7th International Conference on Service Systems and Service Management 2010, Tokyo, Japan, 28-30 June 2010, 1–6. doi:10.1109/ICSSSM.2010.5530145
Wilson, A., Zeithaml, V. A., Bitner, M. J., and Gremler, D. D. (2021). Services marketing: Integrating customer focus across the firm. 4th European Ed. London: McGraw-Hill.
Wisniewski, M. (2001). Assessing customer satisfaction with local authority services using SERVQUAL. Total Qual. Manag. 12, 995–1002. doi:10.1080/09544120100000026
Yashima, T. (2002). Willingness to communicate in a second language: The Japanese EFL context. Mod. Lang. J. 86, 54–66. doi:10.1111/1540-4781.00136
Keywords: counter service, user satisfaction, direct experience, factor analysis, local governments, Japan
Citation: Moteki Y (2023) User satisfaction with Tokyo Metropolitan Government ward office counter services. Front. Built Environ. 9:1116966. doi: 10.3389/fbuil.2023.1116966
Received: 06 December 2022; Accepted: 23 January 2023;
Published: 06 February 2023.
Edited by:
Soufiane Fezzai, University of Tébessa, AlgeriaReviewed by:
Shenjun Yao, East China Normal University, ChinaMady Mohamed, Effat University, Saudi Arabia
Copyright © 2023 Moteki. This is an open-access article distributed under the terms of the Creative Commons Attribution License (CC BY). The use, distribution or reproduction in other forums is permitted, provided the original author(s) and the copyright owner(s) are credited and that the original publication in this journal is cited, in accordance with accepted academic practice. No use, distribution or reproduction is permitted which does not comply with these terms.
*Correspondence: Yasutoshi Moteki, bW90ZWtpQGhpcm9zaGltYS11LmFjLmpw