 Giulio Zuccaro
 Mauro Dolce
 Francesca Linda Perelli
 Daniela De Gregorio
 Elena Speranza3
- 1Department of Structures for Engineering and Architecture, University of Naples Federico II, Naples, Italy
- 2PLINIVS Study Centre, University of Naples Federico II, Naples, Italy
- 3Italian Civil Protection Department, Rome, Italy
Large-scale risk assessments relevant to natural hazards are commonly based on very poor exposure and vulnerability data, often drawn from census data. In fact, obtaining a detailed knowledge of the built heritage is a very hard task especially for those countries, like Italy, characterized by very high urban density and large variety of building typologies, where a building-by-building knowledge can sound as a utopian ambition. Nevertheless, exposure and vulnerability are two of the four factors governing, along with hazard and capacity, risk convolution, and hence their uncertainties yield to corresponding uncertainties in the resulting expected losses. The lack of suitable information on building typologies is responsible of very strong simplifications in risk analyses, like the assumption of the same building typologies, indistinctly scattered all over the Country territory, without distinctions at a local or at a regional level. With the goal of improving exposure description and reducing such uncertainties, since 2014 the Italian Civil Protection Department (ICPD) has undertaken a new research branch in the framework of ReLUIS (Network of University Laboratories in Earthquake Engineering) projects, dedicated to territorial analyses, by funding also the CARTIS project. The project has the goal to characterize the building structural typologies trough a data collection at a local and an extensive scale in Italy, with the final aim to improve the reliability of seismic risk analyses. The paper describes the method and some first statistics so far elaborated.
1 Introduction
Large-scale risk assessments related to geo-hazards, namely, seismic, volcanic and hydrogeological, represent the basis for the development of risk-informed mitigation policies, such as long-term prevention programs or Civil Protection contingency plans, for an effective management of all the phases of the disaster risk cycle. For instance, they have been used in Italy for the distribution of funds among the Regions for the National seismic risk prevention program (Dolce, 2012; Dolce et al., 2021).
Being seismic risk a combination of four fundamental factors, such as hazard, exposure, vulnerability, and capacity (UNDRR, 2016), the evaluation of exposure and physical vulnerability of elements at risks is a crucial staple to get reliable risk assessment. Focusing on the building stock, whose damage and collapse produce widespread economic, social and societal consequences, the methodologies for their assessment strongly depend on the information and data already available, or that can become available at reasonable costs and times. Moreover, exposure and vulnerability assessments are so strongly each other dependent that it is often difficult to deal with them separately. Therefore, joint exposure-vulnerability models are usually adopted, once exposure data are defined (Zuccaro et al., 2021a; Zuccaro et al., 2021b; Masi et al., 2021). Focusing, more specifically, on the vulnerability of buildings, different approaches can be pursued for the development of vulnerability models, e.g., observational, mechanical or hybrid methods (Perelli et al., 2019; Dolce et al., 2020; Liguori et al., 2022). They all require a qualitative and quantitative assessment necessarily based on the information available on the building structural features.
In the literature, different procedures to manage building inventories in the framework of risk assessment can be found. The main methods are of two kinds. The first kind develops global databases of building inventories using a taxonomy of global or national building types, mainly for use in near-real-time post-earthquake loss estimation and/or pre-earthquake risk analysis, such as: Russian program Extremum (Shakhramanian et al., 2000), HAZUS-MH (Federal Emergency Management Agency, 2006), PAGER (Jaiswal et al., 2010), GEM (Crowley et al., 2013). These databases, relevant to the main structural characteristics of the buildings and mostly based on expert evaluations, include building information on inner and outer features of the buildings, despite the building typologies described usually do not cover the entire regional or national territory. Therefore, they must be completed using large-scale information such as those derived from census data, as in the BINC method (Cacace et al., 2018). The second kind of approach makes use of satellite remote sensing to get buildings’ inventories, through the visual assessment by images of features that can be assumed as proxies of the structural characteristics that affect the seismic performance of buildings. These techniques can be founded on pure satellite remote sensing (Saito et al., 2004; Taubenböck et al., 2006; Yamazaki et al., 2007; Taubenböck et al., 2008; Taubenböck et al., 2009), providing information about vulnerability-related features that can be assessed from the top view; or integrated approaches, which combine satellite images and ground-based omnidirectional imaging data (Wang et al., 2006; Torii et al., 2009; Teller; Wieland et al., 2012). Differently from the approaches of the former kind, these can quickly gather a lot of data at national and regional level. Moreover, they are able to better control the dynamic change over short time-scales (a few years) of urban settlements. On the other hand, they present the difficulty of correlating the information obtained from the images with the essential structural characteristics of the buildings to assess their seismic vulnerability. Probably, hybrid approaches seeking to balance the pros and cons of the two families of methodologies can provide the most reliable exposure/vulnerability estimates.
In Italy, the building stock inventory mostly used for large-scale risk assessment refers to the National census database provided by ISTAT (National Institute of Statistics, http://dati-censimentopopolazione.istat.it/Index.aspx), whose information on building characteristics is very poor, consisting of age of construction, number of stories (by range interval) and material of vertical structures (masonry or reinforced concrete). Therefore, when census data are the only information available, the uncertainties in the assessment of seismic vulnerability and, then, of seismic risk, are very high. This is because the poor information available on the structural characteristics is typically not adequate to describe the wide varieties of building types in the Italian territory. In fact, throughout the country, construction techniques have been differently developing over the centuries, due to local cultures, social conditions and materials available, in some cases considerably affecting the building characteristics and quality, thus determining substantially different seismic response.
It turns out that the development of large-scale risk analyses, necessarily requires additional vulnerability data that, in the case of the last national seismic maps developed in Italy in 2018 (Dolce et al., 2021), were limited to building features in areas previously hit by recent earthquakes. These were provided by a specific IT platform (DaDO-damage data observation) developed by Italian Civil Protection Department (ICPD) and collecting information on damage and structural features on ordinary buildings for 11 national seismic events (Dolce et al., 2019).
To improve vulnerability and risk assessment, the Italian ICPD has promoted, since 2014, a new “Territorial” branch of research, with the aim to stimulate studies and research activities on risk assessment at territorial scale (Dolce and Di Bucci, 2015). Within the framework of the consortium ReLUIS (Network of University Laboratories in Earthquake Engineering) projects, ICPD has funded the CARTIS project: “Inventory of existing structures and building typologies”. The project has the goal to collect data and better identify and characterize structural types at local and large scale in Italy, primarily to improve taxonomies and then reduce uncertainties in the risk assessment at national scale, as well as to enable detailed risk assessment at municipality level.
The CARTIS project has developed an innovative methodology based on the information on structural characteristics at a sub-municipal scale collected through local expert knowledge. As far as risk assessment at national level is concerned, carrying out CARTIS surveys in a significant suitable sample, of the about 8,000 municipalities of the twenty Italian Regions, will permit to develop regional characterizations of Italian ordinary buildings referred to the taxonomy derived from ISTAT census dataset. With regards to the single municipality where the CARTIS survey is carried out, the improvement of the structural characterization of the building types in its territory can allow for more detailed vulnerability and risk assessments, particularly if micro-zonation studies are also available in the municipal territory (Dolce et al., 2011).
The CARTIS approach has two main goals: (1) the development of a systematic methodology for the assessment of exposure and vulnerability at territorial scale based on the typological-structural characterization of residential buildings; (2) the development of a database (containing typological-structural information of residential Italian buildings) available to researchers in order to deepen their knowledge of the vulnerability with respect to earthquakes, as well as to other natural phenomena, such as volcanic eruptions (Zuccaro and De Gregorio, 2019) and hydrogeological events (Zuccaro et al., 2012; Ettinger et al., 2016). For these latter, specific vulnerability functions or fragility curves, different from the ones relevant to earthquakes, can be developed based on the knowledge of the structural features obtained from the CARTIS survey.
The main purpose of the CARTIS methodology is to exploit the considerable technical knowledge available in the territory, deriving from professional practice. Indeed, the building development in Italian towns has historically occurred according to a diachronic process, where sub-municipal areas associated with different urban growths are quite well recognizable, as characterized by the adoption of specific building structural typologies as well as local materials. In more recent times, this urban development has been further ruled up by local town-planning and building regulations, so that it is possible to find out, in most of Italian towns, sub-municipal areas whose buildings’ structural features are quite homogeneous. This often holds also for transformation or refurbishing interventions in the past, in relation to historical events, among which earthquakes or other natural events, wars or new planning regulations.
Being aware of that, the methodology requires that sub-municipal homogeneous areas are preliminarily identified, based on the available historical information, previous urban maps certifying the construction period of specific areas, or even the direct knowledge of local experts. Then, information on the structural characteristics of the typical buildings of a given sub-municipal area can be extracted from the know-how of local experts and practitioners.
Interview protocols and procedures for data collection of local building characteristics were set up and applied in the past for the vulnerability assessment of groups of buildings in sub-municipal areas, such as in Dolce et al. (Dolce and Speranza, 2001; Dolce et al., 2002) and in NTC (NTC, 2002), or more recently in some pilot projects (Dolce et al., 2011; Dolce et al., 2013).
The main tool of the CARTIS methodology is the CARTIS form and its user’s manual, aimed at describing the main residential building typologies in municipal or sub-municipal areas (called “Sectors”), characterised by the homogeneity of the building fabric, by the age of the first settlement and/or by construction and structural techniques. A further survey form, CARTIS-BUILDING, devoted to building by building inspections consistent with the information required in the CARTIS form, was also developed for validating the information collected for building typologies of a municipal sector, through the CARTIS survey form.
The ReLUIS CARTIS Project has been characterised by the following further activities grounded on the CARTIS forms.
⁃ Development of a software (client web application) for the input of the data required in the CARTIS form into a database in which the information collected is stored to allow for future processing by ReLUIS research units.
⁃ Data collection carried out by several research units (more than 30), through the compilation of the CARTIS form, to get information on a significant sample of Italian municipalities. Until 31 December 2022, 421 Italian have been investigated (about 5% of the Italian municipalities). The Regions with the highest percentage of municipalities investigated are Toscana (21.9%), Campania (13.6%) and Abruzzo (10.8%). The most investigated geographical areas are Centre (10.1%) and South (10.4%). Details are set out in Section 3.
⁃ Population of the database by storing the information collected through the CARTIS forms into an organised system.
⁃ Development of a methodology for the evaluation of exposure on a territorial scale based on the typological-structural characteristics of ordinary buildings (obtained from the compilation of the CARTIS form) and ISTAT (ISTAT, 2001) census dataset.
⁃ Definition of a taxonomy of representative building typologies by geographical areas.
⁃ Development of first analyses for the definition of an inventory of vulnerability curves existing in the literature or derived from new studies, which can be associated with the taxonomy mentioned in the previous point.
The typological structural characterisation has been carried out with the aim of investigating the national construction panorama and identifying, from a qualitative point of view, local construction characteristics, in order to improve vulnerability evaluations, accounting for local typological features. Appropriate elaborations of the data collected through the CARTIS form provide indications for regionalisation of the seismic vulnerability classes and vulnerability functions, so far used on the whole national territory (Dolce et al., 2021).
At the time of writing, the CARTIS methodology has been applied on a total of 383 municipalities, representing almost 5% of the total number of municipalities in the Country. The CARTIS BUILDING form has been applied on about 5,300 residential buildings, allowing for some calibrations of the building typologies’ identification process. The dataset so far realised represents a first important staple for improving the exposure at territorial scale as well as seismic risk analyses at a national scale.
The CARTIS approach has been also developed for other building typologies, such as large span buildings (CARTIS—LARGE SPAN), industrial buildings, and churches (CARTIS—CHURCH). However, these further developments will not be described in the present paper.
The CARTIS database is under construction. The paper aims to describe the methodology of data collection and to show the first statistics of exposure distribution at national scale (by region and geographical area) on the basis of the information detected by 2022, in order to integrate the exposure data provided by ISTAT, currently used for the evaluation of the National Risk Assessment. The description of the CARTIS methodology also aims to better define the common approach of investigation of Italian ordinary buildings adopted by different research units for vulnerability assessments at local scale (Zuccaro and Cacace, 2015; Chieffo and Formisano, 2019; Polese et al., 2019; Chieffo and Formisano, 2020; Vettore et al., 2020; Brando et al., 2021; Faggiano et al., 2021; Menichini et al., 2022; Zucconi et al., 2022; Perelli et al., 2023). In the following sections, the main characteristics of the CARTIS form (CARTIS form, 2017) and related compilation manual (CARTIS Manual, 2021), being the main operative tools of the CARTIS method, are presented.
2 The CARTIS survey activity
The object of the CARTIS activity is the entire municipal area including any hamlets or localities that are significant in terms of building population and typological characterization of Italian local constructive features of ordinary buildings with masonry and/or reinforced concrete vertical structure.
CARTIS refers only to Italian ordinary buildings, such as those mainly used for housing and/or services. These are mostly multi-storey buildings, characterised by masonry or reinforced concrete structures with limited dimensions in terms of inter-storey heights and horizontal span between vertical elements (bearing walls, columns in case of r.c. structures). Therefore, typologies concerning cultural heritage (religious buildings, churches, historic palaces, towers, etc.), special structures (theatres, industrial sheds, shopping centres, etc.) and strategic buildings (hospitals, schools, barracks, prefectures, civil protection headquarters, etc.), whose features are not those of ordinary buildings, are not included in this characterisation.
For each municipality investigated, the Research Unit of ReLUIS Consortium performs a guided interview, through an ad hoc form (called CARTIS form) to one or two experts, belonging to local public administrations (Region, Province, Municipality, Mountain Community) and/or to the private sector (Civil Engineering, Architecture), having long and consolidated professional experience in the area under examination.
The compilation of the form must follow a path in which the information is acquired by the investigator with a critical approach, making use of the information obtained through “interviews”. The investigator should carry out one or more on-site inspections to have a first idea of the area under examination and to find out evidence of the information preliminarily acquired, starting from the geographical definition of the Sectors in which the municipal area is being split up and the characteristics assumed for them. At least one of the surveys should be conducted jointly with the interviewees so that any inconsistencies could be immediately solved.
An ad hoc CARTIS Web Application interface has been developed to allow the input into the database of the Sector boundaries and of all the data of the form.
Figure 1 shows a flowchart illustrating the data collection by CARTIS methodology. Once the municipality has been defined, the first step is the preliminary analyses of the territory, with the aim of critically validating the information subsequently collected, considering historical, bibliographic and documentary sources. Subsequently, the local expert is interviewed and, through the compilation of the form, the sectors and the main typologies are defined. The data collected are digitized and saved in a database, through a specific web application. The data entered are validated periodically, through an expert analysis aimed at identifying and resolving inconsistencies. The database can be queried, through SQL language, to extract the distributions of the different structural-typological characteristics or their combinations by sector, municipality, province, region or geographical area. The extracted data can support exposure and vulnerability analyses for seismic risk assessments at local and national level.
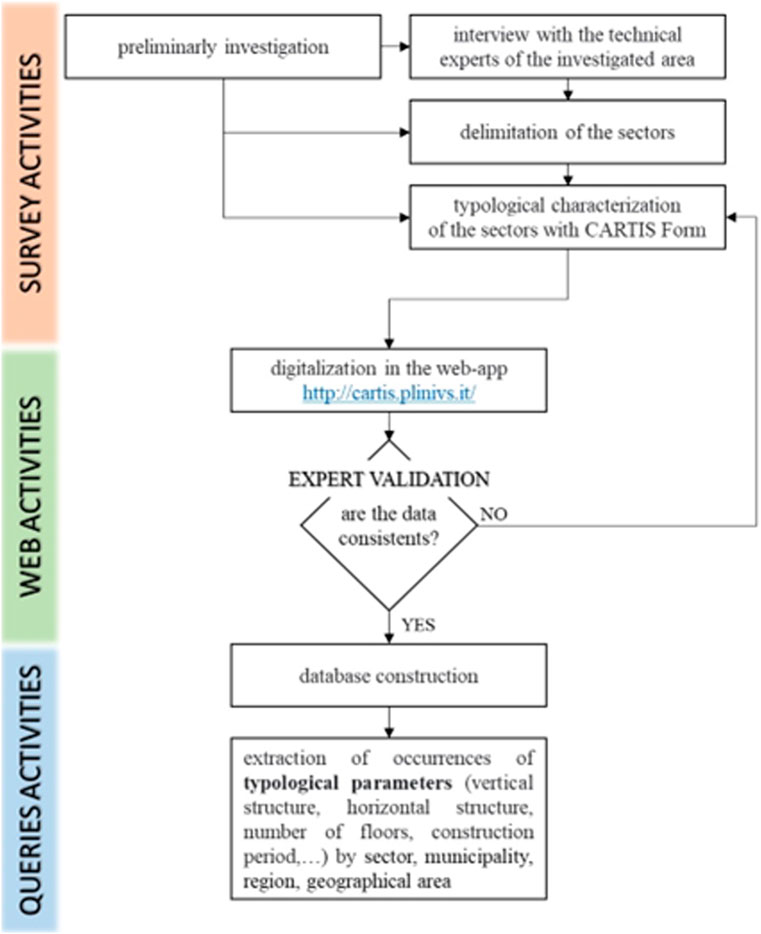
FIGURE 1. Flowchart illustrating the data collection by CARTIS methodology.
The CARTIS form contains the main parameters used in seismic vulnerability (Zuccaro and Cacace, 2015; Chieffo and Formisano, 2019; Polese et al., 2019; Chieffo and Formisano, 2020; Vettore et al., 2020; Brando et al., 2021; Faggiano et al., 2021; Menichini et al., 2022; Zucconi et al., 2022; Perelli et al., 2023). It collects the same information included in international inventory databases, such as the one used in GEM (Crowley et al., 2013), like vertical structures typology, number of storeys, height, slope of ground, year of retrofit, use, position in the aggregate, regularity in plan and in elevation, infill panels typology, horizontal structures, roofs. In addition, CARTIS form (CARTIS form, 2017) includes more detailed information such as masonry vaults, presence of tie rods/tie beams, average wall thickness, distance of walls, dimension of columns and beams, stairs typology and further vulnerability elements (lack of bonds between orthogonal walls, presence of ties beams that weigh on part of double-wythe walls, presence of lintels with low flexural stiffness or with inadequate supporting length, etc.). For details, see Section 2.2.
2.1 Delimitation of urban sectors
The CARTIS form aims to make the typological-structural characterisation of specific urban areas, called “Sectors”, resulting from a careful parting of the total municipal surface. Sectors can be defined as homogeneous areas characterised by the presence of buildings with similar typological-structure and/or age of construction (Figure 2) and taking into account, where possible, the perimeters of the ISTAT census section. The preliminary phase of the CARTIS activity involves the recognition of the homogeneous Sectors, which will be appropriately sketched on a map attached to the form and progressively numbered.
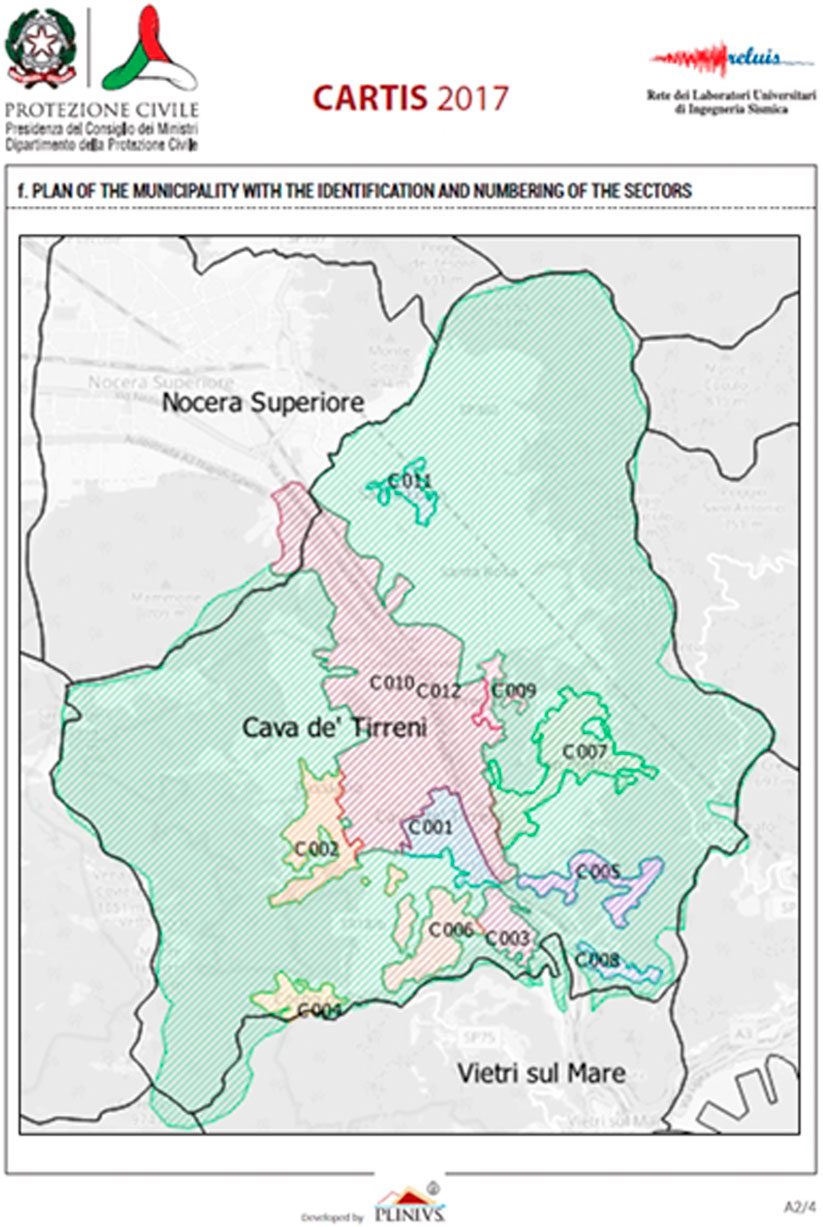
FIGURE 2. CARTIS form. Example of delimitation and numbering of the Sectors in the municipality of Cava de’ Tirreni.
The subdivision of the municipal territory under examination should be tackled considering information sources such as historical, bibliographic, and documentary, which make it possible to define the various construction phases of the urban settlement, and implicitly draw indications for the definitive Sectors’ partition. A further useful tool is the consultation of aerial and satellite photos, also using the most modern tools made available through the web. The chronological development of each urban area allows to understand if these have been realised before or after the seismic classification of the municipality, which potentially affects the seismic vulnerability of the building settlement. Bibliographic, documentary, cartographic and cadastral sources can be added in the notes on the last page of the CARTIS form.
2.2 Sections of the form
The CARTIS form (CARTIS form, 2017) and the relative user’s manual (CARTIS Manual, 2021) are based on the long experience developed over the past years on the post-earthquake damage and/or usability checks carried out with the Italian form AeDES (Baggio et al., 2017). Although differently purposed, the CARTIS form is coherent, both in terminology and in taxonomic definitions, with the AeDES form, both being official survey tools of the ICPD.
The CARTIS form is divided into four sections (from 0 to 3).
Section 0 comprises two parts, A and B. Part A is dedicated to the general characteristics of the Municipality, and the identity details of the ReLUIS Research unit and the interviewees. In particular, it collects information such as location of the Municipality, number of residents and number of buildings, along with the total number of Sectors identified. This latter depends on the extent of the built-up area and on the homogeneity of the building fabric, as resulting from the chronological evolution of the Municipality. The Sectors and their numbering are sketched in a map of the Municipality. The user’s manual provides specific criteria for Sectors numbering and additional useful hints to support the investigator in their identification. Part B contains some general features of each Sector in which the municipality has been divided. For each of them, information such as age of first urban settlement in the sector, number of buildings and dwellings are required, together with the main typologies found in the Sector (up to 4 masonry types and 4 reinforced concrete types) (Figure 3).
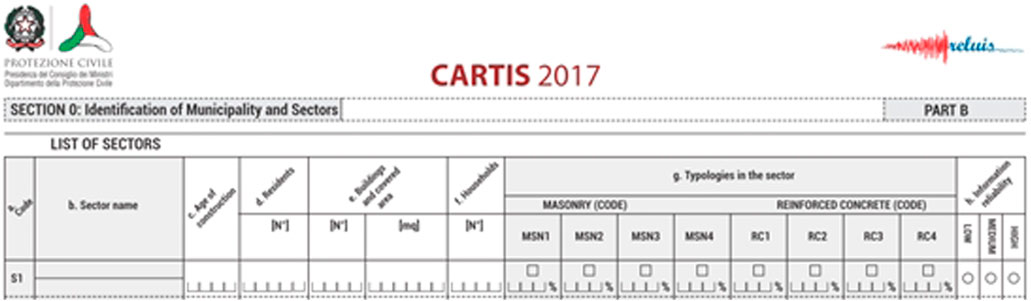
FIGURE 3. Section 0, Part B. Information on Sectors of the surveyed Municipality.
The identification of the prevalent typologies in each Sector is then carried out with reference to the specific fields, in Sections 2, 3, considered fundamental in the characterization of a different seismic behaviour: the total number of floors; the age of the construction; characteristics of the masonry; characteristics of the slabs; characteristics of the vaults; characteristics of the mixed structures; qualification and quantification of the reinforced concrete structure; presence of separation joints; presence of frames in one direction only; presence of infills on the floor; characteristics of the roof; frequency structural interventions in the typology.
Section 1 is dedicated to the identification of each typology characterising the generic Sector of the Municipality and, similarly to Sections 2, 3, must be filled in for each typology. It collects information such as the typology and the identification code in the Sector, its position in the urban context (Figure 4), together with a picture and sketches of the typology in plan and section, representing some peculiar geometrical features of the structure under investigation.
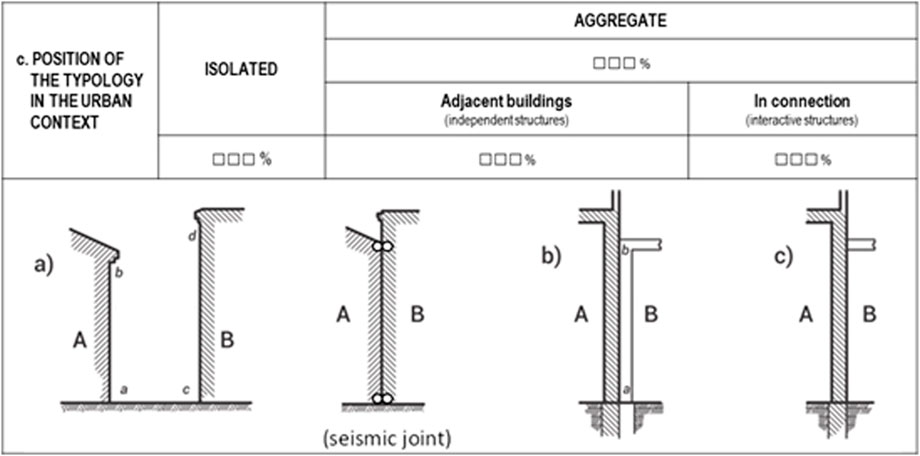
FIGURE 4. Position in the urban context: (A) isolated; (B) adjacently (statically independent); (C) in connection (interacting structures).
Section 2 is dedicated to the identification of the general characteristics of the typologies under examination. It must be completed for each typology of the generic Sector of the Municipality. Section 2 collects information relevant to at least 80% of the buildings of the typology under examination. Information collected are relevant to the geometry as well as to some metric information (number of storeys; average floor height; ground floor average height; underground floors; average floor area) together with age of construction and main use, described by different possible ranges. For the construction period it is possible to provide a second range of dates, that is associated with significant structural interventions undergone in the past. This information is very important, as it can be compared with the period of seismic classification of the municipality, in order to judge if the typology under examination was built or strengthened in compliance with seismic codes.
Section 3 is dedicated to the characterisation of the structural elements of the typology under examination (Figure 5). It must be completed for each typology of the generic Sector in which the assigned Municipality is being split. The Section is divided in three parts: 3.1A, 3.1B and 3.2. Sections 3.1A and 3.1B are alternatives to each other, while Section 3.2 must always be completed.
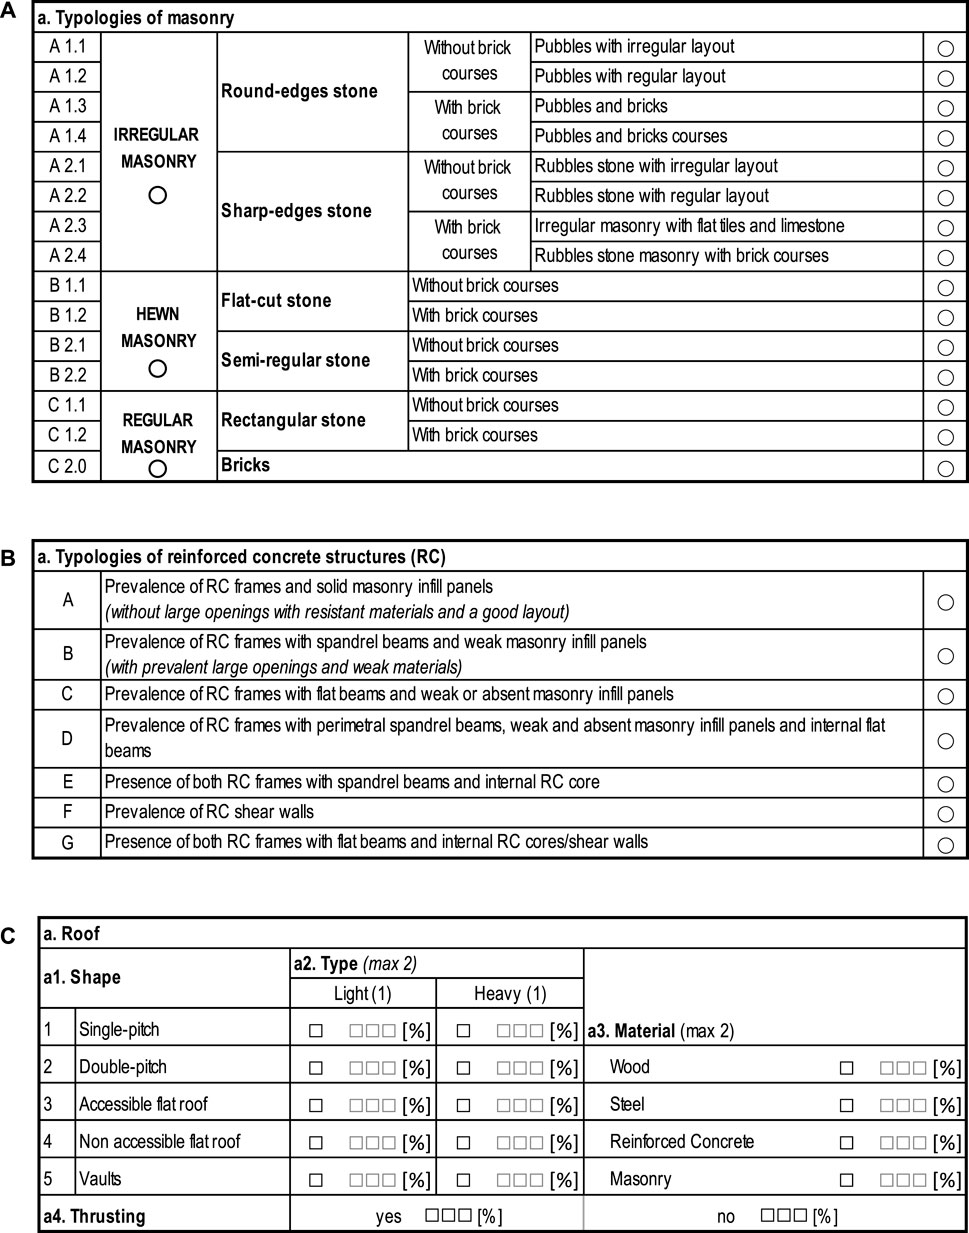
FIGURE 5. Sections for Typologies of Masonry (A), Typologies of reinforced concrete structures (B) and Roof (C) in the CARTIS form.
In particular, Section 3.1A relates to masonry and mixed structures (Figure 5A) described through the type of vertical and horizontal structure. The vertical structure is classified according to information on the type of masonry and further characteristics qualifying the connection through the wall thickness and the presence of strengthening devices (e.g., tie roads, ring beams or buttresses). Masonry fabric is classified on the basis of its regularity, coherently with the AeDES form (Baggio et al., 2017), according to three macro classes (“irregular”, “hewn stone” and “regular” masonry), then in relation to their layout according to 6 possible masonry types ranging from the worst to the best (A1, A2, B1, B2, C1, C2).
The Section also collects data concerning the type of horizontal structures, including flat floors ranked in relation to their in-plan deformability (flexible, semi-rigid or rigid slab), coherently with the AeDES form, and vaulted structures chosen among 8 possible alternatives. Mixed structures, considered as a combination of masonry and r.c. elements according to three possible combinations defined by the AeDES form, are described in a separate sub-section. Finally, the presence of further elements of vulnerability must be identified, selecting them in a list of common vulnerable characteristics (presence of openings at ground storeys, isolated columns and so on.
Section 3.1B relates to the types of reinforced concrete buildings (Figure 5B). It collects information for the identification of the vertical structure, according to 7 possible structural types (ranging from A to G) and defined based on elements such as frames, infill, beams and nuclei or r.c. walls. Further information are then collected concerning the presence of structural joints, bow windows and direction of frames.
Section 3.2 relates to further information (Figure 5C) necessary for both masonry and r.c. types. It collects information concerning the roof structure, openings layout, structural regularity, previous structural interventions, type of stairs, and some others including vulnerability of non-structural element and characteristics of the foundations.
3 Summary of data collected in the CARTIS DB
Until 31 December 2022, more than 30 research units from the ReLUIS network have data collected data through the compilation of the CARTIS form in country-wide distributed Municipalities (Figure 6). To make the sample representative, municipalities were appropriately chosen considering the percentage distribution of the Italian municipalities grouped by Italian Census (ISTAT 2011) by regions and geographical area. The surveyed forms are collected in the client-web application on purpose developed (CARTIS Web Application). Authorised users can query the CARTIS DB, through the Structured Query Language (SQL), after download, or through simplified queries available in the application.
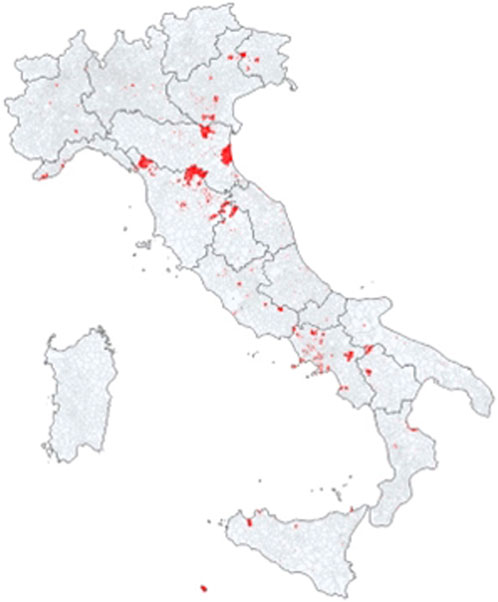
FIGURE 6. Geographical distribution of the Municipalities surveyed with CARTIS methodology.
The CARTIS DB is constantly increasing and, to date, 421 Municipalities, 2,307 Sectors, including a total of 734,641 buildings, have been surveyed. The completeness of the information collected has been measured by comparing CARTIS DB and ISTAT census dataset (ISTAT, 2011), for each Italian Region and according to the following geographical areas: 1) Northwest: Piemonte, Valle d’Aosta, Lombardia and Liguria; 2) Northeast: Trentino Alto Adige, Veneto, Friuli-Venezia Giulia and Emilia Romagna; 3) Centre: Toscana, Umbria, Marche and Lazio; 4) South: Abruzzo, Molise, Campania, Puglia, Basilicata, and Calabria; 5) Islands: Sicilia and Sardegna.
According to Table 1, over a total of 8,092 Italian municipalities, those analysed through CARTIS form are about 5% (421). The Regions with the highest percentage of municipalities investigated are Toscana (21.9%), Campania (13.6%) and Abruzzo (10.8%). The most investigated geographical areas are Centre (10.1%) and South (10.4%). Further municipalities are required, especially for some Regions with a high seismic hazard, such as Friuli Venezia Giulia, and for the Northwest area. In terms of seismic classification, both the total Italian municipalities and the only ones surveyed in CARTIS activities have been grouped on the base of the seismic zone (Table 2), in function of the highest expected acceleration.
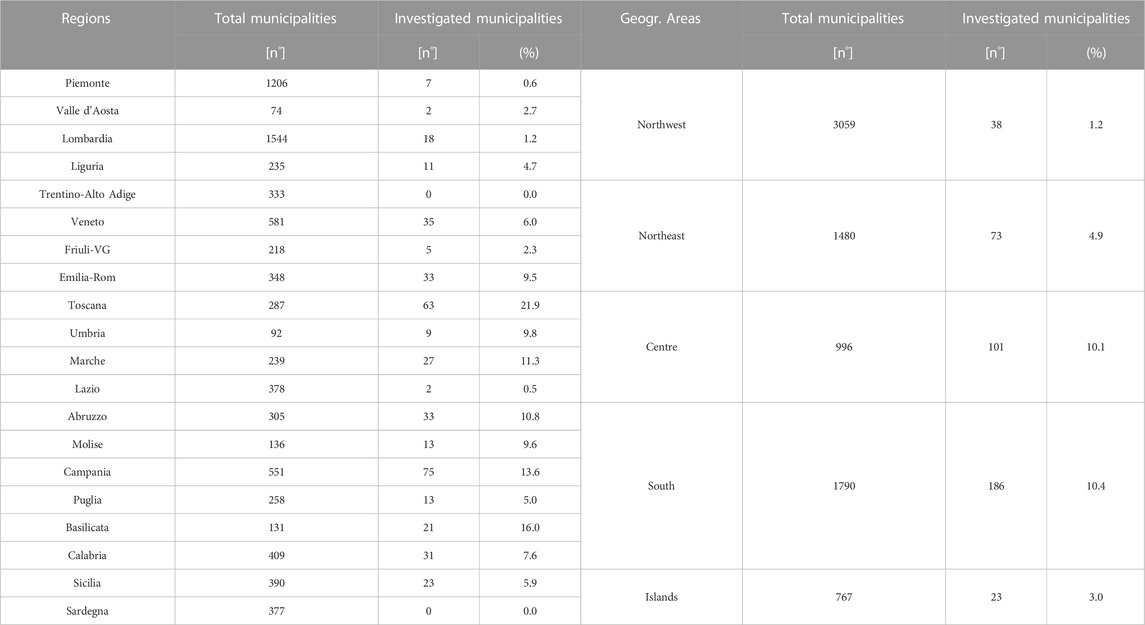
TABLE 1. Distribution of Municipalities analysed per Region and geographical area.
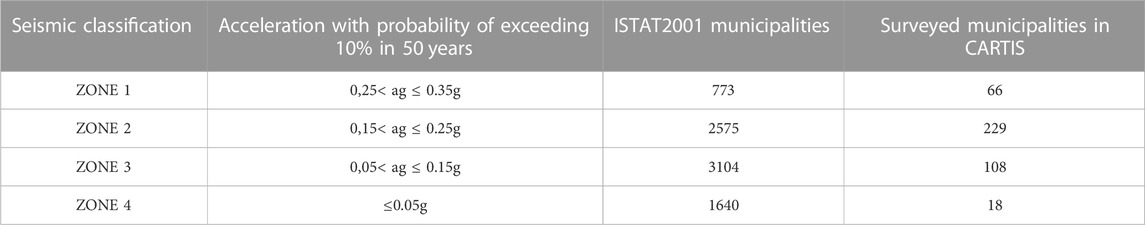
TABLE 2. Distribution of Municipalities analysed per seismic zones.
For those Regions or geographical areas with a good percentage of analysis (e.g., greater than 5%), the CARTIS DB can provide more interesting information if compared to the census data (ISTAT 2001). The validation of the CARTIS data with the data reported on the census sections was carried out with reference to the ISTAT 2001 database which, although dated and superseded by ISTAT 2011, presents more disaggregated information with respect to some relevant parameters (for example, the number of floors). Furthermore, the last 20 years cannot be considered significant for the expansion of residential construction in Italy, therefore the ISTAT 2001 data can still be considered reliable today; in fact, the data reported in the most updated ISTAT (2011) claim that less than the 3% of Italian building stock has been built after the year 2001.
The main comparison with the ISTAT2001 data concerned the distribution of vertical macro-typologies by region and geographical area: in Figure 7 this distribution is represented in the ISTAT2001 data with reference only to the municipalities surveyed in CARTIS, and the same distribution obtained from the CARTIS data. According to the ISTAT census dataset, structural typologies are defined on the basis of three features: construction material (reinforced concrete, masonry and “other”), number of stories and construction age. “Other” constructions include several types of structures, such as timber, steel, and mixed structures (mainly this last). Furthermore, the mixed structures are included in “masonry typologies” in the CARTIS DB, so it could be considered that the sum of “masonry” and “other” in ISTAT2001 should be comparable to the “masonry” in CARTIS DB. The distribution of the macro-typologies for geographical area according to the two databases are very close. Some ineffective correspondences are found for some regions such as Valle d'Aosta, Lombardia and Basilicata.
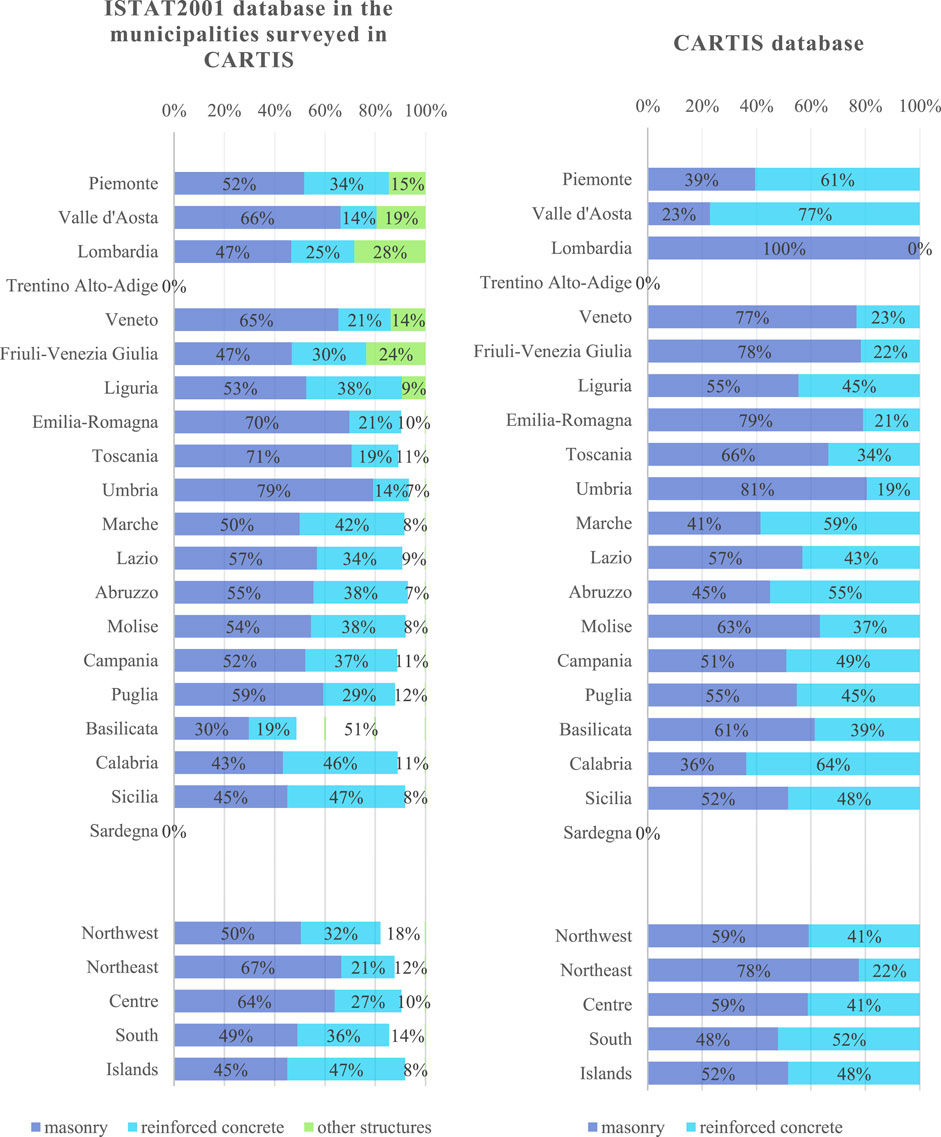
FIGURE 7. Buildings distribution on the vertical macro-typologies according to ISTAT census dataset (left) and CARTIS DB (right), per region and geographical area.
The CARTIS DB can provide the distribution, per region and geographical area, of the vertical structural buildings relevant to masonry (Figure 8) and to reinforced concrete (Figure 9). In fact, from the percentage distribution of each typology it is also possible estimate the number of buildings pertaining to each structural sub-type, as defined in the CARTIS form. In order to provide information on the completeness of the data, the diagrams have been accompanied by additional histograms on the right representing the percentage of masonry and of reinforced concrete buildings surveyed in CARTIS DB, with reference to the number of masonry and of reinforced concrete buildings reported in the ISTAT census dataset.
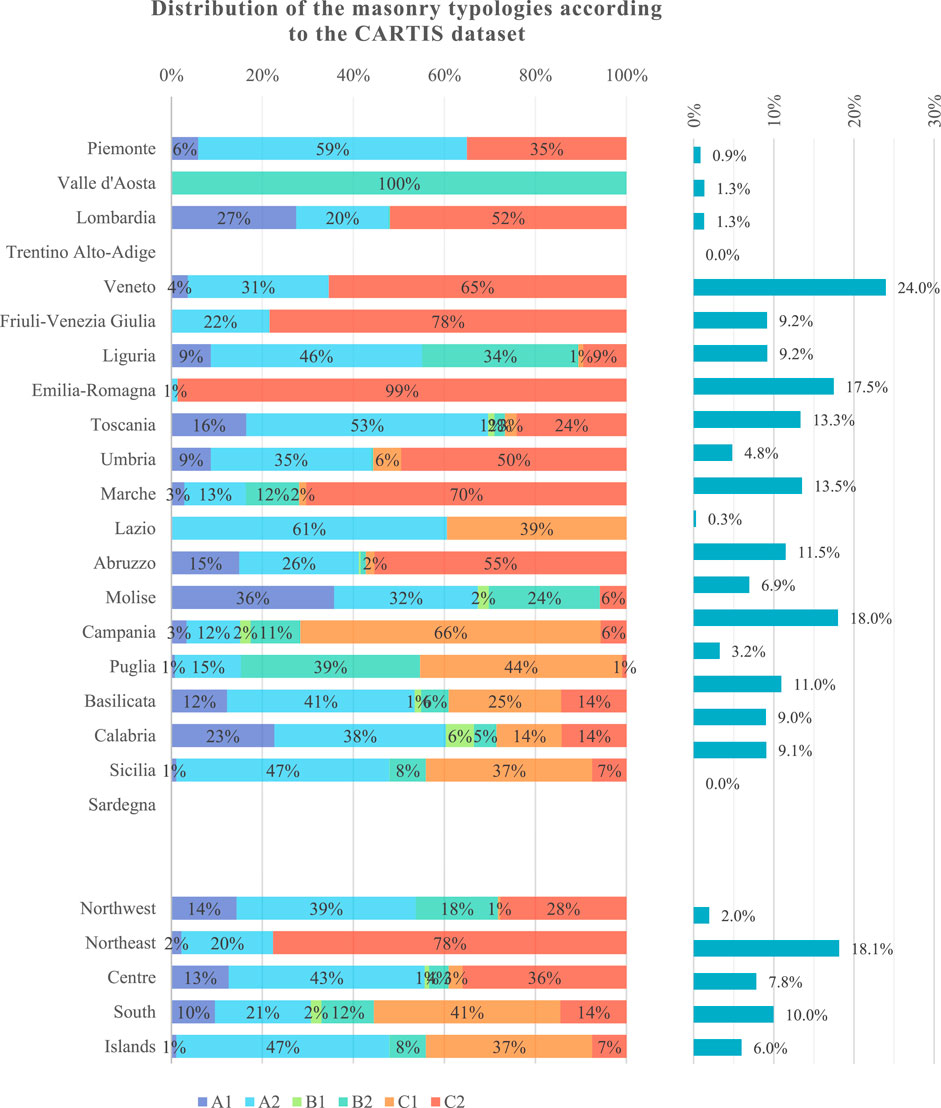
FIGURE 8. Buildings distribution on the masonry typologies. A1—Irregular masonry: round-edges stone; A2—Irregular masonry: sharp-edges stone; B1—Hewn masonry: flat-cut stone; B2—Hewn masonry: semi-regular stone; C1—Regular masonry: rectangular stone; C2—Regular masonry—bricks.
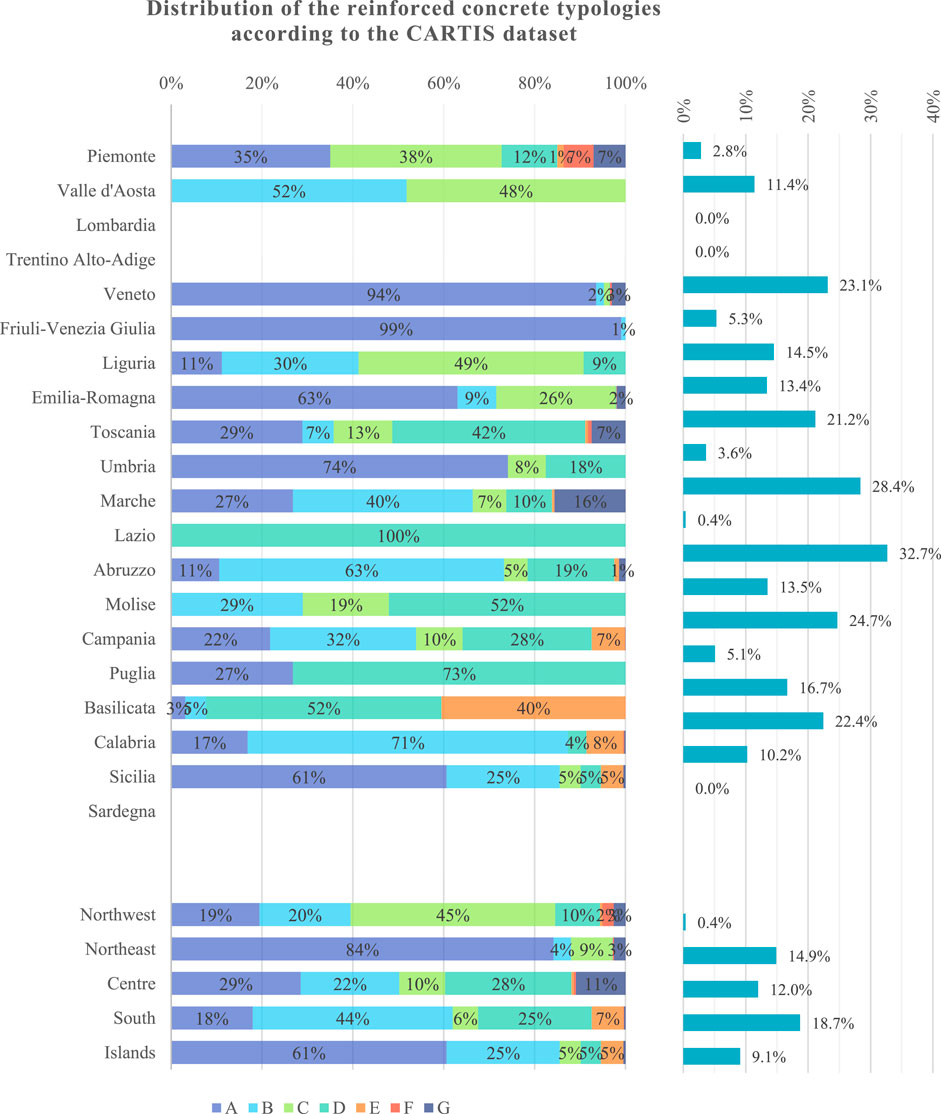
FIGURE 9. Buildings distribution on the reinforced concete typologies. A—Prevalence of RC frames and solid masonry infill panels; B—Prevalence of RC frames with spandrel beams and weak masonry infill panels; C—Prevalence of RC frames with flat beams and weak or absent masonry infill panels; D—Prevalence of RC frames with perimetral spandrel beams, weak or absent masonry infill panels and internal flat beams; E—Presence of both RC frames with spandrel beams and internal RC core; F—Prevalence of RC shear walls; G—prevalence of both RC frames with flat beams and internal RC cores/shear walls.
For masonry buildings, six vertical typologies are considered, like shown in the histogram of Figure 8, ranging from A1 to C2: A1—Irregular masonry: round-edges stone; A2—Irregular masonry: sharp-edges stone; B1—Hewn masonry: flat-cut stone; B2—Hewn masonry: semi-regular stone; C1—Regular masonry: rectangular stone; C2—Regular masonry—bricks. Considering the resulting distributions obtained per geographical area and per region, some considerations can be drawn.
- The Northeast area is mainly built of good quality of the masonry fabric (Bricks 78%), while in the Northwest area poor quality masonry prevails (Round edges stone 14%, Sharp edges stone 39%);
- The Centre area is mainly built of sharp edges stone (43%), and bricks (36%);
- All classes of masonry are present in the South and in the Islands, with a slight prevalence of semi-regular stones (41% in South and 37% in Islands) compared to the sharp edges stone (21% in South and 47% in Islands).
However, the distributions per regions show marked difference from one Region to another, underlining the importance of a local characterization of constructive techniques. To make an example, Marche, Friuli-Venezia Giulia and Emilia-Romagna are rather homogenous with a single structural type (brick). Similarly, Puglia is almost totally made of regular stones. Other Regions can show differentiated masonry fabrics according to available constructive materials and local craftmanship.
With regard to reinforced concrete structures, the 7 types of structures are considered as resulting in Section 3.1.B of the CARTIS form, ranging from type A to type G. Similarly to masonry structures, the histograms on the right show the percentage of R.C. structures of the CARTIS DB compared to ISTAT census dataset (Figure 9). The data concerning reinforced concrete structures shows that.
- Almost the entire Italian territory shows a prevalence of simply framed reinforced concrete structures (type A), with particular reference to Northeast, Northwest and Island (73%, 88% and 99%).
- South and Centre are rather characterised by type B (spandrel beams and weak infills, 64%) and D (perimetric spandrel beams and internal flat beams, 31%) respectively;
- In the South area and in the Islands, there are no shear wall structures and there is a low percentage of structures with reinforced concrete cores.
At Regional scale one can note that while in regions such as Lombardia, Veneto, Friuli, Umbria, Puglia and Sicilia the simple-frame typology (A) is the only or prevalent structure, in the rest of Italy the situation is more diversified. Type C (Flat beams and weak masonry infills) are significantly present in Piemonte (38%) and Liguria (49%). Type D (perimetric spandrel beams with internal flat beams) are massively present in Toscana (42%), Lazio (100%), Molise (52%), Puglia (73%) and Basilicata (52%). It should be noted that the sample of buildings surveyed in the Lazio region consists of 0.3% of the buildings in the region, therefore it cannot be considered representative.
Figures 10, 11, show the masonry buildings distributions versus the age of construction and the number of floors, respectively. With Similar contents, Figures 13, 14 are related to reinforced concrete buildings. The histograms representing the periods of construction are flanked by another histogram which highlights the clear gap between the buildings prior to and after 1980, the year in which the anti-seismic legislation came into force. The histogram representing the distribution of buildings on the number of floors is also accompanied by a more synthetic histogram, which indicates low-rise (1-2 floors), medium-sized (3-4-5 floors) and high-rise buildings (>5 floors).
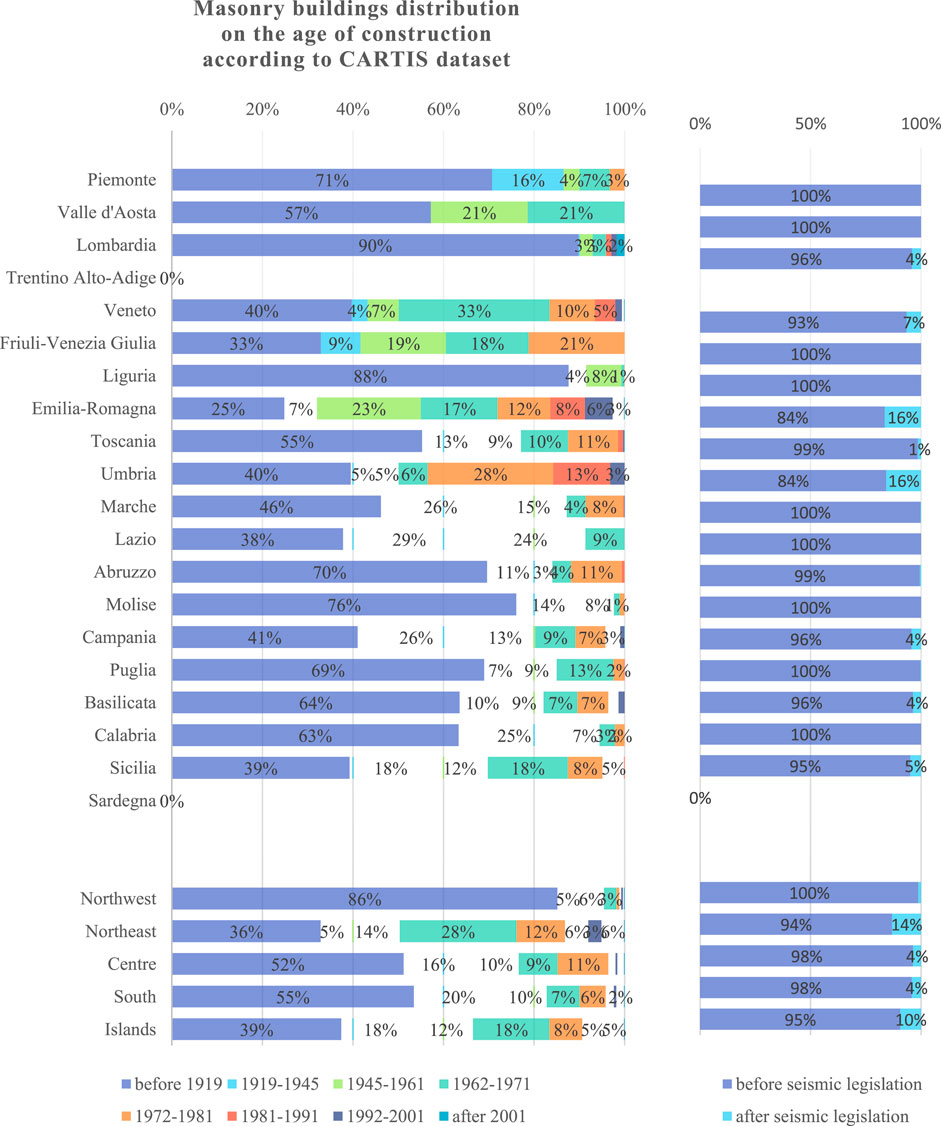
FIGURE 10. Masonry buildings distribution on the age of construction.
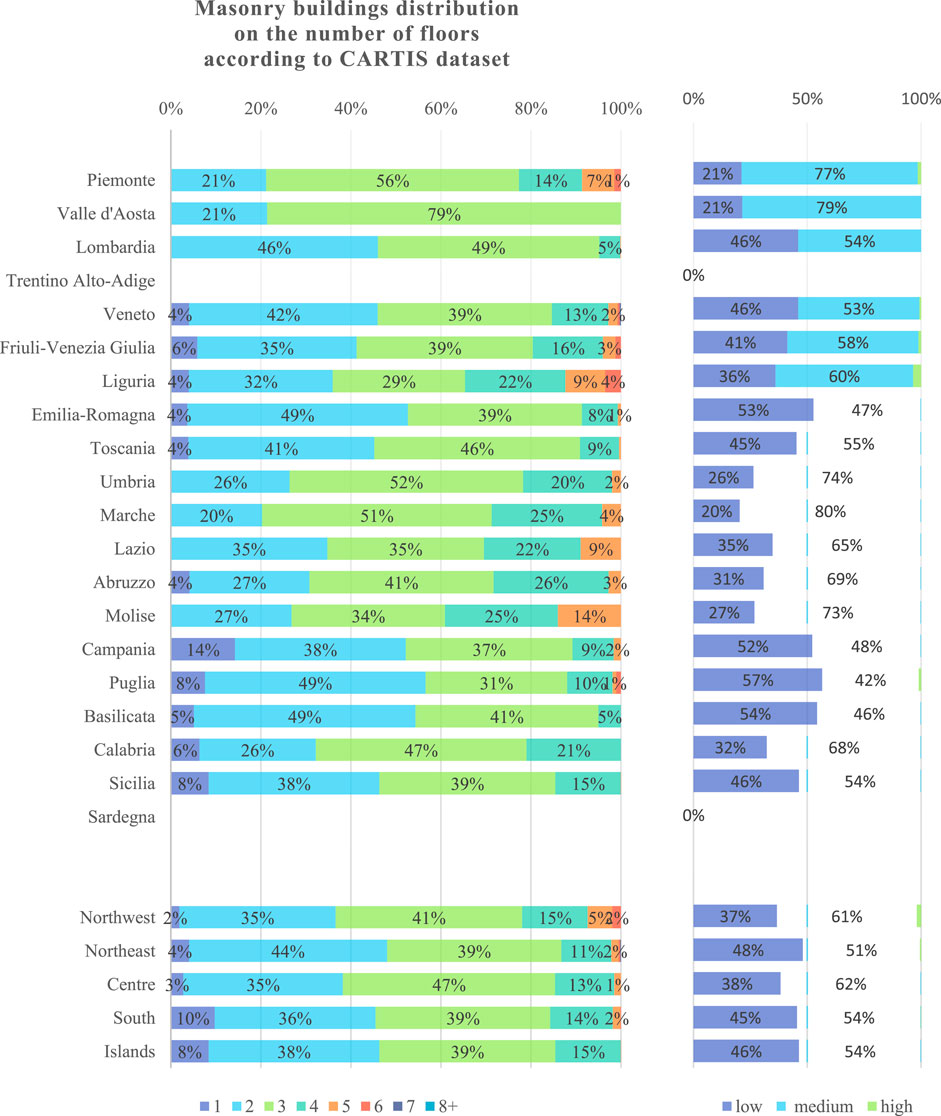
FIGURE 11. Masonry buildings distribution on the number of floors.
As expected, the age of construction relevant to reinforced concrete typologies shifts to more recent periods compared to that of the masonry buildings, whose construction period mostly dates back to periods before 1919. Conversely, buildings realized after 1981, i.e., after the first important seismic classification of the Country, on an average amount to 25% according to the CARTIS surveys.
In terms of geographical and regional distribution, it can be noted that almost all masonry buildings in Italy have been built before 1980 (Figure 10). Some significant recent masonry can be found in Emilia-Romagna (16%) and Umbria (16%). The oldest regions with masonry structures built before the 1919 are in North of Italy: Piemonte (71%), Lombardia (90%), Liguria (88%) and Molise (76%).
Figure 11 shows that there are no masonry buildings with 7 or 8 floors. Some masonry buildings with six floors can be found in the Northwest only (2%), in particular in Piemonte (1%) and Liguria (4%). Even buildings with 5 floors are infrequent: the occurrence can be considered significant only in the Molise region (14%). In all geographical areas, the distribution of buildings on low or medium typologies is on average uniform, with a slight prevalence for medium height.
It can be also observed that masonry constructions of 2-3 stories are the most frequent throughout the Italian territory, with relevant percentages higher than 70% (Northwest 76%, Northeast 83%, Centre 82%, South 75%, Islands 77%).
In Figure 12 is reported the masonry buildings distribution on the horizontal typologies. With regard to the geographical area, it can be noticed that the Northwest and Centre have prevalence of deformable horizontal typologies (47%) with respect to the other ones. The Northeast has a high prevalence of rigid typologies (72%). To be more specific, more than half of the surveyed structures have a type of deformable horizontal typologies in Lombardia (57%), Friuli Venezia-Giulia (55%) and Marche (54%). Rigid typologies are prevalent in Veneto (75%), Emilia Romagna (73%) and Umbria (55%). The structures in Valle d’Aosta region are mainly built with vaulted ceilings (53%).
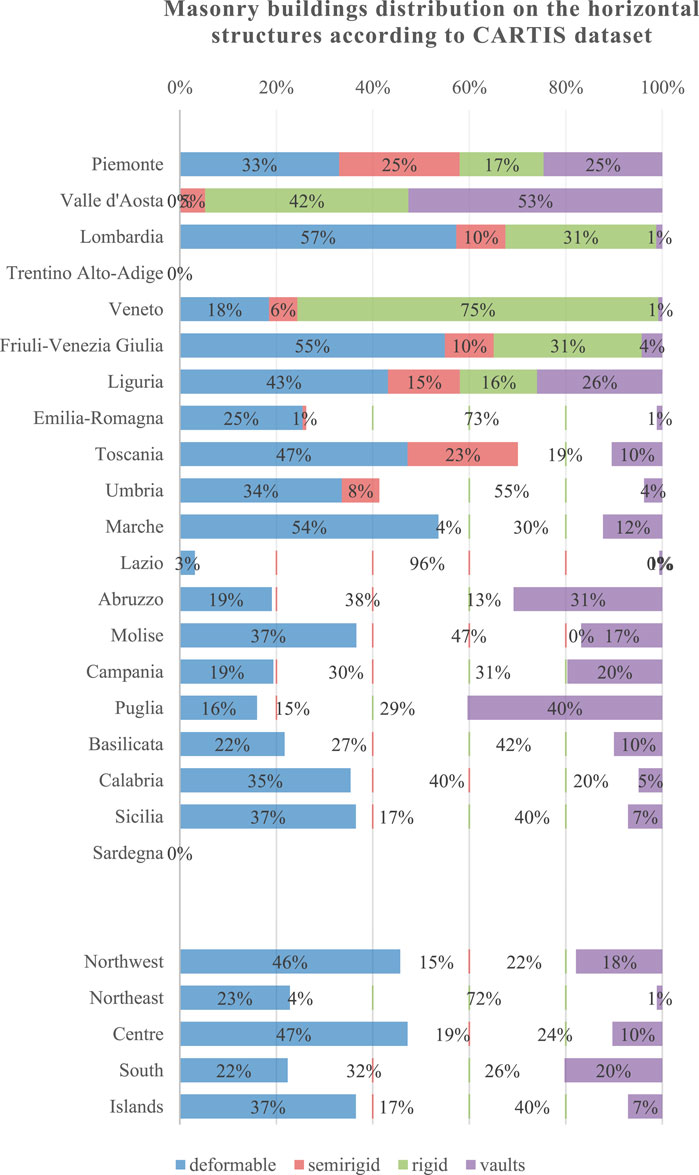
FIGURE 12. Masonry buildings distribution on the horizontal structures.
Figure 13 shows the distribution of the age of construction for R.C. buildings. In terms of geographical area, the oldest r.c. can be found in the northwest of Italy and the younger in the northeast and Islands. In fact, the percentage of r.c. typologies built before the seismic classification of the Country amount to 64% for the Northwest, 32% for the Northeast, 59% for the Centre, 47% for the South and 36% for the Islands. A significant sample of R.C. buildings has been built after 2001 in all Italian regions.
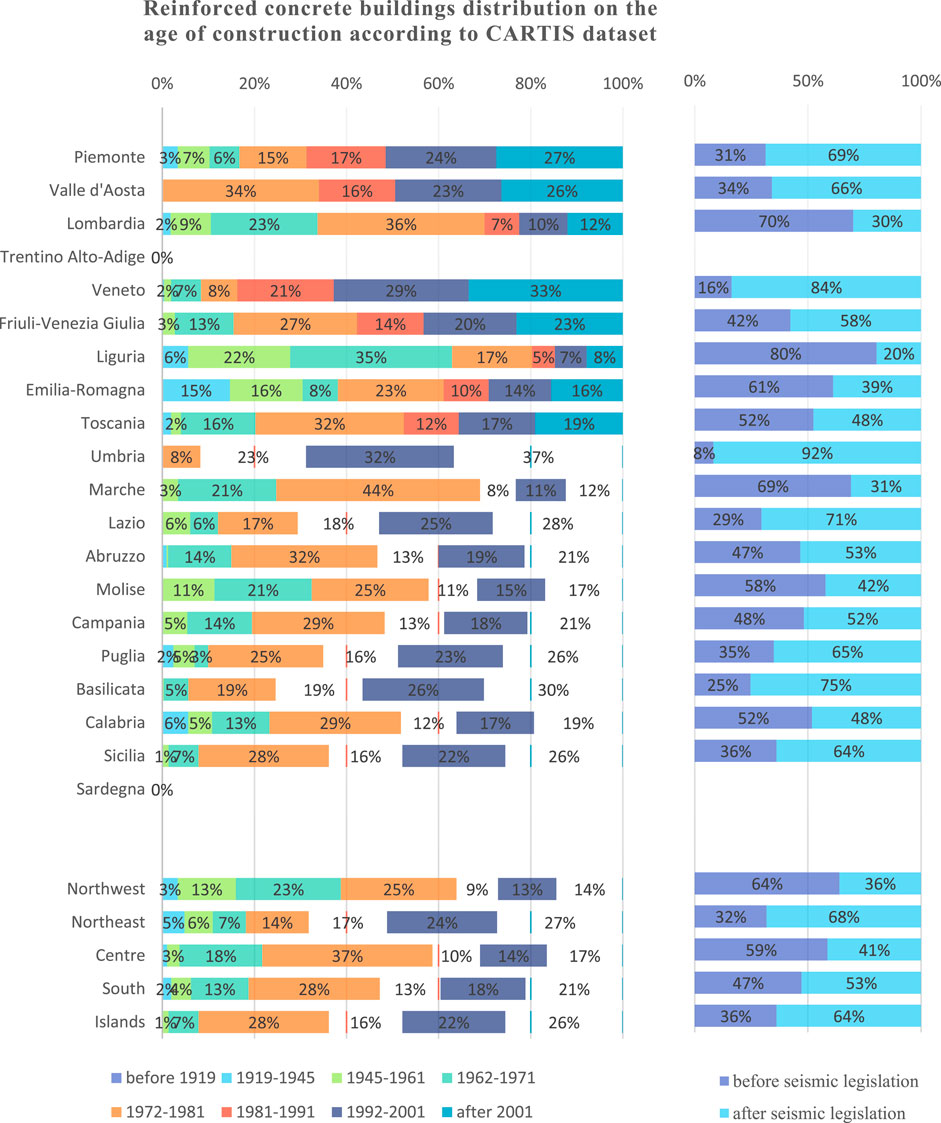
FIGURE 13. Reinforced concrete buildings distribution on the age of construction.
In terms of storey number distribution, Figure 14 shows that R.C. typologies with 2-3 storeys are the most common. In fact they represent the most recurrent percentage in all geographical area: 76% in Northwest, 83% in Northeast, 82% in Centre, 75% in South and 77% in Islands. A significant sample of buildings having more than four storeys can be found in Molise (14%) and Liguria (13%).
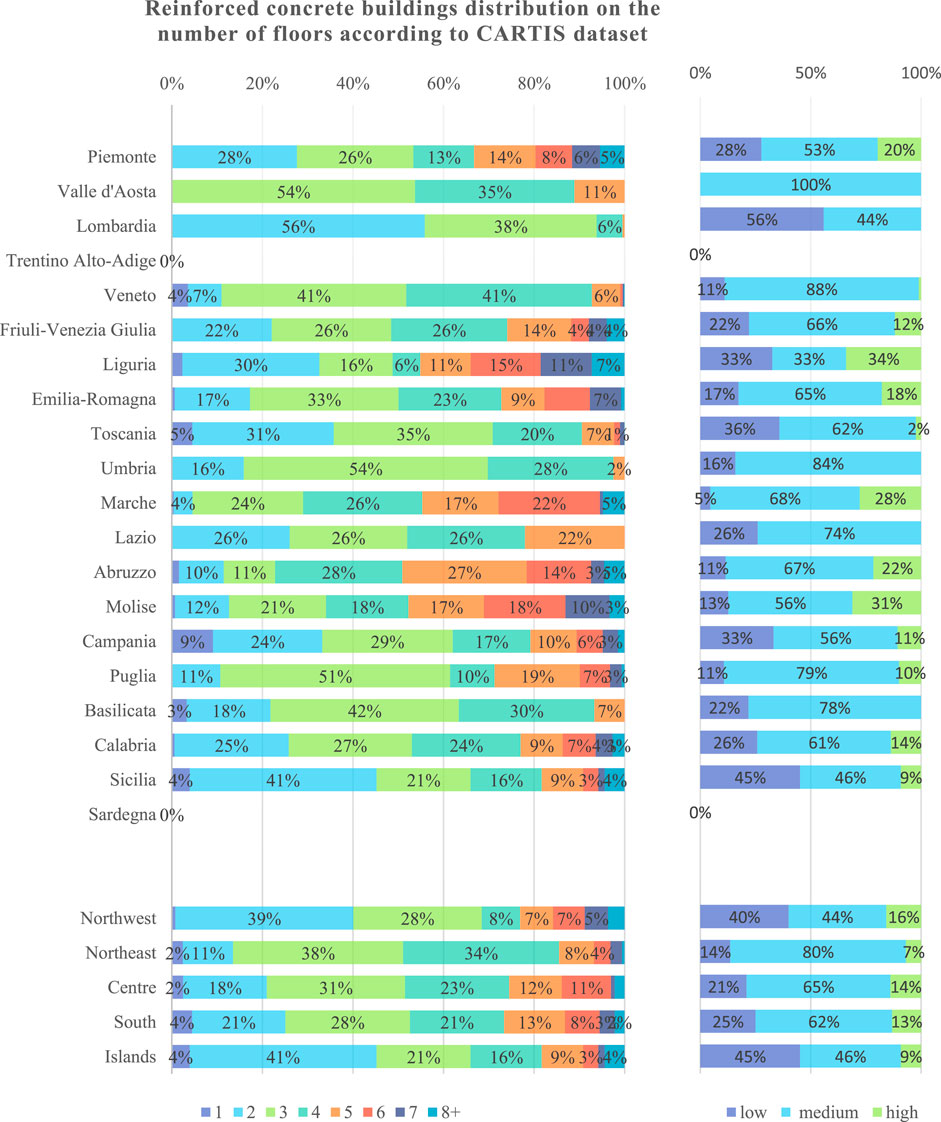
FIGURE 14. Reinforced concrete buildings distribution on the number of floors.
The CARTIS DB is constantly evolving, in fact ReLUIS Research Units (UR) are working to increase the number of municipalities investigated. Results illustrated in this paragraph, refer to the complete dataset collected by 2020. However, to improve the statistical significance of the database, some areas will have to be further analysed, especially in the Northwest and Northeast. Furthermore, an in-depth study of the typologies treated, through a sample of building-by-building surveys (CARTIS BUILDING), at present in progress, will help to better focus some further peculiarities of the typologies analysed and relevant regional/geographical distributions.
4 The case study of Cava de’ Tirreni municipality
This section illustrates an example of filling in the CARTIS form. The investigated municipality is Cava de’ Tirreni (Campania Region, Italy), which covers an area of about 36.5 km2, with a population of about 51,000 inhabitants.
The CARTIS form has been compiled by a researchers team of University of Naples Federico involved in the ReLUIS project, on the basis of an interview, divided into three different meetings of about 3 hours each, with a technician employee in the Municipality of Cava de’ Tirreni, with a solid knowledge of local building development and existing building types. With the aim to verify the consistency of the acquired information, two visits of the city have been performed. The second visits have been conducted jointly with the interviewed, to resolve the uncertainties more easily. Preliminarily to the interviews, the researchers carried out a study concerning the historical urban development of the city, to improve the critical spirit in the collection of the information and to better understand the information provided. This activity consists in the analysis of historical maps, building records and digital maps with census sections. From this activity, the researchers collected the following preliminary information.
⁃ Main periods of construction of the different municipal areas;
⁃ Number of floors, vertical type (masonry and reinforced concrete) and recent interventions of improvement or adaptation of the buildings surveyed by the building registry and related intended use;
⁃ Seismic classification of the municipality: the first seismic classification of the Cava de’ Tirreni area dates to 3 June 1981. The expected horizontal seismic acceleration (with a probability of exceeding 10% in 50 years) is in the range 0.05 g–0.15 g (3., 2003). The micro-zoning map shows a higher seismicity. Specifically, ground acceleration is never less than 0.284 g in the perimeter areas and increases considerably along the foothills (0.422 g) up to the valley floor, where acceleration values even reach a peak of 0.468 g. An acceleration of 0.422 g is expected for the historic centre (Figure 15).
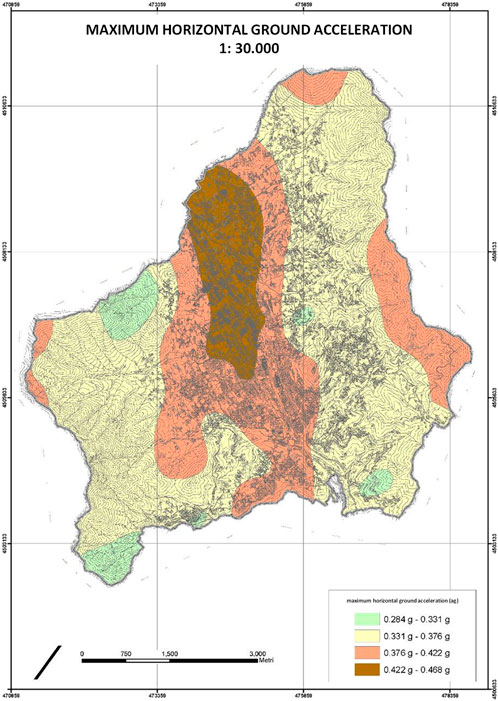
FIGURE 15. Map of maximum horizontal seismic ground acceleration in Cava de’Tirreni municipality.
Next, the researchers interviewed the local technician according two different aspects.
The first aspect concerns the definition of the perimeter of the sectors, since the homogeneity of the building fabric (by age of first installation and/or construction and structural techniques) and taking into account, where possible, the perimeters of the ISTAT census section. As shown in Figure 2, for Cava de’Tirreni municipality have been identified 12 Sectors (C01-C12). It has been carried out with the technician interviewed considering the bibliographic and documentary analyses and the study of cartographic, cadastral documentation, aerial and satellite images and building records and digital maps with census sections. The peculiarities of the Cava de ‘Tirreni municipal conditioned the identification of the sectors, since the city is historically composed of “villages”, which have retained a specific identity and have always remained distinct and clearly legible in the urban fabric. It can be observed that a sector can also be made up of two separate polygons (see the sector C12) when they identify dislocated areas that have the same building types.
The second aspect concerns the definition of the main building typologies in each sector. The information presented herein concerns the vertical and horizontal structural typologies, the age of construction and the number of stories.
Table 3 shows the distributions of the main vertical typologies identified and the total number of buildings for each Sector. The table provides a summary of Sections 1, 3 of the CARTIS form.
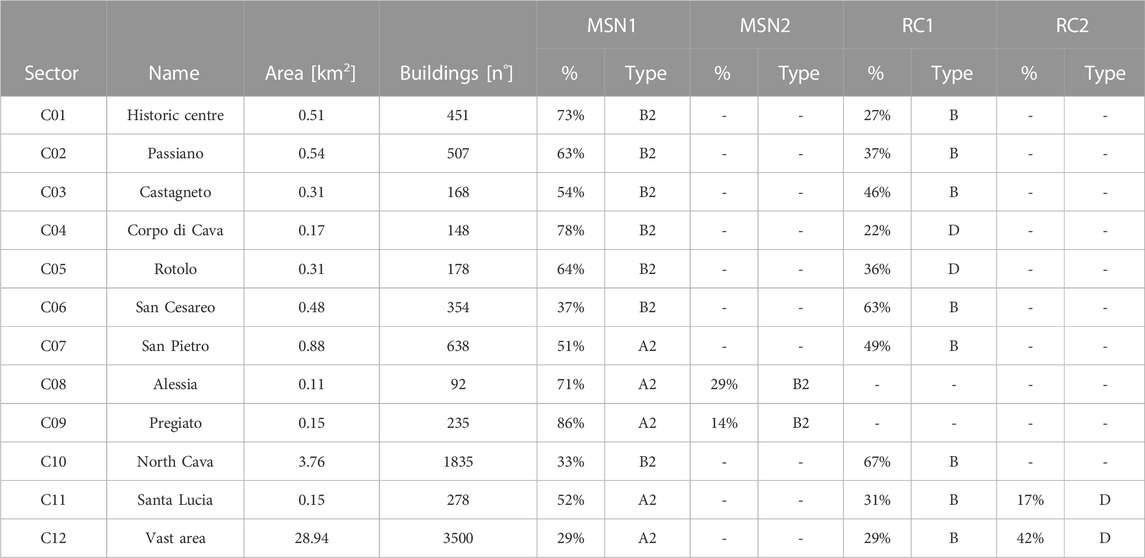
TABLE 3. Distribution of the vertical typologies related to Cava de’ Tirreni municipality.
One can note that the 12 Sectors of Cava de’ Tirreni are all characterised by 2 structural typologies, one masonry (MSN1) and one reinforced concrete (CAR1) type, except for sectors C08 and C09, both consisting of two masonry types (MSN1 and MSN2). It is worth to note that the structural typologies, although having the same acronym (e.g., MSN1) can be correspond to different characteristics, according to information collected in Section 3.
The number of buildings encompassed in each sector is extremely variable with respect to the covered surface dealt with; in any case even the smallest sectors (C08 and C11) include a number of buildings suitable for statistical elaborations.
On the basis of the information presented in Table 3, it is possible to obtain the distribution of the single vertical typologies for masonry and reinforced concrete, relative to Cava de’ Tirreni (Figure 16).
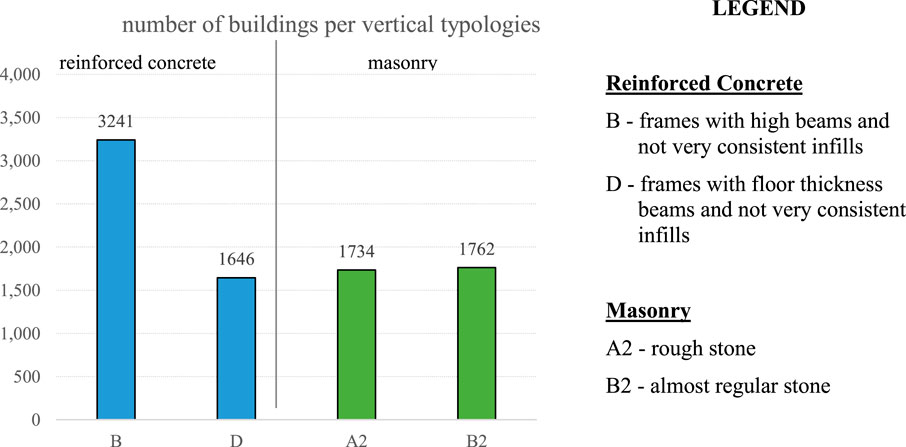
FIGURE 16. Distribution of vertical typologies (masonry and reinforced concrete) in Cava de’ Tirreni.
For masonry structures, Section 3 of the CARTIS form makes it possible to identify the percentage distribution of horizontal structure typologies relative to each vertical structure typology of each identified sector. The information relating to the horizontal type is, therefore, broken down by vertical type, as shown in Table 4.
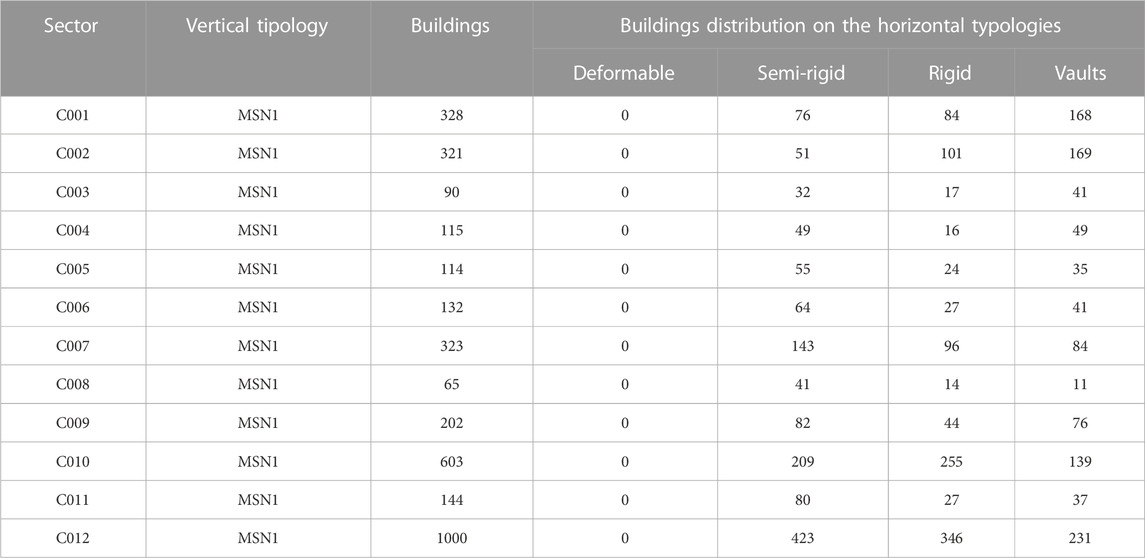
TABLE 4. Distribution on the horizontal typologies of the buildings correlated to the vertical masonry typologies of the Sectors identified in the municipality of Cava de’ Tirreni.
For reinforced concrete structures, Table 5 shows an example of the distribution of buildings on the information related to the number of stories. In particular, Section 2 of the CARTIS form requires to tick the maximum and minimum number of stories for a specific vertical typology of the Sector. The CARTIS procedure assumes that the identified category of buildings is uniformly distributed over the identified interval defined by the two storey numbers required in the form (maximum and minimum). The data analysis is similar with reference to the “construction periods”. Figure 17 shows the results of the extracted data.
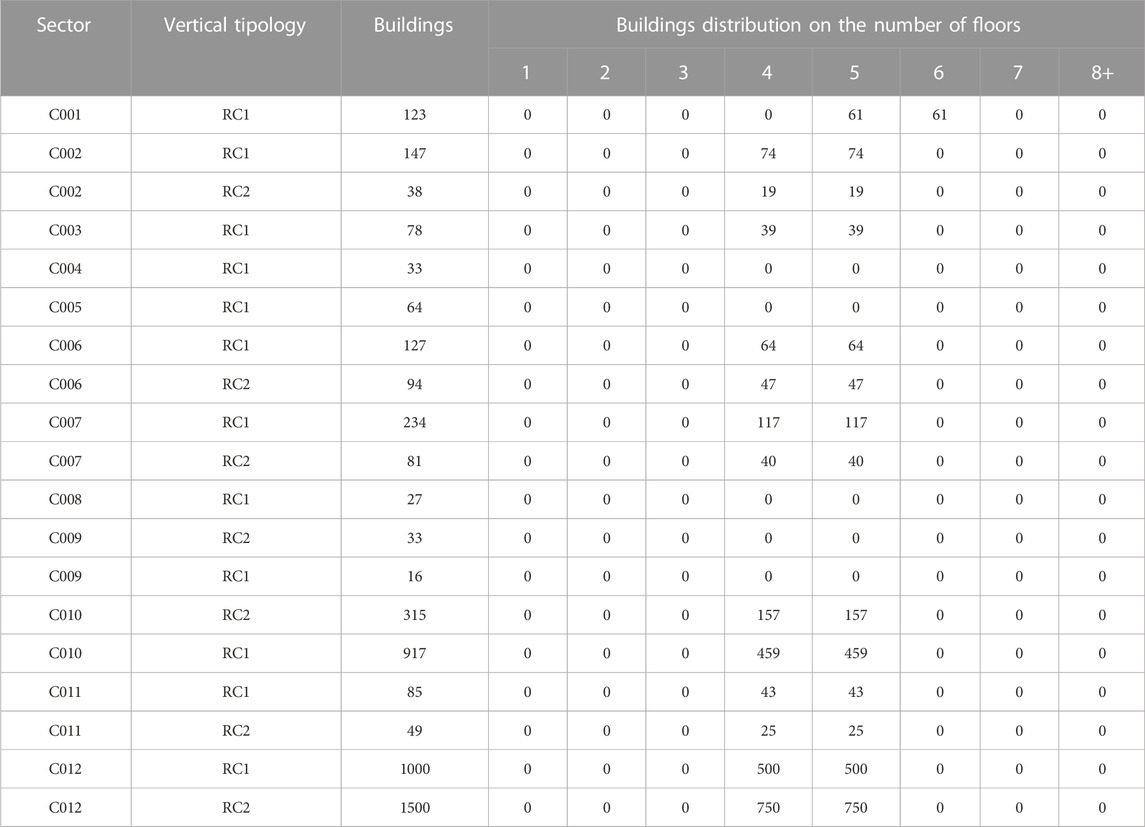
TABLE 5. Distribution on the to the number of stories correlated to the vertical typologies in reinforced concrete typologies of the Sectors identified in the municipality of Cava de’ Tirreni.
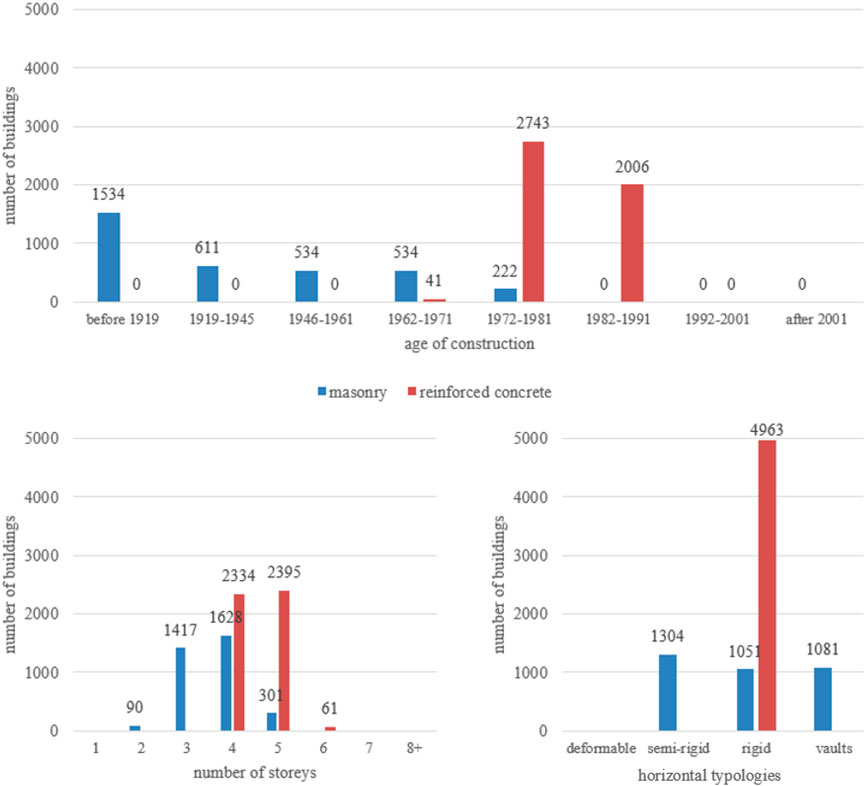
FIGURE 17. Typological characteristics extracted from the CARTIS DB for the municipality of Cava de’ Tirreni.
According to CARTIS Manual, only the information obtained through interviews and from reliable and complete sources have been reported, and not those deduced only for the final purpose to fill in the form in all its parts. The form, in fact, report only the information of which there is good “certainty”, obviously within the limits of the reliability of the interlocutor and the feedback that the researchers team have carried out. Therefore, the form has not been compiled in all its parts. Any doubts regarding how to fill in the form has been dispelled in view of its main objective, that is, namely, the evaluation of the seismic response of the typology under examination.
The above approach can easily furnish a clear picture of a given municipality and straight comparisons, among structural typologies and/or sub-typologies of different municipalities, can be carried out.
5 Conclusion and further developments
The paper describes a systematic methodology for the statistical exposure evaluation of ordinary buildings on the Italian territory founded on the CARTIS form.
As known, exposure represents, quantitatively and qualitatively, the extension of the different anthropic elements characterizing a given geographic area (people, buildings, infrastructures, activities and movable properties), whose conditions and/or functioning can be damaged, altered or destroyed due to the occurrence of the seismic event.
In this context, the exposure assessment of the residential building stock can be proposed in terms of a “characterized inventory” analysis of the residential buildings considered at local level (municipality), although easily extensible to wider geographical contexts such as a Region, to develop seismic risk analyses.
The CARTIS methodology aims to improve the knowledge of the Italian ordinary building heritage (in masonry and reinforced concrete). To this purpose it systematizes, through a guided interview protocol, the knowledge of local technicians on the building heritage and to develop an inventory of the distribution of typological-structural characteristics on the territory. A standardized data collection procedure includes the main parameters used in seismic vulnerability analysis.
CARTIS is placed in an intermediate position between the database collected through the ISTAT census and the database developable through building-by-building campaigns.
ISTAT data, although distributed throughout the national territory, are poor in information. With reference to sub-municipal areas (called ‘census sections’), they are currently based on three parameters only, age, type of vertical structure (classified as masonry, reinforced concrete and other only) and number of floors, therefore in risk analysis they provide few parameters both in the definition of the distribution of the characterization of buildings (exposure) and in the evaluation of local vulnerability models (fragility curves).
On the other hand, building by building data collection allows a more accurate characterization, but is only possible in certain specific areas with an important use of resources.
Compared to the ISTAT database, CARTIS provides more information useful for vulnerability analysis. With reference to sub-municipal areas called ‘sectors’ (which are multiples of census sections), the CARTIS database provides information such as vertical structures typology, number of stories, height, slope of ground, year of retrofit, use, position in the aggregate, regularity in plan and in elevation, infill panels typology, horizontal structures, etc. These data can also be read at national scale if the sample of the municipalities investigated is representative.
Compared to a collection building by building, CARTIS allows to collect data reducing time and costs required. For example, for the municipality reported as case study, Cava de’ Tirreni, of about 51,000 inhabitants, the completion of the CARTIS form took a total time of about 3 weeks. In a relatively short time and a limited use of resources (three researchers and a technician), it was possible to characterize the prevailing typologies of the entire municipality.
As the numerous applications have shown (Zuccaro and Cacace, 2015; Chieffo and Formisano, 2019; Polese et al., 2019; Chieffo and Formisano, 2020; Vettore et al., 2020; Brando et al., 2021; Faggiano et al., 2021; Menichini et al., 2022; Zucconi et al., 2022; Perelli et al., 2023) the CARTIS methodology improves knowledge of the Italian ordinary building heritage, through the identification of further features, which affect vulnerability at territorial level (at municipal and regional level) with the aim of creating a common dataset. It can be used to define a taxonomy of building typologies representative of geographical areas and to develop vulnerability models and risk/impact assessment at local levels, with reference to minimum units of analysis such as the ‘sector’ or its submultiples, such as districts or cells (for example, square cells 250 m × 250 m). In local risk analyses useful for contingency planning and mitigation interventions, the CARTIS methodology is particularly effective. On a national scale (adopting the ‘municipality’ as the minimum unit of analysis), the CARTIS database can be an important tool, as shown in the analyses reported in the article, although currently the data collected must be increased to replace the ISTAT data in the analyses related to the National Risk Assessment.
Future developments will have to promote research activities aimed at validating the quality of CARTIS data in vulnerability and risk analysis and expanding the database, so that it can be considered representative of Italian municipalities by demographic class and altimetric area. In addition, to make the CARTIS database more usable and shareable, it will be necessary to implement simplified data extraction procedures (Leggieri et al., 2022; Sandoli et al., 2022).
Data availability statement
The datasets presented in this study can be found in online repositories. The names of the repository/repositories and accession number(s) can be found in the article/Supplementary Material.
Author contributions
GZ: Writing—Review and Editing, Methodology, Conceptualization, Supervision; MD: Writing—Review and Editing, Methodology, Conceptualization, Supervision; FP: Writing—Review and Editing, Software, Formal analysis, Investigation, Data Curation; DD: Writing—Original Draft, Writing—Review and Editing, Conceptualization; ES: Writing—Review and Editing, Conceptualization, Supervision.
Funding
This research was funded by the Italian Civil Protection in the framework of the CARTIS-ReLUIS project (2014–2023).
Acknowledgments
The authors thank the following Research Units of the CARTIS-ReLUIS project (WP2), who collaborated in the drafting of the final version of the CARTIS form through test activities, as well as through the application of the form on the territory, allowing the development of a robust database: UNINA-a (GZ), UNICAL-a (Garcea), UNICAL-b (Olivito), UNICH-a (Spacone/Brando), UNINA-b (Formisano), UNINA-c (Landolfo), UNINA-d (Calderoni/Brandonisio), UNINA-e (Di Ludovico/Polese/Prota), UNINA-f (Verderame), UNIBO (Savoia), UNIFE-a (Tralli/Minghini), UNIFE-b (Tullini), UNIRC (Fuschi), UNICUSANO (Ferracuti), IUAV (Faccio/Saetta), UNIFI-a (Vignoli), UNIFI-b (De Stefano), POLITO (Chiaia), UNIPA (Colajanni/Cavaleri), UNIPD-a (da Porto), UNIPD-b (Valluzzi), UNIPG (Borri/Speranzini), UNICAMPANIA (De Matteis), UNIVPM (Lenci), UNICAS (Imbimbo), UNIGE (Lagomarsino), POLIBA (Uva), UNIBAS (Masi/Manfredi), UNIMOL (Callari), POLIMI (Cardani), UNITN (Piazza), UNIROMA1 (Sorrentino/Monti). The authors also thank the CAESAR II Project and the Municipality of Cava De' Tirreni, that furnished some materials to support the activities.
Conflict of interest
The authors declare that the research was conducted in the absence of any commercial or financial relationships that could be construed as a potential conflict of interest.
Publisher’s note
All claims expressed in this article are solely those of the authors and do not necessarily represent those of their affiliated organizations, or those of the publisher, the editors and the reviewers. Any product that may be evaluated in this article, or claim that may be made by its manufacturer, is not guaranteed or endorsed by the publisher.
References
Baggio, C., Bernardini, A., Colozza, R., Corazza, L., Della Bella, M., Di Pasquale, M., et al. (2017). Field Manual for post-earthquake damage and safety assessment and short-term countermeasures (AeDES). JRC Scientific and Technical Reports 22868.
Faggiano, B., Iovane, G., Gaspari, A., Fournely, E., Bouchair, A., Landolfo, R., et al. (2021). The cartis form for the seismic vulnerability assessment of timber large-span structures. Buildings 11, 45. doi:10.3390/buildings11020045
Brando, G., Cianchino, G., Rapone, D., Spacone, E., and Biondi, S. (2021). A CARTIS-based method for the rapid seismic vulnerability assessment of minor Italian historical centres. Int. J. Disaster Risk Reduct. 63, 102478. doi:10.1016/j.ijdrr.2021.102478
Cacace, F., Zuccaro, G., Gregorio, D. D., and Perelli, F. L. (2018). Building inventory at national scale by evaluation of seismic vulnerability classes distribution based on census data analysis: BINC procedure. International Journal of Disaster Risk Reduction 28, 384–393. doi:10.1016/j.ijdrr.2018.03.016
Cartis, (2014). Cartis Web Application. http://cartis.plinivs.it.
Chieffo, N., and Formisano, A. (2020). Induced seismic-site effects on the vulnerability assessment of a historical centre in the Molise region of Italy: Analysis method and real behaviour calibration based on 2002 earthquake. Geosciences 21 (10), 21. doi:10.3390/geosciences10010021
Chieffo, N., and Formisano, A., Geo-hazard-based approach for the estimation of seismic vulnerability and damage scenarios of the old city of senerchia (avellino, Italy),» Geosciences, vol. 9, n. 59, doi:10.3390/geosciences902005959, 2019.
Crowley, H., Pinho, R., Pagani, M., and Keller, N. (2013). Assessing global earthquake risks: The global earthquale model (GEM) initiative. Handbook of seismic risk Analysis and Management of civil infrastructure systems, 815–838. doi:10.1533/9780857098986.5.815
Dolce, M., Zuccaro, G., and Papa, F. (2002). Model of typological characterization at national scale. Rome: Department of Civil Protection.
Dolce, M., and Di Bucci, D. (2015). Civil protection achievements and critical issues in seismology and earthquake engineering research. Perspectives on European earthquake Engineering and seismology, 21–58.
Dolce, M., Di Pasquale, G., Tiberi, P., Babini, S., Rosati, S., Bonifazi, B., et al. (2011), Una metodologia per la formulazione di scenari di danno a scala comunale: Applicazione pilota su 24 centri urbani della Valdaso (Marche), Proceedings of the 14th National Congress L’Ingegneria Sismica in Italia
Dolce, M., Prota, A., Borzi, B., da Porto, F., Lagomarsino, S., Magenes, G., et al. (2020). Seismic risk assessment of residential buildings in Italy. Bulletin of Earthquake Engineering 19, 2999–3032.
Dolce, M., Speranza, E., De Martino, G., Conte, C., and Giordano, F. (2021). The implementation of the Italian national seismic prevention plan: A focus on the seismic upgrading of critical buildings. Int. J. Disaster Risk Reduct. 62, 102391. doi:10.1016/j.ijdrr.2021.102391
Dolce, M., Speranza, E., Di Pasquale, G., Dalla Negra, R., Zuppiroli, M., and Bocchi, F. Proceedings of the 2013 in international Conference on earthquake engineering. 2013, Skopje, North Macedonia, Seismic vulnerability of historic centres through the assessment of historic building blocks. The experience of Ferrara, Italy
Dolce, M., Speranza, E., Giordano, F., Borzi, B., Bocchi, F., Conte, C., et al. (2019). Observed damage database of past Italian earthquakes: The da.D.O. WebGIS. Boll. Geofis. Teor. Applicata 60 (2), 141–164.
Dolce, M., and Speranza, E. (2001). Calibrazione e controllo della vulnerabilità sismica a scala urbana: Il caso di Serra dei conti (AN). https://www.researchgate.net/profile/Elena-Speranza/publication/304525870_Calibrazione_e_controllo_della_vulnerabilita_sismica_a_scala_urbana_il_caso_di_Serra_dei_Conti_AN/links/5cef7d15a6fdcc8475f67304/Calibrazione-e-controllo-della-vulnerabilita-sismica-a-scala-urbana-il-caso-di-Serra-dei-Conti-AN.pdf.
Dolce, M. (2012). Proceedings of the 15th world Conference on earthquake engineering. lisbon, Portugal. The Italian national seismic prevention program
Ettinger, S., Mounaud, L., Magill, C., Yao-Lafourcade, A. F., Thouret, J. C., Manville, V., et al. (2016). Building vulnerability to hydro-geomorphic hazards: Estimating damage probability from qualitative vulnerability assessment using logistic regression. J. Hydrology 541, 563–581. doi:10.1016/j.jhydrol.2015.04.017
Federal Emergency Management Agency, (2006). HAZUS-MH MR2 technical manual. Washington, DC, USA: Federal Emergency Management Agency.
Perelli, F., De Gregorio, D., and Zuccaro, G. (2023). Analysis of ordinary buildings on the island of Ischia (Italy) for a seismic impact assessment. Civ. Eng. Urban Plan. Int. J. (CiVEJ) 10, 25–44. doi:10.5121/civej.2023.10102
IS 1893-1, (2003). President of the Council of Ministers. https://law.resource.org/pub/in/bis/S03/is.1893.1.2002.pdf.First elements regarding general criteria for the seismic classification of the national territory and technical regulations for construction in seismic areas.
Istat, (2001). 14° censimento della popolazione e delle abitazioni. https://www.istat.it/it/censimenti-permanenti/censimenti-precedenti/popolazione-e-abitazioni/popolazione-2001.
Jaiswal, K., Wald, D., and Porter, K. (2010). A global building iventory for earthquake loss estimation and risk management. Earthquake Spectra 26 (3), 731–748.
Liguori, F., Fiore, S., Perelli, F., De Gregorio, D., Zuccaro e, G., and Madeo, A. (June 2022). Proceedings of the 8th world Congress in computational Mechanics and ECCOMAS congress. Oslo, Norway, Seismic vulnerability of masonry structures through a mechanical-based approach
Masi, A., Lagomarsino, S., Dolce, M., Ottonelli, V., and Manfredi, D. (2021). Towards the updated Italian seismic risk assessment: Exposure and vulnerability modelling. Bulletin of Earthquake Engineering 19.
Menichini, G., Nistri, V., Boschi, S., Del Monte, E., Orlando, M., and Vignoli, A. (2022). Calibration of vulnerability and fragility curves from moderate intensity Italian earthquake damage data. Int. J. Disaster Risk Reduct. 67, 102676. doi:10.1016/j.ijdrr.2021.102676
Ntc, (2002). National-scale typological characterization model (In Italian). Agreement with the national seismic service.
Protezione Civile, (2017). Cartis form. http://plinivs.it/cartis/SCHEDA_CARTIS_2017_ENG.pdf.
Protezione Civile, (2017). Cartis Manual. http://plinivs.it/cartis/MANUALE_SCHEDA_CARTIS_eng_ottobre2021.pdf.
Perelli, F. L., De Gregorio, D., and Zuccaro, F. C. e. G. (June 2019). Proceedings of the 7th ECCOMAS thematic Conference on computational Methods in structural Dynamics and earthquake engineering [COMPDYN]. Crete, Greece. Empirical vulnerability curves for Italian masonry buildings
Polese, M., Gaetani d'Aragona, M., and Prota, A. (2019). Simplified approach for building inventory and seismic damage assessment at the territorial scale: An application for a town in southern Italy. Soil Dyn. Earthq. Eng. 121, 405–420. doi:10.1016/j.soildyn.2019.03.028
Saito, K., Spence, R. J., Going, C., and Markus, M. (2004). Using high-resolution satellite images for post earthquake building samage assessment: A study following the 26 january 2001 Gujarat earthquake. Earthquake Spectra 20 (1), 145.
Sandoli, A., Calderoni, B., Lignola, G., and Prota, A. (2022). Seismic vulnerability assessment of minor Italian urban centres: Development of urban fragility curves. Bull. Earthq. Eng. 20, 5017–5046. doi:10.1007/s10518-022-01385-0
Shakhramanian, M. A., Larionov, V. I., Nigmetov, G. M., and Sutschev, S. P. (2000). Assessment of the seismic risk and forecasting consequences of earthquakes while solving problems on population rescue (theory and practise). Khimki, Russia: Russian Civil Defense and Disaster Management Research Institute.
Taubenböck, H., Esch, T., and Roth, A. (2006). An urban classification approach based on an object oriented analysis on high resolution satellite imagery for a spatial structuring within urban areas. https://elib.dlr.de/22591/.
Taubenböck, H., Esch, T., Wurm, M., Thiel, M., Ullmann, T., Roth, A., et al. (2008). Urban structure analysis of mega city Mexico City using multy-sensorial rempte sensing data. Remote Sens. enviromental Monit. Remote Sens. Enviromental Monit. FIS Appl. Geol. 7110, 83–94.
Taubenböck, H., Roth, A., Dech, S., Mehl, H., Munich, J. C., Stempniewski, L., et al. (2009). “Accessing building vulnerability using synergistically remote sensing and civil engineering,” in Urban and regional Data Management (Boca Raton, FL, USA: CRC Press).
Teller, S., Proceedings Pacific Graphics '98. Sixth Pacific Conference on Computer Graphics and Applications, Singapore. Toward urban model acquisition from geo-located images, October 1998.
Torii, A., Havlena, M., and Pajdla, T., Proceedings of the 2009. » in 12th international Conference on computer vision workshop. Kyoto, Japan. From Google street view to 3D city model, September 2009.
Undrr, (2016). Report of the open-ended ontergovernamental expert working group on indicators and terminology relating to disaster risk reduction. Geneva, Switzerland: United Nations Office for Disaster Risk Reduction.
Vettore, M., Donà, M., Carpanese, P., Follador, V., da Porto, F., and Valluzzi, M. (2020). A multilevel procedure at urban scale to assess the vulnerability and the exposure of residential masonry buildings: The case study of pordenone, northeast Italy. Heritage 3, 1433–1468. doi:10.3390/heritage3040080
Leggieri, V., Mastrodonato, G., and Uva, G. (2022). GIS multisource data for the seismic vulnerability assessment of buildings at the urban scale. Buildings 12, 523. doi:10.3390/buildings12050523
Wang, L., You, S., and Neumann, U. (2006). Proceedings of the 3rd international Symposium on 3D data processing. Visualization and Transmission. Chapel Hill, NC, USA, Large-scale urban modeling by combining ground level panoramic and aerial imagery
Wieland, M., Pittore, M., Parolai, S., Zschau, J., Moldobekov, B., and Begaliev, U. (2012). Estimating building inventory for rapid seismic vulnerability assessment: Towards an integrated approach based on multi-source imaging. Soil Dynamic Earthquake Engineering 36, 70–83. doi:10.1016/j.soildyn.2012.01.003
Yamazaki, F., Vu, T., and Matsuoka, M. (2007). Dual-scale approach for setection of tsunami-affected areas using optical satellite images. Remote Sens. 28. doi:10.1080/01431160601091811
Zuccaro, G., and Cacace, F. (2015). Seismic vulnerability assessment based on typological characteristics. Soil Dyn. Earthq. Eng. 69, 262–269. doi:10.1016/j.soildyn.2014.11.003
Zuccaro, G., De Gregorio, D., Leone, M. F., Sessa, S., Nardone e, S., and Perelli, F. L. (2021). Caesar ii tool: Complementary analyses for emergency planning based on seismic risks impact evaluations. Sustainability 13, 9838. doi:10.3390/su13179838
Zuccaro, G., Perelli, F. L., and Masi, D., June 2021. Caesar II: An Italian decision support tool for the seismic risk. The case study of Torre Pellice, Villar Pellice and Pinerolo municipalities. Proceedings of the 8th International conference on computational methods in structural dynamics and earthquake engineering, Athens, Greece.
Zuccaro, G., Santo, A., Cacace, F., Di Crescenzo, D, and De, G. (2012). Building vulnerability assessment under landslides actions: Castellammare di Stabia case study. Rendiconti Online Societa Geologica Italiana 21, 470–472.
Zuccaro, G., and De Gregorio, D. (2019). Impact assessments in volcanic areas – The vesuvius and campi flegrei cases studies. Ann. Geophys. 61. doi:10.4401/ag-7827
Keywords: seismic risk, seismic exposure, seismic vulnerability, emergency planning, buildings typologies
Citation: Zuccaro G, Dolce M, Perelli FL, De Gregorio D and Speranza E (2023) CARTIS: a method for the typological-structural characterization of Italian ordinary buildings in urban areas. Front. Built Environ. 9:1129176. doi: 10.3389/fbuil.2023.1129176
Received: 21 December 2022; Accepted: 19 May 2023;
Published: 09 June 2023.
Edited by:
Silvia Bertelli, University College London, United KingdomReviewed by:
Rabindra Adhikari, Pokhara University, NepalSergio Ruggieri, Politecnico di Bari, Italy
Copyright © 2023 Zuccaro, Dolce, Perelli, De Gregorio and Speranza. This is an open-access article distributed under the terms of the Creative Commons Attribution License (CC BY). The use, distribution or reproduction in other forums is permitted, provided the original author(s) and the copyright owner(s) are credited and that the original publication in this journal is cited, in accordance with accepted academic practice. No use, distribution or reproduction is permitted which does not comply with these terms.
*Correspondence: Giulio Zuccaro, enVjY2Fyb0B1bmluYS5pdA==