 Franck Schoefs
 Keita Awa Zahui Raissa
 Stephanie Bonnet
 Alan John O’Conor
- 1Nantes Université, École Centrale Nantes, French National Centre for Scientific Research (CNRS), Research Institute in Civil and Mechanical Engineering (GeM), Nantes, France
- 2Unité Mixte de Recherche et d’Innovation en Génie Civil, Géosciences et Sciences Géographiques, Institut National Polytechnique Houphouët Boigny, Yamoussoukro, Côte d’Ivoire
- 3Department of Civil, Structural and Environmental Engineering, Trinity College Dublin, Dublin, Ireland
Reinforced concrete (RC) structures in harbors are designed for long life (50–70 years) and are subjected to chloride-induced corrosion. Diagnosis of these structures usually relies on inspections which consist of ponding salt in the concrete cover with semi-destructive testing (SDT). Uncertainties in inspection result in bad diagnosis, and consequently in bad decisions. This study aims at developing a methodology for quantifying the uncertainty of measurements taken on-site where the random properties of concrete play a role. This assessment was performed through multiple measurements by three operators from two laboratories on the same cores extracted from a 27-year-old existing bridge located in Ireland. A total of 566 measurements are available. The effect of the operator, laboratory, and protocols are highlighted and then modeled. It is shown that the error of assessment is a function of the chloride content and follows a student distribution. The standard deviation of this error reached approximately 15% of the chloride content. This error is further propagated through the Fick law parameters for measuring its effect on the diagnosis: a 17% change of the probability of corrosion initiation is shown. This is the first study of this type with in situ inspections and the work is partly transferable to other coastal or offshore structures.
1 Introduction
Harbors play a major socioeconomic role in almost all countries with more than 80% trade exchange. Furthermore, they often play a key role in military defense in Europe and all over the world (Boero et al., 2009a; Boero et al., 2009b). Reinforced concrete (RC) structures in harbors are designed for long lives (50–70 years) in marine environments which are considered to be aggressive on RC structures. The main degradation mechanism is chloride-induced corrosion associated with different exposure conditions: tidal, splash, and atmospheric, whose boundaries have been defined by Bourreau et al. (2020).
To prevent any critical failure and optimize the maintenance of the structures, a diagnosis is usually made several times during their lifetime. It usually relies on inspections which combine different techniques, and among them are non-destructive techniques (NDT) such as half-cell potential, resistivity, and current density measurements (Torres-Luque et al., 2014; Lecieux et al., 2015; Lecieux et al., 2019; Fares et al., 2018; Bourreau et al., 2019; Priou et al., 2019). Condition assessment should be based on a clear understanding of the relationship between the measurements and the degradation levels with the associated levels of uncertainties (Faber, 2002; Stewart and Val, 2003; Bastidas-Arteaga and Schoefs, 2012; Bastidas-Arteaga and Schoefs, 2015; Rakotovao Ravahatra et al., 2019). A concrete structure made of the same concrete presents variability, especially when dealing with transfer properties such as chloride diffusion (Othmen et al., 2018). The result is a requirement to propose methods into investigating the spatial variability and optimizing the positional measurements (O’Connor and Kenshel, 2013; Schoefs et al., 2016; Oumouni and Schoefs, 2021). The diagnosis concerning chloride profiles usually relies on semi-destructive testing (SDT), in which the goal is often to pond salt on the concrete surface. The technique comprises several steps which include: i) the drilling of a core, ii) cutting it up into lengths, iii) crushing, and finally iv) carrying out a chemical test. Even if this assessment relies on a complex method, there is no commercial sensor with proved implementation and efficiency on site (Torres-Luque et al., 2014; Jin et al., 2020; Biondi et al., 2021; Watanabe et al., 2021). Additionally, other methods such as resistivity also demonstrate limitations in terms of error and require correction of the data (e.g., due to the effect of saturation degree and temperature) (Lecieux et al., 2015; Bonnet & Balayssac, 2018; Bourreau et al., 2019). SDT has been used in a large number of studies for materials tested in laboratories since the 1990s (Dhir et al., 1990). Tests on existing structures are far less frequent: Othmen et al. (2018) reviewed 10 published studies from 2004 to 2016 with only 3 concerning more than 30 measurements. However, none of these investigated the uncertainty of measurements. Articles dealing with epistemic uncertainties of chloride measurement have either i) not considered uncertainty of assessment (Hamidane et al., 2020) or ii) have been based on data for a model material created in the laboratory (Hunkeler et al., 2000; Schoefs et al., 2022). It is noted that this method requires high human involvement, and its multiple steps lead to significant uncertainties even for a model material (Bonnet et al., 2020). Hinrichs (2012) reported that the standard deviation of the error of measurement could reach 0.01% of the chloride mass fraction referred to as the mass of cement. Hunkeler et al. (2000) pointed out that the reproducibility standard deviation depends on the absolute amount of chlorides, but no values are given for on-site assessment. Uncertainty in measurement can lead to bad management decisions (Hinrichs, 2012; Sheils et al., 2012): the uncertainty of measurement is thus a key input in maintenance optimization. Uncertainty of measurement in maritime conditions includes
- expertise and tiredness level of the operator (Schoefs et al., 2012),
- protocols for on-site inspection (Schoefs et al., 2009), and
- processes of measurement in laboratories (Bonnet et al., 2020).
In Bonnet et al. (2020) and Hunkeler et al. (2000), the quantification of the error of measurement was performed on laboratory specimens made with a normalized mortar and exposed to a fixed well-known quantity of chlorides. It is thus not directly transferable to concrete structures because the material is not the same, it was built in the laboratory, and the chloride contamination was performed under laboratory conditions. Moreover, the effect of chloride content on the error cannot be investigated, and there are no gradients of chlorides vs. depth for analyzing the effect on diffusion properties. Hence, the purpose of this study is to provide for this quantification of uncertainty. To reach this objective, measurements taken on an actual bridge in Ireland were used, whose concrete cores were extracted in order to conduct the study on chloride profiles (O’Connor and Kenshel, 2013). A total of 263 measurements of chlorides were available, thus facilitating performance of a comprehensive statistical analysis. The onsite cores were analyzed by two laboratories: one in Ireland and one in France. Moreover, two operators made the measurements in France. As a result it is possible to quantify the role of the operator and the protocol employed. Moreover, the scatter in the chloride content facilitates the analysis of the dependence of the uncertainty to the level of contamination. Finally, the impact on the parameters of Fick law and on the diagnosis was analyzed.
Section 2 depicts the protocol, the location of measurements, and the transnational measurements. Section 3 presents the data and quantities of interests: i.e., i) the chloride content for decision at the date of inspection and ii) the parameters of the Fick equation as calculated from these profiles. In Section 4, the quantification and modeling of uncertainties are evaluated and modeled. Section 5 analyzes the effect of the error of measurement on the diagnosis of the bridge. This article finishes with some concluding remarks presented in Section 6.
2 Presentation of structure and transnational measurements
This section presents the Ferrycarrig Bridge, the structure on which concrete cores were extracted in order to conduct a study on chloride profiles, the experimental program for obtaining these different measurements, and the laboratories involved. Most of the information concerning the presentation of the bridge and the experimental program for obtaining the chloride profiles was collected in the PhD thesis of Kenshel (2009).
2.1 Presentation of RC structure: Ferrycarrig Bridge
Since chloride profile data for RC marine structures are quite scarce due to the cost of obtaining them, or due to the accessibility or inaccessibility of these structures, the present study is conducted on the chloride profile data obtained from concrete cores extracted from the Ferrycarrig Bridge cross girders during its rehabilitation in 2007.
The Ferrycarrig Bridge (Figure 1), built in 1980, is an RC bridge located in the atmospheric marine environment of southeastern Ireland on the N11 Wexford–Dublin Primary National Road passing over the River Slaney. Situated 3.5 km from the nearest main coastline, the bridge consists of eight spans of precast and prestressed girders with a cast-in-place RC fill. The reinforcement cover for the RC beams ranges from 22 to 63 mm with an average cover of 48 mm and a water/cement ratio of approximately 0.44% by weight (Kenshel, 2009). In addition, the spans are supported by intermediate piers with abutments at both ends. The bridge is continuous on all piers except the central pier where an expansion joint has been provided for the deck. It is 15.8-m wide and its eight spans are regularly spaced at 15.7 m, which gives it a total length of 125.6 m. The bridge piers consist of two separate concrete walls, topped by transverse RC beams on which the bridge deck rests. These beams are 1.2 m deep, 1 m wide, and 15.24 m long. In order to assess its condition state, this bridge was inspected twice in 2002 and 2004 without coring. From this diagnosis, instrumentation and rehabilitation of various elements of the bridge were carried out in 2007. It was during these rehabilitation works that the cores were extracted from the cross beams of seven piers Pi (Figure 1).
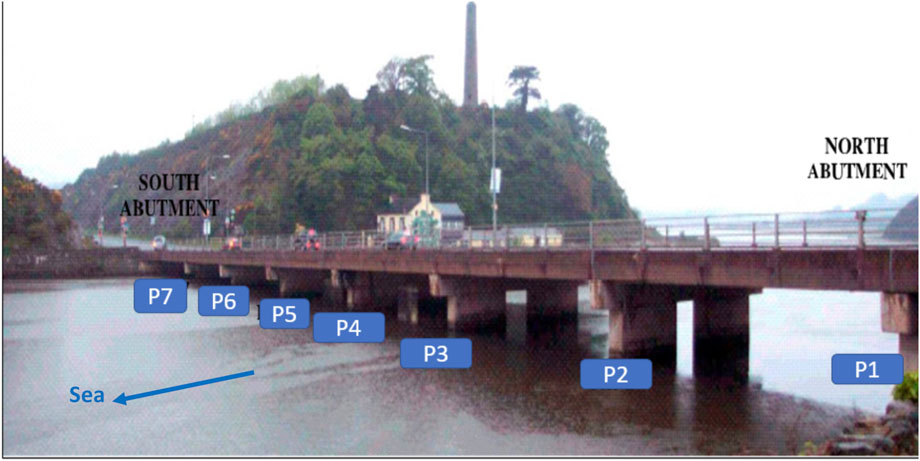
FIGURE 1. Photograph of the Ferrycarrig Bridge (piers #1 to #7 locations) (Kenshel, 2009, pp. 116).
2.2 Location of measurements
During the rehabilitation of the Ferrycarrig Bridge, five 50-mm diameter concrete cores were extracted from each of the North (N) and South (S) faces of the first seven transverse girders of the bridge, shown in Figure 1 (see O’Connor and Kenshel, 2013 for details). It should be noted that the cores extracted from the different faces of the different girders of each of the seven piers were not equidistant. Indeed, due to operational difficulties at the site, the cores could not be drilled at the same distance along the girders (Kenshel, 2009). The distances between the core’s locations, their relative locations to both ends of the spans and the beam soffits, are shown in Figure 2. Note that the distance is at least 1.2 m, which is sufficient distance to ensure that cores are statistically independent when considering chloride content (Schoefs et al., 2022). For more details on the exact location of each core for each face of the different girders see Appendix B of Kenshel’s (2009) thesis. In order to identify the different cores and their location, the following numbering has been adopted: PiNj and PiSj, where P is the pier, i is the pier number, N is the north face, S is the south face, and j is the core number. Once extracted, the cores were sealed in plastic bags and sent to the laboratory of Trinity College Dublin (TCD) for processing and chemical analysis. Some cores that were damaged were excluded. Of the 70 cores, only 45 were treated, which included cores from the different faces of piers: P2, P3, P4, P7, and the five cores from the south face of pier P1 (P1S). These cores were then subjected to an extensive experimental program in accordance with the European standards in order to determine the chloride profiles.
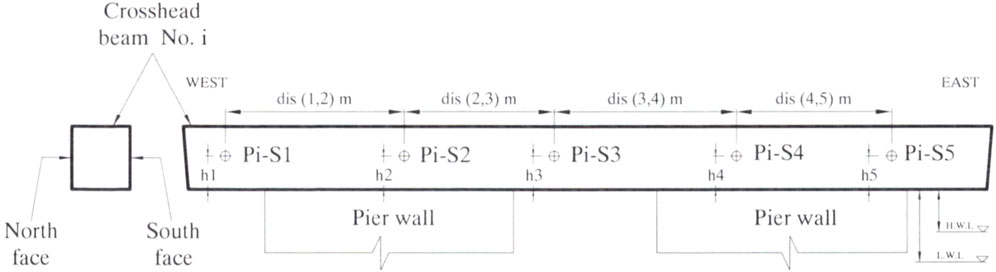
FIGURE 2. Cores symbolizing system (Kenshel, 2009, pp. 117).
2.3 Laboratories involved and methods used for chloride assessment
After extraction of the cores, the experimental program started at the TCD laboratory with slicing, crushing, and grinding operations in order to reduce the different concrete cores into powder to extract chloride. Once in the TCD laboratory, the 45 selected cores were cut into 8-mm-thick slices using an angle grinder equipped with a 2-mm diamond blade. The first 5 mm outside of the cores were removed before being dried in an oven at 105°C for one night according to the recommendation of the Eurocode (EN 14629). The concrete slices were then crushed using a manual jaw crusher such that the powder obtained could pass the 1.18-mm sieve, keeping in accordance with the recommendations of EN 14629. The powder samples were therefore obtained for the eight incremental depths of the five cores extracted per beam face, each weighing between 18 and 25 g and then stored in a sealable plastic bag. For the determination of the total chloride profiles in the different samples, a portion of the powders from each sample was processed by an operator in the TCD laboratory and another in the Nantes Université laboratory using the acid soluble chloride method. The two protocols were selected because they both follow RILEM recommendations (Setzer, 2002; Vennesland et al., 2013) and are representative of the most widely used methods for salt ponding in concrete (Othmen et al., 2018).
At TCD, a potentiometric titration was then performed according to the recommendations of EN 14629 with a vacuum filtration method that is described below. For each sample approximately 2.5 g of concrete powder was taken in a beaker to which was added distilled water and 5 mL of concentrated HNO3 (69%). The mixture was stirred and heated for 30 min. The solution was then filtered into a volumetric flask. The chloride concentration of the filtered solutions was determined by potentiometric titration using an automatic titrator with silver nitrate (AgNO3) as the titrant. The TCD laboratory forwarded the sample powders to Nantes Université, where two operators (NU-P and NU-G) also carried out the same measurements of the total chloride content according to the acid soluble chloride method at different periods. The complete process is available in the appendix of Kenshel (2009). Note that to make sure that the titration apparatus system was working properly, a calibration was performed by using the reference method of the Swedish National Testing and Research Institute (SNTRI)—2 6 0 for acid soluble chloride determination.
However, it should be noted that they followed the procedure recommended by RILEM TC178 (Setzer, 2002), as done by Bonnet et al. (2020) and Othmen et al. (2018) and is described below. For each sample, approximately 5 g of concrete powder was taken in a beaker to which distilled water and HNO3 were added. The mixture was then stirred and heated for 30 min. The solution was filtered into a 250 mL volumetric flask. The chloride concentration of the filtered solution was determined by potentiometric titration using an automatic titrator with silver nitrate of molarity 0.05 M (AgNO3) as the titrant.
In conclusion, it should be noted that as far as the experimental program is concerned, the powdering step of the concrete cores was carried out in the same laboratory (that is, TCD), while the other steps (filtration and titration) were carried out in two transnational laboratories and by different operators: the operator of TCD in the laboratory of TCD (in Ireland) and the operators NU-G and NU-P of Nantes Université (France).
3 Data analysis
The available data was collected in 2007, after 27 years of exposure. From a semi-destructive assessment of chlorides from cores, two types of quantities of interest can be studied:
- the chloride content at a given position in the concrete cover, which is discussed in Section 3.1, and
- the parameters of the model diffusion, from the profile analysis. The model and data treatment are presented in Section 3.2.
Table 1 presents details of the data analyzed.
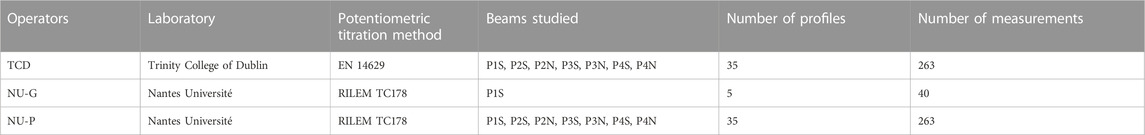
TABLE 1. Summary of the experimental program (data obtained from treatments and chemical analysis of cores).
3.1 Chloride content
Following the potentiometric titration of the different concrete beam samples, various chloride contents were obtained with chloride levels ranging from 0 to approximately 0.001478 g/g of concrete, considering all cores and operators. Figure 3—left plot shows the profiles obtained from the three operators for pier P1 and south exposure, and two sections (1 and 4). This level is quite low when compared to that obtained on structures of the same age purely exposed to sea conditions (0.0025 according to Othmen et al., 2018) in the tidal zone. Moreover, during a more detailed analysis, it was noted that for the same position and core, the quantity measured varied according to the operators [Figure 3—right plot shows one pier with north exposure (P4N) and two sections (3 and 5)]. This demonstrates the imperfect nature of chloride measurements in marine structures in RC. However, according to many authors, these measurements are still one of the best tools for rational decision support for inspection or maintenance of marine structures in RC (Bastidas-Arteaga and Schoefs, 2012; Bastidas-Arteaga and Schoefs, 2015; Tran et al., 2016; Othmen et al., 2018; Bonnet et al., 2020). Therefore, a more careful analysis of the measurement discrepancies of the different operators is necessary. The protocols for obtaining the chloride content being slightly different and operators being different, a more detailed analysis is carried out. The objective is to investigate if these deviations are related to the quantity of chloride measured, the protocol of assessment, or the operator.
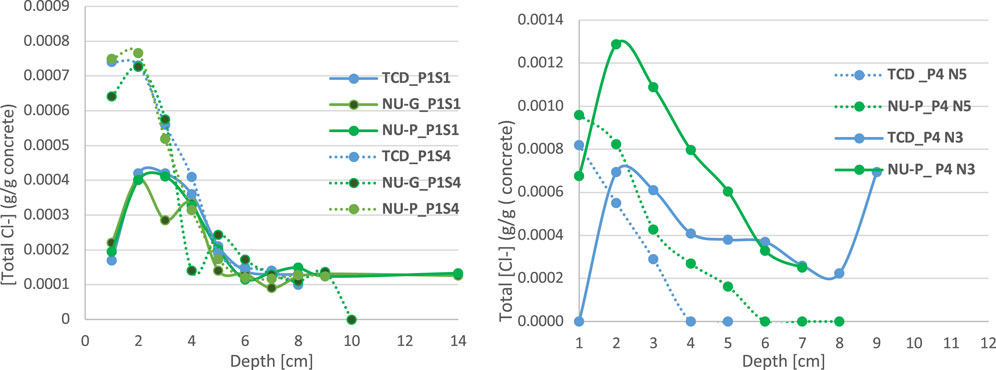
FIGURE 3. Example of total chloride profiles after 27 years of exposure showing the heterogeneity of measurements by different operators.
Moreover, these measurements are generally used to determine the parameters of a model for the prediction of the chloride profiles with time, the objective being to evaluate the corrosion risk. An analysis of the impacts of the measurement differences on these parameters is carried out in Sections 4, 5.
3.2 Parameters of Fick model
After having determined the chloride content in the different cores, a treatment is carried out in order to determine the parameters of a prediction model. The chloride profiles, with the exception of a few, show a concentration gradient decreasing rapidly with the depth of the concrete. The model used for fitting the chloride profile (chloride content as a function of depth) is usually the Fick’s model (Mejlbro, 1996). This model is one of the models that allows calculation of the amount of chloride in the concrete as a function of time. Unlike other models, it is highly preferred in the literature for the treatment of chloride profiles from RC structures in marine environments regardless of the exposure area for its simplicity and ability to be adapted to different exposure conditions (Othmen et al., 2018). Moreover, according to Othmen et al. (2018), concrete can be considered the almost saturated in the marine environment. This is justified by the fact that concrete is generally poured in situ, constantly exposed to high humidity (more than 76% in the present case study) and subjected to water from splashing and/or rain. Under the assumption of a homogeneous concrete, constant surface content, and one-dimensional diffusion in a semi-finite space, the second law of the Fick’s model is used for the adjustment of the chloride profiles and is expressed as follows:
where C(x, t) is the chloride content at a depth x m) and after time t s); Ci (g/g concrete) is the initial chloride content in the concrete before exposure; Cs (g/g concrete) is the chloride content at the surface of the concrete; and D (m2/s) is the apparent diffusion coefficient of the concrete. The fitting involves monotonic and strictly decreasing profiles and have therefore been the subject of pre-processing which is done in an individual way as recommended by Othmen et al. (2018); all the data, from the surface to the point of maximum chloride content, are discarded. However, contrary to this study where Ci is considered as known with a value of 0, it is rather treated as an additional parameter of the model to be determined in the present case, as was done by Kenshel (2009). Indeed, the study conducted by Kenshel (2009) showed that when Ci is considered to be random (parameters of the model of the second Fick’s law), a better quality of fit is obtained than when it is considered to be zero. Selecting outliers is always a delicate task. Another data processing is used in this study consisting of discarding each of the values considered as outliers in order to have profiles conforming to the expected pattern. Here, for measurements at depth deeper that the point of maximum chloride content, values are discarded if they did not match the expected pattern, after fitting: monotonous and are strictly decreasing along the concrete depth. This may result from measurement errors, damage to the concrete (crack), or the quantity of available powder of concrete (the presence of steel rebars or big aggregates in the slice of concrete). For instance, in Figure 4, profiles P4N5 and P3S2 experience a value of 0 that is physically impossible, even if they belong to a continuously decreasing profile. In Figure 4, profile P2N1 is highly regular. The data obtained in the literature allow quantifying a maximum change between one measurement and another one: first, Bonnet et al. (2020) showed that the maximum error of measurement in the laboratory is around 7∙10–4 (g/g). This order of magnitude is confirmed in Section 3.3. Second, a profile in a highly polluted concrete by chlorides experiences a maximum change between a measurement and another one in the nearest point of 10–3 (g Cl−/g) (Othmen et al., 2018; Figure 3). In profile P2N1, the change exceeds 10–3 and again null values are found, and as a result, they are discarded.
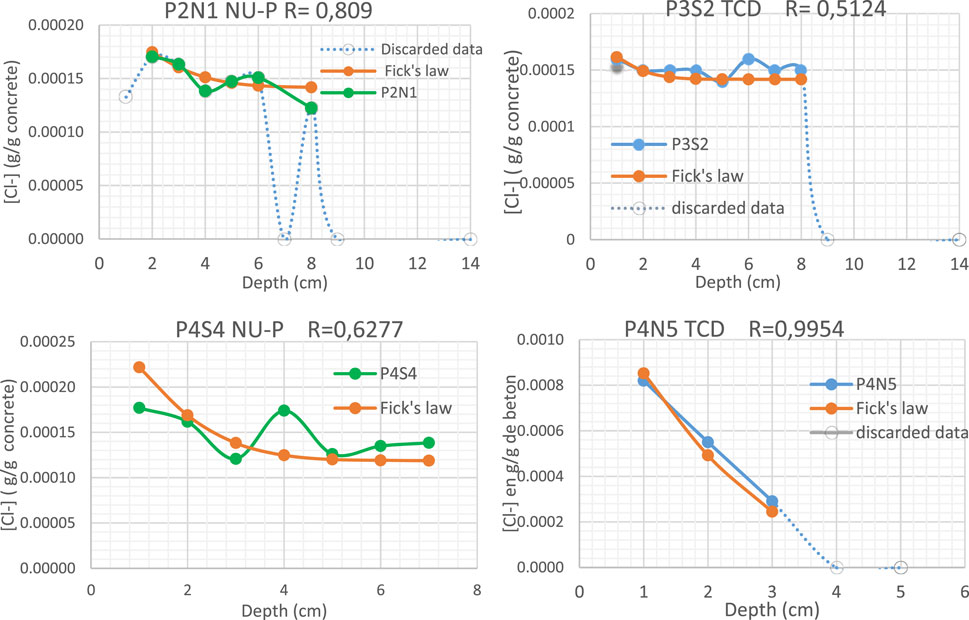
FIGURE 4. Examples of profiles obtained in three beams (P2, P3, and P4), on north and south faces (N/S) for two operators (TCD and NU) with a few outliers excluded from the analysis (discarded data) and discarded profiles.
In some cases, the whole profile is discarded when the evolution is not decreasing or when having very little data (less than four points) for the fit. That is the case when the profile experiences slight changes around a mean value: in Figure 4, for profile P4S4, the difference between the maximum and minimum values of the profile is 4∙10–5, much less than that of the measurement error. The profile is thus discarded.
Figure 4 illustrates that the discarded profiles concerned both laboratories and operators, several piers (P2, P3, and P4), and exposure zones (north and south). After case-by-case studies, eight profiles were excluded: four for the TCD operator (P2N1, P3N2, P4N4, and P4N5) and four for the NU-P operator (P2N1, P3N2, P4S4, and P4S5).
Subsequently, the values of D, Ci, and Cs were determined by iteration using the least-square minimization criterion and simplex optimization algorithm. The discarding of outliers (content and profile) resulted in an increase of the mean of D and Cs, and a slight decrease of the Ci parameter, whatever the operator: for D and Cs, an increase of approximately 4% and 6.4% for the TCD operator and 8% and 9.4% for NU-P was observed, respectively. As a consequence, the filtering of the outliers did not change the profiles significantly when looking to the order of magnitudes of uncertainties.
3.3 Method for quantifying error of measurement
The analysis of the various profiles of chlorides resulting from tests of repeatability carried out by the three operators (NU-P, NU-G, and TCD) of the two different laboratories (NU and TCD) made it possible to highlight errors of measurement. In order to evaluate these errors, the data were subdivided into two series. The first series (series 1) concerned the data of the P1S beam, on which all three operators (which included those from the same laboratory) made measurements. Each operator carried out 40 measurements (Table 1) of the chloride levels between [0 and 7.66]∙10–4 g/g of concrete. The second series (series 2) made up of two operators from two different laboratories (NU-P and TCD) who measured the data from beams P1S, P2S, P2N, P3N, P3S, P4S, and P4N, on which both operators from different laboratories carried out measurements. Indeed, only these operators worked simultaneously on all these beams with a total of 263 chloride measurements in all between [0 and 14.78]∙10–4 g/g concrete.
The actual amount of chlorides at each position is not known, so the nominal value is evaluated according to the procedure used by Schoefs et al. (2009). This procedure consisted in considering this nominal value as being equal to the average of the three measurements made by the different operators at the considered position Eq. 2. The assumption being that operators or protocols are not at the origin of a systematic bias. Thus, measurement errors of each operator are computed according to Eq. 3.
where
3.3.1 Error of each operator
From the analysis of the different chloride measurements, it was found that there is heterogeneity between the values measured by the TCD laboratory and those of the Nantes Université laboratory for measurements that are supposed to be identical, since these operators used the same powder samples. Thus, the effect of the protocol and equipment used in each laboratory is evaluated by statistical analysis. To do this, series 1 is considered. Indeed, although having less data (40), this series is the most adapted because it includes the three operators (two from the laboratory of Nantes Université and one from TCD). Tables 2 shows all the estimates computed for this comparison: range, mean, standard deviation, maximum, and minimum errors computed from Eq. 2. Note that the maximum/minimum errors are of the same order of magnitude as the threshold used to detect outliers in Section 3.2, i.e., 10−3 (g Cl−/g). It appears that there is neither a laboratory that provides an additional bias nor standard deviation or a wider scatter when compared to the other. Indeed, the bias and standard deviation of the TCD operator are between those of the two operators of the Nantes Université (NU-P and NU-G). Consequently, the measurements are not influenced by possible laboratory or type of protocol effects. Therefore, in the rest of the document, the work will only focus on the case where we have only the two operators: the series 2 for which 263 measurements are available.
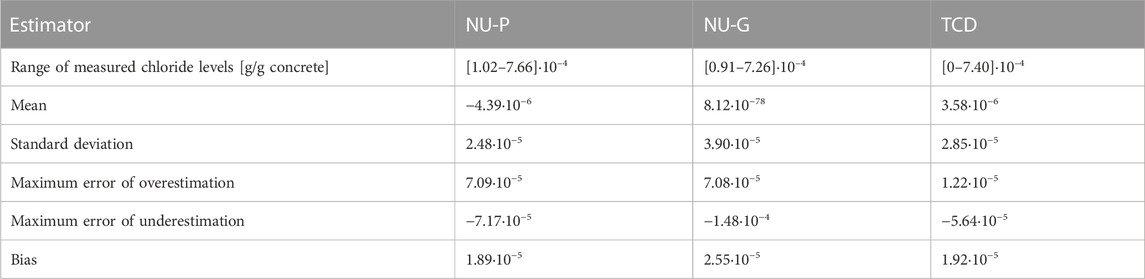
TABLE 2. Statistical estimators of measurement errors: case of series 1.
3.3.2 Global error assessment
As previously demonstrated, there is no laboratory effect on the orders of magnitude for the biases, standard deviations, ranges, and maximum/minimum errors. Consequently, the global error statistics are determined by considering only the case of the two operators: series 2. The averages of the two operators Cnom are considered as the true values of the chloride content in the concrete, as it has been shown that there is no additional bias of one operator when compared to the other (random hazard). Therefore, with two operators, for one measurement at position j (beam, exposure, and depth)—
Error estimators are provided in Table 3. Note that the level of chloride content is quite low when compared with that obtained for structures of the same age purely exposed to sea conditions, in the tidal zone (Othmen et al., 2018). This table confirms the absence of a laboratory effect: the ranges of measured chloride levels are very similar. Moreover, it appears that the two protocols lead to approximately the same standard deviation and bias. The protocol of TCD induces a slight overestimation in comparison with the one from the Nantes Université. The global distribution of the error is therefore obtained by grouping the errors of the two operators (TCD and NU-P) and is the subject of a more detailed analysis in the following section. When comparing these errors to those published by Bonnet et al. (2020) on mortars in a laboratory (standard deviation of 12.10–5 for an average chloride content of 2 10−3) the standard deviation here is 6.7.10–5 for an average chloride content of 7.10–4. It is of the same order of magnitude but two times lower. The reason is provided in Section 4.1, where the link between the chloride content and standard deviation of errors is highlighted.
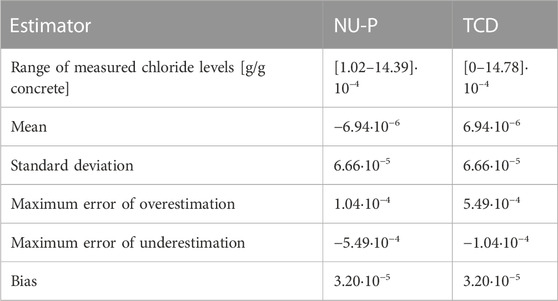
TABLE 3. Statistical estimators of measurement errors: case of series 2.
4 Uncertainty quantification and modeling
4.1 Uncertainty in chloride assessment
Focus is now placed on the distribution of the error and its modelling. The first question concerns the dependency of the error to the nominal level of chloride. This phenomenon is observed for the on-site resistivity assessment of coastal bridges (Bourreau et al., 2019) and for the assessment of chloride content for model materials (Hunkeler et al., 2000). Figure 5 plots the errors of measurement as a function of the nominal chloride content. The error increases slightly with the chloride content when it is below 0.0008 [g/g concrete]. For larger chloride contents, the nominal content is too low for expanding this analysis.
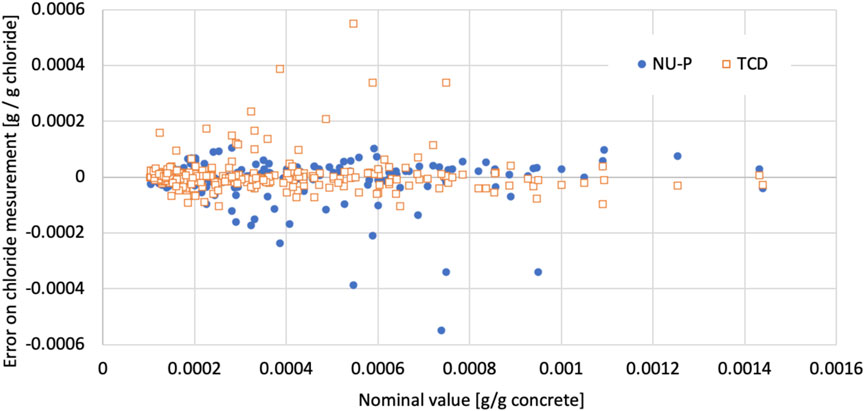
FIGURE 5. Plot of the error of measurement as a function of the nominal content for the two laboratories (NU-P and TCD).
As a consequence, the standard deviation is modeled as an increasing function up to a nominal content of 0.008 [g/g concrete] and is considered a constant for higher values. To this end and in view of computing the standard deviation accurately, the set of measurements was divided into six intervals with 46 values each, which allowed for a good statistical estimate of the standard deviation. For each of the six intervals, the mean chloride content and standard deviation of errors were computed. Figure 6 plots the evolution of the standard deviation with a nominal content up to 0.008 [g/g concrete]. It shows a clear quadratic shape whose equation is given in Eq. 4. Eq. 5 gives the value to be used for higher chloride contents. The range of standard deviations [1∙10–5 to 1.2∙10–4] per kg Cl−/kg of concrete was lower than the one obtained by Hunkeler et al. (2000) that ranged between 0.00008 and 0.00010 (kg/kg cement), i.e., between [1.6∙10–5 and 2∙10–5] (kg/kg cement) for a concrete density of 2,320 kg/m3 and cement content of 375 kg/m3) (Kenshel, 2009, p. 45). However, tests by Hunkeler et al. (2000) were carried out on the materials cast in the laboratory.
where σε denotes the standard deviation and Cnom is the nominal value.
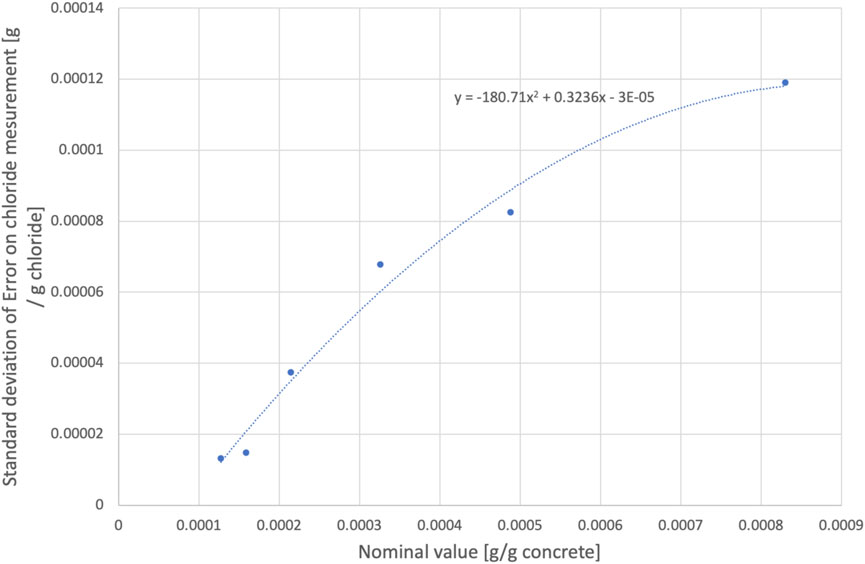
FIGURE 6. Evolution of the standard deviation of error of measurement as a function of reference.
In view of propagating the corresponding uncertainty through degradation (e.g., diffusion) models in a risk-based inspection framework, let us now focus on the probabilistic modeling of the distribution of the error. A normal probability density function (pdf) is usually suggested but it is shown that this assumption should be tested before its selection (Schoefs et al., 2009). Table 4 gives the maximum likelihood estimates (MLEs) and the parameters of the distributions obtained from the MATLAB Statistics Toolbox for the normal and t-location scale (Student t-distribution) pdf. Figure 7 plots the corresponding pdfs with the experimental distribution. Both the figure and statistical estimate (MLE) show that the t-location scale pdf is the best candidate. Note that it is also selected for the error of measurement of marine corrosion (Schoefs et al., 2009).
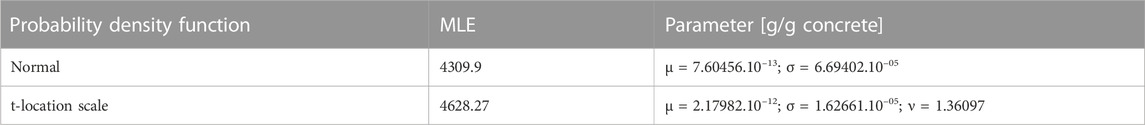
TABLE 4. Maximum likelihood estimate and parameters of the probability density function for error distribution modeling.
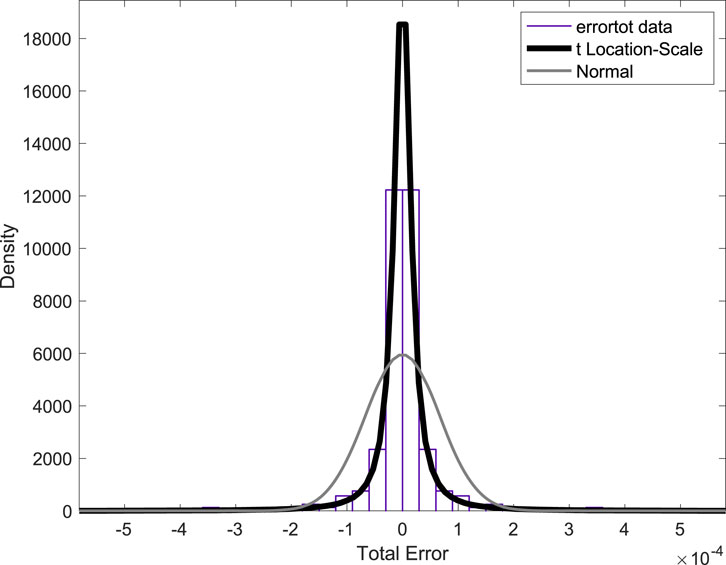
FIGURE 7. Normal and t-location scale pdf used for fitting the distribution of errors.
The error is zero-mean with a standard deviation following Eqs 4, 5. Given, these two parameters and knowing that the degree of freedom is ν = 1.36097 (Table 4), the distribution of errors is conditioned by the predicted nominal value and follows the t-location scale pdf. This modeling allows computing the error of assessment of the chloride content from SDT and the probability of detection and probability of false alarm. These inputs are required in risk-based inspection (RBI) (Sørensen and Faber, 2002; Straub and Faber, 2005) frameworks for analyzing their effects on the operational expenditure (OPEX) (Sheils et al., 2012) or the multi-objective index (MOI) (Bastidas-Arteaga and Schoefs, 2015).
4.2 Uncertainty on Fick law parameters
The error of measurement affects the chloride profiles. As a consequence, the parameters of the Fick law are also affected and the error propagates with time when using this equation for chloride prediction. The aim of this section is to analyze this error by treating the profiles obtained for each operator of series 2. Note that the profiles are first built by using a nominal profile considering the mean value of each operator (Cnom in Eq. 3). Then, the parameters of the fitted Fick law are calculated and compared.
In order to evaluate the impact of measurement uncertainties on the Fick parameters, D, Cs, and Ci, the statistic properties are compared. The set (mean, μ; standard deviation, σ; coefficient of variation, CoV; and distribution law) obtained by TCD and NU-P are compared to the values obtained using the nominal profile: μnom, σnom, and CoVnom. First of all, regarding the pdf and according to the MLE, it is found that the parameters D and Cs follow a LOG-NORMAL distribution law, which is a consensual selection in the literature (Othmen et al., 2018; Clerc et al., 2019). It appears that the pdf of these parameters is not influenced by the measurement errors and is therefore independent of the operator. In addition, parameter Ci follows a rather asymmetrical distribution. However, because Ci is distributed on extremely low orders of magnitude, a good estimate of the distribution law is not reachable. Furthermore, the scatter of the distributed values has the same order of magnitude as the accuracy of the measurement devices, i.e., the standard deviation computed previously.
Table 5 provides the statistical estimates of the nominal profile for D, Cs, and Ci. The average values of diffusion coefficient and chloride content at the surface are, respectively, 0.686.10–12 m2/s and 0.0063 kg Cl−/kg concrete: these values are consistent with those obtained from similar structures, reviewed by Othmen et al. (2018), and ranged in the intervals [0.27∙10–12 to 5.13∙10–12] and [0.003–0.013] for D and Cs, respectively. Note that the chloride measurement error is reversed when looking at TCD when compared with that of NU-P because the mean value of measurements from the two operators is assumed to be the true value. This table also shows a significant coefficient of variation for Ci and Ds (around 50%) and a high coefficient of variation for Cs (around 80%) which is consistent with that reported in the literature (Othmen et al., 2018). The relative difference between TCD and NU-P values when compared with the nominal values are also reported in Table 5. They are computed as follows:
where X is μ σ or CoV.
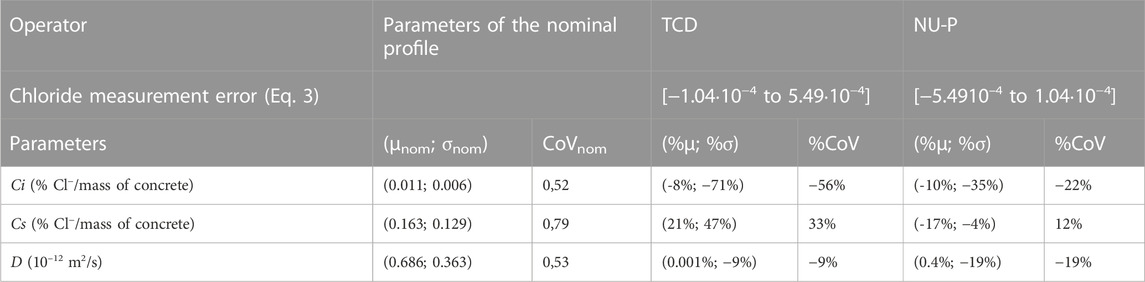
TABLE 5. Statistics of the D, Ci, and Cs of the two operators compared to those obtained by considering the average chloride (nominal value).
It is seen that the diffusion coefficient is well estimated in mean by one operator only and the standard deviation is always underestimated (from 9% to 19%). The concentration of chlorides at the surface is less estimated (around 20% of error) in mean and the error on the standard deviation is very significant (up to 47%). The larger error in the standard deviation concerns the initial concentration of chlorides (50% in mean but up to 71%). These errors on the standard deviation lead to a high error on the lifetime assessment. Focusing on the CoV for each of these parameters, it can be under- or overestimated and can reach 56%, which is a high value. These results highlight the sensitivity of the error to the operator and that repeated tests are required for providing an average value that could be used as a decision support. This issue is investigated in the next section.
5 Effect on diagnosis at time of inspection
As seen previously, the measurement errors propagate from the measurement phase to parameter determination phase of the Fick model. Thus, the uncertainties in the measurement of chloride levels in RC marine structures are likely to affect the reliability of their diagnosis at two levels:
• for the instantaneous diagnosis made on the basis of these measurements, and
• for future diagnoses based on the numerical prediction models, which depend on the parameters of the Fick model (D, Cs, or Ci) determined from the processing of these measurements. Here, we analyze this at the time when the measurements are performed.
Section 4.2 demonstrates that uncertainties in the prediction phase may lead to an underestimation or overestimation of the chloride profile. This can influence the reliability of future diagnostics on which future inspections and/or maintenance strategies will be based. If parameters are overestimated, the Fick law may lead to much earlier maintenance, unnecessary inspection, or repair costs. Of the opposite, when these parameters are underestimated, it can lead to late inspection, and long-term maintenance can be more severe and most certainly curative: changing the reinforcement of the RC that will be more expensive as predicted.
It is therefore proposed in this section to evaluate the impact of these uncertainties on instantaneous diagnosis. The probability of failure Pf according to corrosion initiation limit state (Eq. 7) is assessed by the procedure suggested by Bonnet et al. (2020).
where
• C (dc,t) is the chloride concentration computed through the Fick law at cover depth dc at time t, and
• Ccrit is the critical concentration of chloride leading to de-passivation. In the present study, it is 0.004375 Cl−/g of cement or 0.00072 g/g of concrete.
Note that Ccrit is modeled as a deterministic parameter. Indeed, there are in the literature different values for this threshold, varying according to several parameters, and its assessment is controversial (Angst et al., 2009). As a consequence, and for focusing only on the effect of the inspection results, the average value determined by Kenshel (2009) is used here.
Eq. 4 is used to assess whether the measurement uncertainties lead to poor decision-making (inappropriate maintenance or inspection work), in comparison with an analysis based on the nominal chloride levels in the concrete, as defined in Section 4.2. Pf is computed on the basis of the parameters of the Fick’s law computed from the profiles of TCD and NU-P and considering the average chloride levels.
Figure 8 plots the distribution of frequencies of the chloride content at the time of inspection and shows the failure region. The distribution shows an order of magnitudes of the Pf of 0.1, that is four times lower than the one obtained for structures exposed directly to the marine environment in the tide zone (Bastidas-Arteaga et al., 2011), that is, in line with the lower level of chlorides noticed in Section 3.1.
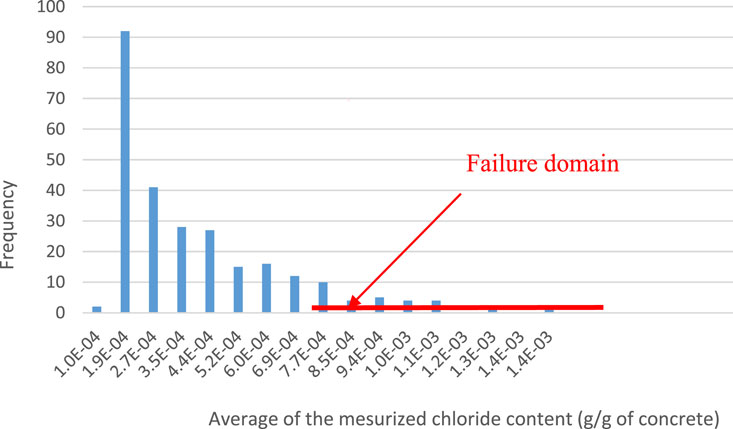
FIGURE 8. Presentation of the failure zone for average chloride contents.
Table 6 gives the probability of failure deduced from the three types of chloride content for all the measurements in depth; indeed the cover depth measured on the structure experienced values between 22 and 63 mm as reported by Kenshel (2009, p. 113). It can be seen that the probability of failure is sensitive to the type of chloride profile and experiences an increase of 7%–17%. This order of magnitude is significant when performing a risk-based inspection planning: for instance, according to the S-shape evolution of the probability of corrosion initiation obtained by Bastidas-Arteaga et al. (2011) that can lead to a preventive repair 3–4 years earlier than is necessary.
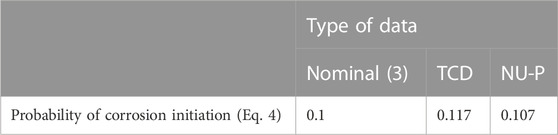
TABLE 6. Probability of corrosion initiation computed with the parameter of Fick’s law of the three profiles of the chloride content.
6 Conclusion
Today, most diagnostics of reinforced concrete structures in the marine environment are based on semi-destructive testing for the presence of salt in concrete cores. This multi-step process is complex, and the measurements are uncertain. Depending on the level of uncertainty, decisions based on the diagnosis can be affected: unnecessary repair or failure due to a missed repair. This study investigated the level of uncertainty for chloride profiles during on-site measurements by different operators from two laboratories and its effect on the diagnosis. The main conclusions are
- It is shown that the two protocols used by the operators in two laboratories do not lead to systematic bias, i.e., over-/underestimation of the chloride content.
- The error of measurement depends highly on the chloride content: the more the chloride content, the more the error until it reaches an asymptotic value.
- An analytical model of the standard deviation is provided.
- The error is shown to follow a t-location scale pdf whose parameters are provided as functions of the chloride nominal value.
- It is shown that the initial concentration Ci was highly affected by the use of a single operator, mainly because the initial chloride content is close to the accuracy of assessment.
- It is recommended that repeated tests with two operators be used to get the surface concentration of chloride which is a key parameter for chloride content prediction.
- It is shown that using a single operator leads to overestimation (approximately 10%) of the probability of corrosion at the time of inspection. This is very significant, especially when considering the efforts for getting these data. This result reinforces the previous recommendations.
Note that the conclusions remain valid mainly for structures built with a similar concrete in a similar environment (aerial chloride ingress in littoral areas), with similar range of chloride content. Because the measurements were carried out on a 27-year-old structure, the range of chloride content is wide and representative of a lot of infrastructures. Indeed, it has been shown that the uncertainty of measurement depends on the level of chlorides measured.
These results allow performing risk-based inspection in the presence of uncertainties of measurement according to the existing frameworks where an ageing model can propagate uncertainties on the chloride content.
Data availability statement
The original contributions presented in the study are included in the article/Supplementary Material; further inquiries can be directed to the corresponding author.
Author contributions
FS: supervisions, methodology, founding, paper improvement and finalization. AOC and SB, data assessment and treatment, review of the paper. KA: implementation of the method, analysis, writing of the draft of the paper.
Acknowledgments
The authors would like to thank the DuratiNet project (2009–2014) “Network durable transport infrastructure in the Atlantic area.” Funds were provided by grants from ERDF for the European Union, program Interreg III B. The authors thank also the projects JUNIC, SIMAR and I2M@PORT for their support with the founding of Région Pays de la Loire, Carene, les ports de Loire Atlantique, WEAMEC and Nantes Université. The authors are grateful to Mr. Michel Roche, technician of GeM Laboratory and M. Priou and Grondin, MSc students for their engagement in the tests and to Denis Konan and Romeo Gnan-Kouassi for their support during Travaux-MERCI project.
Conflict of interest
The authors declare that the research was conducted in the absence of any commercial or financial relationships that could be construed as a potential conflict of interest.
Publisher’s note
All claims expressed in this article are solely those of the authors and do not necessarily represent those of their affiliated organizations, or those of the publisher, editors, and reviewers. Any product that may be evaluated in this article, or claim that may be made by its manufacturer, is not guaranteed or endorsed by the publisher.
References
Angst, U., Elsener, B., Larsen, C. K., and Venneslanda, Ø. (2009). Critical chloride content in reinforced concrete—A review. Cem. Concr. Res. 39(12), 1122–1138. doi:10.1016/j.cemconres.2009.08.006
Bastidas-Arteaga, E., Chateauneuf, A., Sanchez-Silva, M., Bressolette, P., and Schoefs, F. (2011). A comprehensive probabilistic model of chloride ingress in unsaturated concrete. Eng. Struct. 33, 720–730. doi:10.1016/j.engstruct.2010.11.008
Bastidas-Arteaga, E., and Schoefs, F. (2012). Stochastic improvement of inspection and maintenance of corroding reinforced concrete structures placed in unsaturated environments. Eng. Struct. 41, 50–62. doi:10.1016/10.1016/j.engstruct.2012.03.011
Bastidas-Arteaga, E., and Schoefs, F. (2015). Sustainable maintenance and repair of RC coastal structures. Proc. Institution Civ. Eng. - Marit. Eng. 168 (4), 162–173. doi:10.1680/jmaen.14.00018
Biondi, L., Perry, M., McAlorum, J., Vlachakis, C., Hamilton, A., and Lo, G. (2021). Alkali-activated cement sensors for sodium chloride monitoring. IEEE Sensors J. 21 (19), 21197–21204. doi:10.1109/JSEN.2021.3100582
Boero, J., Schoefs, F., Capra, B., and Rouxel, N. (2009a). Technical management of French harbour structures - Part 1: Description of built assets. Rev. Paralia 2 (0), 6.1–6.11. doi:10.5150/revue-paralia.2009.006
Boero, J., Schoefs, F., Capra, B., and Rouxel, N. (2009b). Technical management of French harbour structures - Part 2: Current practices, needs – experience feedback of owners. Rev. Paralia 2, 7.1–7.12. doi:10.5150/revue-paralia.2009.007
Bonnet, S., and Balayssac, J. P. (2018). Combination of the Wenner resistivimeter and Torrent permeameter methods for assessing carbonation depth and saturation level of concrete. Constr. Build. Mater. 188, 1149–1165. doi:10.1016/j.conbuildmat.2018.07.151
Bonnet, S., Schoefs, F., and Salta, M. (2020). Sources of uncertainties for total chloride profile measurements in concrete: Quantization and impact on probability assessment of corrosion initiation. Eur. J. Environ. Civ. Eng. 24 (2), 232–247. doi:10.1080/19648189.2017.1375997
Bourreau, L., Bouteiller, V., Gaillet, L., Schoefs, F., Thauvin, B., Schneider, J., et al. (2020). Spatial identification of exposure zones of concrete structures exposed to a marine environment with respect to reinforcement corrosion. Struct. Infrastructure Eng. 16, 346–354. doi:10.1080/15732479.2019.1655072
Bourreau, L., Bouteiller, V., Schoefs, F., Gaillet, L., Thauvin, B., Schneider, J., et al. (2019). Uncertainty assessment of concrete electrical resistivity measurements on a coastal bridge. Struct. Infrastructure Eng. 15 (4), 443–453. doi:10.1080/15732479.2018.1557703
Clerc, R., Oumouni, M., and Schoefs, F. (2019). SCAP-1D: A spatial correlation assessment procedure from unidimensional discrete data. Reliab. Eng. Syst. Saf. 191, 106498. doi:10.1016/j.ress.2019.106498
Dhir, R. K., Jones, M. R., and Ahmed, H. E. H. (1990). Determination of total and soluble chlorides in concrete. Cem. Concr. Res. 20 (4), 579–590. doi:10.1016/0008-8846(90)90100-C
Faber, M. H. (2002). Risk-based inspection: The framework. Struct. Eng. Int. 12 (3), 186–195. doi:10.2749/101686602777965388
Fares, M., Villain, G., Bonnet, S., Palma Lopes, S., Thauvin, B., and Thiery, M. (2018). Determining chloride content profiles in concrete using an electrical resistivity tomography device. Cem. Concr. Compos. 94, 315–326.
Hamidane, H., Chateauneuf, A., Messabhia, A., and Ababneh, A. (2020). Reliability analysis of corrosion initiation in reinforced concrete structures subjected to chlorides in presence of epistemic uncertainties. Struct. Saf. 86, 101976. doi:10.1016/j.strusafe.2020.101976
Hinrichs, W. (2012). The content of chlorides in concrete designs: A probabilistic approach to compliance assessment with due regard to the measurement uncertainty. Accreditation Qual. Assur. 17, 167–175. doi:10.1007/s00769-011-0831-9
Hunkeler, F., Ungricht, H., and Deillon, F. (2000). Investigations on the determination of chlorides in concrete and performance of an interlaboratory comparison in two steps (in German, with a two-page summary in English). Wildegg (Switzerland): Technische Forschung und Beratung für Zement und Beton.
Jin, M., Ma, Y. F., Zeng, H. Y., Liu, J. P., Jiang, L. H., Yang, G., et al. (2020). Developing a multi-element sensor to non-destructively monitor several fundamental parameters related to concrete durability. Sensors 20, 5607. doi:10.3390/s20195607
Kenshel, O. M. (2009). Influence on spatial variability on whole life management of reinforced concrete bridges. PhD Thesis, Dublin: Trinity College.
Lecieux, Y., Rozière, E., Gaillard, V., Lupi, C., Leduc, D., Nu-P, J., et al. (2019). Monitoring of a reinforced concrete wharf using structural health monitoring system and material testing. J. Mar. Sci. Eng. 7 (4), 84. doi:10.3390/jmse7040084
Lecieux, Y., Schoefs, F., Bonnet, S., Lecieux, T., and Lopes, S. P. (2015). Quantification and uncertainty analysis of a structural monitoring device: Detection of chloride in concrete using DC electrical resistivity measurement. Nondestruct. Test. Eval. 30 (3), 216–232. doi:10.1080/10589759.2015.1029476
Mejlbro, L. (1996). “The complete solution of Fick’s second law of diffusion with time-dependent diffusion coefficient and surface concentration,” in Durability of concrete in saline environment (Sweden: Springer), 127–158.
O'Connor, A., and Kenshel, O. M. (2013). Experimental evaluation of the scale of fluctuation for spatial variability modeling of chloride-induced reinforced concrete corrosion. J. Bridge Eng. 18, 3–14. doi:10.1061/(asce)be.1943-5592.0000370
Othmen, I., Bonnet, S., and Schoefs, F. (2018). Statistical investigation of different analysis methods for chloride profiles within a real structure in a marine environment. Ocean. Eng. 157, 96–107. doi:10.1016/j.oceaneng.2018.03.040
Oumouni, M., and Schoefs, F. (2021). Spatial variability assessment of structures from adaptive NDT measurements. Struct. Saf. 89, 102052. doi:10.1016/j.strusafe.2020.102052
Priou, J., Lecieux, Y., Chevreuil, M., Gaillard, V., Lupi, C., Leduc, D., et al. (2019). In situ DC electrical resistivity mapping performed in a reinforced concrete wharf using embedded sensors. Constr. Build. Mater. 211, 244–260. doi:10.1016/j.conbuildmat.2019.03.152
Rakotovao Ravahatra, N., Bastidas-Arteaga, E., Schoefs, F., De Larrard, T., and Duprat, F. (2019). Probabilistic and sensitivity analysis of analytical models of corrosion onset for reinforced concrete structures. Eur. J. Environ. Civ. Eng. 25, 1665–1694. doi:10.1080/19648189.2019.1591307
Schoefs, F., Bastidas-Arteaga, E., Tran, T. V., Villain, G., and Derobert, X. (2016). Characterization of random fields from NDT measurements: A two stages procedure”, Eng. Struct. 111, 312–322. doi:10.1016/j.engstruct.2015.11.041
Schoefs, F., Boéro, J., Clément, A., and Capra, B. (2012). The αδ method for modelling expert judgment and combination of NDT tools in RBI context: Application to marine structures. Struct. Infrastructure Eng. 8, 531–543. doi:10.1080/15732479.2010.505374
Schoefs, F., Clément, A., and Nouy, A. (2009). Assessment of spatially dependent ROC curves for inspection of random fields of defects, S. tructural Saf. 31 (5), 409–419. doi:10.1016/j.strusafe.2009.01.004
Schoefs, F., Oumouni, M., Follut, D., Lecieux, Y., Gaillard, V., Lupi, C., et al. (2022). Added value of monitoring for the maintenance of a reinforced concrete wharf with spatial variability of chloride content: A practical implementation. Struct. Infrastructure Eng. 2022, 2077767. doi:10.1080/15732479.2022.2077767
Setzer, M. (2002). Rilem TC 178-TMC: 'Testing and modelling chloride penetration in concrete'Analysis of total chloride content in concrete. Mater. Struct. 35, 583–585. doi:10.1617/13840
Sheils, E., O’Connor, A., Schoefs, F., and Breysse, D. (2012). Investigation of the effect of the quality of inspection techniques on the optimal inspection interval for structures. Struct. Infrastructure Eng. 8, 557–568. doi:10.1080/15732479.2010.505377
Sørensen, J. D., and Faber, M. H. (2002). Codified risk-based inspection planning. Struct. Eng. Int. 12 (3), 195–199. doi:10.2749/101686602777965298
Stewart, M. G., and Val, D. V. (2003). Multiple limit states and expected failure costs for deteriorating reinforced concrete bridges. J. Bridge Eng. 8 (6), 405–415. doi:10.1061/(asce)1084-0702(2003)8:6(405)
Straub, D., and Faber, M-H. (2005). Risk based inspection planning for structural systems. Struct. Saf. 27 (4), 335–355. doi:10.1016/j.strusafe.2005.04.001
Torres-Luque, M., Bastidas-Arteaga, E., Schoefs, F., Sanchez-Silva, M., and Osma, J. F. (2014). Non-destructive methods for measuring chloride ingress into concrete: State-of-the-art and future challenges. Constr. Build. Mater. 68, 68–81. doi:10.1016/j.conbuildmat.2014.06.009
Tran, T. B., Bastidas-Arteaga, E., and Schoefs, F. (2016). Improved Bayesian network configurations for random variable identification of concrete chlorination models. Material Struct. 49 (11), 4705–4718. doi:10.1617/s11527-016-0818-4
Vennesland, O., Climent, M.-A., and Andrade, C. (2013). Recommendation of RILEM TC 178-TMC: Testing and modelling chloride penetration in concrete. Methods for obtaining dust samples by means of grinding concrete in order to determine the chloride concentration profile. Mater. Struct.: RILEM Technical Committee 46 (3), 337–344.
Keywords: coastal, infrastructures, concrete, chloride, inspection, maintenance, uncertainty, modeling
Citation: Schoefs F, Awa Zahui Raissa K, Bonnet S and O’Conor AJ (2023) Uncertainty quantification of semi-destructive testing for chloride content assessment for a concrete bridge in maritime environment. Front. Built Environ. 9:1130066. doi: 10.3389/fbuil.2023.1130066
Received: 22 December 2022; Accepted: 30 March 2023;
Published: 21 April 2023.
Edited by:
Jaan H. Pu, University of Bradford, United KingdomReviewed by:
Amir Ghaderi, Urmia University, IranAlfrendo Satyanaga, Nazarbayev University, Kazakhstan
Copyright © 2023 Schoefs, Awa Zahui Raissa, Bonnet and O’Conor. This is an open-access article distributed under the terms of the Creative Commons Attribution License (CC BY). The use, distribution or reproduction in other forums is permitted, provided the original author(s) and the copyright owner(s) are credited and that the original publication in this journal is cited, in accordance with accepted academic practice. No use, distribution or reproduction is permitted which does not comply with these terms.
*Correspondence: Franck Schoefs, ZnJhbmNrLnNjaG9lZnNAdW5pdi1uYW50ZXMuZnI=