 M. El Amrousi
 M. Elhakeem2
- 1Department of Architecture, Abu Dhabi University, Abu Dhabi, United Arab Emirates
- 2Department of Civil Engineering, Abu Dhabi University, Abu Dhabi, United Arab Emirates
- 3Project Management Program, Abu Dhabi University, Abu Dhabi, United Arab Emirates
Labor housing projects in many Gulf countries are located in less favorable sites in the desert hinterland. They are characterized by grid-based compositions, simple facades, and block buildings positioned on the outskirts of cities. This development type was implemented in the industrial sector of Abu Dhabi, known as Mussafah. Gradually, this industrial area redeveloped its urban fabric by transforming many of its buildings into mixed-use structures with small gardens that provide open air spaces to the community and promote social interaction. Interventions from the community via introducing small garden stock increased the sense of belonging, improved the urban fabric, and reduced sand movement in the area. This is important in the Gulf region’s desert environment, which gives rise to sandstorms. This study evaluates the amount and distribution of sand around a selected group of buildings in the Mussafah area through experimental work. The methodology involves a coupled air and sand experiment in an environmental wind tunnel. The experiments have shown that adding a fence around the small gardens of the buildings in Mussafah reduced the sand pollution effects significantly.
1 Introduction
Pre-petroleum urban enclaves in the Gulf region are scarce. The lack of a coherent fabric of built heritage in Abu Dhabi from the pre-petroleum era made it difficult to use local precedents to create the modern city (Menoret, 2014). Modern Abu Dhabi, which dates to the late 1960s, was planned to reflect many of the principles of “Modernism,” which gave emphasis on functionality and a minimalistic approach to the use of materials (Anderson, 1977). This was manifested through the grid street pattern and the construction of superblocks and pragmatic concrete towers as the building stock of the downtown area (Damluji, 2006). Le Corbusier’s principles in La Ville Radieuse influenced the planning of Abu Dhabi. These principles not only aimed to increase the urban capacity of the modern city but also advocated an improved urban environment and the efficiency of the “Modern” city (Le Corbusier, 1967). These design principles became models for architects planning Abu Dhabi, such as Katsuhiko Takahashi, one of the leaders in the creation of Abu Dhabi’s Master Plan in the 1960s, and a strong advocate of Le Corbusier (Montavon el al, 2006). The 1962 masterplan of Abu Dhabi located the industrial areas along with the power station, port, and desalination plant along the entrance to the East Creek. Later plans of Abu Dhabi from 1966 onward placed the industrial zones further east with a gridiron network of roads/zoning beginning to separate the different parts and activities of the city. The 1968 masterplan by Abdelrahamn Makhlouf onward shows that a shift in the main industrial area has materialized toward the desert hinterland, where it is currently located (Bani Hashim, 2018). Despite Abu Dhabi’s pragmatic gridiron plan, wide streets and block buildings in the main archipelago included several large gardens, such as Capital Park, Family Park, Dolphin Park, Geneve Garden, Al Mushrif Garden, Umm Al Emarat Park, and Khalidiyah Park. However, no such gardens were planned for Mussafah. Open spaces where workers gather for sporting activities are “informal” open areas, often used as cricket fields by the Indo-Pakistani community.
Ignoring labor housing’s much-needed urban infrastructure can lead to decline, as exemplified by the Pruitt–Igoe project, where economic/engineering decisions dictated a Modernist unified block design, eventually leading to decline and demolition (Modern Architecture’s Death in St Louis Missouri in 1972) (Bristol, 1991; Jencks, 1991; Mechlenborg, 2019; Perez et al., 2022). In the last decade, new policies and guidelines have been developed, aiming to improve the design and living conditions of workers. The upgrading of local amenities was part of the revitalization of public spaces to foster a sense of belonging to the community (Sahraiyan and Tümer, 2017). Abu Dhabi’s recent policies and investment in green areas and cultural institutions/spaces of gathering further changed the perception of residents living in a transit city to residents with a sense of belonging. Urban landscapes in Abu Dhabi are evolving in the form of jogging tracks and cycling paths along the Corniche and the Eastern Mangroves waterfront in addition to new parks such as the Al-Reem Park and the Al-Jubail Mangrove Park.
These new urban landscapes are part of the Abu Dhabi (2030) plan to promote healthier living and better adaptation to the environment manifested via green corridors and sustainable growth (Plan Abu Dhabi, 2030). In recent years, a strong drive has been raised for environmentally responsive landscape use of native plants (Hung and Peng, 2017). Municipal authorities are focusing more on water conservation landscapes in all government-funded projects. Abu Dhabi’s “Estidama” Pearl Rating system (PRS) further accentuates the ecological values of planting native or adaptive species by offering credit points for planting diversified types of species, including native and adaptive saline-tolerant species (Yagoub, 2014; Alam et al., 2017). The objective of this study is to highlight the importance of community gardens in low-cost housing in industrial neighborhoods as a tool to improve social cohesion and as a means of controlling sand movement in a desert environment, which has repercussions for urban integrity and public health.
2 Mussafah—Abu Dhabi’s industrial area
The Mussafah industrial area in the desert hinterland of Abu Dhabi, United Arab Emirates (UAE), represents an example where workers’ compounds have been built with functionality and pragmatism governing their design. This industrial city is essential to house the workers that support the large construction industry, which contributes about 9.4% (or about 23 billion USD) of the Emirate of Abu Dhabi’s GDP (Statista, 2021). The Mussafah area includes industrial zones with factories and workshops, as well as large workers’ camps where service laborers reside. The area is organized by zoning based on the type of industrial activity. Thus, placement of factories, small industries, car agencies, and maintenance workshops is organized according to zoning principles. The overall plan is dominated by a grid street pattern and a freeway that provides quick access to other regions and separates the industrial area from other, mostly residential-dominated areas. This grid street pattern is not only found in the Mussafah area but is also the dominant pattern of the city of Abu Dhabi as a whole. Mussafah’s industrial neighborhoods house many of the city’s blue-collar workers, taxi drivers, security guards, and other service sector employees. The large labor force in Abu Dhabi is segregated by activity in the form of construction workers living in Mussafah Sanaiya and service sector workers housed in Mussafah Shabiya (Connell and Burgess, 2011). The most prominent labor city in Mussafah Sanaiya is Industrial City Abu Dhabi or ICAD. Here, housing projects are in the form of large rectangular structures within a walled enclosure with recently introduced facilities, such as the ICAD mall (Figure 1A). The scale of the ICAD is massive and bears the same attributes of the low-cost/industrial housing projects.
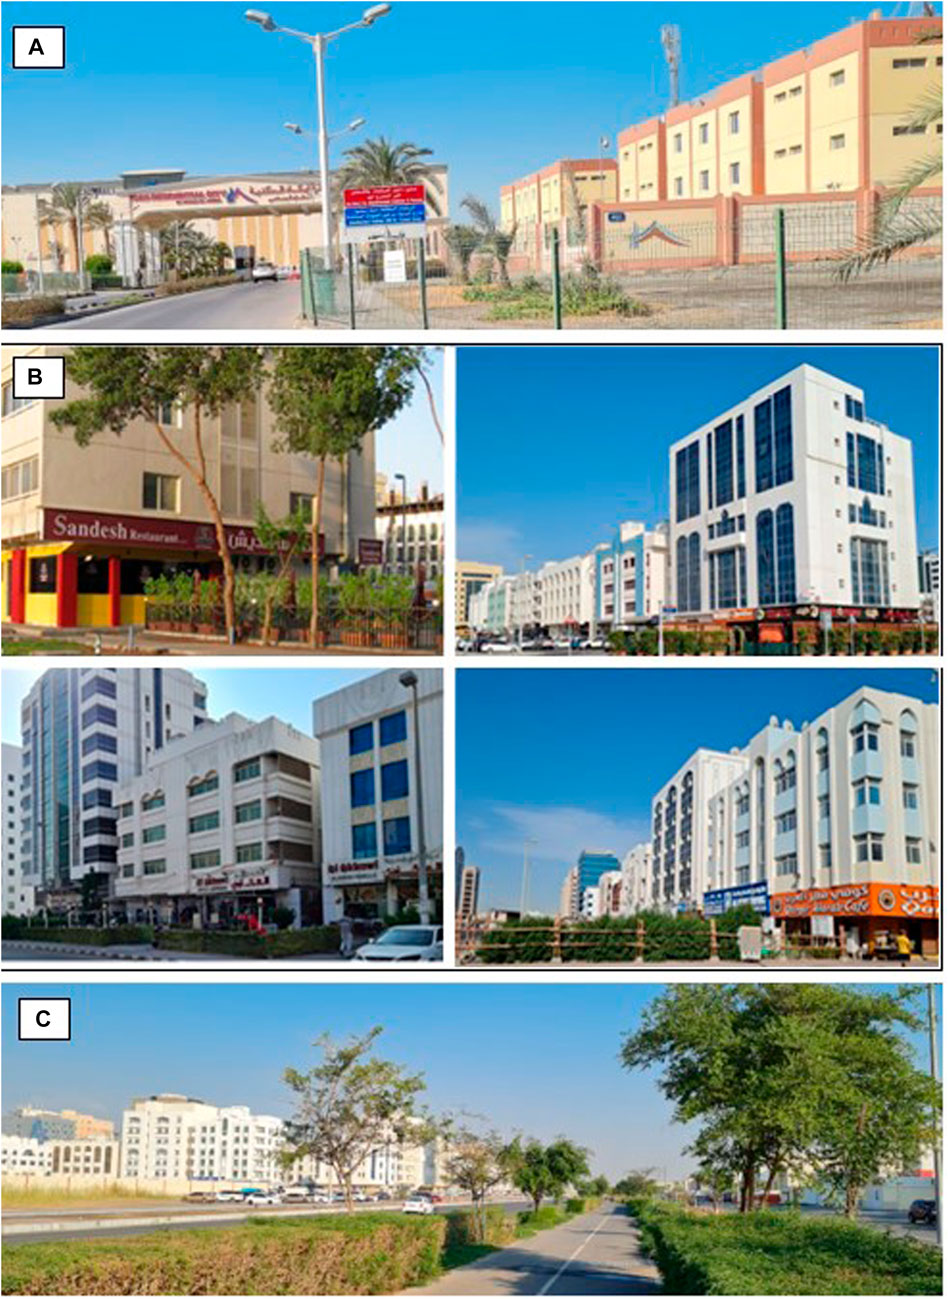
FIGURE 1. Musaffah: (A) the Industrial City of Abu Dhabi (ICAD); (B) different generations of buildings displaying alternative façade treatments and localized gardens; (C) green walkways and jogging and cycling paths leading to bus stops and public transit hubs (photographs by authors).
The recent improvements in Mussafah Shabiya can be attributed to Abu Dhabi’s Executive Council, which began to develop a master plan for Mussafah in 2016 known as the Future Vision of Mussafah. This is part of a decade-long transformation of the broader area that included both labor housing projects and the whole industrial area (Dennehy, 2017). Mussafah’s developments included a new public garden, installation of light posts and security cameras, street names, enhancement of the transport network, and recreational spaces (Lovell et al., 2014). Older-generation buildings (ground floor + mezzanine +three floors) are being gradually replaced with better-built, taller building blocks (G + M+7; 27–30 m high), many of which include coffee shops, restaurants, and small fenced gardens in front. The conversion of ground floors of buildings into coffee shops surrounded by gardens and small fences (Figure 1B) occurred as a result of improving economic conditions in the broader area and the development of residential neighborhoods of Mussafah (Pasha et al., 2021). Developments by local municipalities led to upgrading the infrastructure in Mussafah, which encouraged the community to upgrade the existing building stock, which, in turn, led to better living conditions and an improved sense of collective ownership (Ng et al., 2011; El Amrousi et al., 2019).
Emerging urban landscapes with jogging tracks, trees, and cycling paths in Mussafah (Figure 1C) have created an urban ecological environment that supports residents’ health and well-being through venues for physical activity (Xiao et al., 2020; Afrin et al., 2021; Tan et al., 2021). They also assist in temperature amelioration, especially from the high 40°C temperatures experienced in summer, and provide the benefits of a healthier lifestyle and a sense of identity for the community (Anderson, 1977; Lin et al., 2018; Boros and Mahmoud, 2020; Olivetti, 2022). Introducing such landscape elements in industrial neighborhoods enhances public health and quality of life for its residents (Chiesura, 2004; Mekala et al., 2015). Furthermore, these elements improve outdoor and indoor air quality and reduce noise pollution (Hung and Peng, 2017). Among the challenges of the urban landscape is deciding on the optimal allotment and management of different land use alternatives and types of greenery (Keshtkaran, 2019). Exploring how urban landscape solutions can serve important social functions of communities is key to retaining sustainable urban areas and urban parks (Fernández Águeda, 2009; Lu et al., 2017). Creating new urban landscape patterns not only enhances the identity of urban space but also has the potential to reduce pollutants through filtration while also regulating microclimatic conditions (Wheeler, 2004; Taylor, 2007; Hall, 2008).
3 Sandstorms in urban areas
Sand and dust storms are natural phenomena that occur on a large scale worldwide. They are active in drylands, which constitute about half of the world’s land area (Awadh, 2023). Sandstorms occur when unchecked, strong, or turbulent winds combine with exposed, dry, loose-soil surfaces. Sandstorms, which are common in semi-arid and arid regions, cause serious environmental problems as a result of strong dry wind blowing over the desert that raises and carries clouds of sand or dust (UNEP, WMO, UNCCD, 2016). It is important to minimize the impacts of sandstorms with early warning systems and regional cooperation. Sandstorms can be tracked using a combination of satellite imagery, ground monitoring observations, and numerical modeling. Dust emission increases over the Arabian Peninsula throughout the spring months as the surface dries, and the near-surface wind speed strengthens. In the United Arab Emirates, the sand dunes of the Rub’ al Khali sandy desert, notably in the Sabkha Matti, which extends from the Emirates into Saudi Arabia, provide a source of sand that sandblasts the surface to generate dust storms. In the UAE and Abu Dhabi, the Shamal winds blow from the northwest, as indicated in the wind rose diagram (Figure 2A) and generate dust and sandstorms throughout the year. The higher dust loadings are in late spring and fall (Francis et al., 2022), with the impact of the Shamal winds being more pronounced in urbanized areas (Ng et al., 2011 Kallos et al., 2014; Kallos and Qahtani, 2020). The impacts of sandstorms are more visible in urban areas where they can cause damage to infrastructure, interrupt transport and communication systems, and cause road traffic accidents. The effect of sandstorms and sand movement is especially visible in areas of affordable housing for lower-income communities, especially in industrial city sections such as Mussafah (Cakmak, 2014).
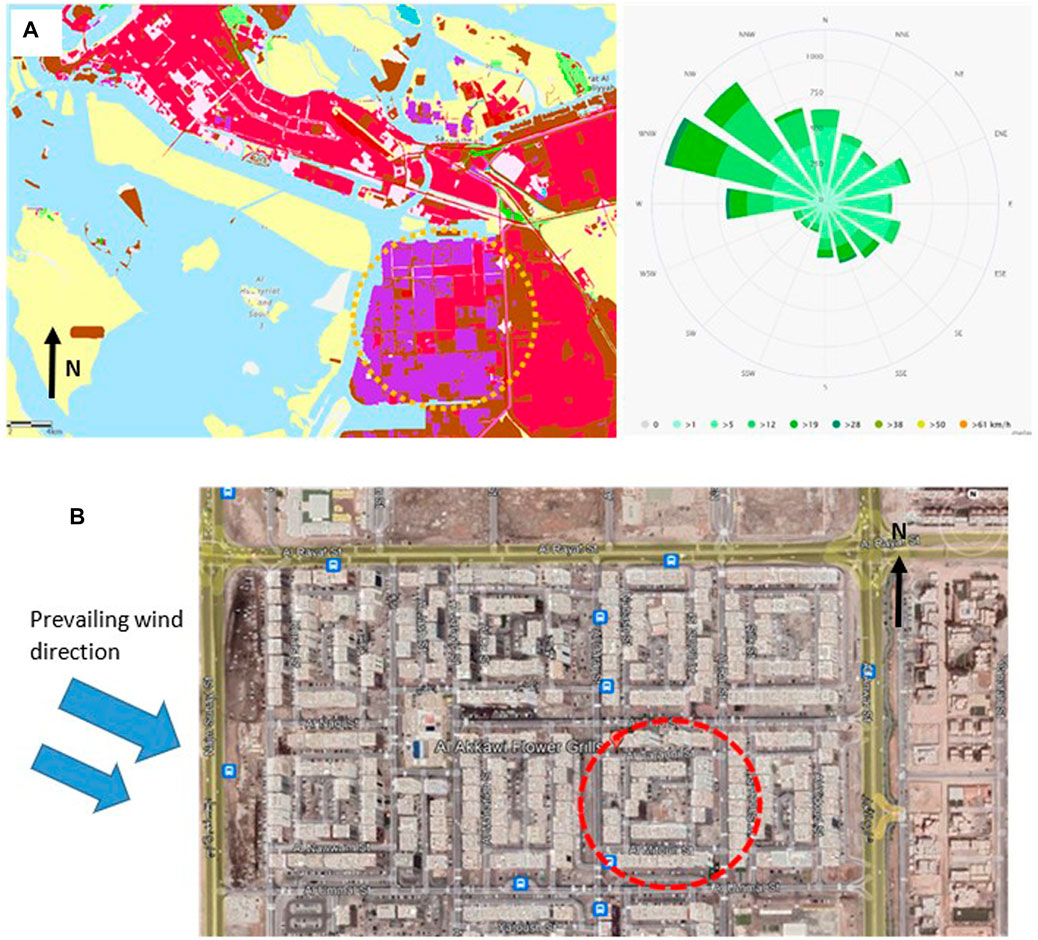
FIGURE 2. Study site and prevailing wind: (A) purple indicates the industrial areas in Mussafah; red indicates the mixed-use commercial–residential areas. It can be seen from the wind rose that the maximum wind speed is about 30 km/h approaching Mussafah from the WNW (Source: addata.gov.ae); (B) grid street pattern and superblock urban fabric in the Mussafah Shabiya area and prevailing wind direction (GoogleEarth).
Urban landscapes enhance the aesthetics of urban spaces in industrial neighborhoods and act as protective measures against sandstorms via natural elements, such as trees, shrubs, and vegetation that stabilize the soil. Protection measures include retaining diverse vegetation and minimizing soil or vegetation disturbance in areas where soil types are especially susceptible to wind erosion. When linked to urban landscaping and ameliorative measures, trees as shelterbelts are effective in reducing the impact of dust transportation. Their effectiveness depends on several factors, such as tree type, shape of their crown, spacing, and distancing. Along with trees, hedges bordering jogging tracks (Figure 1C) are effective in protecting the tracks from adverse climatic conditions, in particular sand movement (Abdegalieva and Zaykova, 2016). Windbreaks and shelterbelts deployed at the correct angles and covering sand dunes with mulch can reduce sand deposition in addition to reducing wind erosion in areas behind a fence (Middleton and Kang, 2017). Urban landscapes offer several windbreak options, such as linear arrangements of trees and shrubs around buildings and along roadsides. Furthermore, they offer venues of mitigation/adaptation and potential buffering against sandstorms (Yang and Wang, 2017). On a larger scale, sustaining landscapes are largely influenced by policymakers and urban planners via decisions intended to conserve natural resources and water-conserving irrigation technologies (Martin, 2008). Urban landscapes and community gardens are essential to improve public health and protect against sandstorms in industrial areas. Toward the latter goal, our study highlights the effect of fenced gardens in reducing the effect of sand pollution at the pedestrian level through mixed airflow and sand laboratory experiments. This study quantifies the amount of moved sand and the fence effect and highlights the important potential of garden fences to reduce sandstorm pollution effects in desert environments.
4 Methodology
The methodology involves a coupled air and sand experiment in an environmental wind tunnel. Figure 2 shows the study site along with the wind rose at the site. The maximum wind speed is about 30 km/h, and the prevailing wind approaches the study site from the west-north-west. At the pedestrian level, the wind speed can drop to 18–22 km/h. In designing the wind experiment, we simplified the complex random arrangement of the buildings in Mussafah into a uniform array of buildings (Figure 3A). Due to the dimensions of the wind tunnel, we assumed that the prevailing wind approaches the buildings from the west rather than the west-north-west.
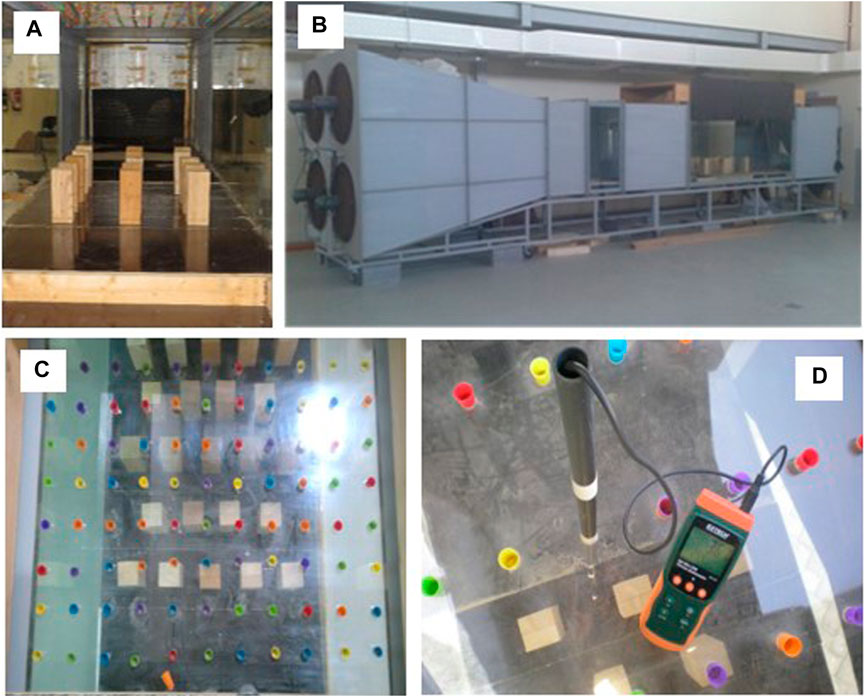
FIGURE 3. Experimental setup: (A) block array arrangement; (B) environmental wind tunnel; (C) holes in the top acrylic sheet and plastic stoppers; (D) hotwire anemometer and data logger.
The experimental setup includes an environmental wind tunnel and a hotwire anemometer. The experiments were conducted in a wind tunnel designed, built, and calibrated at Abu Dhabi University. The wind tunnel is 8.4 m long and made from galvanized steel and acrylic panels. The cross section of the tunnel at the entrance is 2.4 × 2.4 m and reduces to 1.2 × 1.2 m at the test section via a funnel that has a length of 2.4 m and horizontal:vertical side slopes of 5:1. At the wind tunnel entrance, the bed was made rough, and a honeycomb was placed to ensure straightening of the air streamflow and the full development of the turbulent boundary layer. The test section is made from acrylic panels on both sides and the top for ease of monitoring. It has a length of 2.4 m and is 1.2 m from the wind tunnel exit. The top acrylic sheet of the test section has a total of 253 holes with a diameter of 2 cm, distributed at intervals of 10 cm along the transverse and longitudinal directions of the wind tunnel for data collection (Figure 3). The holes are closed with plastic stoppers that can be removed to insert a hotwire for velocity and airflow measurements. The holes in the top acrylic sheet are accessible via a wooden bridge over the test section. The floor of the wind tunnel was lined with 10 wooden platforms serving different purposes. Some of them were for placing and securing the building models or leveling the floor, while others served as sand feeders and sand traps. In the aerodynamic runs (with no sand), the sand feeder and sand trap platforms were flipped. All the wooden platforms sit flush with each other. Wind was generated at the entrance of the tunnel using four mounted industrial pedestal fans manufactured by IGMA. Each has a diameter of 0.76 m, a rating power of 290 W, and a maximum speed of 1,400 rpm. This corresponds to an airflow rate of 5.223 m3/s and an average velocity of 4.1 m/s. Air velocity was measured with a hotwire anemometer model SDL350 manufactured by EXTECH (Figure 3). The hotwire has a telescoping probe of a length of 1.5 m and diameter of 1.25 cm, which allows taking velocity measurements at various depths inside the wind tunnel. The data logger has a selectable data sampling rate of 1–3,600 s, with a built-in memory card that allows data to be stored and transferred to a computer in the form of an MS Excel file. The data logger reading range is 0.2–25 m/s with an accuracy of ±5 (Elhakeem et al., 2013).
Several experimental runs were conducted in the environmental wind tunnel (Figure 3) using physical models in the form of wooden blocks. The dimensions of the blocks were 10 × 10 × 25 cm. The spacing between the buildings was 15 cm in the longitudinal direction and 22 cm in the transverse direction (Figure 4). Two sets of experiments were conducted in the environmental wind tunnel. The first set involves aerodynamic experimental runs without sand. The aerodynamic experiments were conducted first to describe the airflow pattern around the blocks. They were followed by sand experiments to investigate the formation of sand patches around the blocks. Detailed velocity measurements were collected using a hotwire. Because of the symmetrical arrangement of the buildings along the y-axis (Figure 4), the measurements were taken only at half of the model section. Figure 4 shows a plan view of the locations where the velocity measurements were taken. Seven velocity measurements were taken at different heights at each location around the blocks to predict the velocity distribution at each elevation. Three velocity measurements were taken above the simulated buildings.
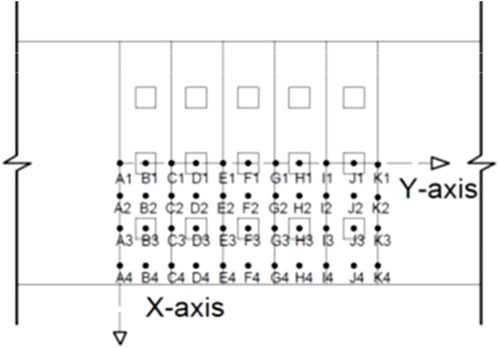
FIGURE 4. Plan view for the locations where the velocity measurements were taken. Note that the spacing in the x direction is 22 cm and the spacing in the y direction is 15 cm.
For the aerodynamic experimental runs, the proposed physical buildings were placed in the model section. Then, the fans were switched on at the full speed of 1,400 rpm, and detailed velocity measurements were collected in each run using the hotwire. To take the measurements at a desired location, the hotwire was inserted from the top through the holes in the top acrylic sheet. The readings were recorded at different heights, and the hotwire was then moved to the next location. The recorded measurements were stored in the digital anemometer’s memory card and later transferred to a computer. The procedure was the same for the sand experimental runs, where the proposed fences were placed in the model section, and a 2-cm layer of the experimental sand was placed in front of the buildings. Enough sand was placed to feed the model section as the runs were expected to last for several hours. Additional sand was added to the sediment feeder during the runs, if needed. The fans were switched on at the full speed of 1,400 rpm and ran until the sand patches around the buildings reached a quasi-equilibrium condition when their shapes no longer changed considerably. The duration of the runs was about 7–9 h to reach the equilibrium condition. Pictures were taken periodically during the run to record the sand patch patterns around the buildings and the fence. After completing each run, the fans were stopped, and the sand around the buildings and in the sediment trap downstream of the buildings was collected via a vacuum cleaner and weighed. The wind tunnel was cleaned of sand before the start of the next run.
5 Results
In this section, the aerodynamic experiments are presented by first describing the airflow pattern around the buildings, followed by the sand experiments and the sand patches formed around the buildings. The different runs were conducted with a constant airflow rate of 7.462 m3/s and a mean air velocity of 5.86 m/s (21 km/h). This air velocity corresponds to the wind speed at the pedestrian level in the study site. Table 1 shows the collected velocity measurements around and above the blocks, while Figure 5 shows contour maps for the velocity distribution around the blocks at heights of 3.0 and 8.0 cm above the bed and above the buildings at heights of 27.0 and 40.0 cm above the bed. The pink squares in Figures 5A, B show the location of the simulated buildings in the wind tunnel testing section. These pink squares disappear in Figures 5C, D because the measurements were taken above the buildings. The figure shows high-velocity values between the building in the transverse direction and very low-velocity values in the airflow direction (Figures 5A, B). The low velocity is common in the wake region behind the buildings. Above the buildings, there is less variability in the velocity magnitude because there is no retarding effect from the buildings. As can be seen from the figures, a complex airflow pattern developed between buildings compared to the pattern formed above the building. One limitation to the aerodynamic results is that the flow in the wind tunnel is unidirectional, while, in reality, it changes with time. Therefore, although Figure 5 provides useful information about the airflow pattern around the building, the experimental airflow may deviate from the airflow on the physical site. Nonetheless, the model experiments have given a- better understanding of the airflow–structure (buildings) interaction.

TABLE 1. Summary of the aerodynamic experimental results.
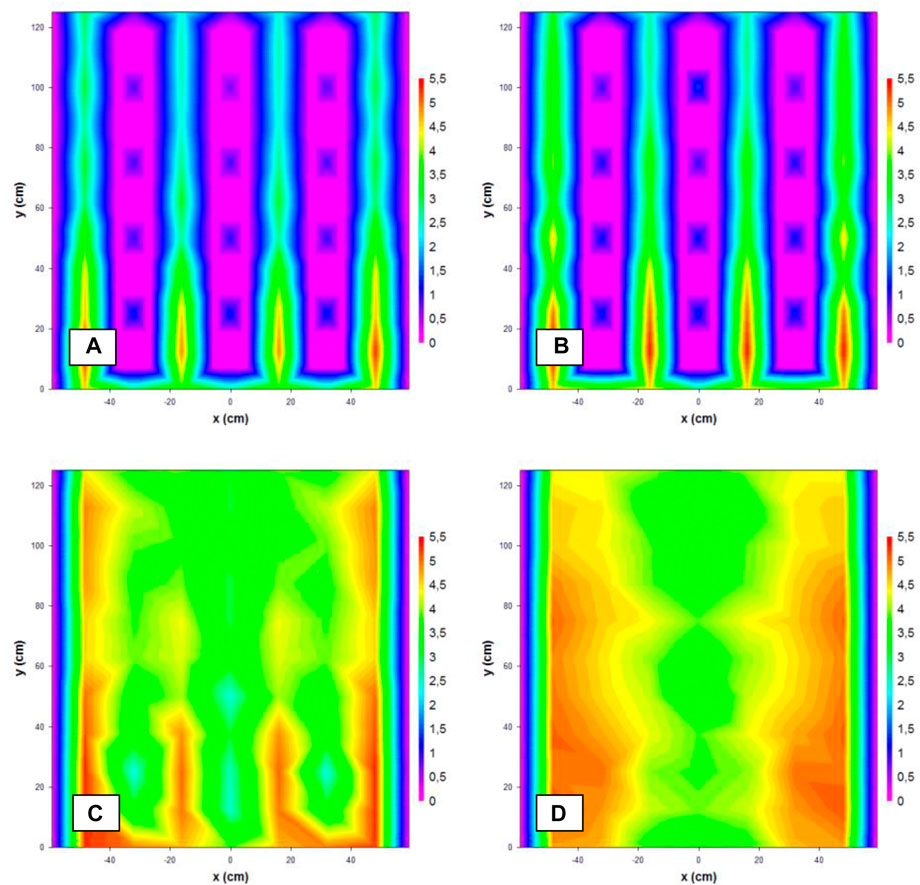
FIGURE 5. Velocity distribution: (A) around the buildings 3.0 cm above the bed; (B) around the buildings 8.0 cm above the bed; (C) above the buildings 27.0 cm above the bed; (D) above the buildings 40.0 cm above the bed.
The sand experiments involve two experimental runs with uniform sand of a mean diameter of 0.17 mm to evaluate the amount of sand that accumulated around the buildings. The first run (SE1) was conducted with arrays of buildings of the same height. The second run (SE2) was conducted with the same arrays of buildings used in run SE1. However, a V-shaped fence with an angle of 90°, side length of 70 cm, and height of 5 cm was placed in front of the buildings in run SE2 (see Figure 7). Like the aerodynamic runs, the sand runs were conducted with a constant airflow rate of 7.462 m3/s and a mean air velocity of 5.86 m/s (21 km/h). The duration of the runs was about 7.0–9.0 h, when the sand patches around the buildings reached a quasi-equilibrium condition wherein their shapes did not change considerably with time. Figure 6 shows the sand patches developed around the buildings for run SE1. It can be seen from the figure that the sand was concentrated more between the last three rows of buildings. This can be attributed to the wake effect of each building on another. Adding the fence in run SE2 reduced the amounts of sand that accumulated between the buildings tremendously (Figure 7). Although the fence reduced the amount of sand that accumulated between the buildings, Figure 7 shows that much sand accumulated at the sides and in front of the fence. The -fence changed the sand distribution from areal pollution distributed over the entire area where the buildings are located into point pollution (i.e., strip pollution along the fence). The sand pollution can be easily collected from the fence.
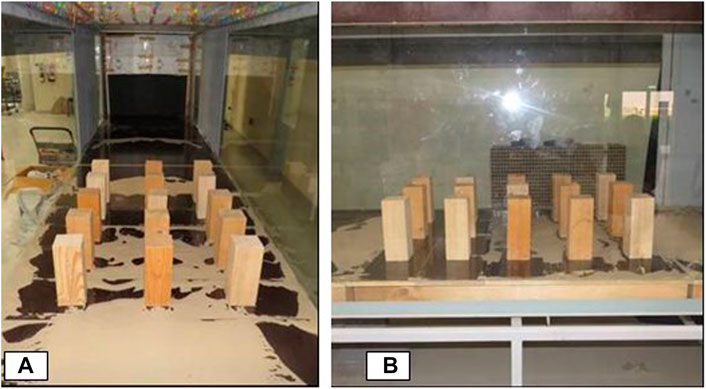
FIGURE 6. Sand patches developed around the simulated buildings in different runs: (A) SE1 front-view; (B) SE1 sideview.
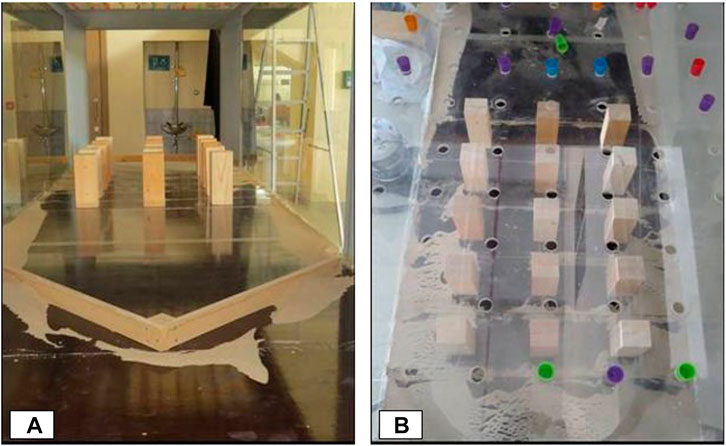
FIGURE 7. Experimental run SE2 with a fence in front of a simulated building: (A) experiment arrangement; (B) accumulated sand in front of the fence.
Table 2 summarizes the total amounts of sand accumulated in front, around, and behind the buildings for different runs and the amounts of sand in suspension that exited the wind tunnel. The total amount of sand used in each run was 5 kg. The table shows that 47.5% (2.38 kg) and 13.2% (0.66 kg) of total sand used in the experiments accumulated around the building for runs SE1 and SE2, respectively. This proves that the arrangement and spacing of the buildings were optimal and effective in minimizing the sand pollution around the buildings. Adding the fence in run SE2 provided the best results by reducing the amount of accumulated sand around the buildings to 13.2% compared to 47.5% in run SE1. The angled fence used in run SE2 increased the amount of sand that accumulated in front of the fence to 77.4% compared to 40.5% in run SE1. Thus, although the fence improved the environment around the buildings significantly, most probably it will affect the environment upstream of the buildings. The- fence changed the sand distribution from an areal pollution distributed over the entire area into a point pollution (i.e., strip pollution along the fence), which can be easily collected from the fence.
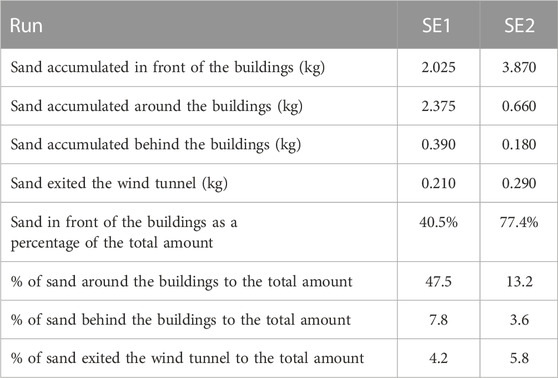
TABLE 2. Summary of the sand accumulation experimental results.
Several sand transport models were developed from airflow over a flat bed; the measured sand transport rate has been compared to these models. Values for shear velocity used in these models were obtained from the approaching velocity (U) over a smooth flat plate as follows:
where f is the friction coefficient of the wooden platforms used in the experiments taking a value of 0.013. The critical shear velocity used in the models was obtained from Zanke (1982). Table 3 summarizes the measured values and the values obtained from different sand transport models. It can be seen that the models provide higher values than those measured in this study. The deviation can be attributed to the effects of the buildings.
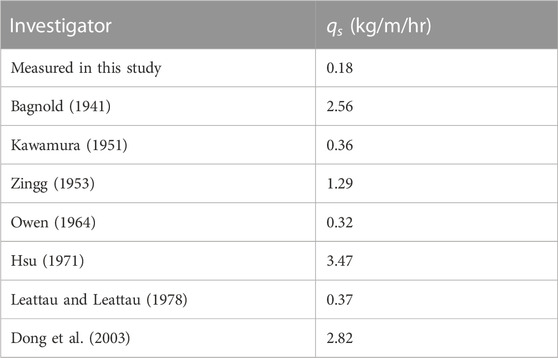
TABLE 3. Comparison between the measured sand transport rate and model prediction.
6 Conclusion
The impact of sandstorms on the integrity of buildings and the urban fabric of industrial neighborhoods in desert hinterlands is challenging. Throughout this research, we aimed to highlight the role of the urban landscape in improving the environment and reducing the effects of sandstorms in Mussafah. Local gardens and shaded jogging and cycling tracks in Mussafah have improved living conditions and offer a sense of belonging for multi-ethnic communities in an industrial neighborhood. Adding shrubs and green fences in front of the buildings provided the best results by reducing the amount of sand that accumulated around the buildings by almost 34% compared to a run with buildings of the same height and no fence. The fenced garden changed sand accumulation patterns from a non-point distribution over the entire area to strip pollution along the fence that is easier to deal with. Thus, the experiments indicated that it is possible to offer different scenarios for the layout of buildings and protect them through provisions such as small gardens and trees that create barriers and reduce the impact of sandstorms.
Data availability statement
The original contributions presented in the study are included in the article/Supplementary Material; further inquiries can be directed to the corresponding author.
Author contributions
All authors listed have made a substantial, direct, and intellectual contribution to the work and approved it for publication.
Conflict of interest
The authors declare that the research was conducted in the absence of any commercial or financial relationships that could be construed as a potential conflict of interest.
Publisher’s note
All claims expressed in this article are solely those of the authors and do not necessarily represent those of their affiliated organizations, or those of the publisher, the editors, and the reviewers. Any product that may be evaluated in this article, or claim that may be made by its manufacturer, is not guaranteed or endorsed by the publisher.
Supplementary material
The Supplementary Material for this article can be found online at: https://www.frontiersin.org/articles/10.3389/fbuil.2023.1158543/full#supplementary-material
References
Abdegalieva, А. E., and Zaykova, E. Y. (2016). The problem of dust storms: Protection methods and macro-structures in landscape architecture. Вестник РУДН. Серия Агрономия и животноводство Bull. RUDN Univ. Ser. Agron. Animal Husb. 4, 85–93. doi:10.22363/2312-797X-2016-4-85-93
Abu Dhabi Plan, (2030). Urban structure framework plan. https://andp.unescwa.org/sites/default/files/2020-10/Plan%20Abu%20Dhabi%202030-Urban%20Structure%20Framework%20plan.pdf.
Afrin, S., Chowdhury, F. J., and Rahman, M. M. (2021). COVID-19 pandemic: Rethinking strategies for resilient urban design, perceptions, and planning. Front. Sustain. Cities 3, 668263. doi:10.3389/frsc.2021.668263
Alam, H., Khattak, J., Ppoyil, S., Kurup, S., and Ksiksi, T. (2017). Landscaping with native plants in the UAE: A review. Emir. J. Food Agric. 29 (10), 729–741. http://www.ejfa.me/. doi:10.9755/ejfa.2017.v29.i10.319
Anderson, S. (1977). Modern architecture and industry: Peter behrens and the cultural policy of historical determinism. J. Ideas Crit. Archit. 11, MIT Press (1977, reprint 1981).
Awadh, S. M. (2023). Impact of north african sand and dust storms on the Middle East using Iraq as an example: Causes, sources, and mitigation. Atmosphere 14, 180. doi:10.3390/atmos14010180
Bristol, K. G. (1991). The pruitt-igoe myth. J. Archit. Educ. 44 (3), 163–171. doi:10.1080/10464883.1991.11102687
Boros, J., and Mahmoud, I. (2021). Urban design and the role of placemaking in mainstreaming nature-based solutions. Learning from the Biblioteca Degli Alberi case study in Milan. Front. Sustain. Cities 3, 635610. doi:10.3389/frsc.2021.635610
Chiesura, A. (2004). The role of urban parks for the sustainable city. Landsc. Urban Plan. 68 (1), 129–138. doi:10.1016/j.landurbplan.2003.08.003
Cakmak, C. (2014). Dubai: Re-designing labor worker communities. Archit. Sr. Theses 203. https://surface.syr.edu/architecture_theses/203.
Connell, J., and Burgess, J. (2011). The labour market, immigration and the building of Dubai. Int. Employ. Relat. Rev. 17 (2), 21–36.
Damluji, S. (2006). “Brave new cities, architecture in context: An overview,” in The Architecture of the United Arab Emirates. Editor S. Damluji (London, UK: Garnet Publishing), 24–99.
Dennehy, J. (2017). How Mussaffah is undergoing a quiet transformation. https://www.thenationalnews.com/uae/environment/how-mussaffah-is-undergoing-a-quiet-transformation-1.662953. September 30 2017.
Dong, Z., Liu, X., Wang, H., and Wang, X. (2003). Aeolian sand transport: A wind tunnel model. Sediment. Geol. 161, 71–83. doi:10.1016/s0037-0738(02)00396-2
Elhakeem, M., Hussein, O., and Mirza, O. (2013). “Pollution around buildings due to sandstorms,” in Proc. Inter. Conf. on Environmental Pollution and Remediation, January 2013. Toronto, Canada.
El Amrousi, M., Elhakeem, M., and Paleologos, E. K. (August 2019). Transnational communities and vernacular expressions in Abu Dhabi’s industrial spaces. Proceedings of the 1st International Conference on Human Interaction and Emerging Technologies (IHIET 2019), 2019, 90–97.
Fernández Águeda, B. (June 2009). Urban planning in industrial cities: The reversibility of decay, city futures in a globalizing world. Proceedings of the International conference on globalism and urban change, 2009, Madrid, 204–221.
Francis, D., Fonseca, R., Nelli, N., Teixido, O., and Perry, R. (2022). Increased Shamal winds and dust activity over the Arabian Peninsula during the COVID-19 lockdown period in 2020. Aeolian Res. 55, 1–15. doi:10.1016/j.aeolia.2022.100786
Hsu, S. A. (1971). Wind stress criteria in eolian sand transport. J. Geophys. Res. 76, 8684–8686. doi:10.1029/jc076i036p08684
Hung, P., and Peng, K. (2017). Green-energy, water-autonomous greenhouse system: An alternative-technology approach towards sustainable smart-green vertical greening in smart cities. Int. Rev. spatial Plan. Sustain. Dev. 5 (1), 55–70. doi:10.14246/irspsd.5.1_55
Jencks, C. (1991). The Language of post-modern architecture. 6th edition. Rizzoli, Bergamo, Italy, 204pp.
Kallos, G., Solomos, S., Kushta, J., Mitsakou, C., Spyrou, C., Bartsotas, N., et al. (2014). Natural and anthropogenic aerosols in the eastern mediterranean and Middle East: Possible impacts. Sci. Total Env 488-489, 389–397. doi:10.1016/j.scitotenv.2014.02.035
Kawamura, R. (1951). “Study of sand movement by wind,” in Hydraulics engineering laboratory report HEL-2-8 (Berkeley, CA, USA: University of California).
Keshtkaran, R. (2019). Urban landscape: A review of key concepts and main purposes. Int. J. Dev. Sustain. 8 (2), 141–168.
Le Corbusier, (1967). The radiant city: Elements of a doctrine of urbanism to be used as the basis of our machine-age civilization. Orion Press, London, UK, 347. pp (translated from French).
Lettau, H., and Lettau, H. H. (1978). “Experimental and micro-meteorological field studies of dune migration,” in Exploring the world’s driest climate, IES report 101. Editors H. H. Leattau, and K. Lettau. (Madison, Wi, USA: University of Wisconsin), 110–147.
Lin, B. B., Egerer, M. H., and Ossola, A. (2018). Urban gardens as a space to engender biophilia: Evidence and ways forward. Front. Built Environ. 4, 79. doi:10.3389/fbuil.2018.00079
Lovell, R., Husk, K., Bethel, A., and Garside, R. (2014). What are the health and well-being impacts of community gardening for adults and children: A mixed method systematic review protocol. Environ. Evid. 3, 20. doi:10.1186/2047-2382-3-20
Lu, J., Li, Q., Zeng, L., Chen, J., Liu, G., Li, Y., et al. (2017). A micro-climatic study on cooling effect of an urban park in a hot and humid climate. Sustain. Cities Soc. 32, 513–522. doi:10.1016/j.scs.2017.04.017
Martin, C. (2008). Landscape sustainability in a sonoran desert city. Cities Environ. 1 (2), 1–16. doi:10.15365/cate.1252008
Mechlenborg, M. (2019). Reintegrating ghettos into society: Lessons learned from the Danish ghetto strategy. Nordic J. Archit. Res. 31 (1), 59–87.
Mekala, G. D., Jones, R. N., and MacDonald, D. H. (2015). Valuing the benefits of creek rehabilitation: Building a business case for public investments in urban green infrastructure. Environ. Manage 55 (5), 1354–1365. doi:10.1007/s00267-015-0471-7
Menoret, P. (2014). Introduction to the Abu Dhabi guide: Modern architecture the Abu Dhabi Guide, modern architecture 1950-1990’s, (Publisher; NYUAD-FIND: Forming Intersections and Dialogues, Abu Dhabi, UAE.
Middleton, N., and Kang, U. (2017). Sand and dust storms: Impact mitigation. Sustainability 9 (6), 1053–1122. doi:10.3390/su9061053
Montavon, M., Steemers, K., Cheng, V., and Compagnon, R. (2006). “PLEA2006,” in Proceedings of the the 23rd Conference on Passive and Low Energy Architecture, Geneva, Switzerland, September 2006, 6–8.
Ng, E., Yuan, C., Fung, J., Ren, C., and Chen, L. (2011). Improving the wind environment in high-density cities by understanding urban morphology and surface roughness: A study in Hong Kong. Landsc. Urban Plan. 101, 59–74. doi:10.1016/j.landurbplan.2011.01.004
Olivetti, M. L. (2022). Landscape architecture and the green deal dare: Five successful experiences in urban open spaces. Sustainability 14, 8751. doi:10.3390/su14148751
Owen, P. R. (1964). Saltation of uniform grains in air. J. Fluid Mech. 20, 225–242. doi:10.1017/s0022112064001173
Pasha, C. P. T., Cut Dewi, C., and Djamaluddin, M. (2021). Adaptive reuse of old houses as coffee shop: Environmental and spatial aspects. IOP Conf. Ser. Earth Environ. Sci. 881, 012046. doi:10.1088/1755-1315/881/1/012046
Perez, A., and Verbakel, E. (2022). “The role of adaptive reuse in historic urban landscapes towards cities of inclusion. The case of Acre,” in Journal of cultural heritage management and sustainable development (Bingley, UK: Emerald Publishing Limited) 2044–1266. doi:10.1108/JCHMSD-05-2022-0074
Sahraiyan, F., and Tümer, E. (2017). Adaptive reuse of industrial buildings: Case study of Tenten factory in Famagusta. J. Eng. Archit. 5 (1), 50–60. doi:10.15640/jea.v5n1a6
Statista, (2021). Contribution of construction to the gross domestic product of the Abu Dhabi emirate from 2013 to 2019. Available online: https://www.statista.com/statistics/818149/uae-contribution-of-construction-to-the-gdp-in-abu-dhabi/(accessed February 1, 2023).
Tan, B. A., Gaw, L. Y.-F., Masoudi, M., and Richards, D. R. (2021). Nature-based solutions for urban sustainability: An ecosystem services assessment of plans for Singapore’s first “Forest Town”. Front. Environ. Sci. 9, 610155. doi:10.3389/fenvs.2021.610155
Unep, W. M. O., and Unccd, (2016). Global assessment of sand and dust storms. Nairobi: United Nations Environment Programme.
Xiao, Y., Zhang, Y., Sun, Y., Tao, P., and Kuang, X. (2020). Does green space really matter for residents’ obesity? A new perspective from baidu street view. Front. Public Health 8, 332. doi:10.3389/fpubh.2020.00332
Yagoub, M. (2014). Parks in Al ain, UAE: Geographical distribution, opportunities, and challenges. Arab World Geogr. 17 (1), 24–41.
Yang, J., and Wang, Z. H. (2017). Planning for a sustainable desert city: The potential water buffering capacity of urban green infrastructure. Landsc. Urban Plan. 167, 339–347. doi:10.1016/j.landurbplan.2017.07.014
Keywords: Abu Dhabi, sandstorms, sand movement, Mussafah, industrial neighborhoods
Citation: El Amrousi M, Elhakeem M and Paleologos EK (2023) Industrial neighborhoods in desert cities: Designing urban landscapes to reduce sandstorm effects in Mussafah. Front. Built Environ. 9:1158543. doi: 10.3389/fbuil.2023.1158543
Received: 04 February 2023; Accepted: 29 March 2023;
Published: 20 April 2023.
Edited by:
Mohamed H Elnabawi Mahgoub, United Arab Emirates University, United Arab EmiratesReviewed by:
Hossein Omrany, University of Adelaide, AustraliaSuchandra Bardhan, Jadavpur University, India
Copyright © 2023 El Amrousi, Elhakeem and Paleologos. This is an open-access article distributed under the terms of the Creative Commons Attribution License (CC BY). The use, distribution or reproduction in other forums is permitted, provided the original author(s) and the copyright owner(s) are credited and that the original publication in this journal is cited, in accordance with accepted academic practice. No use, distribution or reproduction is permitted which does not comply with these terms.
*Correspondence: M. El Amrousi, bW9oYW1lZC5hbXJvdXNpQGFkdS5hYy5hZQ==