 Marco Giulivo
 Giovanbattista Borretti
 Andrea Prota1*
 Costantino Menna
- 1Department of Structures for Engineering and Architecture, University of Naples Federico II, Naples, Italy
- 2Ekoru s.r.l. Company, Volla, Naples, Italy
Introduction: Seismic damage affecting the non-structural components of buildings (such as infills) can significantly impact the expected economic losses over a structure’s service life. Recently, autoclaved aerated concrete (AAC) infills have gained attention in the construction industry due to their light weight, energy efficiency, and durability.
Methods: This study investigates the out-of-plane behavior of an innovative AAC infill wall system by means of shake table tests. The wall system was made of low-density AAC units with innovative joints made from polyurethane resin and steel plates for connection to a structural frame. Shake table tests were carried out using artificial accelerograms based on ICBO-AC156, which can reproduce a wide range of interstory drift demands. The study is articulated in three stages: the mechanical characterization of the AAC infill wall, shake table tests, and seismic behavior analysis of the wall based on current code requirements.
Results and Discussions: The results demonstrate the effectiveness of the innovative AAC infill wall system in resisting out-of-plane seismic loads, also considering different levels of seismic action, with base accelerations reaching up to 0.80 g.
1 Introduction
Non-structural buildings components, including infill walls, system elements, and contents, are susceptible to being damaged during earthquakes.
Damage to non-structural elements can lead to costly rehabilitation expenses as well as industrial processes interruption (Taghavi and Miranda, 2003; Del VecchioCiroPampanin and Prota, 2018), which would jeopardize the proper operation of buildings, especially if referring to strategic buildings (i.e., hospitals and schools). Within this framework, an adequate definition of non-structural elements is suggested by the current Italian code (Norme tecniche per le Costruzioni, 2008); this is based on their impact on the structural response to seismic stresses, and it distinguishes on-site and pre-assembled components.
The damage resulting from seismic loads on infill walls is induced by collapse mechanisms arising from actions within the in-plane, the out-of-plane, and their interactions. Even though the complex mechanism of correlation has not been clearly investigated yet (Morandi et al., 2021), it is well known in the literature (Mohsenian et al., 2023) that damage to non-structural elements arise at lower seismic intensities compared to those affecting the load-bearing structure.
Recent studies have produced noteworthy findings regarding the dynamic behavior of different types of infill walls, which include the interaction between in-plane and out-of-plane forces. For instance, Milanesi et al. (2020) conducted shake table tests on an innovative masonry infill with sliding joints, whereas da Porto et al. (2020) conducted experimental testing and numerical modeling of both robust unreinforced and reinforced clay masonry infill walls, with and without openings. Additionally, Di Domenico et al. (2018) examined the impact of boundary conditions on the out-of-plane reaction of unreinforced masonry infill walls, while Morandi et al. (2018) investigated the in-plane/out-of-plane interaction of masonry infills from cyclic tests to out-of-plane verifications.
Traditionally, infill walls of reinforced concrete structures, whether residential or industrial, have been constructed using lightweight clay bricks, masonry units, and more recently, autoclaved aereated concrete (AAC). The latter is a type of lightweight concrete produced by combining water, cement, lime, silica sand, gypsum, and a small percentage of aluminum powder. The resulting autoclaved aerated concrete (AAC) contains approximately 30% solid substances by volume, with the remaining 70% comprising air in the form of micro and macro-porosities that range in size from 0.1 to 2 mm. Due to its high porosity, AAC is a lightweight and low-density material that offers excellent thermal insulation properties, thanks to its low thermal conductivity. These qualities make it an advantageous material for thermal insulation at room temperature as well as fire resistance Additionally, recent attention has been given to AAC as a material for retrofitting existing structures due to its promising thermal insulation properties. While there is literature available on the physical and thermal-mechanical properties of autoclaved aerated concrete (Ghazi Wakili et al., 2015), a detailed study of its dynamic properties at the structural level, particularly its out-of-plane behavior, is lacking. Recent studies (Cheng and He, 2018), however, have yielded interesting results on the dynamic behavior, including the interaction between in-plane and out-of-plane forces, of AAC infill walls made of self-insulating blocks.
With a view to improve the building process, the construction industry can use Industry 4.0 (i.e., the integration of digital technologies such as automation, data exchange, and artificial intelligence into industrial processes) technologies to improve construction methods beyond material selection. However, the adoption of modern industrial digital tools has been slow despite the potential advantages they offer. The implementation of Industry 4.0 tools could provide valuable knowledge on environmental impact and sustainability for workers. Recently, the construction industry has made efforts to implement digital technologies for obtaining operational and productivity gains, known as Industry 4.0 (Gharbia et al., 2020). The introduction of automated techniques, such as 3D concrete printing and the automated deposition of construction elements (Dakhli and Lafhaj, 2017), is part of this technological evolution. The adoption of Industry 4.0 technologies is expected to revolutionize construction practices and techniques. Thus, the present study aims to investigate the out-of-plane behavior of AAC infills obtained through the automated deposition of AAC units and the utilization of alternative joint materials.
1.1 Research significance
The objective of this study is to investigate the seismic performance of a novel pre-assembled AAC infill wall system by means of shake table tests. The pre-assembly procedure is based on an automated prefabrication process which utilizes robots and a polyurethane foam bonding material to arrange AAC units in a pre-defined infill wall geometry. To date, infill walls fabricated by automated processes have rarely been assessed in terms of seismic performance; more specifically, the out-of-plane behavior of the proposed system has not been extensively explored in the literature, thus making this study a key contribution to the field of seismic engineering. Hence, the study aims to design shaking table tests to evaluate the seismic response of the infill wall system under predetermined seismic inputs suitable for non-structural components, as well as to determine the damage resulting from the use of innovative pre-assembled infills with non-traditional joints/connections to the load-bearing structure. The experimental setup is thoroughly described, along with the innovative automated process to fabricate the AAC system. The results of this study have significant implications for the design and construction of seismic-resistant non-structural components in new buildings. Indeed, new fabrication technologies based on automation are becoming more popular in the construction industry; however, the large-scale performance assessment of the resulting products is still a barrier to their acceptance and/or approval. By contributing to the development of more efficient and cost-effective building systems, this study could also contribute to understanding how to reduce the economic losses associated with seismic damage. The research can also serve as a valuable resource for engineers and architects working on technologically innovative building construction projects in seismically active regions.
2 Experimental facilities: AAC infills, test setup, and testing protocol
The experimental facilities utilized for dynamic testing (Figure 1) encompassed a shaking table simulator and a 3D steel test frame infilled (only in one direction) with two innovative AAC infill walls. The shaking table utilized in this study measured 3 × 3 m and manifested two degrees of freedom in the horizontal plane, denoted as X and Y in Figure 5. The hydraulic system regulating the actuators comprised 12 pumps with a maximum capacity of 3,000 L/min, whereas the maximum payload (i.e., the maximum vertical load that can be applied to the shake table used for testing) supported by the system was 200 kN. Shake table worked within a frequency spectrum ranging from 0 to 50 Hz, with a peak acceleration associated with the maximum payload of 1.0 g, and a peak velocity and total displacement of 1 m/s and 500 mm (±250 mm), respectively. Additional details pertaining to the test setup properties, specimens, shake table input, and instrumentation are expounded upon in the ensuing paragraphs.
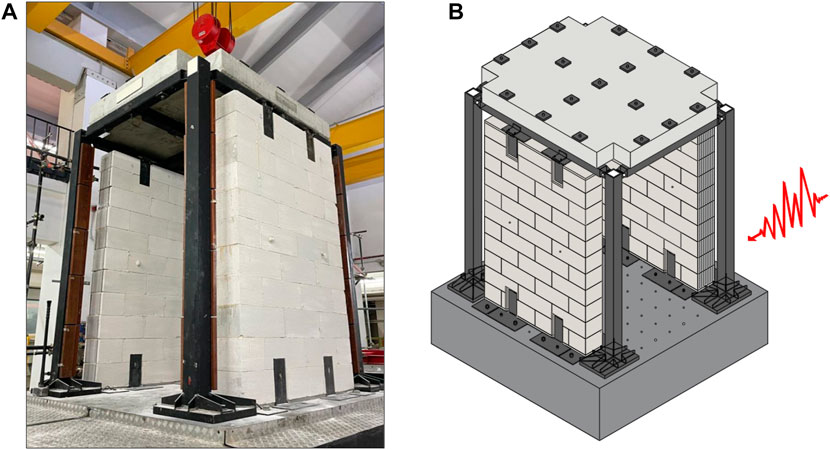
FIGURE 1. Global view of the testing setup: (A) experimental shake table test setup; (B) global view of test setup with the specified direction of out-of-plane load (in red).
2.1 Innovative AAC infill walls
The investigated infill walls are characterized by their innovative technological design. Specifically, AAC units are produced through a sophisticated fabrication process involving design, production, and installation. Ekoru s.r.l. employs BIM technology to design the AAC infills, which are assembled by robots in an industrial plant and subsequently transported to the construction site utilizing appropriately designed lifting/transport systems. The AAC blocks used to fabricate the infills under investigation have dimensions of 60 × 25 × 30 cm and a specific weight of 300 ± 50 kg/m3. Two types of innovative AAC infills were considered in this study: i) “T1_W_PU,” consisting of AAC blocks and joints of polyurethane (PU) foam, located on the west (W) side of the shake table (Figure 5); and ii) “T2_E_RB_PU,” made of reinforced AAC blocks (RB) and joints of polyurethane (PU) foam and placed on the east side (E) of the shake table (Figure 5). The reinforcement system of the individual AAC blocks is made of nr. 28 basalt fiber strands (placed at an approximate distance of 10 mm from each other) of 13 μm thickness, which continuously wrap each individual block in its longitudinal direction; each basalt fiber strand has a tensile strength of almost 3,100 MPa and is glued to the block through an automated wet process which utilizes an epoxy resin as a bonding agent. Figure 2 depicts a schematic representation of the two types of blocks that constitute the tested infills. The AAC units, both the unreinforced and reinforced ones, are assembled utilizing robots that alternately place rows of dry elements and sprayed polyurethane foam (Figure 3). This process reflects an advanced, high-tech design-production-installation pathway for Industry 4.0 building components, ensuring controlled and guaranteed performance, cost savings, and improved environmental and energy features. The inclusion of basalt fibers, which are automatically installed, serves to reinforce the wall’s plane against flexural loads generated by lifting operations.
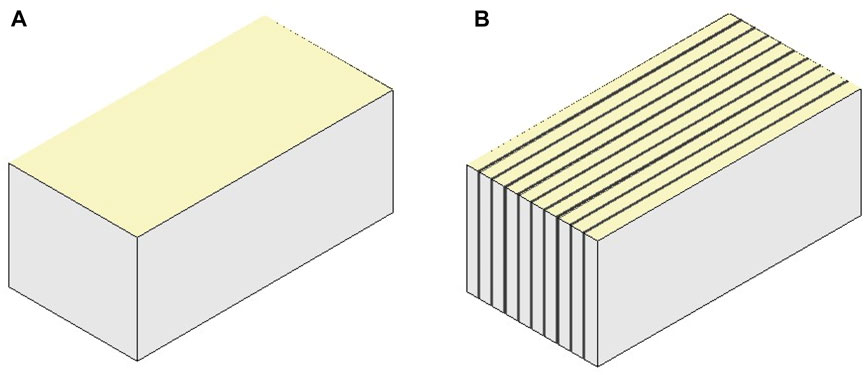
FIGURE 2. (A) Block employed in “T1_W_PU”; (B) block employed in “T2_RB_E_PU”.
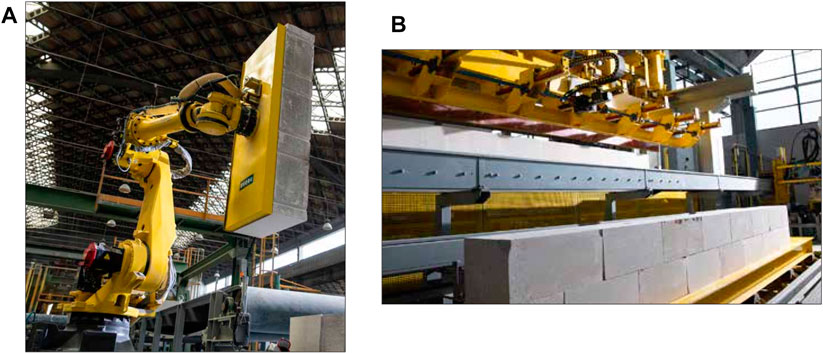
FIGURE 3. (A) Robot assembly; (B) rows of dry elements sprayed with polyurethane foam.
To characterize the mechanical properties of the tested AAC infills, vertical and diagonal compression tests were conducted at the Structures laboratory of the University of Naples Federico II. Vertical compression tests were performed on panels with dimensions of 90 × 100 × 24 cm in accordance with standard UNI EN 1052-1 (UNI EN 1052-1, 2001), while diagonal compression tests were carried out on panels measuring 150 × 150 cm and with a thickness of 24 cm in accordance with the American standard ASTM E519 (ASTM E519/E519M, 2021). Table 1 presents the main mechanical parameters of the tested AAC infills, including the compression strength (fi), elastic modulus (Ei), shear strength (Si), and shear modulus of elasticity (Gi).
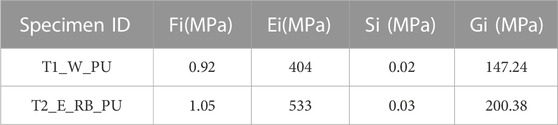
TABLE 1. Mechanical characteristics of AAC infills tested.
The AAC infills are secured to the bearing frame by means of metallic devices, with four devices arranged on each side of the wall to prevent out-of-plane overturning. These anti-overturing devices are designed according to EC8 (EN, 1998-1, 2004) and are sized based on the estimation of the out-of-plane design load in the ultimate limit state for a medium seismic zone. Specifically, the anti-overturing devices have dimensions of 0.15 × 0.35 m and 0.01 m thickness and are located in the four corners of the infills on both faces, compatibly with the testing frame. To accommodate the anti-overturning devices, the AAC blocks are preliminarily cut on the external surfaces to a depth of 10 mm. A double-sided adhesive neoprene pad is then applied to the metallic face to avoid high concentrations of local stresses at the interface. To prevent the fall of the infills in case of overturning, protective ropes are inserted. Notably, the presence of these devices does not affect the seismic behavior of the tested specimens; rather, they are solely for safety during testing. A total of sixteen steel corners are introduced in each side of the infills to prevent unhooking and overturning of the walls from the test frame. The anti-overturing device consists of a first steel plate that is affixed to the wall; this steel plate is bolted and welded to a second one to guarantee the connection to the bearing frame. The device is designed to resist stresses during testing based on capacity design principles. To enable the wall to be positioned orthogonally to the shaking table and accurately simulate the action out-of-plane orthogonal to the walls, a concrete screed of 3 cm is applied to a steel plate, that is, previously bolted to the shaking table. Finally, the empty space at the interface between the infills and the main beams of the test frame is filled with polyurethane foam. This device was developed by the authors during the test campaign and is currently being further developed. A perspective view of the infilled frame is shown in Figure 5, with particular attention given to the construction details of the setup.
2.2 Test setup
The mechanical testing of the AAC infills was conducted within an existing steel frame, whose dynamic characteristics have been assessed through analytical methods and calibrated with tests previously carried out in the same laboratory (Magliulo et al., 2014). The steel frame is designed as a reverse pendulum structure with a plan dimension of 2.50 × 2.50 m and a height of 2.90 m. The columns are constructed of steel C45 with a square-shaped profile featuring a hollow cross-section of 150 × 150 × 15 mm, while the main beams are made of steel S275 with a square-shaped profile featuring a hollow cross-section of 120 × 120 × 12.5 mm. The connection between the beam and the column is established through a hinge constraint using a bolted connection. Furthermore, two horizontal beams made of steel S275 with a square-shaped profile featuring a hollow cross-section of 120 × 120 × 12.5 mm are bolted to the main beams to provide additional stiffening. A reinforced concrete slab of class C45/55 with a plan dimension of 2.15 × 2.65 m and thickness of 0.25 m, shaped appropriately to allow for relative rotations between the beam and the column, is placed on top of the steel structure. The concrete slab is connected to the steel frame with seventeen bolts to prevent relative sliding and enable the transfer of inertial forces deriving from the concrete mass. Figure 4A, B provide a top view and a plan view, respectively, of the aforementioned steel frame.
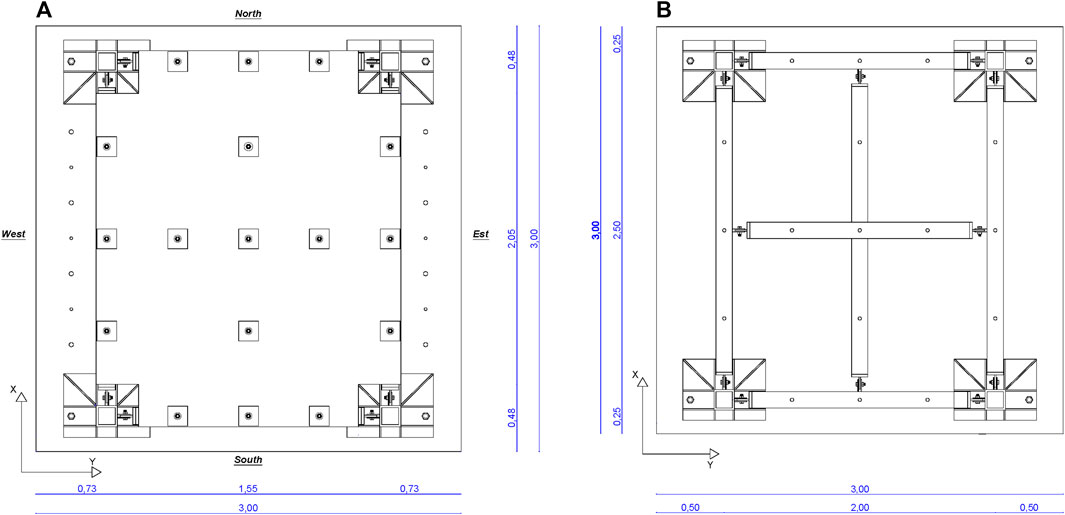
FIGURE 4. (A) Top view of bare frame; (B) plan view of steel frame.
The bare frame was simulated and analyzed using the finite element method (FEM) software SAP2000 Computer and Structures (CSI, 2000). The modelling process utilized one-dimensional beam elements, with the material properties assumed to be linearly elastic and fixed constraints at the base. The FEM model was constructed to determine the natural modes of vibration of the “bare” steel frame in both directions. The calculated periods and frequencies of the bare steel frame were found to be 0.24 s and 4.17 Hz, respectively, in both X and Y directions, as shown in Figure 4.
2.3 Seismic input and testing protocol
The shaking table was subjected to dynamic loading by generating artificial time histories, which represented a design seismic event acting in the Y direction, orthogonal to the infill walls located in the X-Z plane of the table (refer to Figure 5). Artificial time histories were generated to represent seismic events with a wide frequency range. The time histories were artificially defined to match the required response spectrum (RRS), which is the target spectrum provided in the ICBO-AC156 (AC156, 2000). The RRS was obtained as a function of the 0.2 s spectral acceleration, SDS, which is a parameter indicating the seismic event. International Code Council ICC (2000) specifies the short-period design spectral acceleration, using the expression 2.1.
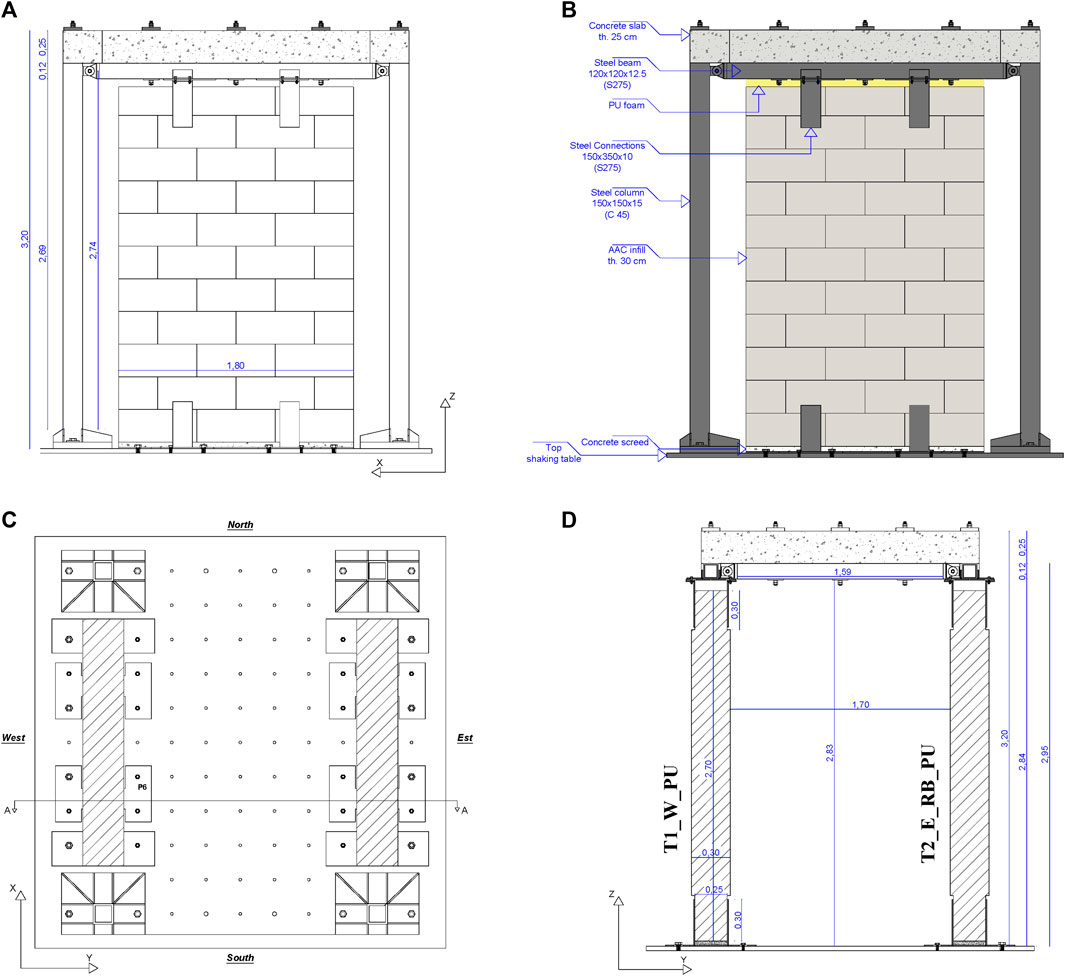
FIGURE 5. Test setup: (A) prospective view in X-Z plane of the setup; (B) installation details of the different setup components in X-Z view; (C) plan view of the test setup; (D) section A-A of the test setup in Y-Z view.
Where, Fa is the site/soil coefficient and ranges from 1.00 to 1.40; in particular, it can be considered 1.00 for rocky sites and 1.40 for soft soils [Table 11.4-1 ASCE 7-16 (ASCE 7-16 and American Society of Civil Engineers, 2017)]; and Ss is the maximum considered earthquake (MCE) understood as short-period spectral acceleration; it shall be evaluated according with paragraph 11.4.4 of ASCE 7-16 (ASCE 7-16 and American Society of Civil Engineers, 2017), and shall not exceed 1.50. In this study Fa is assumed equal to 1.00. The procedure is executed utilizing an SDS of 1.00 g in order to conform to the target spectrum, which is defined as the RRS, in accordance with ICBO-AC156 (AC156, 2000). The recordings along the Y direction are proportionally adjusted to align with the target spectrum. The time histories utilized to test infills along the Y direction are generated according to AC156. Specifically, the fundamental signal is defined by non-stationary broadband random excitations within a frequency range of 1.33–33 Hz with a bandwidth resolution of one-sixth and one-eighth. The excitation’s duration is 30 s, of which 5 s are indicative of the construction phase or signal growth (building), 20 s are indicative of the stationary phase of the signal (holding), and the final 5 s are indicative of the signal drop phase (decaying). The signal is enhanced using transfer curves that undergo a matching procedure to the target spectrum defined by the RSP Match Program (Hancock et al., 2006) to ensure compatibility with the RRS (target spectrum). The process of matching the signal with the target spectrum is guaranteed within the frequency range of 1.3-33 Hz. The response spectrum associated with the selected accelerogram should be compared to the target spectrum and, particularly, the elastic response spectrum’s ordinates should fall within a range, namely, the amplified and deamplified RRS of 30% and 10%, respectively [as per EC8 (EN, 1998-1, 2004) and AC156 (AC156, 2000) regulations]. To obtain an excitation compatible with the shake table’s limits (in terms of permissible acceleration, velocity, and displacement), the resulting match is compared to these limits; thus, the frequency range considered is between 0.7 and 34 Hz. This process eliminates high-frequency oscillations that are not reproducible and removes signal defects. Figure 6 presents the acceleration results obtained for the time history in the Y direction, while Figure 7 depicts the elastic response spectrum in terms of acceleration, along with the target spectrum corresponding to SDS equal to 1.00 g scaled to 90% and 130%, as described earlier Additional information on testing specifications can be found in Magliulo and Manfredi (2011a).
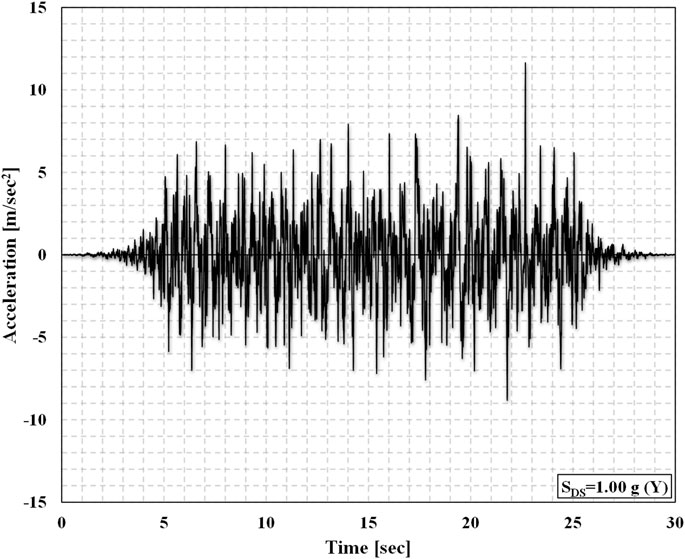
FIGURE 6. Input acceleration time history for SDS equal to 1.00 g—Y direction.
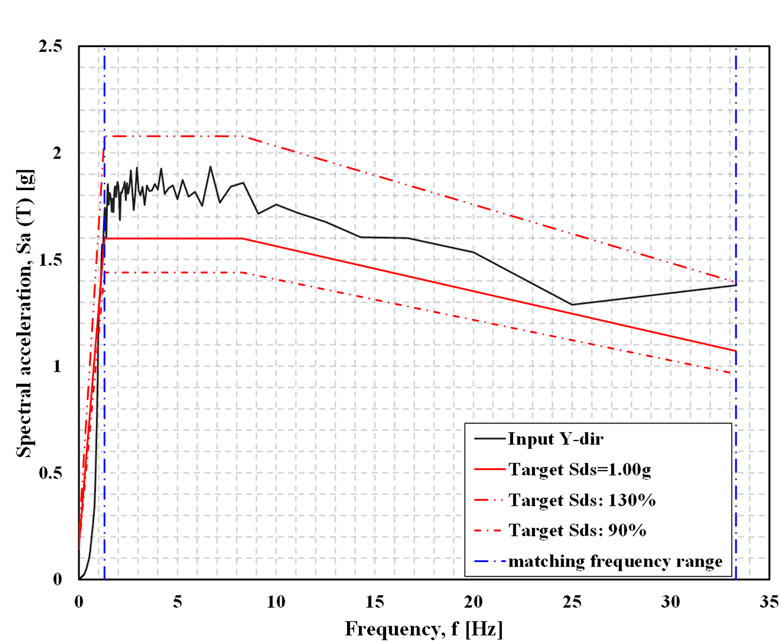
FIGURE 7. Input accelerogram spectra for SDS equal to 1.00 g, target spectrum, and matching frequency range (vertical blue line)—Y direction.
The shake table tests were conducted using selected input levels ranging from 0.10 to 1.50 g SDS, with the objective of evaluating the performance of innovative walls in terms of their representativeness of a wide range of real earthquakes. It is noted that this range of accelerations leads to an interstory drift ratio (IDR) for infills exceeding 0.5%, which is the limit imposed by the Italian code (Norme tecniche per le Costruzioni, 2008). To address this issue, the test frame was designed to achieve an IDR of 0.5% for an earthquake characterized by an SDS of 0.60 g, which represents a ground acceleration of 0.24 g, corresponding to a high-intensity earthquake with a return period of 15 years in a high seismicity zone, in accordance with the guidelines provided by Paulay and Priestley (1992). It is worth noting that the steel frame utilized for installing the AAC walls during the experimental campaign was previously designed and verified, as described in Magliulo et al. (2014). The dynamic input was defined according to AC156 (2000), as the internal infills are displacement-sensitive components, and the AC156 implicitly applies to acceleration-sensitive elements. However, out-of-plane actions may cause damage or the collapse of these components, and the use of a flexible test frame subjected to defined excitations enabled the investigation of the behavior of the tested infill at different levels of required relative displacements. It should be noted that the RRS depends on the short-period spectral acceleration, SDS, determined by simplified Eq. 2.1, according to ASCE 7-16 (ASCE 7-16 and American Society of Civil Engineers, 2017), as indicated previously. The response spectrum is defined by two spectral accelerations: spectral acceleration calculated for flexible components, AFLX, and spectral acceleration calculated for rigid components, ARIG, that assume a component amplification factor (ap) equal to 2.50 and 1.00, respectively, and with a component response modification factor (RP) and component importance factor (Ip) equal to 1. These result in normalized acceleration factors, which together define the horizontal components of the RRS, as specified in paragraph 6.5.1 of AC156 (AC156, 2000). AFLX and ARIG are differentiated by the fundamental frequency of 16.7 Hz (lower or higher). The defined response spectra include the spectrum considered in a frequency range between 1.3 and 33.3 Hz with a damping value of 5% of the critical value. The procedure is performed as described above, with the selected inputs calibrated in tests previously conducted by Magliulo and Manfredi (2011b).
2.4 Instrumentation
Tri-axial accelerometers and displacement laser sensors are utilized to monitor the response of both the test frame and the specimen. Specifically, one accelerometer, situated within the shaking table, measures the input accelerations in the Y direction. In addition, twelve accelerometers are arranged to monitor acceleration along the Y direction of the shaking table at various locations of the setup, as shown in red in Figure 8. One accelerometer (1) is installed on the beam to measure the amplification factor of the test frame, and 10 other accelerometers are arranged cross-wise on the two infills to investigate their out-of-plane behavior. More specifically, five accelerometers are placed on the east wall, with one accelerometer (4) situated at the center of the wall, while the other four instruments are installed along the vertical and horizontal directions of the accelerometer (4) to evaluate the acceleration distribution of the infill along two orthogonal directions. Similarly, another five are installed on the west wall, as shown in Figure 8. Furthermore, displacement laser sensors are employed and denoted by the green color in Figure 8. Five short-range laser sensors (prefixed with “W” in Figure 8) and two long-range laser sensors (prefixed with “L” in Figure 8) are utilized to evaluate the absolute and relative displacements of the test frame column and anti-overturing device.
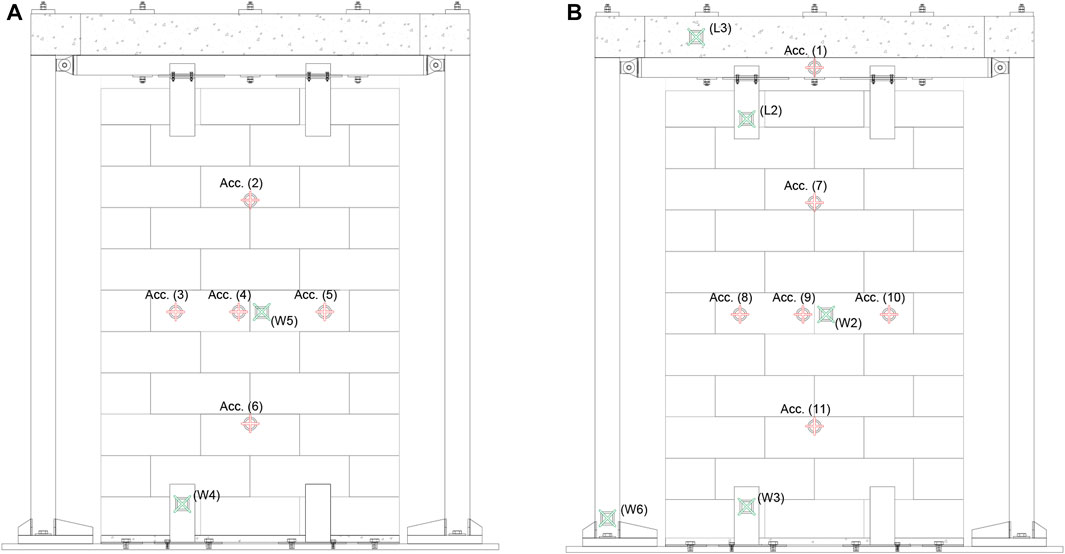
FIGURE 8. Accelerometer (in red) and laser (in green) positions on both the test frame and samples. (A) East side view of X-Z plane; (B) west side view of X-Z plane.
3 Results and discussions
A unidirectional shaking table test was conducted in the Y direction, and the resulting data are presented in Table 2. The table provides the reference SDS intensity values for each test, as well as the peak acceleration recorded by the accelerometer inside the table, the peak acceleration measured at the roof of the test frame using the accelerometer placed on the horizontal beam [acc. (1) in Figure 8], and the peak acceleration amplification factor (AAF), which is calculated as the ratio of peak acceleration at the roof to peak table acceleration. Peak relative displacements are also reported, which were determined by subtracting the absolute displacement at the roof (L3 in Figure 8) from that at the table (W6 in Figure 8). Displacements were also evaluated using laser sensors placed at mid-height of the walls (W5 and W2 in Figure 8) and on the anti-overturing devices (L2, W3, and W4 in Figure 8). Additionally, the maximum interstory drift ratio was calculated as the ratio between the maximum relative displacements and the height of the test setup, which was 2.74 m. The maximum acceleration values recorded on the roof in the Y direction exceeded the peak table acceleration due to dynamic amplification, with a mean dynamic amplification for out-of-plane loads (AAF) in the range of 2-3. The maximum interstory drift value was almost 10‰ (see Supplementary Material). To investigate the behavior of the AAC infills and their contribution to the overall behavior of the test setup, the top acceleration, which is representative of the total inertia force, was plotted against the relative displacement for various intensity levels. Figure 9 shows the results of selected tests in the Y direction for brevity and clarity. Furthermore, Figure 10 depicts the damage that occurred after test nine, which included the ejection of small fragments of PU resin and small AAC block debris.
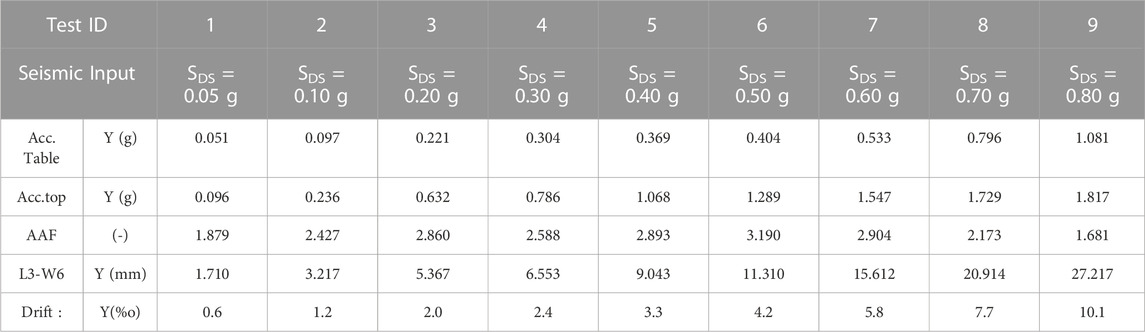
TABLE 2. Summary of the of the main recorded data for each test of the experimental campaign.
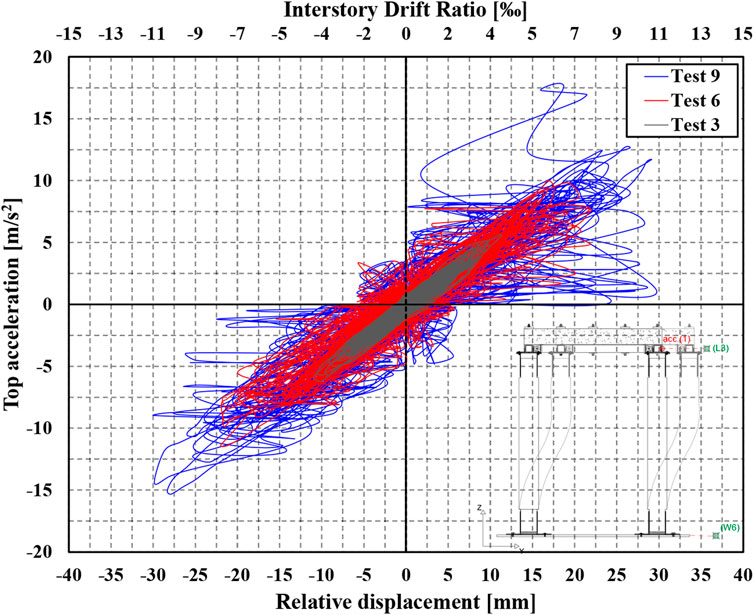
FIGURE 9. Top acceleration vs. relative displacement plot for the different seismic tests in Y direction.

FIGURE 10. Damage observed after Test 9 (in red).
The amplification factor for out-of-plane acceleration (AAF) falls within the range of 2–3, as evidenced by the data presented in Table 2. These findings suggest that the AAF is typically well approximated by the 2.5 factor recommended in ASCE 7 for flexible components (American Society of Civil Engineers, 2010). The out-of-plane acceleration of the infills is nearly constant at various locations at the same height, indicating that the walls primarily deform out-of-plane in the vertical plane, while negligible deformations are detected in the horizontal plane, as shown in Table 3. The out-of-plane accelerations at the top and bottom of the panel are approximately 1.4 and 0.7 times the acceleration at the center of the infill, respectively. This finding is expected since the walls experience a greater acceleration at the top, nearly double that at the bottom of the specimens. Furthermore, Table 3 presents the peak relative displacements recorded during each test level, including the peak relative displacement between the top (laser L3) and bottom of the test frame (laser W6) as well as the peak relative displacement measured between the mid-height of the infills and the anti-overturing device where the instrumentation is located.
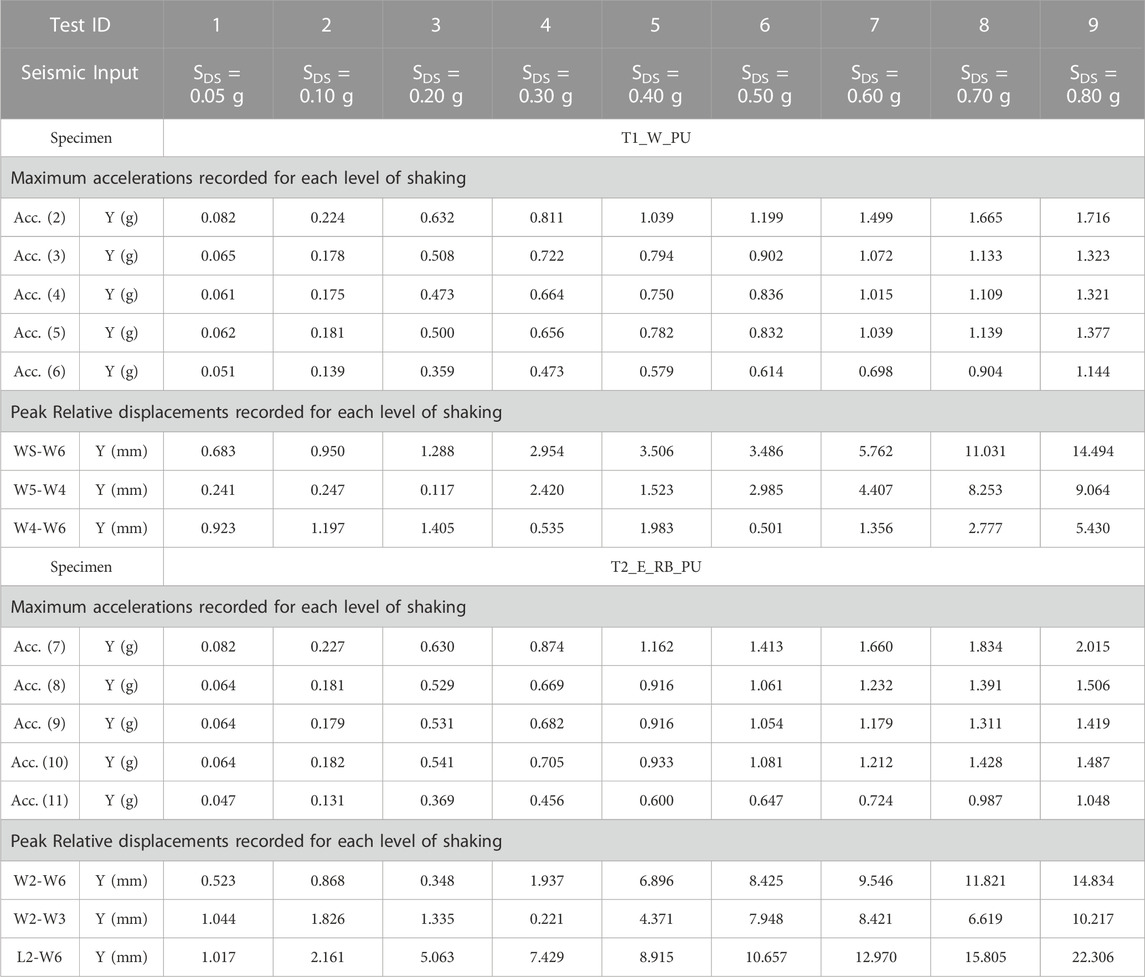
TABLE 3. Summary of the recorded quantities on the ACC infills.
The damage observed during the experimental campaign exhibited similarities for both tested walls, including partial fractures of the AAC blocks and cracks in the PU joints. However, it should be noted that the damage in the innovative AAC infill walls appeared after the ninth test. Based on the results, it can be deduced that both walls maintained the structural integrity up to an IDR of approximately 7‰, with only minor damage observed for an IDR of about 10‰. For a more detailed analysis, please refer to the subsequent section.
To further investigate the behavior of the walls during the shaking tests, a comparison was made between the accelerations recorded at the mid-height of the walls and the corresponding relative displacement measured between the center of the walls and the anti-overturing devices located at the bottom left of the experimental setup, as depicted in Figure 8. The obtained results are plotted in Figures 11A, B for the two different specimens. This comparison allowed us to gain insight into the dynamic response of the walls, particularly in terms of their stiffness and deformation characteristics, and to better understand the distribution of forces and accelerations within the test setup. These findings can contribute to the development of more accurate analytical models and simulations of similar structural systems, as well as to the optimization of their design and performance.
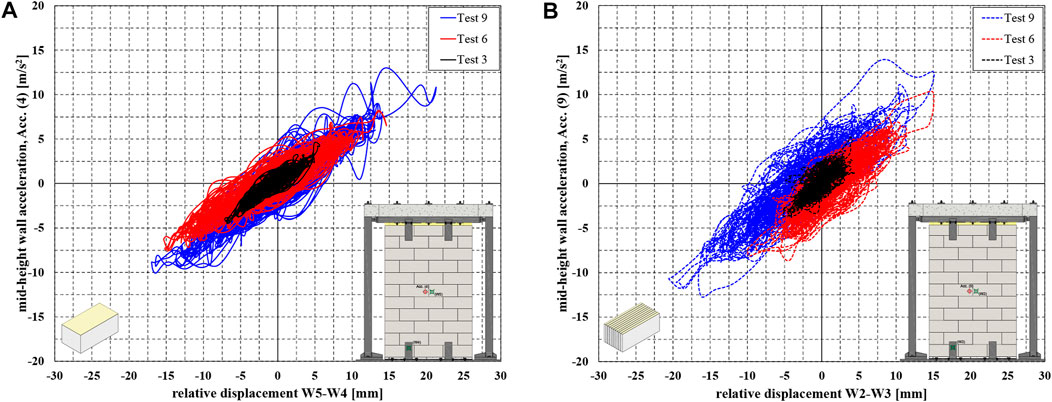
FIGURE 11. Plots of different seismic tests in Y direction for mid-height acceleration versus relative displacement recorder between centre of the infill and the anti-overturing device placed on the bottom left of the setup: (A) specimen T1_W_PU acc. (4) vs. relative displacement (W5-W4); (B) specimen T2_E_RB_PU acc. (9) vs. relative displacement (W2-W3).
The observed data (see Table 3; Figure 11) suggest that the reinforced AAC infill (T2_E_RB_PU) was characterized by the highest acceleration during the shake table test, likely due to its superior out-of-plane stiffness in comparison to the unreinforced counterpart (T1_W_PU). Out-of-plane damage in AAC walls refers to the damage that occurs perpendicularly to the wall plane, which can result from various sources such as impact, improper installation, foundation settlement, natural hazard-induced accelerations, or moisture intrusion. The most common type of out-of-plane damage in traditional AAC walls assembled with mortar joints is a horizontal crack that appears at the center of the AAC infill wall, forming a V-shaped crack in the wall geometry (Binici, 2017). In our experimental campaign, only light damage occurred close to the anti-overturning devices when the peak ground acceleration (PGA) was equal to 0.80 g, resulting in the ejection of small fragments of PU resin and AAC block debris (see Figure 10). Various studies in the literature (Cheng and He, 2018) on the seismic performance of AAC infills assembled without robots and using traditional mortar joints have shown damage occurring at an interstory drift ratio (IDR) of 12.5‰ for excitations in both directions. Horizontal and vertical cracks occurred in the AAC block masonry wall due to an acceleration of 1.90 g in the AAC panels. In our study, the maximum IDR obtained was approximately 10‰, and the maximum mid-height acceleration for both infills tested was almost equal to 1.40 g. Moreover, the connection system utilized to constrain the AAC infills is distinct from that used by Cheng and He (2018), but in both cases, there was no damage or loosening in the connection system. For the sake of clarity, Figure 12 illustrates the mid-height accelerations for the two types of infills tested, categorized by the various test levels of Table 3. The horizontal axis displays the different test levels, while the vertical axis shows the corresponding acceleration values recorded during the shake table tests. The gray bar represents the results for the T1_W_PU (unreinforced) wall specimen, while the dashed bar represents the results for the T2_E_RB_PU (reinforced). It is noteworthy that slightly higher accelerations were recorded for the reinforced infill across the various test levels, which is reasonable since it is stiffer compared to the unreinforced infill due to the presence of basalt fibers surrounding the blocks.
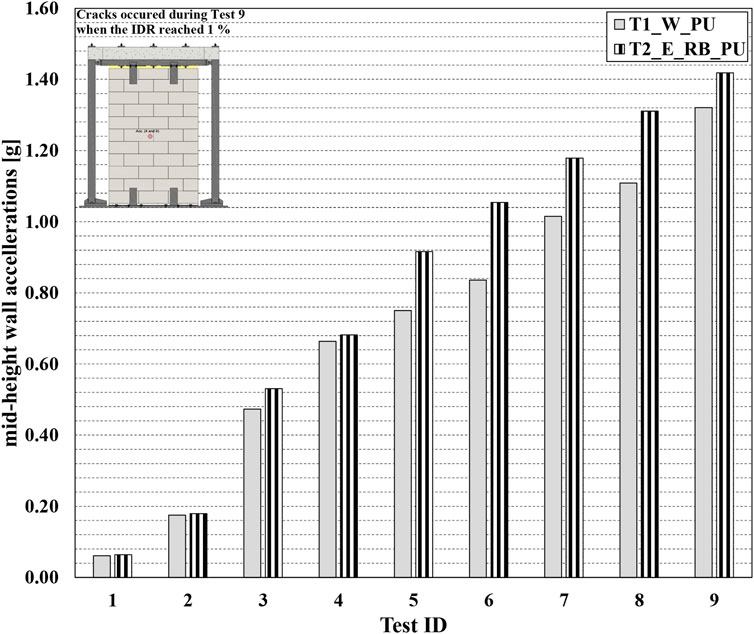
FIGURE 12. Comparison of the two types of AAC infills based on the accelerations recorded at half height of the infill walls across different test levels.
3.1 Dynamic identification
The evaluation of the natural frequency in the out-of-plane direction was conducted in this study using the transfer curve method, which involves analyzing the base and top acceleration time histories. At the end of each level of seismic input (Table 2) in the experimental test, low-intensity random (RND) excitations were applied to the infilled test frame to evaluate the change in natural frequency associated with potential damage in the out-of-plane direction. The resulting frequency values were determined based on the peak in the transfer curve (see Figure 13). The results indicated that the frequency of the infilled frame ranged from 4.57 to 4.49 Hz, demonstrating minor occurred damage. The dynamic identification results obtained in this study are summarized in Figure 13 for the more significant seismic levels. It should be noted that microdamage was observed only after test nine (see Figure 10); this involved small AAC block debris and minor joint separation to the extent of almost 10 mm. These findings suggest that the transfer curve method is a useful tool for accurately assessing the natural frequency of infilled test frames in the out-of-plane direction, and can help researchers to better understand the impact of various excitations on the structural integrity of these systems.
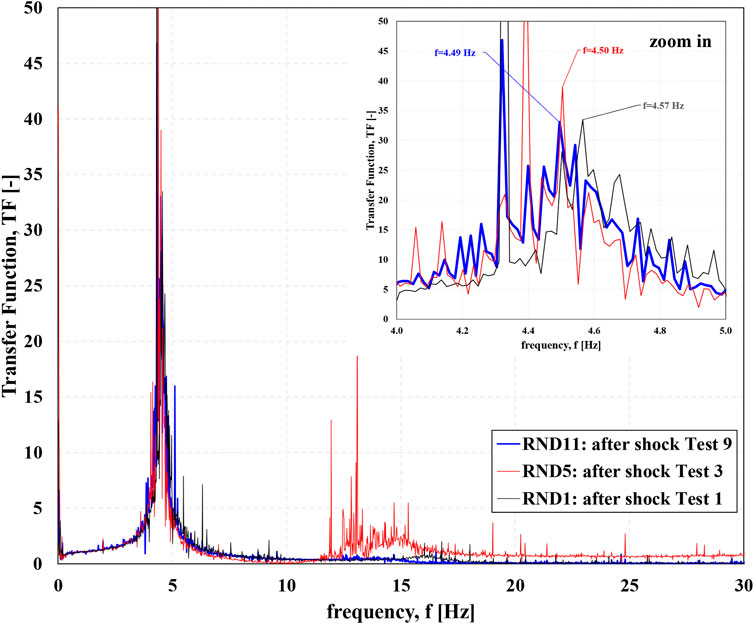
FIGURE 13. Transfer function of the infilled test frame in the out-of-plane direction for the different test levels.
It is noteworthy that the frequency of the infilled frame decreased as the seismic input intensity increased at different test levels, which is presumably due to the accumulation of slight damage in the samples. The frequencies of the infilled frame evaluated after tests one, five, and nine were 4.57, 4.50, and 4.49, respectively, as illustrated in Figure 13. The procedures for determining these frequencies are described in detail in CHOPRA 2001 (Chopra, 2001). The reduction in frequency observed in this study is consistent with previous research on the seismic performance of structures, which has shown that stiffness reduction due to damage accumulation results in a decrease in natural frequency. The reduction in natural frequency can have significant implications for the seismic response of the structure, as it can lead to resonance and amplify the seismic forces acting on the structure. Therefore, monitoring the natural frequency of a structure during a seismic event is crucial to assess its seismic performance and potential damage.
3.2 Damage description
The present study investigated the out-of-plane earthquake response of innovative AAC infills by considering three damage states (DS). These are defined as minor damage state (DS1), moderate damage state (DS2), and severe damage state (DS3). The achievement of each damage state corresponds to specific consequences for the non-structural element under investigation. For instance, the minor damage state implies the need to slightly repair the sample to restore its initial condition, while moderate damage requires partial replacement of the non-structural element due to significant damage. Finally, the severe damage state involves complete replacement of the non-structural element, as the protection of human life can no longer be guaranteed. During the experimental campaign, the damage state observed was DS1, where the wall requires only minor repairs of exterior finishes after test nine. Importantly, this damage state has no effect on the performance of the other components, and the structure can be used immediately. Detailed definitions of the damage states and their repercussions are provided in Table 4, which is based on the definitions suggested by Taghavi and Miranda (2003) and already applied in the study by Petrone et al. (2014).
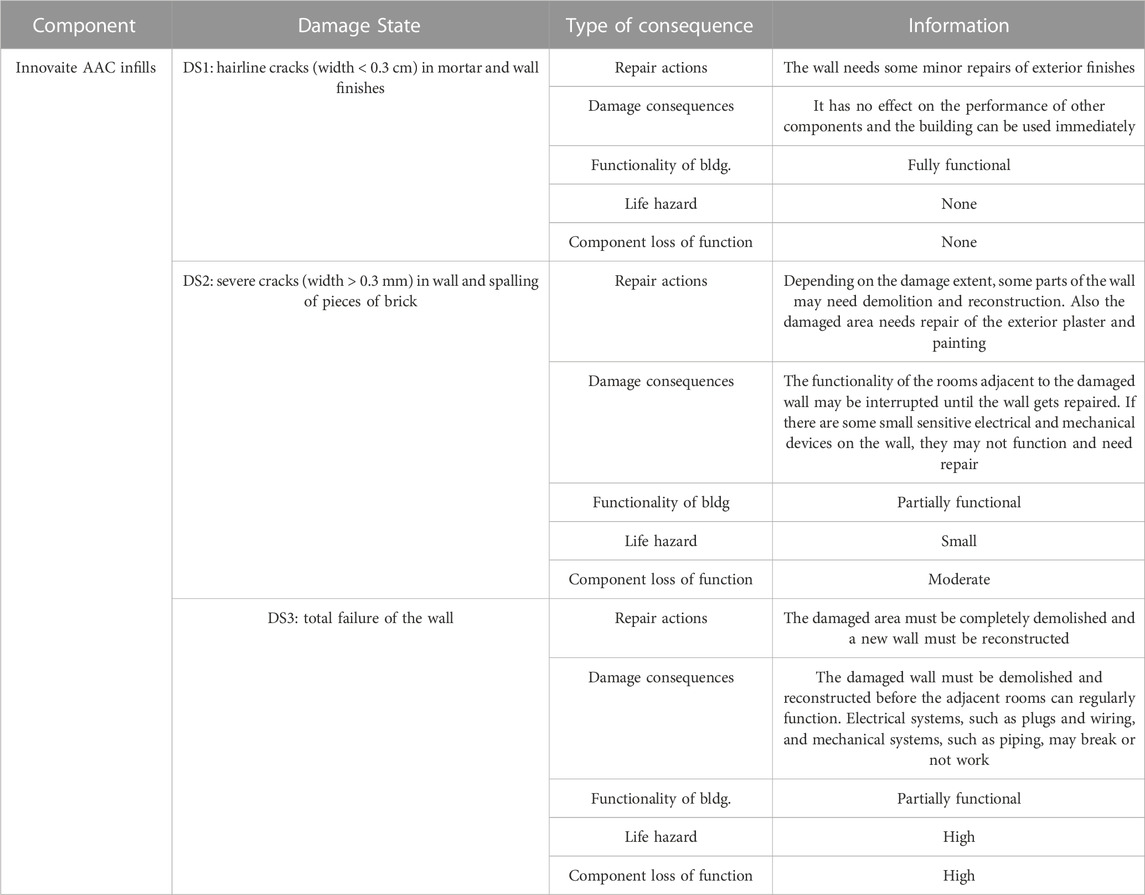
TABLE 4. Damage state definitions and their repercussions for innovative AAC infills (Petrone et al., 2014).
It is noteworthy that the definitions of damage levels within the FEMA code (Federal Emergency Management Agency FEMA, 2007) have been comprehensively presented in Table 4. This table outlines the means by which each damage level can be characterized in terms of the impact on human life (deaths), financial loss associated with repair or replacement of non-structural components (dollars), and loss of functionality or operability (downtime). Further elaboration on this topic can be found in Petrone et al. (2017). These definitions of damage levels can also be related to the requirements for limit states as defined by the Italian structural code (Norme tecniche per le Costruzioni, 2008), wherein distinct performance levels are associated with different limit states. Specifically, the Italian structural code requires stability checks for non-structural elements, with the aim of avoiding their possible expulsion under seismic loads in the out-of-plane direction. It is worth noting that the Italian structural code refers to completely infilled structures and therefore with reactive infills also in the in-plane direction. This requirement applies to infills that are rigidly connected to the structure and which might interfere with its deformability, as well as infills designed to avoid damage under high interstory drifts. In the case of the former, the code stipulates that the infills be analyzed using Eq. 3.1 for brittle infills and Eq. 3.2 for flexible infills, while the latter should be designed to withstand the effects of interstory drifts as per Eq. 3.3.
Where q is the behavioural factor defined in paragraph 7.3.1 of the Italian code (Norme tecniche per le Costruzioni, 2008) and IDR is the interstory drift ratio, that is, the ratio of interstory displacement (dr) to story height (h). The preceding equations are applicable to the limit state of damage (SLD) as defined in the Italian code (Norme tecniche per le Costruzioni, 2008). It is important to note that for structures falling under use class III and IV, which include constructions with significant occupancy and those with public or strategic functions (Norme tecniche per le Costruzioni, 2008), the reference must be made to the limit state of operation (SLO), wherein the interstory drift ratio (IDR) must not exceed two-thirds of the previously specified limits. Furthermore, the strength checks must conform to the safeguard life limit state (SLV) and the ductility checks must ensure that both individual structural elements and the structure as a whole possess sufficient ductility capacity to withstand the demands of ductility as evidenced by static or dynamic non-linear analysis. By analogy with the three damage states (DS1, DS2, and DS3) considered, these can be correlated respectively to the SLO, SLD, and SLV described above, or alternatively, to the performance levels prescribed in the FEMA code (FEMA, 1997), i.e., immediate occupancy (IO), life safety (LS), and collapse prevention (CP). The shake table tests revealed similar damage to both innovative AAC infill types studied (T1_W_PU and T2_E_RB_PU), with no significant damage recorded for the seismic levels investigated. However, microcracks were observed in the corners near the anti-overturing devices (DS1). This is reflected in Figure 13, which shows a slight decrease in frequency after test nine, indicating a decrease in stiffness and an accumulation of damage. Notably, both innovative AAC infills tested were undamaged for IDR values smaller than 0.5%, a limit value recommended by the Italian code (Norme tecniche per le Costruzioni, 2008). Moreover, the tests showed no significant differences in the dynamic behavior of the two AAC infills studied, except for the accelerations recorded at the mid-height of the walls. Specifically, the T2_E_RB_PU specimen exhibited greater accelerations in the out-of-plane direction.
4 Conclusion
To investigate the behavior of innovative automated fabricated AAC infills under out-of-plane seismic loads, a series of dynamic tests were performed on a shaking table in the laboratory of the Department of Engineering and Architecture Structures at the University of Naples Federico II. The objective of these experiments was to evaluate the dynamic response of the infill walls, and ensure that the structural integrity of the walls, including their connection systems, would remain undamaged under high seismic acceleration. Two types of AAC infills made of “Active” (commercial name) AAC blocks and polyurethane foam bonded joints were tested, one with basalt fibers arranged longitudinally to each block as reinforcement system, and the other without reinforcement (see Figure 2). The tests, as per the AC156 standard, involved applying different levels of artificial inputs to the shake table, starting from a peak ground acceleration of 0.5 m/s2, and gradually increasing to values of about 11 m/s2. For the sake of clarity, the following are the main results of the tests carried out:
• The acceleration amplification factor (AAF) of the innovative infilled frame was found to be approximately 2.5, in line with the recommendations of ASCE 7-16. Notably, ASCE 7-16 provides a range of AAF values (between 1.0 and 2.5), depending on the structural system, design criteria, and the intensity of the ground motion.
• The dynamic identification procedures and experimental results indicated that the AAC infills arranged in the steel frame are able to produce a slight increase in the global stiffness. In particular, the installation of the infills within the steel supports increased the frequency of the system from 4.1 Hz to about 4.5 Hz in the Y direction. The frequency of the system remained almost unchanged at the end of the test, i.e., up to an SDS equal to 0.80 g, confirming the absence of significant damage in the AAC infills.
• The maximum acceleration recorded in the center of the infills in the out-of-plane direction was slightly higher for the infills with the polyurethane foam joint and block reinforcement. Specifically, it was about 1.32 g for the unreinforced infills and almost 1.42 g for those with reinforcement, likely due to its greater out-of-plane stiffness in comparison to the unreinforced counterpart.
• The maximum interstory drifts recorded in the Y direction were approximately 10‰, indicating a high intensity seismic event, and exceeding the damage limit state imposed by the Italian structural code (Norme tecniche per le Costruzioni, 2008) for non-structural elements. Since the calculated damage state (DS1, as reported in the previous paragraphs) was obtained by adopting a setup in which infill frames were placed just along the direction orthogonal to the applied load, it is reasonable to think that the results retrieved in this manuscript are conservative if compared to a scenario where infills are placed in all directions (including load direction).
Data availability statement
The raw data supporting the conclusion of this article will be made available by the authors, without undue reservation.
Author contributions
MG designed and carried out the tests; GB has taken care of the production of the innovative AAC infills tested; CM and AP were the supervisors of the entire study.
Funding
The authors acknowledge Ekoru S.r.l. for the activities conducted within the industrial project: “Ricerca e Sviluppo di nuovi materiali avanzati per costruzioni eco-sostenibili, con caratteristiche di elevata efficienza energetica e sicurezza anti sismica, da ottenersi con sistemi avanzati di produzione ad alte prestazioni, efficienti ed ecocompatibili” funded by the Italian Ministry of Economic Development: “Grandi Progetti R&S- PON, 2014/2020” Industria Sostenibile CUP: B18l17000450008.
Conflict of interest
Author GB was employed by the company Ekoru s.r.l. Company.
The remaining authors declare that the research was conducted in the absence of any commercial or financial relationships that could be construed as a potential conflict of interest.
Publisher’s note
All claims expressed in this article are solely those of the authors and do not necessarily represent those of their affiliated organizations, or those of the publisher, the editors and the reviewers. Any product that may be evaluated in this article, or claim that may be made by its manufacturer, is not guaranteed or endorsed by the publisher.
Supplementary material
The Supplementary Material for this article can be found online at: https://www.frontiersin.org/articles/10.3389/fbuil.2023.1168241/full#supplementary-material
References
Norme tecniche per le Costruzioni (2008). Gazzetta Ufficiale. n 29 del 14/02/2008, Supplemento ordinario n 30 [in Italian].
Ac156 (2000). Acceptance criteria for seismic certification by shake-table testing of nonstructural components.
American Society of Civil Engineers (2010). ASCE/SEI 7-10: Minimum design loads for buildings and other structures. Reston, Virginia, US.
ASCE 7-16, American Society of Civil Engineers (2017). Minimum design loads and associated criteria for buildings and other structures.
Binici, B. (2017). Behaviour of AAC infilled RC frames under in plane and out of plane seismic demands. Aust. Earthq. Eng. Soc.
Cheng, C., and He, L. (2018). Shaking table test study on a steel frame with autoclaved aerated concrete walls”.
Chopra, A. K. (2001). Dynamics of structures: Theory and applications to earthquake engineering. 2nd edn. Upper Saddle River: Prentice-Hall.
CSI (2000). SAP2000 integrated software for structural analysis and design. Berkeley, California: Computers and Structures Inc.
da Porto, F., Dona, M., Verlato, N., and Guidi, G. (2020). Experimental testing and numerical modeling of robust unreinforced and reinforced clay masonry infill walls, with and without openings. Front. Built Environ. 6, 2020. doi:10.3389/fbuil.2020.591985
Dakhli, Z., and Lafhaj, Z. (2017). Robotic mechanical design for brick-laying automation. Cogent Eng. 4 1, 1361600. doi:10.1080/23311916.2017.1361600
Del Vecchio, , , Ciro, , Pampanin, S., and Prota, A. (2018). Repair costs of existing RC buildings damaged by the L'Aquila earthquake and comparison with FEMA P-58 predictions. Earthq. Spectra 34 (1), 237–263. doi:10.1193/122916eqs257m
Di Domenico, M., Ricci, P., and Verderame, G. M. (2018). Experimental assessment of the influence of boundary conditions on the out-of-plane response unreinforced masonry infill walls. J. Earthq. Eng., 1–39.
EN 1998-1 (2004). (English): Eurocode 8: Design of structures for earthquake resistance – Part 1: General rules, seismic actions and rules for buildings. [Authority: The European Union Per Regulation 305/2011, Directive 98/34/EC, Directive 2004/18/EC].
Federal Emergency Management Agency (Fema), (2007). Interim protocols for determining seismic performance characteristics of structural and nonstructural components through laboratory testing. Washington DC, US: Report No. FEMA 461.
FEMA (1997). NEHRP guidelines for the seismic rehabilitation of buildings. Washington DC: Federal Emergency Management Agency. Report No. 273.
Gharbia, M., Chang-Richards, A., Lu, Y., Zhong, R. Y., and Li, H. (2020). Robotic technologies for on-site building construction: A systematic review. J. Build. Eng. 32, 101584. doi:10.1016/j.jobe.2020.101584
Ghazi Wakili, K., Hugi, E., Karvonen, L., Schnewlin, P., and Winnefeld, F. (2015). Thermal behaviour of aerated autoclaved concrete exposed to fire”.
Hancock, J., Watson-Lamprey, J., Abrahamson, N. A., Bommer, J. J., Markatis, A., McCoy, E., et al. (2006). An improved method of matching response spectra of recorded earthquake ground motion using wavelets. J. Earth Eng. Spec. Issue 10, 67–89. doi:10.1080/13632460609350629
International Code Council (Icc), (2000). International building code. 2000 Edition. Virginia, USA: Falls Church. (IBC 2000).
Magliulo, G., and Manfredi, G. (2011a). Shaking table test for analysis of seismic performance of Lafarge plasterboard partitions. Italy: Department of Structural Engineering, University of Naples Federico II.
Magliulo, G., Petrone, C., Capozzi, V., Maddaloni, G., Lopez, P., and Manfredi, G. (2014). Seismic performance evaluation of plasterboard partitions via shake table tests. Bull. Earthq. Engineering12 12, 1657–1677. doi:10.1007/s10518-013-9567-8
Magliulo, G., and Manfredi, G. (2011b). Shake table tests for analysis of the seismic performances of Lafarge pregymetal ceilings, 2010078–2010101.
Milanesi, R. R., Morandi, P., Magenes, G., and Albanesi, L. (2020). Out-of-plane response of an innovative masonry infill with sliding joints from shaking table tests. J. Earthq. Eng. 26, 1789–1823. doi:10.1080/13632469.2020.1739173
Mohsenian, V., Gharaei-Moghaddam, N., Mariani, S., and Hajirasouliha, I. (2023). Assessment of the effects of non-structural components on the seismic reliability of structures via a block diagram method. Structures 47, 2050–2065. doi:10.1016/j.istruc.2022.12.024
Morandi, P., Hak, S., and Magenes, G. (2018). Performance-based interpretation of in-plane cyclic tests on RC frames with strong masonry infills. Eng. Struct. 156 (1), 503–521. doi:10.1016/j.engstruct.2017.11.058
Morandi, P., Hak, S., Milanesi, R. R., and Magenes, G., (2021). In-plane/out-of-plane interaction of strong masonry infills: From cyclic tests to out-of-plane verifications. Earthq. Eng. Struct. Dyn. 51, 648, 672. doi:10.1002/eqe.3584
Paulay, T., and Priestley, M. J. N. (1992). Seismic design of reinforced concrete and masonry buildings. New York: Wiley.
Petrone, C., Magliulo, G., and Manfredi, G. (2014). Shake table tests for the seismic assessment of hollow brick internal partitions. Eng. Struct. 72, 203–214. doi:10.1016/j.engstruct.2014.04.044
Petrone, Crescenzo, Magliulo, Gennaro, and Manfredi, Gaetano (2017). Shake table tests on standard and innovative temporary partition walls. Earthq. Eng. Struct. Dynamics46 10, 1599–1624. doi:10.1002/eqe.2872
Taghavi, S., and Miranda, E. (2003). Response assessment of nonstructural building elements, PEER report 2003/05. Berkeley: University of California, 1–96.
Keywords: autoclaved aereated concrete (AAC), non-structural components, out-of-plane behavior, shake table (ST) tests, automation and robotics
Citation: Giulivo M, Borretti G, Prota A and Menna C (2023) Out-of-plane behavior of innovative infill walls made of autoclaved aereated concrete (AAC) subjected to shake table tests. Front. Built Environ. 9:1168241. doi: 10.3389/fbuil.2023.1168241
Received: 17 February 2023; Accepted: 05 June 2023;
Published: 23 June 2023.
Edited by:
Stefano Silvestri, University of Bologna, ItalyReviewed by:
Tadesse Gemeda Wakjira, University of British Columbia, CanadaPaolo Morandi, Eucentre, Italy
Copyright © 2023 Giulivo, Borretti, Prota and Menna. This is an open-access article distributed under the terms of the Creative Commons Attribution License (CC BY). The use, distribution or reproduction in other forums is permitted, provided the original author(s) and the copyright owner(s) are credited and that the original publication in this journal is cited, in accordance with accepted academic practice. No use, distribution or reproduction is permitted which does not comply with these terms.
*Correspondence: Marco Giulivo, bWFyY28uZ2l1bGl2b0B1bmluYS5pdA==; Giovanbattista Borretti, Z2lvdmFuYmF0dGlzdGEuYm9ycmV0dGlAZWtvcnUuaXQ=; Andrea Prota, YW5kcmVhLnByb3RhQHVuaW5hLml0; Costantino Menna, Y29zdGFudGluby5tZW5uYUB1bmluYS5pdA==