 Yihui Guo
 Mingbao Li1*
- 1School of Civil Engineering, Northeast Forestry University, Harbin, Heilongjiang, China
- 2School of Civil and Hydraulic Engineering, Huazhong University of Science and Technology, Wuhan, Hubei, China
A damage-softening model for a reinforced soil interface is proposed based on the trilinear model of a reinforced soil pullout interface, aiming at the softening phenomenon of the geogrid reinforced soil interface during the pullout process and considering the damage softening of the reinforced soil interface during the pullout process. The damage variable factor D is introduced, and it is assumed that D is a function of the interface displacement. The two-parameter Weibull distribution function is used to express the damage evolution law of the reinforced soil interface. Based on the basic control equation of the reinforced soil interface, the calculation model of the stress state of the geogrid at different stages under the pullout load is deduced. To verify the accuracy and applicability of the model, the prediction results of the model are compared with the test results and the ideal elastic–plastic model, hyperbolic model, elastic–exponential softening model, and the damage softening model based on a lognormal distribution function proposed in this paper. The distribution of interfacial shear stress is studied, and the influence of parameters at each stage is analyzed. The results show that in the elastic stage, with the increase of shear stiffness, the maximum shear stress at the interface increases, and the curvature of the curve also increases, while the elastic modulus is the opposite. In the softening stage, with the increase of softening length, the peak value of the curve moves to the free end. In the residual stage, the shear stress increases from the drawing end to the free end and tends to the residual stress. The research results are in accordance with the actual situation and can be applied to reinforced soil engineering.
1 Introduction
Geogrid is geosynthetic material widely used in embankments (Badanin and Kolosov, 2012), slopes, and retaining walls (Ibrahim, 2021). As a geotechnical structure, the grid itself and the reinforced soil are topics of research (Aleksandrov et al., 2016; Polyankin, 2020). Most experimental studies of the interface for reinforced soil find that the geogrid reinforced soil is destroyed by the reinforced soil interface damage (Gurung, 2000; Zhang et al., 2004; Jin et al., 2017; Qiu et al., 2018; Morsy et al., 2019). Because of the sensitive and complex characteristics of the interface, theoretical research still lags behind engineering practice. Liu et al. (2013) believed that the interface shear stress and shear displacement of the reinforcement and soil always maintained a linear relationship, while Gurung analyzed a hyperbola (Misra et al., 2004) with a double linear constitutive model. All the above studies believe that the shear stress in the drawing process of reinforcement has a linear change trend with the displacement, but existing studies have shown that the shear stress should have a nonlinear change trend with the displacement. The aforementioned theoretical methods and calculation models cannot accurately show the progressive process of the interface shear stress and strain.
To reflect the interface friction characteristics of the reinforcement in the drawing process more accurately, Zhu et al. (2014) obtained analytical solutions of the interface shear stress and axial force of the reinforcement and soil under the drawing load through a three-parameter model. Du and Yi (2020) obtained analytical solutions for the corresponding processes by considering the interface hardening of the reinforcement and the interface softening of the reinforcement and soil. Although the aforementioned model is more accurate, it still assumes that the shear stress and displacement change linearly at each stage, which does not align with the non-linear asymptotic characteristics presented by the test results. Therefore, Huang et al. (2014) established a double exponential shear slip model for the anchor end of the bolt based on the actual test of the bolt, which can reflect the non-linear asymptotic characteristics and softening characteristics of the whole process. Although the existing reinforced soil interface can better simulate interface drawing behavior, it failed to accurately consider the non-linear characteristics of different stages of the whole process, even considering that the non-linear model cannot respond to each stage of the process. Based on this, Lai et al. (2018) proposed a reinforced soil interface flexibility index of the softening model. The model combines the exponential function and the advantages of the three parameters of the model and can better reflect reinforced soil softening and gradual characteristics. The stages are defined based on the improved model of axial force, shear stress, and the displacement analytic solution. The drawing process of load transfer and the shear stress distribution are based on comparatively detailed research, but the calculation is more complicated.
In the process of drawing, the interface of reinforced soil will appear damaged and softened (Yang et al., 2019; Huo et al., 2020; Wang and Zhang, 2020; Kou and Xu, 2021; Zhang et al., 2021). There are few studies on this aspect, especially on the interface influence coefficient. A review of the literature revealed that many metal materials and composite materials conform to a Weibull distribution (Cao et al., 2004; Han and Ga, 2019; Wang T. S. et al., 2022; Wang Z. J. et al., 2022; Wu, 2022) and a lognormal distribution (Zeng and Yu, 1991; Wang et al., 2019) in a fatigue damage stage (Guchinsky and Petinov, 2011; Petinov et al., 2016). Therefore, damage variable factor D is introduced in this paper and assumed to be a function related to interface displacement. Based on the Weibull and lognormal distribution functions, the interface damage and softening model of reinforced soil is proposed to deduce the reinforcement in the drawing. The distribution laws of tension, shear stress, and displacement in different test stages are analyzed, and the interface influence coefficient is analyzed. It is hoped that the results will provide theoretical guidance for practical reinforcement engineering.
2 Unified equation of reinforced soil interface
As shown in Figure 1, a micro-element body with the width and length of dx is taken along the axial direction of the bar to conduct the stress analysis. According to the force balance, there are
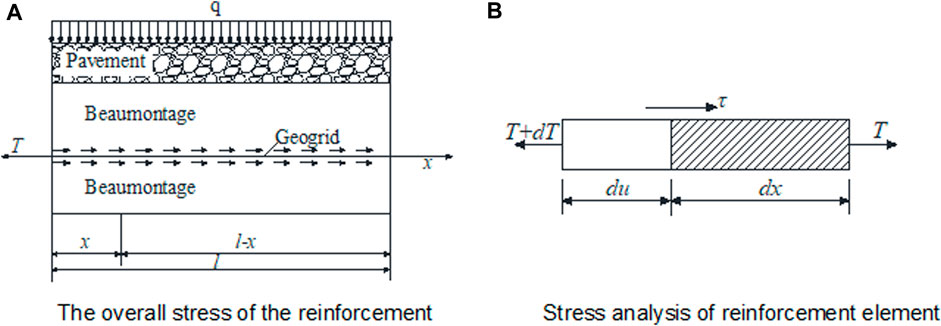
FIGURE 1. Schematic diagram of reinforcement force. (A) Overall stress of the reinforcement. (B) Stress analysis of reinforcement element.
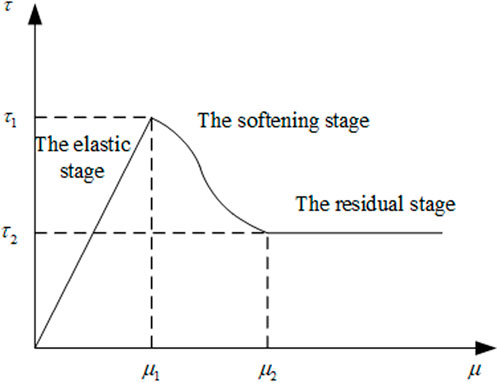
FIGURE 2. Relationship between shear stress and displacement at the damage-softening interface.
So
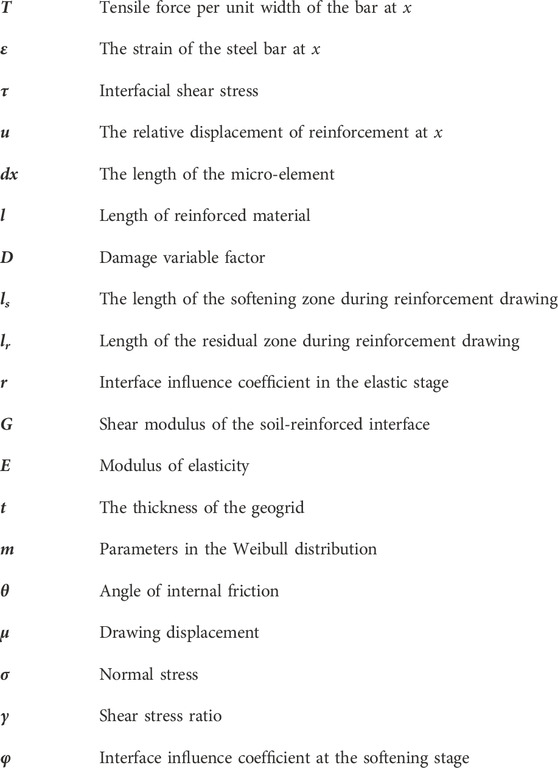
where T is the tension of the bar at the width of x,
where u is the relative displacement of the bar at x, and it is assumed that the strain is linearly related to the tension per unit width.
It can be obtained from Eqs 3–5.
In general, the actual strain in the drawing process is small and can be ignored, so Eq. 6 can be approximately expressed as
Equation 7 is the basic equation of the interface between reinforcement and soil, which is of great significance in studying the interface characteristics of reinforcement and soil.
3 Interface analysis of strain-softened reinforcement and soil
3.1 Interface damage and softening model of reinforced soil
Based on the results of the laboratory pullout test, the relationship curve between the interface shear stress and displacement of the interface strain softening of the reinforced soil can be simplified into a triplicate softening model, t1is the peak shear stress,t2 is the residual shear stress after softening, u1 and u2 are the corresponding displacements of t1 and t2 respectively. In this model, the interface of the reinforced soil first exhibits elasticity, then interface softening appears. Finally, the interface strength decreases until the stress residual appears, which is characterized by the upward branch reaching the peak shear strength, then decreasing to the residual shear strength, and finally, remaining unchanged. Based on the definition of damage factor variable D proposed by Rabotnov, the damage evolution of the soil-reinforced interface is introduced from the reduction of effective length or effective area in the process of geogrid damage, where D adopts the ratio of damage length to original length.
where
According to Eq. 11, the damage factor variable D represents the damage degree of the reinforced soil interface in the drawing process. D∈[0, 1]. In the damage model, the shear stress of the length of the damaged part does not decrease to zero, and it can still bear part of the shear stress. Therefore, Eq. 11 becomes:
For the geogrid bearing of undamaged length
In order to establish the interface damage softening model of reinforced soil, according to Lemaitre’s principle of strain equivalence, the constitutive relation of geogrid in the damaged state is the same as that in the non-damaged state. The interface shear stress displacement relation in the damaged state can be obtained by multiplying the damage factor D in the non-destructive state. For the 0 ≤ u ≤ u1 segment, the damage effect is ignored, and for the u1 ≤ u ≤ u2 segment, the damage factor variable D∈(0,1). For the u ≥ u2 segment, the damage factor variable D = 1. For the shear stress and displacement damage softening model of a tripled-line interface of reinforced soil, the relationship between interface shear stress and displacement is
Here, G is the interface shear modulus of reinforcement and soil
3.2 Analysis of the drawing process of the interface softening model of reinforced soil
Hypothesis. The drawing process of reinforced soil is divided into five stages: elasticity, elastic–softening, softening, softening–residual, and residual. Schematic diagrams correspond to Figures 3A–E, where
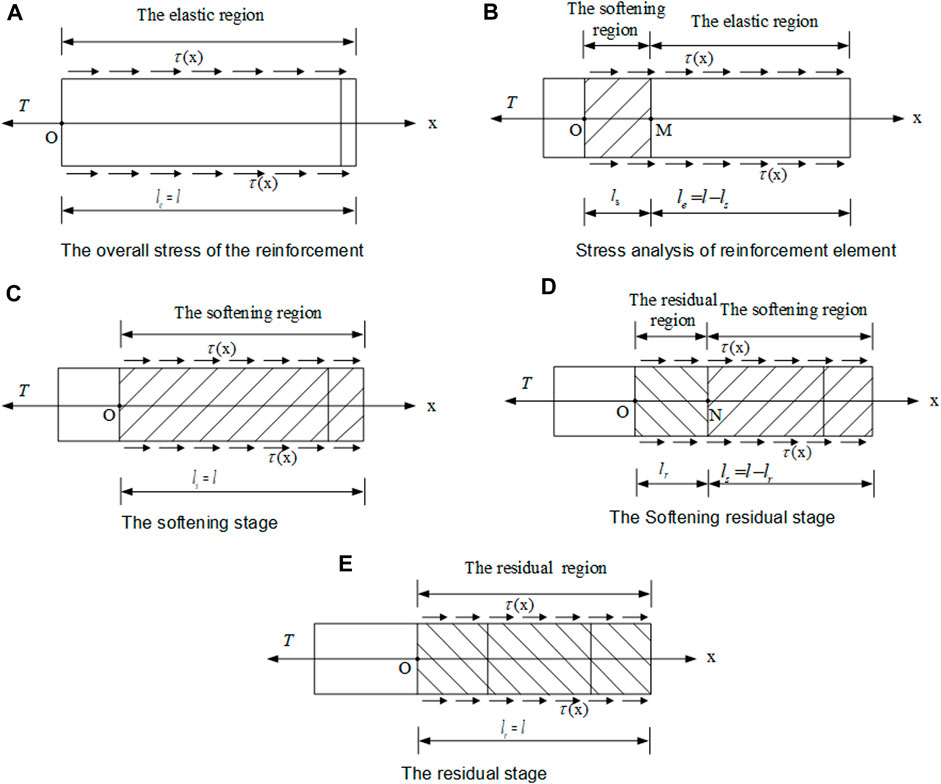
FIGURE 3. Progressive drawing process of reinforcement. (A) Elastic stage. (B) Elastic–softening stage. (C) Softening stage. (D) Softening–residual stage. (E) Residual stage.
3.2.1 The elastic stage
When 0 ≤ u ≤ u1, the interface of reinforcement and soil is in the pure elastic stage, the effective length of reinforcement in the elastic zone is l, and the interface shear stress and displacement meet the requirements of
A parameter is introduced here to simplify the calculation.
It can be solved by Eq. 16.
According to boundary conditions,
The displacement of the geogrid at any point is zero:
According to
3.2.2 The elastic–softening stage
When the drawing force continues to increase, the drawing end first enters the softening stage, that is, the geogrid within the range of the drawing end
The elastic stage (
where
In the softening stage
Here,
According to the boundary conditions of softening zone,
The displacement, drawing force, and interface shear stress of the geogrid in the softening zone can be obtained.
3.2.3 The softening stage
The softening stage begins from the elastic–softening stage, with the increase of the softening interval length, and continues until the interface of the reinforced soil is in the strain-softening stage. The boundary conditions are
3.2.4 The residual–softening stages
The residual state appears at the drawing end of the geogrid and then gradually develops along the free end of the geogrid. The analytical solutions of geogrid pullout force, displacement, and interface shear stress in the softening zone in the softening–residual stage can be obtained by replacing x and I with
Because the interfacial shear stress at point M is equal to the residual shear stress,
In the residual region, the interface shear stress is equal to the residual shear stress given by
According to the boundary conditions
where
3.2.5 The residual stages
In the residual stage, the geogrid pulling force does not change. The interfacial shear stress of the whole area of the grid is
Assuming that the displacement of the reinforcement at the drawing end is
To sum up, the aforementioned equations are based on the trilinear strain softening model in the elastic, elastic–softening, softening, softening–residual, and residual stages of geogrid reinforcement interface pullout force, displacement, and shear stress analytical solutions.
4 Interface parameter analysis
In the damage softening model, r and φ are the interface effect coefficients with
4.1 Weibull distribution function
Here, the Weibull function is written in logarithmic form.
where m is the shape parameter of the Weibull distribution function and the shape of the inverse function and
The model satisfies the condition.
Order
From this, we can obtain the following:
and therefore,
4.2 Lognormal distribution function
Assuming that
then
where
5 Model validation
To verify the accuracy of the damage softening model based on Weibull distribution, this paper introduces the results of the geogrid drawing test and several classical theoretical models, such as the ideal elastic–plastic model, the hyperbolic model, and the elastic–exponential softening model, which have been commonly used in previous studies, and conducts a comparative analysis at the same time. The normal stress was selected according to Shi et al. (2009) for 50 kpa and a soil compaction degree of 0.95 under the condition of cohesive soil. Then, a geogrid one-way drawing between test results validates that the parameters are as shown in Table 1. Here, to verify the accuracy of the filtered, the following values were selected: m = 2.954, u0 = 1.063 mm, μ = 3.22, and σ = 0.016. From Figure 4, it can be seen that the error of the ideal elastic–plastic model and the hyperbolic model is large, does not accurately describe the drawing characteristics of the reinforced soil interface, and fails to reflect the softening characteristics of the reinforced soil interface with the increase of the drawing displacement. The elastic–exponential softening model and the trilinear damage softening model under two different distribution functions are more accurate. In particular, after entering the softening stage, the coincidence of these three models is high, but the trilinear damage softening model is more concise.
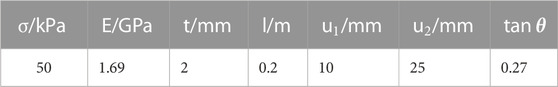
TABLE 1. Simulation parameters of the drawing test.
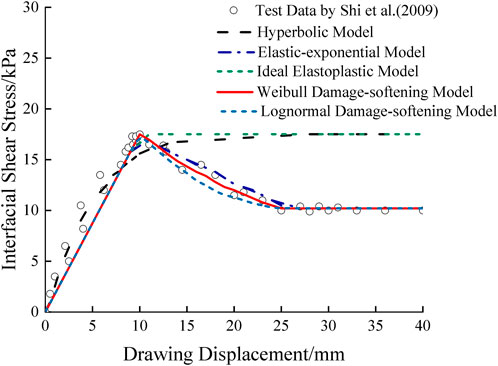
FIGURE 4. Comparison between shear stress and pullout displacement at the geogrid interface.
6 Distribution law of interface shear stress
The distribution law of interfacial shear stress can reveal the different stages of the evolution of interfacial shear stress. The reinforcement length l = 0.2 m, the normal stress
Figures 5A–E describe the distribution characteristics of interfacial shear stress at different stages. The figure shows that the shear stress of the interface in the elastic, elastic–softening, softening, and softening–residual stages is unevenly distributed along the direction of reinforcement length. With the increase of drawing load, the shear stress gradually transfers from the drawing to the free end. The distribution characteristics of shear stress with drawing displacement are shown as follows:
(a) When
(b) When
(c) When
(d) When
(e) When
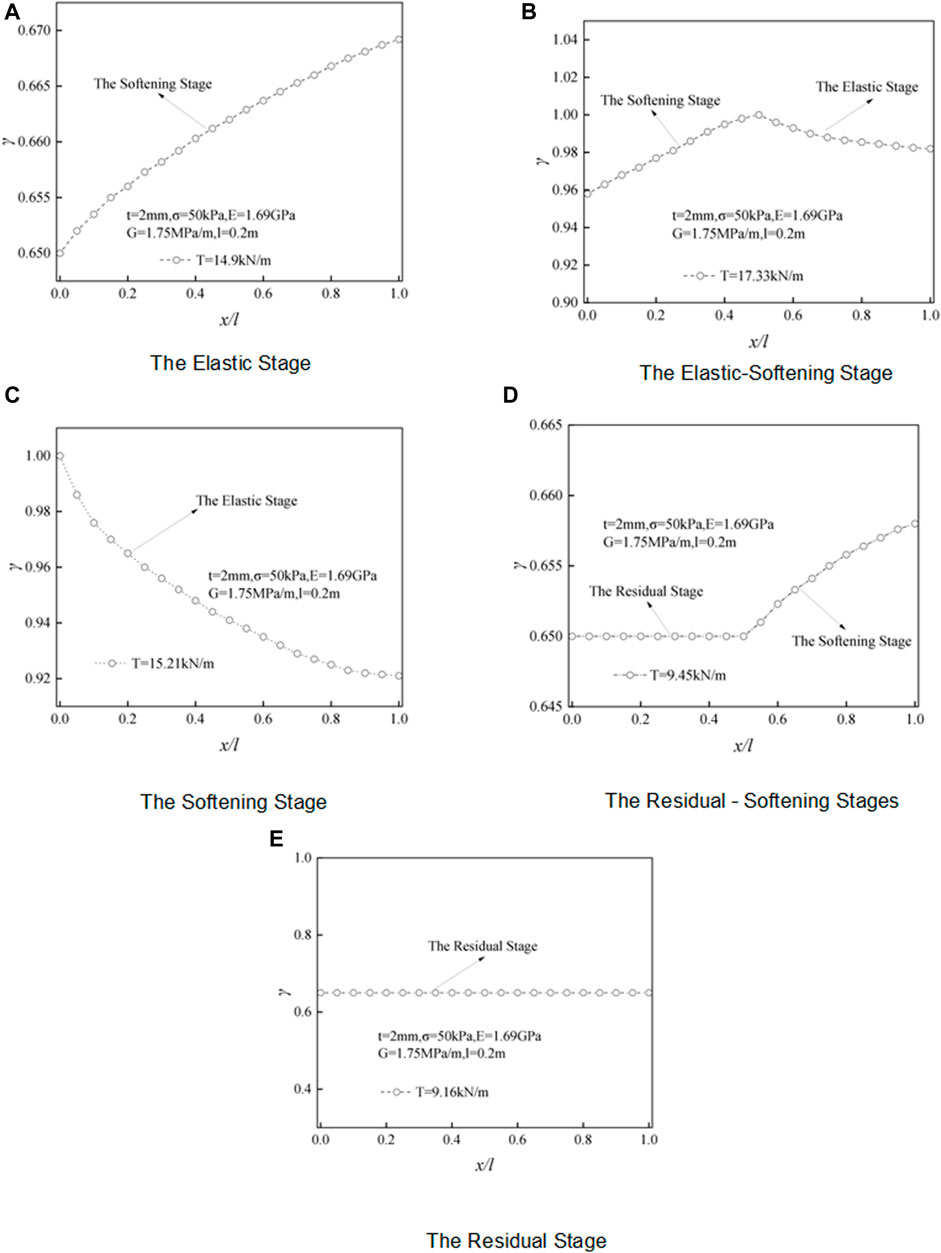
FIGURE 5. Shear stress distribution in the geogrid drawing process. (A) Elastic stage. (B) Elastic–softening stage. (C) Softening stage. (D) Residual–softening stage. (E) Residual stage.
7 Parameter influence analysis
According to the calculations, in the elastic stage, the interface shear stress is mainly affected by shear stiffness and elastic modulus. In contrast, in the softening and residual stages, the interface shear stress is mainly affected by the length of the softening interval, reinforcement length, damage factor variables, and residual length.
7.1 The elastic stage
Figure 6 shows the influence of shear stiffness on the interface shear stress. Before entering the plastic stage, the interface shear stress gradually decreases with the increase of displacement and presents a non-linear decrease. The maximum shear stress is located at the drawing end. With the increase of G, the maximum shear stress also increases, the curvature of the curve is larger, and the non-linear characteristics are more obvious.
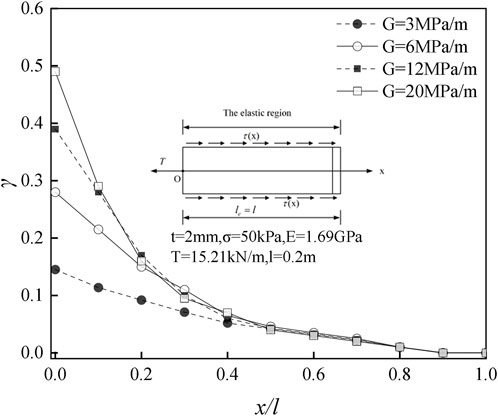
FIGURE 6. Influence of shear stiffness on interface shear stress at each position.
Figure 7 shows the effect of elastic modulus on interface shear stress. The interface shear stress decreases nonlinearly with the increase of displacement. The influence of different elastic moduli on the interface shear stress shows that the larger the elastic modulus is, the smaller the maximum shear stress is, the larger the curvature of the curve is, and the more obvious the non-linear characteristics are.
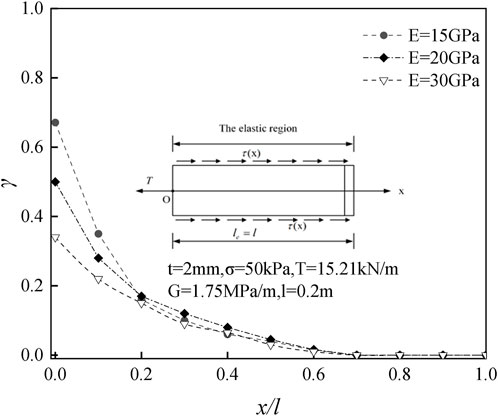
FIGURE 7. Influence of elastic modulus on interface shear stress at each position.
7.2 The softening stage
Figure 8 shows the effect of softening length on interfacial shear stress. The interfacial shear stress increases first and then decreases from the drawn end to the free end. The extreme value point is located in the critical point between the elastic and elastic–softening intervals. With the increase of softening length, the maximum shearing stress moves toward the free end. The softening area interface shear stress and softening are closely related to the interval length, and the elastic area is negatively correlated.
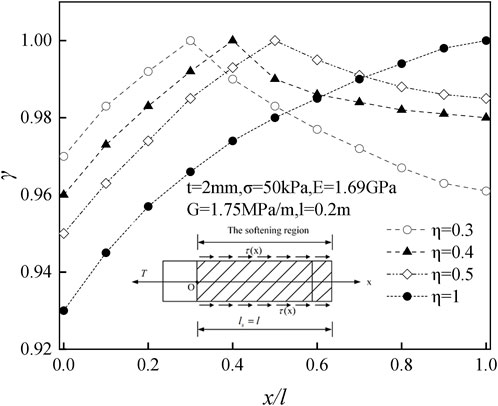
FIGURE 8. Influence of softening length on interface shear stress at different positions.
7.3 The residual stage
Figure 9 shows that as the length of the residual stage increases, the shear stress gradually becomes stable and presents a horizontal distribution after entering the complete residual stage, which is consistent with the hypothesis.
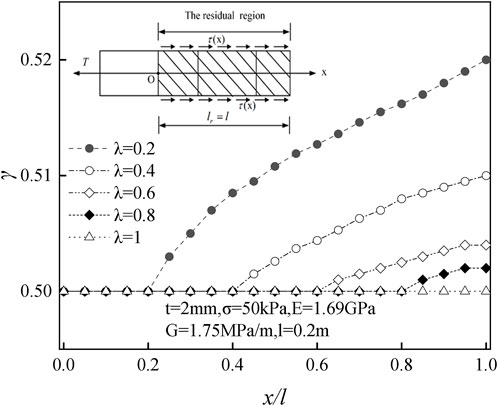
FIGURE 9. Influence of residual length on interface shear stress at different positions.
8 Conclusion
Through the introduction of damage factors, the damage softening model of the reinforced soil interface is established, the shear stress expressions at each stage of the reinforced soil interface drawing are derived, the influence of each parameter on the constitutive model is explored, and the previous constitutive models of the reinforced soil interface are compared and analyzed. These topics are discussed herein.
(1) The reinforced soil interface drawing force and displacement relationship is not always a linear distribution; therefore, the damage softening model is introduced. The damage factor is considered as a Weibull distribution function, and although the basic control equation of the reinforced soil interface was deduced at various stages of the relation, the formula of drawing force and displacement can be a very good non-linear response of reinforced soil interface damage.
(2) The existing hyperbolic model and ideal elastoplastic model cannot accurately reflect the progressive failure and non-linear characteristics of the interface. In the softening phase, the trilinear model overestimated the interface shear stress, which could result in a design that is not safe. The elastic–index softening model and damage softening model can indicate more gradual damage characteristics of reinforced soil interface better than other models. It has good applicability and can be used to study the interface drawing characteristics of a geogrid. The calculation of the damage softening model is simpler.
(3) In the process of geogrid drawing, with the increase of shear stiffness, the maximum shear stress also increases. The greater the elastic modulus, the larger the curvature of the curve, and the smaller the maximum shear stress. The curvature of the curve is also smaller. Within the softening interval, with the increase of the softening length, the shear stress peak point moves to the free end. Shear stress in the residual stage is transferred from the drawn end to the free end until the whole region enters the residual stage.
Data availability statement
The original contributions presented in the study are included in the article/supplementary material; further inquiries can be directed to the corresponding author.
Author contributions
Y-HG contributed to the conception and writing of the paper, formula derivation, curve drawing and fitting, and discussion of various parameters. W-JY drew CAD drawings, and other authors contributed to the revision and final draft of the paper.
Funding
The financial support provided by the National Natural Science Foundation of China (51878313), Harbin Academic Leaders Funds (2013RFXXJ033), and Heilongjiang Province (LBH-Z21087) are gratefully acknowledged.
Acknowledgments
The authors would like to express their sincere thanks to the reviewers for their constructive comments and suggestions.
Conflict of interest
The authors declare that the research was conducted in the absence of any commercial or financial relationships that could be construed as a potential conflict of interest.
Publisher’s note
All claims expressed in this article are solely those of the authors and do not necessarily represent those of their affiliated organizations, or those of the publisher, the editors, and the reviewers. Any product that may be evaluated in this article, or claim that may be made by its manufacturer, is not guaranteed or endorsed by the publisher.
References
Aleksandrov, A. S., Kalinin, A. L., and Tsyguleva, M. (2016). VDistribution capacity of sandy soils reinforced with geosynthetics. Mag. Civ. Eng. 66 (6), 35–48. doi:10.5862/mce.66.4
Badanin, A., and Kolosov, E. S. (2012). Determining the bearing capacity of soil foundation reinforced by geogrid. Mag. Civ. Eng. 35 (4), 25–32. doi:10.5862/mce.30.4
Cao, W. G., Zhao, M. H., and Liu, C. X. (2004). Study on rock damage softening model and its correction method based on Weibull distribution. Chin. J. rock Mech. Eng. 23 (19), 3226–3231.
Du, C. B., and Yi, F. (2020). Analysis of whole process of elastic-plastic model of reinforced soil interface. J. China coal Soc. 45 (12), 4062–4073. doi:10.1155/2020/5680521
Guchinsky, R. V., and Petinov, S. V. (2011). Fatigue of fillet-welded joint assessment by the FEA simulation of damage accumulation. Mag. Civ. Eng. 22 (4), 5–9. doi:10.5862/mce.22.5
Gurung, N. A. (2000). A theoretical model for anchored geosynthetics in pull out tests. Geosynth. Int. 7 (3), 269–284. doi:10.1680/gein.7.0175
Han, Y. B., and Ga, L. (2019). Analysis of energy detection performance under compound weibull-LogNormal fading. J. ningxia Univ. 40 (4), 298–302.
Huang, M. H., Zhou, Z., and Ou, J. P. (2014). Nonlinear full-history analysis of pull-out force in anchor segment of tension anchor bolt. Chin. J. rock Mech. Eng. 33 (11), 2190–2199. doi:10.13722/j.cnki.jrme.2014.11.004
Huo, S. Y., Jin, K. H., and Yang, T. (2020). Creep damage and constitutive model of sandstone under drying-wetting cycle. J. Civ. Eng. Manag. 37 (2), 164–169. doi:10.1007/s11629-020-6284-z
Ibrahim, Y. E-H. (2021). Abdelsalam SSA and Nabil MNA et al Earth pressure reduction on retaining walls using EPS geofoam. Mag. Civ. Eng. 0 (99), 9904–9990. doi:10.18720/MCE.99.4
Jin, J., Yang, G. Q., and Liu, W. C. (2017). Experimental study on the effect of rib spacing on the drawing characteristics of geogrid. China Railw. Sci. 38 (5), 01–08. doi:10.3969/j.issn.1001-4632.2017.05.01
Kou, H. L., and Xu, K. (2021). Numerical simulation of BOND performance of GFRP bolt-mortar considering interface damage based on segmental model. J. Hebei Univ. Eng. 38 (3), 31–54.
Lai, F. W., Li, L. P., and Chen, F. Q. (2018). Elasticexponential softening Model and Properties of geogrids interface. J. Eng. Geol. 26 (4), 852–860.
Liu, X., Tang, X. W., and Shen, H. (2013). Study on the distribution of tensile force of reinforcement in reinforced soil structure. Chin. J. Geotechnical Eng. 35 (4), 800–804.
Misra, A., Chen, C. H., Oberoi, R., and Kleiber, A. (2004). Simplified analysis method for micropilepullout behavior. J. Geotechnical &Geoenvironmental Eng. 130 (10), 1024–1033. doi:10.1061/(asce)1090-0241(2004)130:10(1024)
Morsy, A. M., Zornberg, J. G., Han, J., and Leshchinsky, D. (2019). A new generation of soil-geosynthetic interaction experimentation. Geotext. Geomembranes 44 (4), 459–476.
Petinov, S. P., Guchinsky, R. V., and Sidorenko, V. G. (2016). Damage identity in fatigue assessment of structures. Mag. Civ. Eng. 61 (1), 82–88. doi:10.5862/mce.61.8
Polyankin, A. G. (2020). Korolev and Valeryevich et al Analysis of reinforced soil sustainability while tunnel construction. Mag. Civ. Eng. 0 (95), 80–89. doi:10.18720/MCE.95.8
Qiu, C. Q., Wang, S., Liu, H., and Huang, J. (2018). In-situ pull-out tests on soil-reinforcement interface properties of reinforced soil slopes. Ann. de Chimie Sci. des Matériaux 42 (1), 41–56. doi:10.3166/acsm.42.41-56
Shi, D., Liu, W. B., Shui, W. H., et al. (2009). Comparative experimental study on interface interaction characteristics between single and bidirectional plastic geogrids andDifferent fillers. Chin. J. geotechnical Eng. 30 (8), 2237–2244. doi:10.1016/S1874-8651(10)60073-7
Wang, L., Chen, X. W., and Hao, L. L. (2019). Feasibility study of pulse wave decomposition based on Lognormal function. J. Northeast. Univ. 40 (12), 1696–1699.
Wang, T. S., He, X. F., Wang, J. Y., and Li, Y. (2022). Detail fatigue rating method based on bimodal Weibull distribution for DED Ti-6.5Al-2Zr-1Mo-1V titanium alloy. Chin. J. Aeronautics 35 (4), 281–291. doi:10.1016/j.cja.2021.05.008
Wang, X. J., and Zhang, L. L. (2020). Study on viscoelastoplastic damage creep model of rock. Chin. J. geotechnical Eng. 42 (6), 1086–1092.
Wang, Z. J., Peng, J. G., and Guo, F. (2022). Prediction of steel corrosion in recycled concrete based on Weibull distribution. Concr. Cem. Prod. 4 (4), 84–93. doi:10.19761/j.1000-4637.2022.04.084.06
Wu, Y. J. (2022). The damage constitutive model of shale rock based on Weibull distribution and its verification. World Sci. Res. J. 8 (6), 272–280.
Yang, G. Q., Jin, J., Zhou, S. G., et al. (2019). Creep damage constitutive model of geogrids for reinforced soil retaining walls of high-speed railway. J. China Railw. Soc. 41 (3), 156–162.
Zeng, P., and Yu, X. L. (1991). Four-parameter Lognormal model for probabilistic fatigue damage mechanics. Acta aeronautica astronautica sinica 12 (1), a70–a74.
Zhang, M., Kong, Y. D., Liu, Y., Song, X., Zheng, A., Gao, H., et al. (2021). LncRNA CBR3-AS1 regulates of breast cancer drug sensitivity as a competing endogenous RNA through the JNK1/MEK4-mediated MAPK signal pathway. Sensors Microsystems 40 (9), 41–48. doi:10.1186/s13046-021-01844-7
Zhang, P., Wang, J. H., and Chen, J. J. (2004). Mechanical properties of reinforced soil interface in geotextile drawing test. J. Shanghai Jiaot. Univ. 38 (6), 999–1002.
Zhu, H. H., Zhang, C. C., Tang, C. S., Shi, B., and Wang, B. J. (2014). Modeling the pullout be-havior of short fiber in reinforced soil. Geotext. Geomem-branes 42 (4), 329–338. doi:10.1016/j.geotexmem.2014.05.005
Glossary
Keywords: reinforced soil interface, geogrid, damage softening model, the Weibull distribution, non-linear characteristic
Citation: Guo Y, Li M, Zheng J and Yao W (2023) Damage softening model and behavior of reinforced soil interface based on the Weibull distribution. Front. Built Environ. 9:1169567. doi: 10.3389/fbuil.2023.1169567
Received: 19 February 2023; Accepted: 14 April 2023;
Published: 09 May 2023.
Edited by:
Hoang Bao Khoi Nguyen, University of South Australia, AustraliaReviewed by:
Isaac Ahenkorah, University of South Australia, AustraliaBa-Phu Nguyen, Industrial University of Ho Chi Minh City, Vietnam
Copyright © 2023 Guo, Li, Zheng and Yao. This is an open-access article distributed under the terms of the Creative Commons Attribution License (CC BY). The use, distribution or reproduction in other forums is permitted, provided the original author(s) and the copyright owner(s) are credited and that the original publication in this journal is cited, in accordance with accepted academic practice. No use, distribution or reproduction is permitted which does not comply with these terms.
*Correspondence: Mingbao Li, bG1ibmVmdUAxMjYuY29t