- 1Department of Architecture, College of Architecture, Art and Design, Ajman University, Ajman, United Arab Emirates
- 2Department of Electrical Engineering, Engineering System Dynamics and Control Faculty of Engineering and IT, The British University in Dubai, Dubai, United Arab Emirates
A city’s microclimate is greatly impacted by urbanization. The ratio of building height to street width affects the thermal properties of urban canyons. This characteristic is one of the main elements that control the thermal radiation emitted and how much solar radiation is absorbed, causing the urban air temperature to be much greater than in rural areas (urban heat island effect). The main aim of this study is to examine the thermal effect of the variations in the height of housing buildings on the urban layout and canyons in the hot arid climate of the UAE. The study used a qualitative method based on ENVI-met software and a case study of an existing housing project to investigate the current situation and the future thermal conditions of proposed configurations. The study investigated two groups of configurations with unified and diverse heights. The results of the study found that the best case among the first group of configurations with unified heights was U3, which had unified mass heights reaching 20 m height, the highest H/W ratio, and the lowest sky view factor; it recorded 0.5°C reduction in the 2:00 p.m. air temperature compared to the base case. The results also revealed that in the case of diverse heights, it is better to locate the highest masses in the hot wind direction. The D2, with highest masses of 20 m height that were located only on the north and west sides of the area blocking the hot north-west prevailing wind, recorded a reduction about 0.9°C compared to the base case. Moreover, in the cases with lower air temperature, U3 and D2 recorded the best predicted mean vote readings, especially in the daytime, when the air temperature is highest.
1 Introduction and literature review
The most significant step for architectural designers is creating livable and environmentally friendly cities by establishing a sustainable urban form (Burton et al., 2013). Sustainable cities provide the users with a healthy mix of housing, commercial, and leisure facilities while meeting the needs of their residents and allowing them to easily access various locally provided facilities and transport nodes along comfortable paths (Moreno et al., 2021). Including passive design solutions in the level of urban design, such as increasing the level of shading, can help improve the thermal conditions in outdoor areas.
1.1 Building heights and urban heat islands (UHIs)
The urban heat island (UHI), which is the rise in temperature in urban environments, has increased in modern cities and communities. The demographic and activity makeup of metropolitan areas, in addition to the neighborhood layouts and designs of contemporary locations, all contribute to this effect (Detommaso et al., 2021). According to Salvati, Roura, and Cecere (2017) and Elmarakby et al. (2022), the UHI in modern districts increases building energy use and hastens climate change. Moreover, physical health, comfort, and development are facing difficulties as a result of the interaction between local UHI and global climate change. Because most people in the twenty-first century live in cities, preventing urban overheating is becoming more and more important (Santamouris et al., 2019). As Bueno et al. (2014) stated, UHI reduces heat evacuation through convection in metropolitan districts, particularly newer ones. In this situation, a variety of alternatives, including passive design solutions, such as increasing the shaded areas due to building height variation, can be incorporated into the planning of contemporary urban neighborhoods. UHI raises the temperature of urban areas, including urban centers, relative to rural and suburban areas, which raises the energy consumption of cities. Sangiorgio et al. (2020) mentioned that building height is the 8th of 11 factors that affect the absolute max UHI phenomenon.
Variations in building height can create a positive effect on the thermal performance of the area. Tall buildings could shade the streets and structures underneath, lowering the quantity of direct sunlight and, thus, the amount of solar radiation absorbed by these structures. It has been shown that spatial arrangement has a significant impact on air temperature. Moreover, the ventilation in a city can be impacted by tall structures. To improve ventilation and lessen the UHI effect, tall buildings can, for instance, produce a chimney effect where hot air is sucked up and away from the street level. Lan and Zhan (2017) stated that increasing the building height and density inevitably results in greater building shades. They added that building height is one of a group of parameters that together account for greater variance in outdoor air temperature. To reduce the UHI effect, they strongly advise that spatial organization be considered in future urban planning. Zheng et al. (2019) confirmed that vegetation and surfaces with tall structures of various heights are the two main types of land cover that have an impact on the thermal environment of the land surface and urban areas. They added that the land surface temperature fell from low-rise to high-rise residential buildings, and temperatures were lowest in high-rise residential areas. Shareef and Abu-Hijleh (2020) confirmed that compared to an urban layout with moderate variation in building heights, one with a large fluctuation in building heights led to a greater drop in outdoor air temperature.
1.2 Effect of building heights and height-to-width (H/W) ratios on the outdoor air temperature
Shishegar (2013) affirmed that in urban design, the variation in building height creates different height-to-width (H/W) ratios and urban layout and affects the outdoor air temperature and the wind speed. Moreover, she added that a street canyon’s H/W ratio has a major impact on how much solar energy is absorbed by buildings and the land between them. The amount of solar energy collected by the roadway surfaces rises as the H/W ratio is reduced. However, the varied surfaces of the urban roadway do not all receive this solar energy evenly. Basically, compared to vertical surfaces, the horizontal earth absorbs extra radiation from the Sun. Thus, the H/W ratio affects the earth’s surface temperature more than the facades and vertical surfaces. Placing a tall building next to a low-rise building causes the wind to increase by 90% and reduces the temperature by 1°C; thus, integrating a few high-rise buildings strategically will help increase the wind velocity inside the created canyon and thus decrease the air temperature (Priyadarsini and Wong, 2005). Heat is trapped in long, deep canyons with a high H/W ratio, and the air temperature rises. The airflow is effectively accessed by low H/W ratios of less than 0.3, and a significant amount of outdoor air flows through the canyon to lower the air temperature (Shareef and Abu-Hijleh, 2020).
Gamero-Salinas et al. (2021a) mentioned that considering the building form parameters (such as the height-to-depth ratio, open space ratio, and green plot ratio) that enhance air movement and lower the mean radiant temperature can provide thermally comfortable environments for typical social activities. The most thermally comfortable spaces for all activities during a normally warm hour are vertical and horizontal breezeways (Gamero-Salinas et al., 2021b). Dou (2014) stated that to enhance thermal comfort and lessen the consequences of climate change in urban settings, more compact urban forms with deeper urban canyons and green building coverings are recommended.
Li and Donn (2017) examined the relationships between urban heat islands, vertical temperature lapse rates, and the impact of tall structures on urban wind flows. They claimed that the outside temperature on the top floor of a 30-floor building would be 0.65° lower than on the bottom. They added that wind speeds also rise with height in the atmospheric boundary layer. In addition, tall buildings may experience an increase in heat loss from top stories as a result of simultaneous air pressure and velocity increases. Aflaki et al. (2014) mentioned that the air temperature inside the higher-floor unit is cooler than the lower-floor unit. The large difference in indoor air velocity between the lower and upper levels can explain this. According to Sangiorgia and Santamouris (2020), changes in building height have the most effect on whirlwind features because the height differences cause whirlwinds to grow proportionately, which in turn influences the air temperature and the weather. Salvati et al. (2017) stated that the average building height, which impacts structures’ solar gains, and maximum urban air temperatures, has emerged as the most crucial factor in urban morphology in regions with intense solar radiation and a narrow daily air temperature range. In the settings examined in such studies, a strong negative association (R2 = 0.7171) between the average building height and the cooling energy demand was discovered. Boudoukha and Zemmouri (2021) made an assessment based on measurements taken in situ throughout the summer and winter at various microclimate conditions. Their study compared two existing city apartment blocks and found that the taller one resulted in lower outside temperatures during the winter and summer. Also, the building’s passageway enhanced the accessibility and ventilation in a city block’s inside corner, but it may also increase wind speed, which could be uncomfortable for pedestrians. Zhang et al. (2020) stated that, in winter, a 10 m increase in street width resulted in a 0.17 °C increase in daytime temperature, whereas a 10 m increase in building height resulted in a 0.06 °C decrease in daytime temperature for the same street width. The number of floors in a building had a substantial impact on the daytime average temperature; however, when a building had more than 20 floors, the temperature did not change much with the height of the structure. Yang and Li (2015) mentioned that as building heights rise, the average urban albedo falls, and more solar radiation is generally absorbed as building height inequalities widen. Thus, a medium-density city with high-rise buildings and significant building height differences has the lowest average urban albedo.
1.3 The case study—Housing project
The case study for this research is a plot area in the Sheikh Zayed Housing Programme (SZHP) (Figure 1) in the Al-Raqaib neighborhood in Ajman, United Arab Emirates, with a contemporary residential urban fabric. The 306 detached, two-story villas in this district are part of a modern neighborhood with modern architectural features, including setbacks and open areas. The layout of the neighborhood is made up of ordered and separated roadways and horizontal and vertical rows of residential buildings. Around 11 open boulevards and outdoor areas of various sizes and shapes are included in the fabric. The purpose of the boulevards is to promote neighborhood gatherings and safe social interaction away from the noise and danger of the primary automotive traffic routes, particularly for children and young adults. The individual units in this area are surrounded by 11 outdoor common spaces. Some of the outside open spaces are as wide as 15 m. The existing housing project’s broad roadways and low-height dwelling units reduced the quantity of shade, which increased the outdoor temperature, on one hand, and produced uncomfortable thermal conditions for the users on the other.

FIGURE 1. Housing project (SZHP), the modern residential urban fabric—Raqaib 2 (Al-Raqaib housing, 2021a), (iskanZayed, 2021), 2 (Al-Raqaib housing map, 2021b).
As the case study housing project for this research is located in the hot arid climate of the UAE, the outside temperature setpoint (OUT_SET) in the UAE differs according to the annum timing. OUT_SET refers to the desired temperature set by a building or heating or cooling system to maintain the indoor temperature, which is typically influenced by the outdoor temperature. In the UAE, during the hot summer months, the OUT_SET may be set lower to maintain a cooler indoor temperature, while in the cooler winter months, the OUT_SET may be set higher to maintain a warmer indoor temperature. Moreover, the value of the OUT_SET in the UAE depends on other factors, such as the type of building, the intended use of the space, and the prevailing weather conditions. Typically, in the UAE, the OUT_SET for commercial buildings such as offices, malls, and hotels is set to around 24°C–26°C, while for residential buildings, it may be set slightly higher at around 26°C–28°C. However, these values may vary depending on the specific requirements of the building and the preferences of the occupants. Additionally, during the summer months when outdoor temperatures can exceed 40°C, the OUT_SET may be set lower to maintain a cooler indoor temperature and ensure the comfort of the occupants. Thus, designing urban areas with passive strategies and decreasing the outdoor temperature can help improve the OUT_SET temperature. Moreover, Nie et al. (2022) mentioned that one of the key elements influencing the quality of life and livability of outdoor space is outdoor thermal comfort, which has received significant attention in urban planning and architecture. Hence, a variety of thermal indicators, such as OUT SET and the universal thermal climate index (UTCI), have been developed globally to measure it.
This research aimed to examine better thermal scenarios related to height variation in housing projects, which has rarely been discussed in previous research. Research on housing in hot arid climates such as the UAE was limited. This research is anticipated to assist in designing sustainable housing projects and fill the gap to improve the outdoor thermal conditions and thermal comfort for the users while also lessening the impact of the urban heat island.
2 Methodology
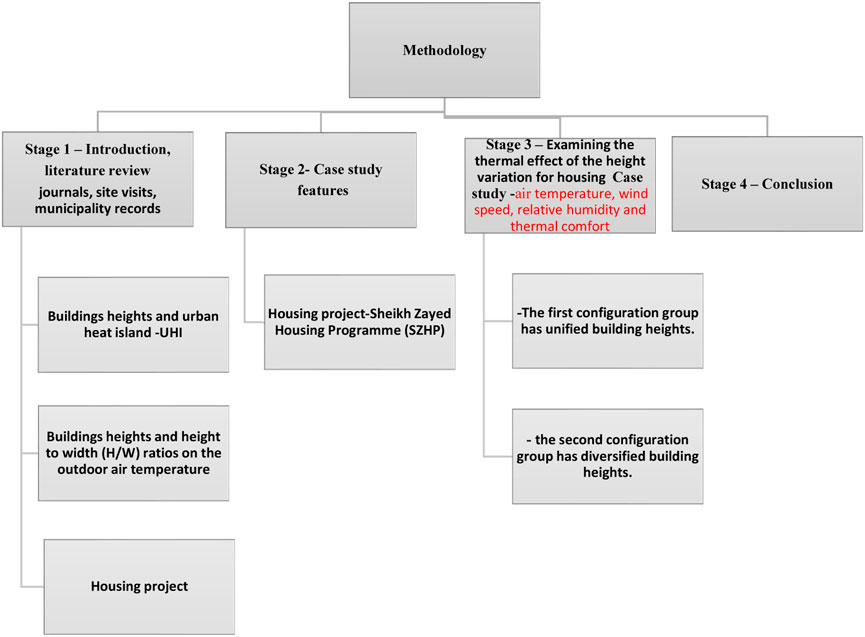
A qualitative examination method was used for this study based on a case study, ENVI-met software analysis, and descriptive analysis (Figure 2). This study’s primary goal was to investigate the thermal effects of height variation on the urban design and canyon thermal performance of a housing complex in the hot arid climate of the United Arab Emirates as this topic has received little attention in prior studies. The study will assess the current thermal characteristics of the Sheikh Zayed Housing Programme (SZHP, 2023) as a case study, focusing primarily on the height of the structures, and then look at alternative height-to-width ratio solutions that could enhance the urban thermal characteristics and the users’ thermal comfort. In this research, the thermal performance for the different configurations was measured by the related variations in the air temperature. The UTCI, which is used to assess the connections between the outside environment and people’s well-being, was utilized to compute the predicted mean vote (PMV) for the solutions. The basic elements that influence how the human body feels while exposed to the environment include temperature, humidity, wind, and radiation (Littlefair, 2000). Finally, other methods and resources supported this study, such as data collection from journals, site visits, and municipality records.
2.1 Study’s climate conditions
The study was conducted on a housing project (Figure 3A) in Ajman Emirate, UAE (Figure 3B). Average temperatures in Ajman can soar as high as 41°C throughout the summer (Figure 3C) due to the region’s hot and dry climate. Due to its proximity to the seaside, it is often more temperate than other emirates in the UAE. The winters are pleasant, with average lows of 22°C. Ajman receives little rain on a yearly average, with the majority falling between December and March. The dominant wind in Ajman is the north-west wind (Figure 3D). Overall, Ajman has a desert climate distinguished by hot summers, moderate winters, and little precipitation.
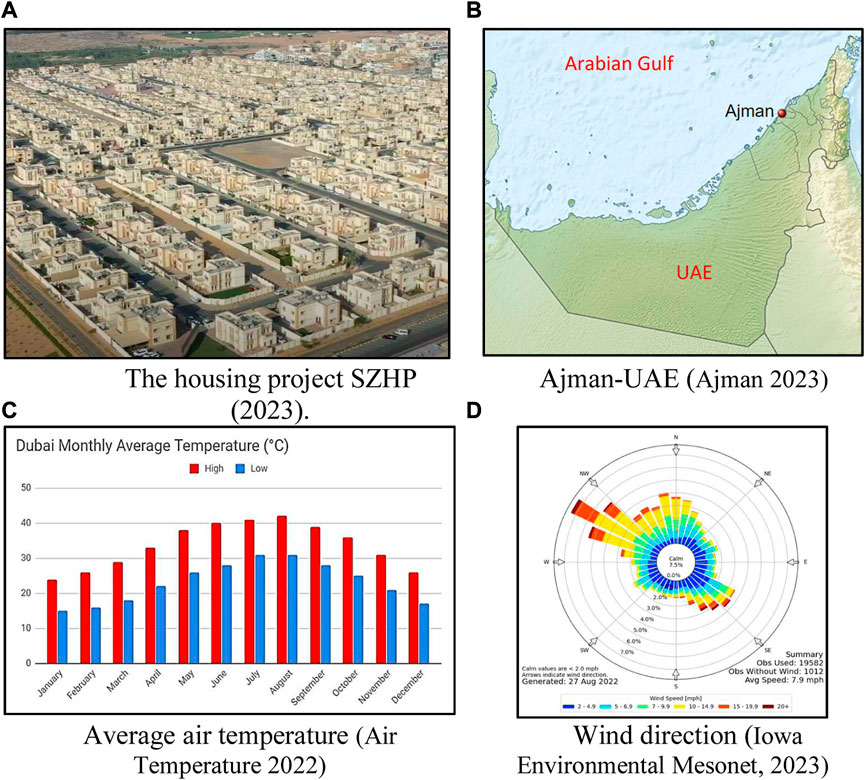
FIGURE 3. Location and climate conditions for the case study, (A) The housing project SZHP, (B) The location map of Ajman city, UAE, (C) Average air temperature- Dubai, (D) The wind direction and speed in UAE.
2.2 Study software for the thermal analysis
A microclimate software program called ENVI-met was used to simulate thermal effects for the housing project case study. ENVI-met software is designed for use in many applications, including building design, urban planning, and climate change adaptation, for forecasting, analyzing, and visualizing the microclimate of cities, buildings, and green areas (ENVI-met 2023). With more than 3,000 independent studies, ENVI-met has been verified by a large number of researchers and practitioners, including in the urban climate and the urban microclimates (Salameh and Touqan, 2022; Salameh and Touqan, 2023; Wang et al., 2023; Alyakoob et al., 2023; Ghaffarianhoseini et al., 2015; Lee et al., 2016; Taleghani et al., 2014; Air Temperature, 2022; Forouzandeh, 2018).
The author conducted validation for the simulation using ENVI-met software on the same case study recorded in Salameh et al. (2022) as they used average measured air temperature data (Figure 4A) collected with an Extech meter (Figure 4B) from four points A, B, C, and D and compared those temperatures with their corresponding average air temperature data from the simulation using ENVI-met on 21 August 2020 (Figure 4C). The measured and simulated air temperature data were well correlated, as seen in Figure 4D. Despite some differences in the data sets, primarily due to the accuracy of the field measurement meter, the R2 score was 0.85 (Salameh et al., 2022). For more validation for the ENVI-met simulation results, the root mean square error (RMSE), a commonly used index for evaluating the accuracy of a model or software (Bande et al., 2019), was implemented in this study based on actual and predicted values gathered by the authors in Salameh et al. (2022). RMSE measures the difference between predicted values and actual values and is calculated by taking the square root of the average of the squared differences between predicted and actual values. A lower RMSE value indicates better agreement between predicted and actual values. For this study, the RMSE = 0.62 C° (see Figure 4E) and is considered valid, as higher RMSE values up to the levels of 4.83 obtained by Song and Park (2015) and 3.35 obtained by López-Cabeza et al. (2018)were deemed valid.
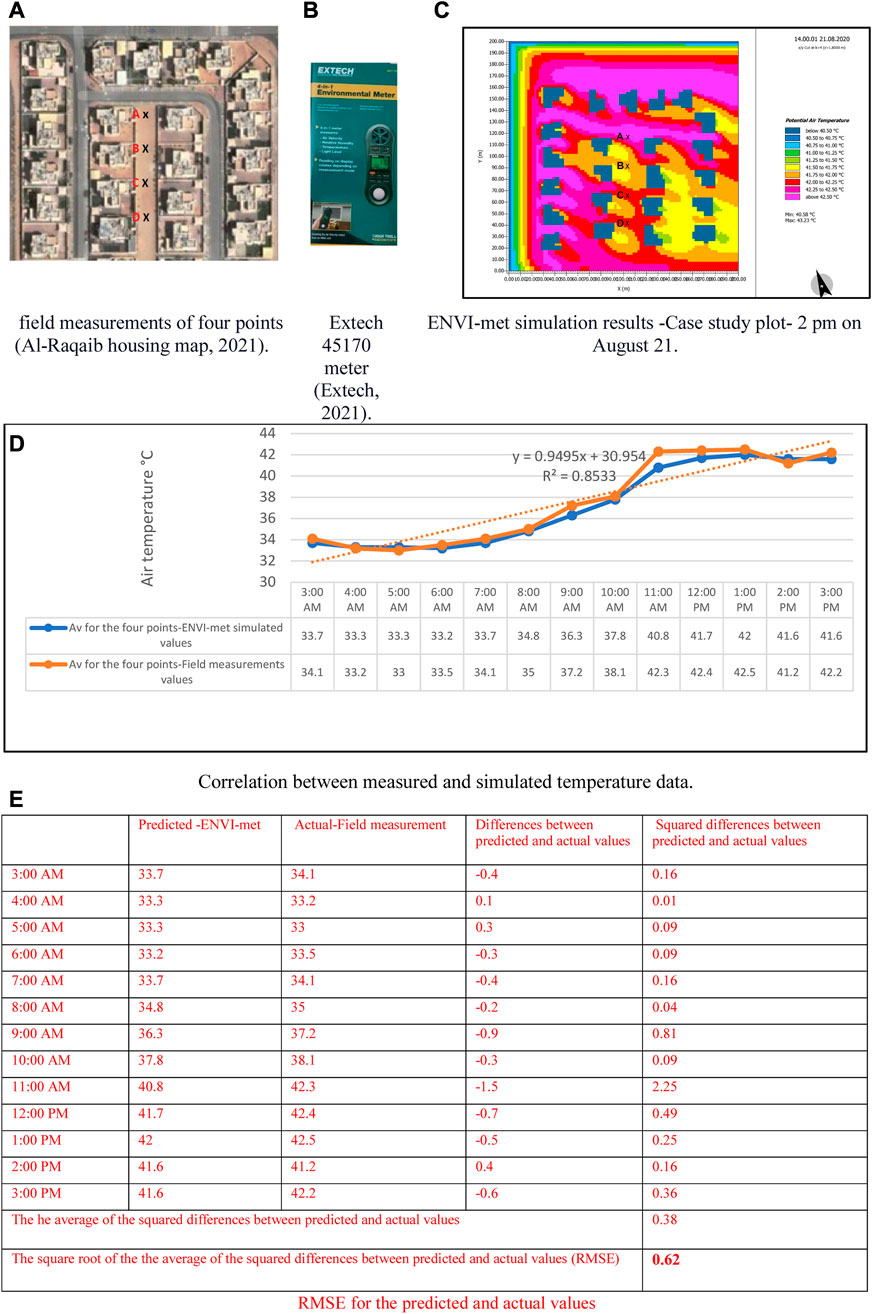
FIGURE 4. Validation information (Salameh, Mushtaha, and El Khazindar, 2022), (A) The four points of field measurements, (B) The Extech meter, (C) The ENVI-met simulation results at 2:00 pm, (D) Correlation between the measured the simulated air temperature, (E) RMSE for the actual and predicted values.
2.3 Case study simulation analysis criteria
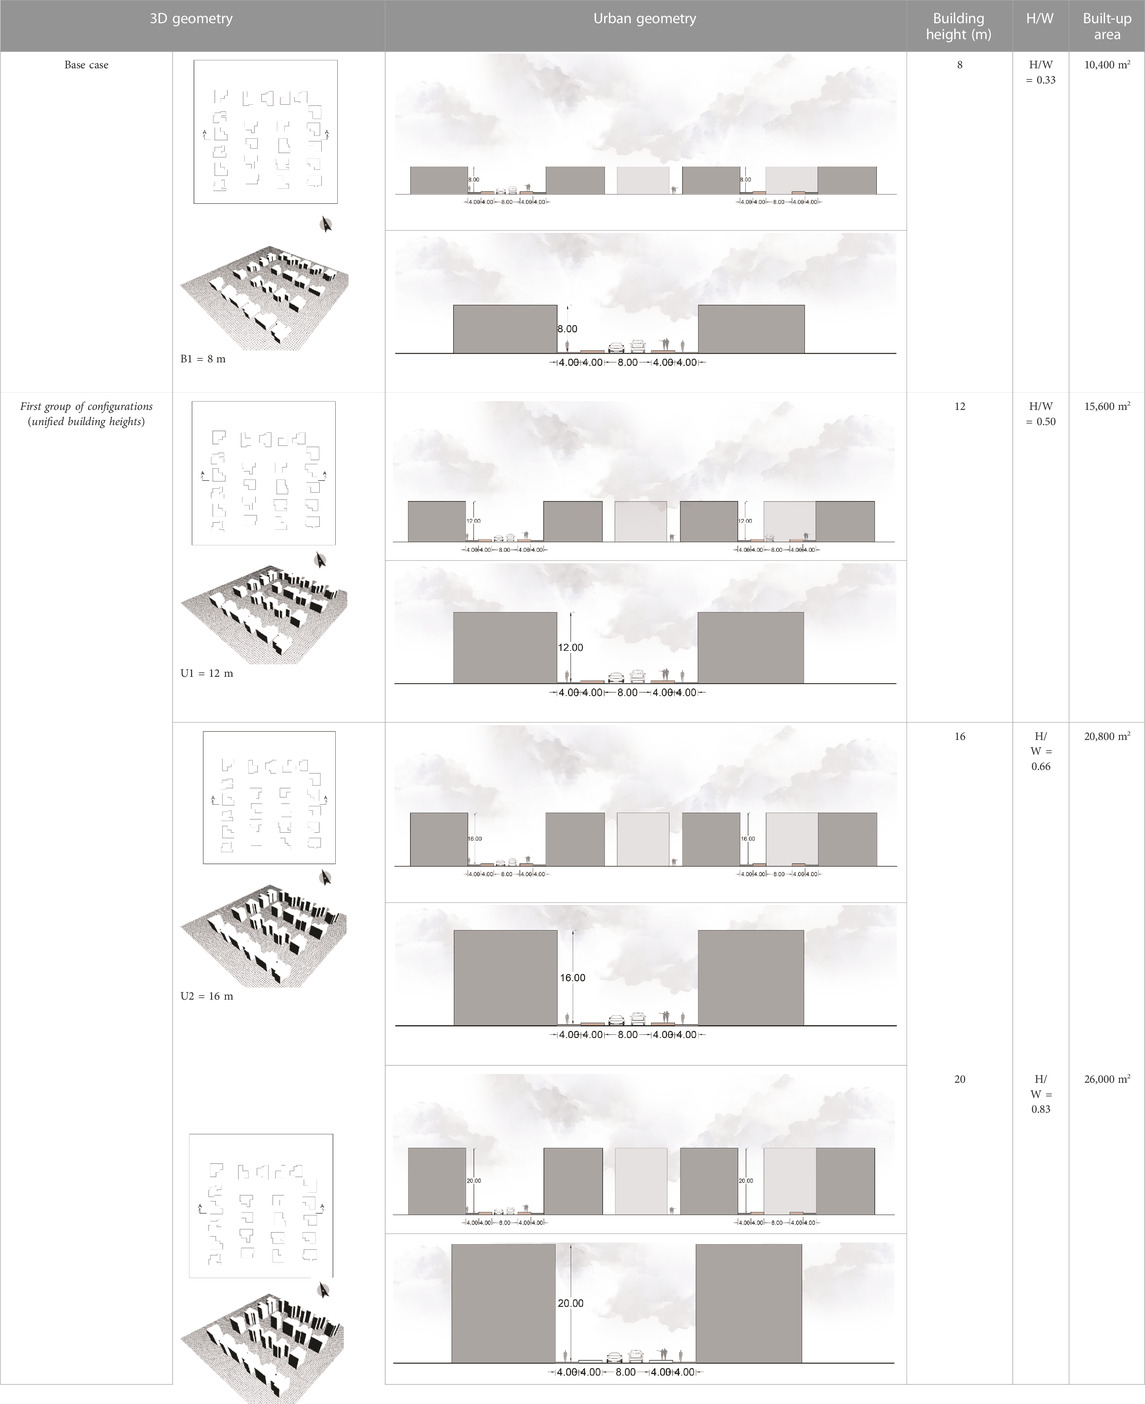
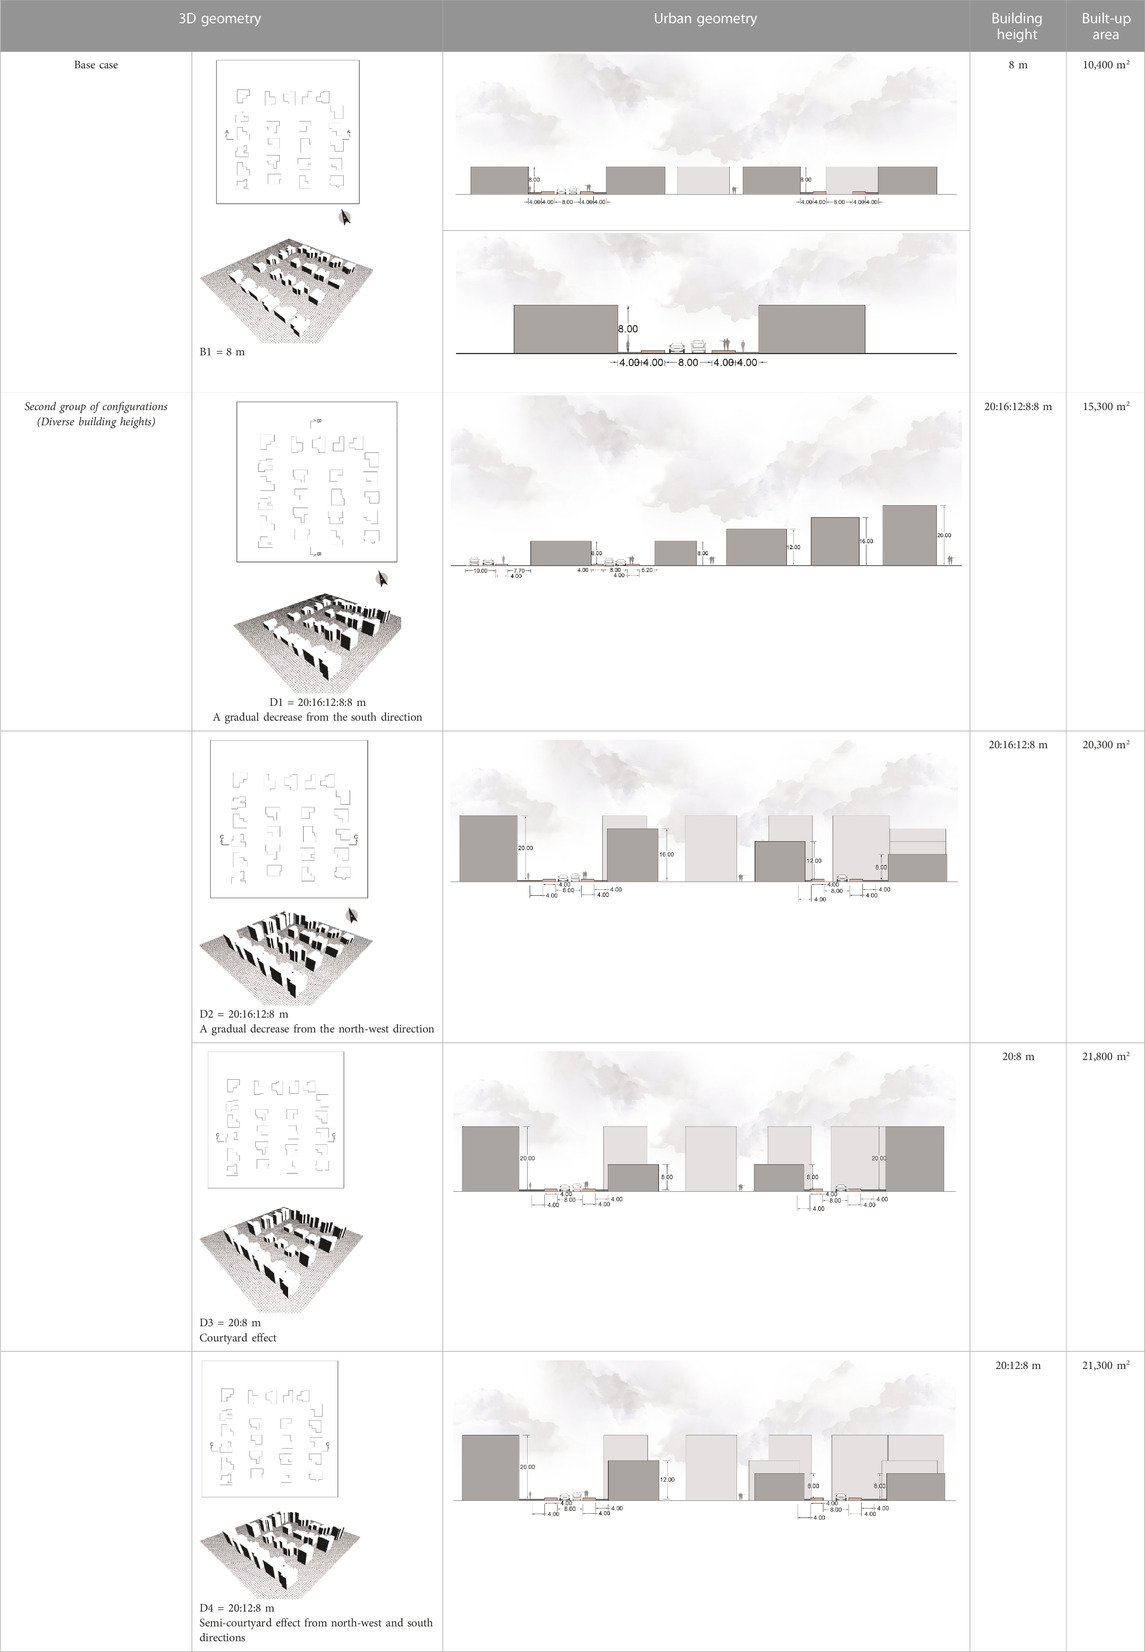
The research investigated the effect of the variation of the building heights in a housing project in the hot arid climate of the UAE on the outdoor thermal conditions in the related district. The investigation included two main parts: 1) The base case of the housing project plot (Table 1) and 2) the proposed scenarios for the height variations to be examined to identify the best configuration that can help in modifying the outdoor air (Table 2).
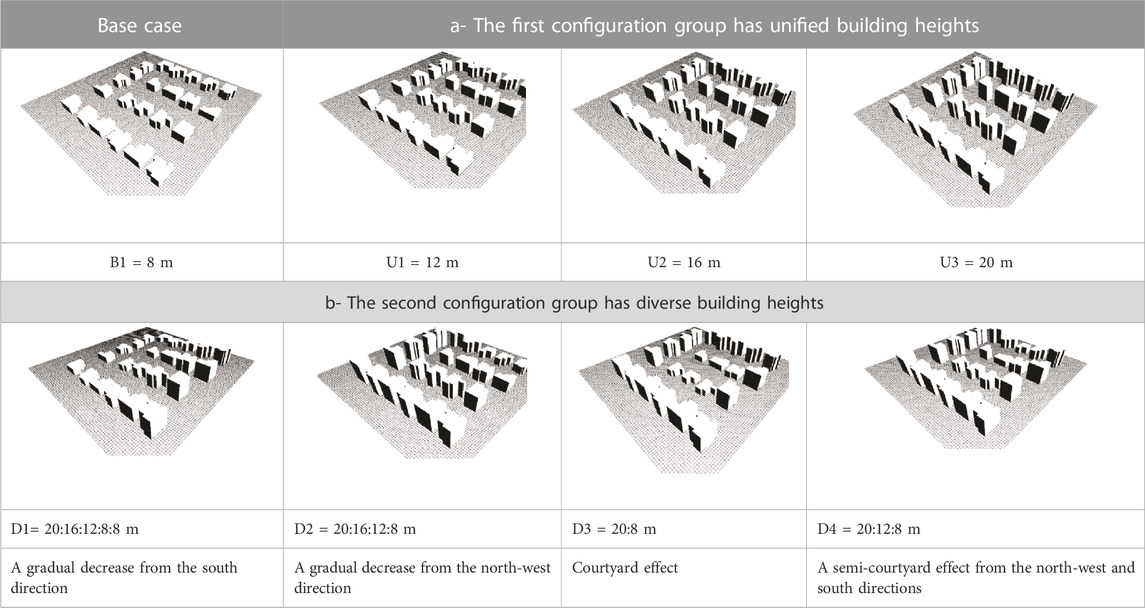
TABLE 2. Case study: Al Ragaib housing district characteristics (two proposed configuration groups).
In the ENVI-met software application, the simulation plot area for the existing and proposed height configurations was in a working space with an air volume of 200 × 200 × 50 m3 and a height of 50 m for the air column based on a grid of 2 m in the x, y, and z directions (Table 3). These properties for the working space were considered fixed parameters for all the simulations of the different building height configurations for this research. The simulations were run for 36 h starting from 20 August at 6:00 p.m. until 21 August at 11:59 p.m. The extracted simulation data were for 21 August 2021. The selected site was simulated based on reality in terms of orientation, building materials (Table 3), built-up area, street geometries, street orientations, and 3D geometries. The date selected for the investigation was 21 August, the hottest month of the year in the UAE with an average high air temperature of around 41°C and an average low temperature of 34°C. These readings are above the thermal comfort defined by Khalfan and Sharples (2016), who claimed that the thermal comfort diagram is between 20°C and 27°C in accordance with Schnieders’ thermal comfort diagram.
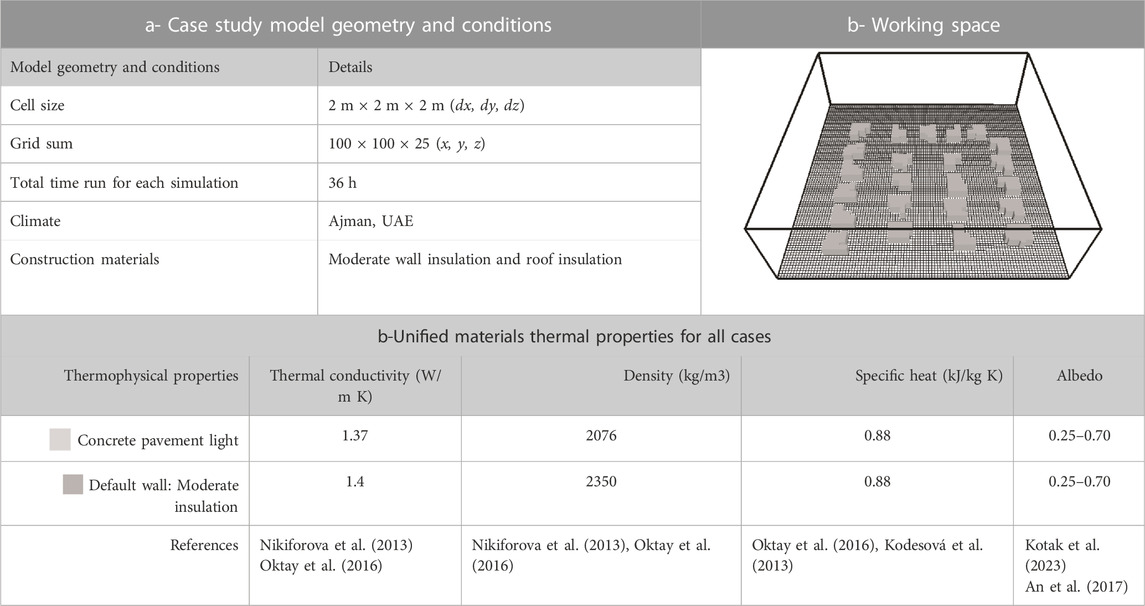
TABLE 3. Case study simulation model geometry and conditions (Salameh and Touqan, 2023).
When comparing and evaluating the thermal characteristics of the existing and proposed configurations for the housing project using ENVI-met, a variety of metrics and variables were used. These metrics included the following:
1- The air temperature is a direct indicator of thermal performance in urban settings (Feroz, 2015).
2- Sky view factor (SVF), as it directly affects the sun exposure and the shadow index, thus the outdoor air temperature.
3- Thermal comfort is projected by the predicted mean vote (PMV), which predicts its values for thermal comfort outside.
The energy balance of user bodies within the fabricated microclimates is considered in PMV calculations. Using the ASHRAE scale, ENVI-met calculates PMV, with +3 meaning extremely hot weather and −3 denoting severely cold weather (Iowa Environment Mesonet, 2023). Additionally, a broader scale for open-air temperatures was included, ranging from +4 (extreme heat) to −4 (extreme cold) (PMV-ENVI-met, 2021). PMV is frequently linked to other aspects of the human body, such as the user’s age, metabolism, and gender, as well as external factors, including wind speed, humidity, air temperature, and radiant temperature (PMV-ENVI-met, 2021). Consequently, it has been established that a wide range of direct and indirect elements can affect thermal comfort; nonetheless, Lai et al. (2020) asserted that air temperature has a substantial impact on customers’ thermal comfort.
The base case and the two proposed configurations have building heights that vary from 8, 12, and 16, to 20 m. The first configuration group has unified building heights. In the first configuration, U1 has a unified height of 12 m, the U2 configuration is 16 m, and U3 is 20 m, as shown in Table 4.
The second group of configurations has diverse building heights. The D1 configuration has a gradual height decrease from the south direction starting from 20 m and reaching the lowest height of 8 m, with the decrease following this pattern: 20, 16, 12, 8, and 8 m. The D2 configuration has a gradual height decrease from the north-west direction, starting at 20 m and reaching the lowest point of 8 m, following the pattern of 20, 16, 12, and 8 m. D3 has a courtyard effect, with 20-m buildings on the site boundary and 8-m buildings on the inside. Finally, D4 has a semi-courtyard effect, with 20-m building blocks facing the north-west and south directions, while the height gradually decreases inward to 12 m and 8 m, as shown in Table 5.
The H/W ratio increases with the increase of the building heights as does the built-up area. The urban configurations were simulated with fixed factors such as the UAE location, climatic data (arid and hot climate), building materials (default concrete wall with moderate insulation for walls and roofs, asphalt road, red stones for pedestrian paths and sidewalks, and loamy soil for unpaved areas). The independent factors were building height, H/W ratio, SVF, and built-up area-to-plot area ratio. The simulation results, including outdoor potential air temperature, wind speed, relative humidity, mean radiant temperature, building average temperature, and PMV, are the dependent factors to identify the impact of each proposed configuration.
3 Results and discussion
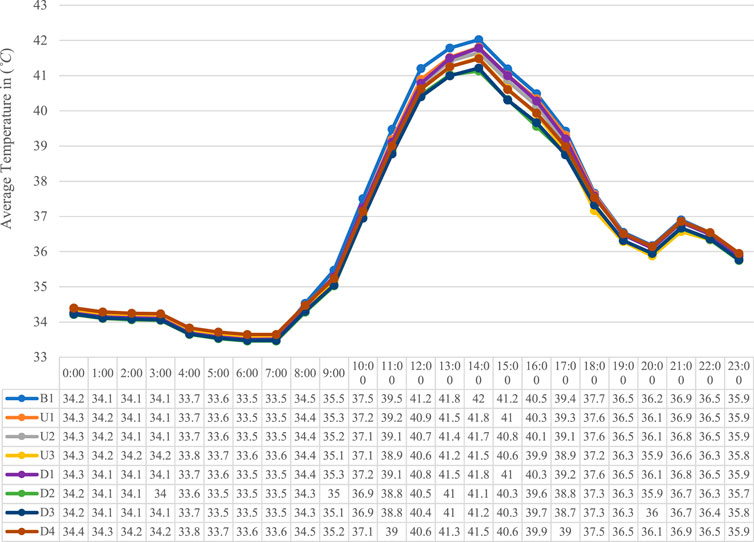
A 200 m × 200 m plot was modeled and simulated using ENVI-met software on 21 August for the base scenario and the suggested two groups of height configurations for the houses. The findings of the simulation showed that the thermal performance varied amongst the two height configurations, uniform and diverse, compared to the base case for the potential air temperature as in Figure 5, particularly at 2:00 p.m. during the peak hot hour (a time of high ambient air temperature and strong solar radiation). Looking at the first group of configurations with unified heights, U3 had the lowest average air temperature with a reading of 41.5°C, which is a reduction of about 0.5°C compared to the base case at 2:00 p.m., which recorded an average outdoor air temperature of 42.0°C. Note that U3 had a 0.83 H/W ratio for the streets, while the base case had only a 0.33 H/W ratio (Table 1); thus, the higher the H/W ratio, the better as a higher H/W ratio increases the shaded areas in the outdoor places and decreases the amount of the absorbed solar radiation.
In the second group with diverse heights, configuration D2, with the highest masses located to the north and west, had the lowest average air temperature with a reading of 41.1°C at 2:00 p.m., a reduction of about 0.9°C compared to the base case. D3 is the second-most thermally efficient configuration, with the lowest average air temperature of 41.2°C, a reduction of about 0.8°C compared to the base case.
Figure 6A shows the air temperature distribution on 21 August at 2:00 p.m. This figure confirmed that U3 from the unified height group had the best thermal performance based on the air temperature. U3, with uniform 20-m building heights for each mass, recorded the highest air temperature of 43°C for 7% of its cells. The base case recorded an air temperature of 43°C in 17% of its cells, and 2% of its cells recorded air temperature values of 43.5°C (Figure 6B). U3 performed the best of the unified group configurations because it has the highest masses (20 m), which created a small SVF that reduced the amount of solar radiation that reached the ground or masses of the urban district. In the base case, the masses reached only 8 m in height, which increased the SVF and allowed more solar radiation to hit the ground and the walls of the district (Figure 7). The SVF, which is measured from a certain place on the ground, is the proportion of the visible sky area to all viewable areas. In metropolitan locations, the amount of sky view can affect air temperature. Many studies have shown that lowering the SVF can lower daytime air temperatures, such as Svensson (2004), Unger (2004), Venhari et al. (2019), Ajman (2023), and Elkhazindar et al. (2022).
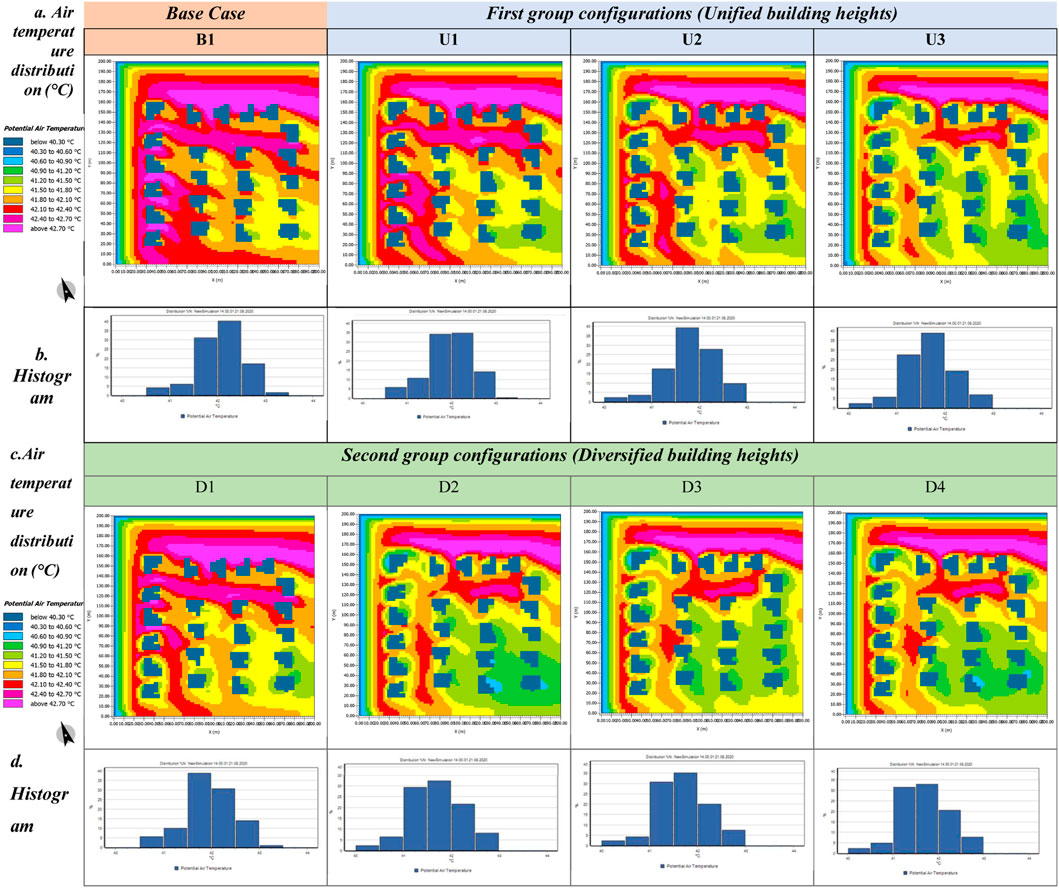
FIGURE 6. Air temperature distribution on 21 August at 2:00 p.m, (A) Air temperature distribution for base case and first group configurations, (B) Histogram for base case and first group configurations, (C) Air temperature distribution for second group configurations, (D) Histogram for second group configurations.
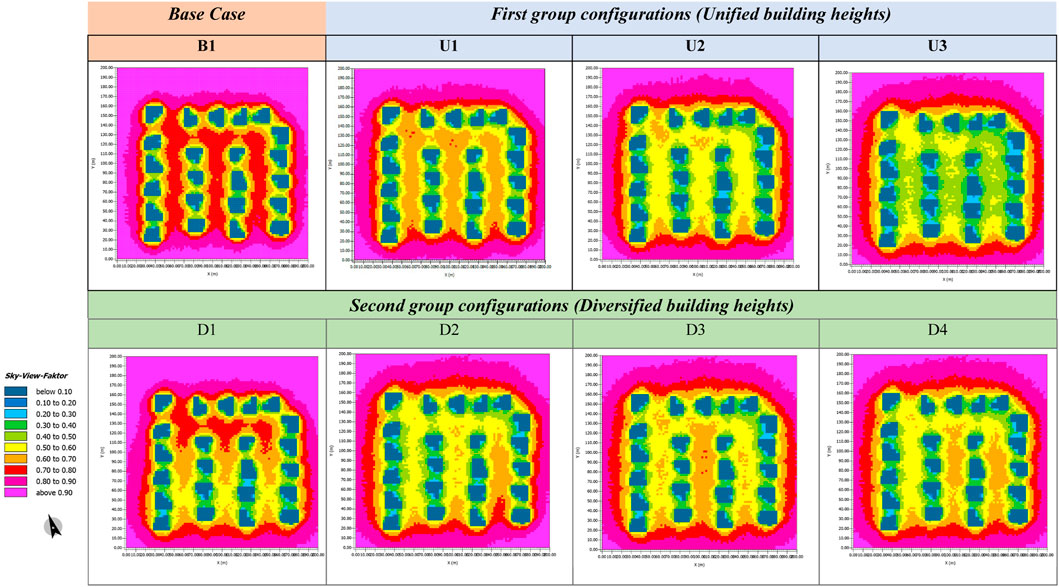
FIGURE 7. Sky view factor for the base case and the two group configurations (images generated by ENVI-met).
On the other hand, D2, with high masses located from north and west, had the lowest average air temperature of the two groups of configurations, as shown in Figure 6C. D2 configurations blocked the hot air that blew from the north-west, which helped reduce the air temperature in the district. D2 recorded the highest temperature of 43°C in 8% of its cells, while the base case had almost 17% of its cells at 43°C. In addition, the base case recorded higher air temperature values that reached 43.5°C in 2% of its cells, while D2 recorded lower air temperature values of 41.0°C in 2% of the area’s cells. The lowest air temperature value for the base case was 41.5°C (Figure 6D). The good performance for D3 was mostly related to preventing the hot air from moving easily inside the housing plot. By restricting heat transfer from the hot air to the colder air around it, blocking hot air can enhance an area’s thermal performance. Allowing hot air to move freely can cause heat to be transferred to nearby surfaces, which can subsequently radiate heat into the air, raising the ambient temperature.
The transfer of heat can be reduced, allowing the cooler air in the surrounding environment to maintain its temperature by blocking hot air. Minimizing the need for heating or cooling systems to counteract the impacts of hot air can boost a building or room’s energy efficiency. According to Feroz (2015), the cooling impact of the wind circulation is insufficient in hot climates like Dubai.
D3 was ranked the second configuration in energy efficiency in the group of configurations with diverse heights. According to Figure 6D, D3 recorded the highest temperature of 43°C in 7.5% of its cells, compared to about 17% of the cells in the base scenario recording this temperature. Moreover, D3 recorded maximum air temperature values of 43.0°C, while the base case recorded higher maximum air temperature values of 43.5°C. The main factor in D3's successful performance was that this configuration mimicked the courtyard effect because it has high masses on the four borders that gradually lowered in height toward the center. This courtyard effect had high masses on the north-west side that blocked the hot air from moving freely inside the housing plot. Blocking the hot air improved the area’s thermal performance by limiting the amount of heat transferred from the hot air to the cooler air surrounding it. The high masses on the south in D3 cast more shade inside the plot, which decreased the air temperature in the area. D3, in general, created a courtyard effect that improved the stack effect inside the plot and improved its thermal performance. As Al Raqaib (2021) mentioned, the courtyard forms have several attributes that enable them to work in a passive way to maximize the utilization of natural elements like sunshine and wind.
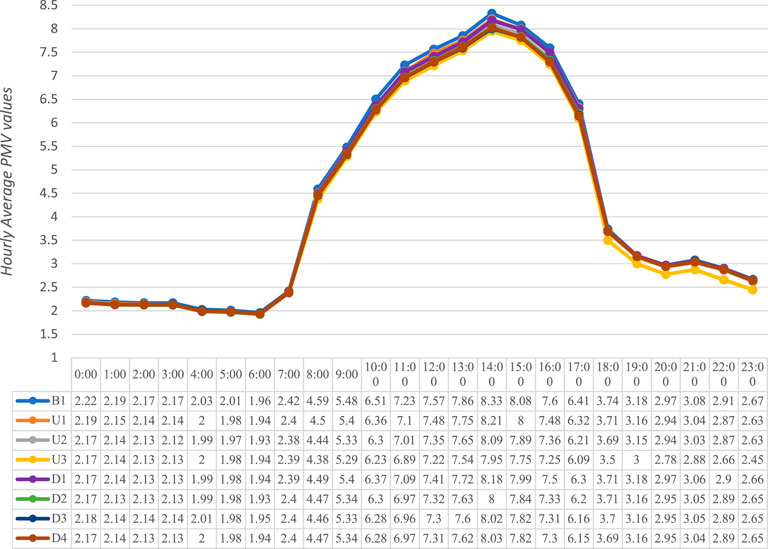
According to Detommaso et al. (2021), the ENVI-met Leonardo display heights increase by 0.4 m levels starting from 0.2 m, so the 1.8 m height was chosen to measure the PMV values as it was the closest to 1.75 m. This study used the standard PMV model developed based on Extech (2021) for a person aged 35, 1.75 m tall, weighing 75 kg, and walking at a speed of 4 kp. The PMV readings were identified according to that model’s standards. In the PMV distribution shown in Figure 8, U3, a configuration with unified height, gave the best PMV among all the cases, with average values that ranged between 2.0 and 7.95, with the highest reading of 7.95 PMV at 2:00 p.m. For the base case, the average PMV values ranged between 2.03 and 8.33, with the highest PMV reading of 8.33 at 2:00 p.m. Figure 8 demonstrates that even though the distribution of the PMV for each case was higher than the desired range of −4 to +4 in the day time, the PMV for the U3 configuration succeeded in decreasing the average maximum PMV readings by 0.38 at 2:00 p.m. at the peak air temperature time compared to the base case. Therefore, it improved the thermal comfort in the district, which is clearly illustrated in Figure 9. This can be explained because U3 had the lowest values for the SVF; thus, it improved the thermal conditions in the outdoor areas compared to the other cases, which is in agreement with Venhari et al. (2019)and Elkhazindar et al. (2022), who mentioned that lower readings of SVF can improve users’ thermal comfort.
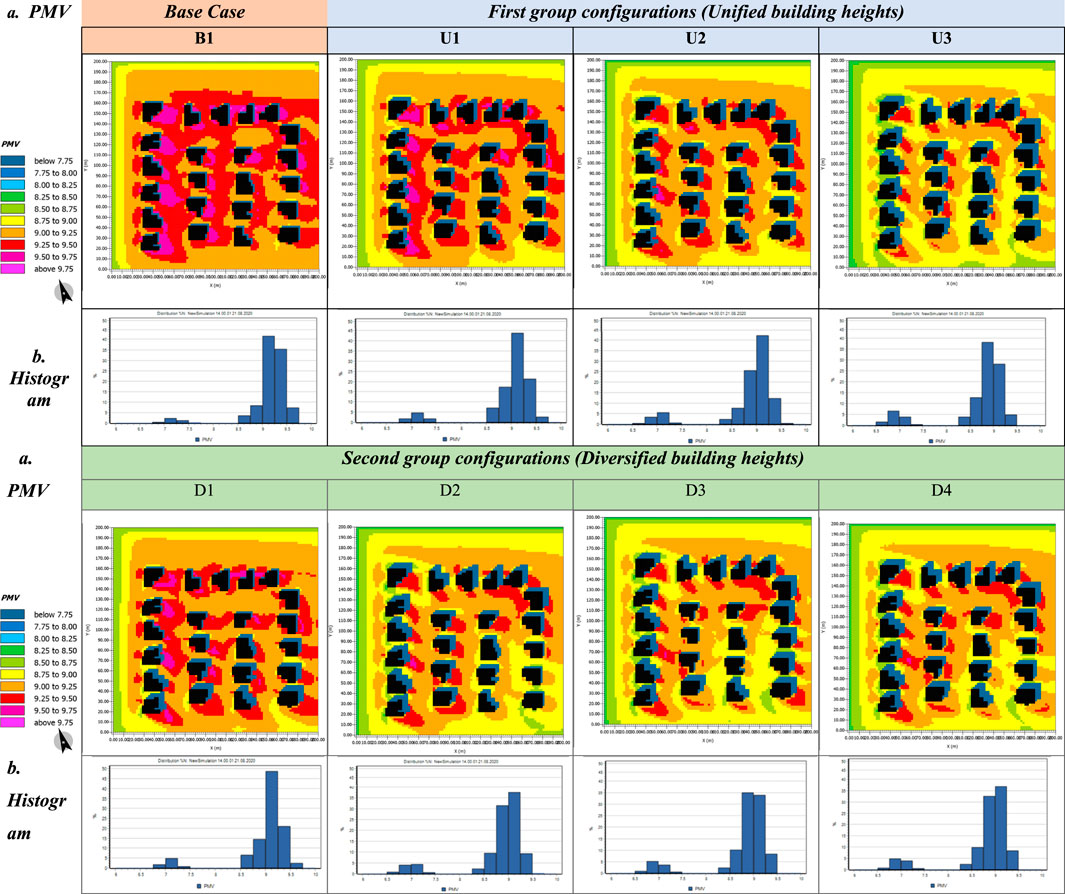
FIGURE 9. PMV results on 21 August at 2:00 p.m, (A) PMV results for base case and first group configurations, (B) Histogram for base case and first group configurations, (C) PMV results for second group configurations, (D) Histogram for second group configurations.
D2, with high masses located on the north and west, had the lowest average air temperature compared to the two groups of configurations. The D2 had PMV average readings ranging from 1.99 to 8.00, which were lower than the readings for the base case average PMV values that ranged between 2.03 and 8.33 (Figures 8, 9). D3, with a courtyard effect, had the second-lowest average air temperature in the diverse-height group; PMV average values ranged between 2.01 and 8.02 and were also lower than the base case average PMV values.
The maximum mean radiant temperature (MRT) component of the universal thermal climate index (UTCI), in particular, had an effect on the PMV values for all occurrences. These components include mean radiant temperature, wind speed, and relative humidity. The MRT in the U3 configuration with the best PMV readings recorded MRT readings of around 65°C at 2:00 p.m., which is 2.4°C less than the base case. D2, which was second in thermal performance efficiency, recorded MRT readings of around 65.1°C, which is 2.3°C less than the base case (Figure 10).
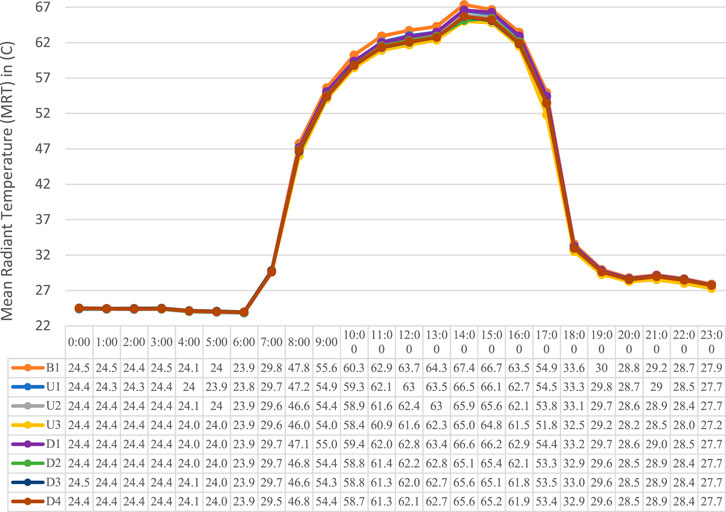
FIGURE 10. Hourly average mean radiant temperature (°C) for the base case and the two configuration groups.
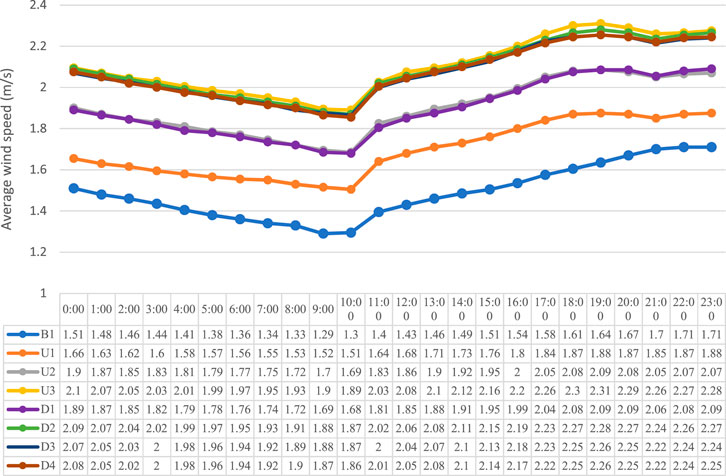
The wind speeds for all cases are shown in Figure 11. The lowest average readings for the wind speed were for the base case, which recorded 1.49 m/s at 2:00 p.m., while the best case U3 followed by D2 recorded the highest values for the wind speed of 2.12 m/s and 2.11 m/s, respectively. These wind speeds are higher than the base case.
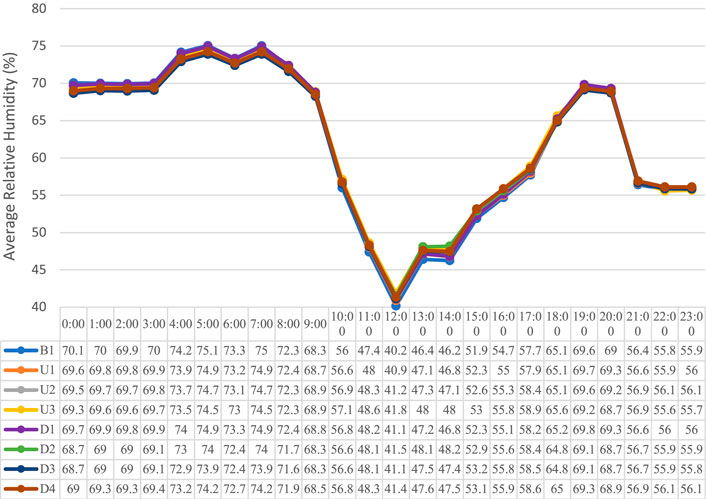
Figure 12 showed that the U3 configuration with the best PMV readings produced a relative humidity value of 48% at 2:00 p.m., which was greater than the basic case (46.2%), and the relative humidity for D2 was 48.2%.
It is evident that the MRT, relative humidity, and wind speed affected the PMV performance, as the best cases among the two groups of configurations, U3 and D2, had the highest readings of relative humidity and wind speed with the lowest readings for the MRT among all cases, including the base case.
4 Conclusion
This study’s primary goal was to investigate the thermal effects of height variation in house structures on urban design and canyons in the hot, arid environment of the United Arab Emirates as this topic has received little attention in prior studies. The study assessed the current thermal characteristics of the Shaikh Zayed Housing Programme (SZHP), focusing primarily on the height of the structures, and then looked at alternative height variation solutions that can enhance the thermal characteristics and the users’ thermal comfort.
The study revealed that building height plays a crucial role in the formation of the outdoor air temperature, thus the UHI phenomenon. After studying two configurations with unified and diverse building heights, the study found that the best case among the first group of configurations with unified heights was U3, which had unified mass heights of 20 m. U3 had the lowest average air temperature with a reading of 41.5°C (a reduction of about 0.5°C compared to the base case at 2:00 p.m., which recorded an average outdoor air temperature of 42.0°C). The higher masses created a higher H/W ratio and better thermal performance, as in the case of U3, which had a 0.83 H/W ratio with the lowest SVF for the streets, while the base case had only a 0.33 H/W ratio with the highest SVF. Moreover, the results revealed that in the case of diverse heights, it is better to locate the highest masses in the hot wind direction as in the D2 group, the highest masses with 20 m height were located only on the north and west sides of the area blocking the hot north-west prevailing wind. D2 had the lowest average air temperature reading of 41.1°C at 2:00 p.m., a reduction of about 0.9°C compared to the base case. In addition, it was revealed that the courtyard effect in the urban layout, as found in the D3 case, can help improve the thermal conditions for the area in general.
In the cases with lower air temperatures, U3 and D2 recorded the best PMV readings, especially in the daytime when the air temperature was high. It was clear that the MRT, relative humidity, and wind speed all had an impact on the PMV performance because the best cases, U3 and D2, had the highest relative humidity and wind speed readings and the lowest MRT readings among the other cases, including the base case.
Finally, it is recommended to decrease the SVF when possible in the housing districts to create more shade, and it is better to have higher H/W ratios for the streets. In cases where the housing project can have diverse heights, it is better to locate the highest masses in the direction of the hot prevailing wind. This will help improve thermal performance in the housing area, decrease the air temperature, and improve the PMV, which surely will help in reducing the effect of the UHI.
5 Study limitations
The study was only conducted at one location in the hot desert climate of the UAE. Future studies should consider additional housing projects to assess the advantages of height variation on the thermal performance of housing areas. In addition, because this study only looked at one summer day, it is advisable to investigate other days of the year to provide more comprehensive data.
Data availability statement
The original contributions presented in the study are included in the article/supplementary material; further inquiries can be directed to the corresponding author.
Author contributions
MS, AE, and BT: arrangement of the study idea, proposal, and writing. AE: software simulation. MS: imagery analysis, interpretation, and publication submission. BT: research supervision.
Acknowledgments
The authors would like to acknowledge the support received from Ajman University and the Healthy and Sustainable Built Environment Research Center.
Conflict of interest
The authors declare that the research was conducted in the absence of any commercial or financial relationships that could be construed as a potential conflict of interest.
Publisher’s note
All claims expressed in this article are solely those of the authors and do not necessarily represent those of their affiliated organizations, or those of the publisher, the editors, and the reviewers. Any product that may be evaluated in this article, or claim that may be made by its manufacturer, is not guaranteed or endorsed by the publisher.
References
Aflaki, A., Mahyuddin, N., Manteghi, G., and Baharum, M., 2014. Building height effects on indoor air temperature and velocity in high rise residential buildings in tropical climate. OIDA Int. J. Sustain. Dev., 7, 39–48.
Air Temperature (2022). The average monthly air temperature throughout the year in the UAE—google search. Available at: https://www.google.com/search?q=a-+The+average+monthly+air+temperature+throughout+the+year+in+the+UAE&rlz=1C1GCEU_enAE929AE929&source=lnms&tbm=isch&sa=X&ved=2ahUKEwiJ3-Pr-Mj1AhW1AmMBHS8VBT0Q_AUoAXoECAEQAw&biw=1536&bih=849&dpr=2.5#imgrc=IRO06uCF4YaV-M (accessed January 23, 2022).
Ajman (2023). Ajman, wikipedia. Wikimedia foundation. Available at: https://en.wikipedia.org/wiki/Ajman (Accessed February 11, 2023).
Al Raqaib housing (2021). Al Raqaib housing. Available at: https://www.google.com/maps/place/Secondary+Technical+School+-+Ajman+Campus/@25.3946733.
Al Raqaib housing map, 2021b. [online], Al Raqaib housing map. Available at: https://www.google.com/maps/place/Secondary+Technical+School+-+Ajman+Campus/@25.3946733.
Al Raqaib housing mapAl Raqaib housing map (2021a). Available at: https://www.google.com/maps/place/Secondary+Technical+School+-+Ajman+Campus/@25.39.
Alyakoob, A., Hartono, S., Johnson, T., and Middel, A. (2023). Estimating cooling loads of Arizona State University buildings using microclimate data and machine learning. J. Build. Eng. 64, 105705. doi:10.1016/j.jobe.2022.105705
An, N., Hemmati, S., and Cui, Y. (2017). Numerical analysis of soil volumetric water content and temperature variations in an embankment due to soil-atmosphere interaction. Comput. Geotechnics 83, 40–51.
Bande, L., Afshari, A., Al Masri, D., Jha, M., Norford, L., Tsoupos, A., et al. (2019). Validation of UWG and ENVI-met models in an Abu Dhabi District, based on site measurements. Sustainability 11, 4378. doi:10.3390/su11164378
Boudoukha, A., and Zemmouri, N. (2021). The effect of building heights on outdoor wind environment of the residential SECTOR/CAS of el eulma city, Algeria. J. Fundam. Appl. Sci. 13, 1014–1029.
Bueno, B., Roth, M., Norford, L., and Li, R. (2014). Computationally efficient prediction of canopy level urban air temperature at the neighbourhood scale. Urban Clim. 9, 35–53. doi:10.1016/j.uclim.2014.05.005
Burton, E., Jenks, M., and Williams, K. (2013). Achieving sustainable urban form. London: Routledge.
Detommaso, M., Gagliano, A., Marletta, L., and Nocera, F. (2021). Sustainable urban greening and cooling strategies for thermal comfort at pedestrian level. Sustainability 13, 3138.
Dou, Y. (2014). The influence of urban planning on urban thermal comfort Doctoral dissertation. Wageningen, Netherlands: Wageningen University.
Elkhazindar, A., Kharrufa, S. N., and Arar, M. S. (2022). “The effect of urban form on the heat island phenomenon and human thermal comfort: A comparative study of UAE residential sites,”. Energies 15 (15), 5471. doi:10.3390/en15155471
Elmarakby, E., Khalifa, M., Elshater, A., and Afifi, S. (2022). Tailored methods for mapping urban heat islands in Greater Cairo Region. Ain Shams Eng. J. 13, 101545. doi:10.1016/j.asej.2021.06.030
ENVI-met (2023). Software, ENVI. Available at: https://www.envi-met.com/software/(Accessed February 10, 2023).
Extech, A., 2021. 4-in-1 environmental meter | Extech instruments. [online]. Available at: http://www.extech.com/products/45170 [Accessed 3 September 2021].
Feroz, S. M. (2015). Achieving thermal comfort by applying passive cooling strategies to courtyard houses in Dubai (UAE). United Arab Emiraates: The British University in Dubai (Masters dissertation.
Forouzandeh, A. (2018). Numerical modeling validation for the microclimate thermal condition of semi-closed courtyard spaces between buildings. Sustain. Cities Soc. 36, 327–345.
Gamero-Salinas, J., Kishnani, N., Monge-Barrio, A., López-Fidalgo, J., and Sánchez-Ostiz, A. (2021b). Evaluation of thermal comfort and building form attributes in different semi-outdoor environments in a high-density tropical setting. Build. Environ. 205, 108255.
Gamero-Salinas, J., Kishnani, N., Monge-Barrio, A., López-Fidalgo, J., and Sánchez-Ostiz, A. (2021a). The influence of building form variables on the environmental performance of semi-outdoor spaces. A study in mid-rise and high-rise buildings of Singapore. Energy Build. 230, 110544.
Ghaffarianhoseini, A., Berardi, U., and Ghaffarianhoseini, A. (2015). Thermal performance characteristics of unshaded courtyards in hot and humid climates. Build. Environ. 87, 154–168.
Iowa Environmental Mesonet (2023). Iem:: Site wind roses, Iowa environmental Mesonet. Available at. https://mesonet.agron.iastate.edu/sites/windrose.phtml?station=QGX&network=AE__ASOS (Accessed January 30, 2023).
iskanZayed, 2021. [online] IskanZayed, Available at: https://twitter.com/iskanZayed/status/633569902876471296/photo/1 [Accessed 3 September].
Khalfan, M., and Sharples, S. (2016). Analysis for the first passivhaus project in Qatar, Proceedings of the SBE16. Dubai, 17–19.
Kodesová, R., Vlasáková, M., Fér, M., Teplá, D., Jakšík, O., Neuberger, P., et al. (2013). Thermal properties of representative soils of the Czech Republic. Soil Water Res. 8, 141–150. doi:10.17221/33/2013-swr
Kotak, Y. M. S., Gul, T. M., and Ivanova, S. M. (2015). Investigating the impact of ground albedo on the performance of PV systems (1), in london: CIBSE technical symposium. Available at: https://www.researchgate.net/publication/275956502_Investigating_the_Impact_of_Ground_Albedo_on_the_Performance_of_PV_Systems/citations (accessed January 30, 2023).
Lai, D., Lian, Z., Liu, W., Guo, C., Liu, W., Liu, K., et al. (2020). A comprehensive review of thermal comfort studies in urban open spaces. Sci. Total Environ. 742, 140092. doi:10.1016/j.scitotenv.2020.140092
Lan, Y., and Zhan, Q. (2017). How do urban buildings impact summer air temperature? The effects of building configurations in space and time. Build. Environ. 125, 88–98. doi:10.1016/j.buildenv.2017.08.046
Lee, H., Mayer, H., and Chen, L. (2016). Contribution of trees and grasslands to the mitigation of human heat stress in a residential district of Freiburg, Southwest Germany. Landsc. Urban Plan. 148, 37–50.
Li, J., and Donn, M. (2017). The influence of building height variability on natural ventilation and neighbor buildings in dense urban areas. Proc. Build. Simul. 2017, 2805–2813.
Littlefair, P. J. (2000). Environmental site layout planning: Solar access, microclimate and passive cooling in urban areas. Available at: https://www.bsria.com/uk/product/6Bv33r/bre_environmental_site_layout_planning_solar_access_microclimate_and_passive_cooling_in_urban_areas_a15d25e1/.
López-Cabeza, V. P., Galán-Marín, C. R. G. C. R. F. J., Rivera-Gómez, C., and Roa-Fernández, J. (2018). Courtyard microclimate ENVI-met outputs deviation from the experimental data. Build. Environ. 144, 129–141. doi:10.1016/j.buildenv.2018.08.013
Moreno, C., Allam, Z., Chabaud, D., Gall, C., and Pratlong, F. (2021). Introducing the “15-minute city”: Sustainability, resilience and place identity in future post-pandemic cities. Smart Cities 4 (1), 93–111.
Nie, T., Lai, D., Liu, K., Lian, Z., Yuan, Y., and Sun, L. (2022). Discussion on inapplicability of Universal Thermal Climate Index (UTCI) for outdoor thermal comfort in cold region. Urban Clim. 46, 101304.
Nikiforova, T., Savytskyi, M., Limam, K., Bosschaerts, W., and Belarbi, R. (2013). Methods and results of experimental researches of thermal conductivity of soils. Energy Procedia 42, 775–783. doi:10.1016/j.egypro.2013.12.034
Oktay, H., Argunhan, Z., Yumrutas, R., Işık, M. Z., and Budak, N. (2016). Çok katmanli duvar ve çati ti?pleri?ni?n isil ve fi?zi?ksel özelli?kleri?ni?n di?nami?k isil karakterleri?ne olan etki?si?ni?n i?ncelenmesi? Mugla J. Sci. Technol. 2, 48–54. doi:10.22531/muglajsci.269972
Pmv-Envi-Met, A. Holistic microclimate model. 2021. Available at: https://envi-met.info/doku.php?id=apps:biomet_pmv (accessed 2 September 2021).
Priyadarsini, R., and Wong, N. H. (2005). Parametric studies on urban geometry, air flow and temperature. Int. J. Archit. Sci., 114–132.6(3)
Salameh, M., Mushtaha, E., and El Khazindar, A. (2022). Improvement of thermal performance and predicted mean vote in city districts: A case in the united Arab Emirates. Ain Shams Eng. J. 14, 101999. doi:10.1016/j.asej.2022.101999
Salameh, M., and Touqan, B. (2023). From heritage to sustainability: The future of the past in the hot arid climate of the UAE. Buildings 13, 418. doi:10.3390/buildings13020418
Salameh, M., and Touqan, B. (2022). Traditional passive design solutions as a key factor for sustainable modern urban designs in the hot, arid climate of the united Arab Emirates. Buildings 12, 1811. doi:10.3390/buildings12111811
Salvati, A., Roura, H. C., and Cecere, C. (2017). Assessing the urban heat island and its energy impact on residential buildings in Mediterranean climate: Barcelona case study. Energy Build. 146, 38–54. doi:10.1016/j.enbuild.2017.04.025
Sangiorgio, V., Fiorito, F., and Santamouris, M. (2020). Development of a holistic urban heat island evaluation methodology. Sci. Rep. 10, 1–13.
Sangiorgio, F., and Santamouris, A., 2020. Explained how metrics like the ratio of a building's height to a street's width (H/W), which is the eighth component out of eleven that affects UHI, are dependent on the local environment of the measurement site.
Santamouris, M., Ding, L., and Osmond, P. (2019). Urban heat island mitigation. Decarbonising Built Environ. Charting Transition, 337–355.
Shareef, S., and Abu-Hijleh, B. (2020). The effect of building height diversity on outdoor microclimate conditions in hot climate. A case study Dubai-UAE 32, 100611.
Shishegar, N. (2013). Street design and urban microclimate: Analyzing the effects of street geometryand orientation on airflow and solar access in urban canyons. J. clean energy Technol. 1.
Song, B., and Park, K. (2015). Contribution of greening and high-albedo coatings to improvements in the thermal environment in complex urban areas. Adv. Meteorology 2015, 1–14. doi:10.1155/2015/792172
Svensson, M. K. (2004). Sky view factor analysis–implications for urban air temperature differences. Meteorol. Appl. 11, 201–211.
SZHP (2023). The ministry of energy and infrastructure organizes A volunteer initiative in Al raqayeb neighborhood in the emirate of ajman. Available at: https://www.szhp.gov.ae/VideogalleryDetails.aspx?ID=6531 (Accessed February 10, 2023).
Taleghani, M., Tenpierik, M., and van den Dobbelsteen, A. (2014). Energy performance and thermal comfort of courtyard/atrium dwellings in The Netherlands in the light of climate change. Renew. Energy 63, 486–497.
Unger, J., 2004. Intra-urban relationship between surface geometry and urban heat island: Review and new approach.Clim. Res., 27, 253–264.
Venhari, A. A., Tenpierik, M., and Taleghani, M. (2019). The role of sky view factor and urban street greenery in human thermal comfort and heat stress in a desert climate. J. Arid Environ. 166, 68–76. doi:10.1016/j.jaridenv.2019.04.009
Wang, H., Cai, Y., Deng, W., Li, C., Dong, Y., Zhou, L., et al. (2023). The effects of tree canopy structure and tree coverage ratios on urban air temperature based on ENVI-met. Forests 14, 80. doi:10.3390/f14010080
Yang, X., and Li, Y. (2015). The impact of building density and building height heterogeneity on average urban albedo and street surface temperature. Build. Environ. 90, 146–156. doi:10.1016/j.buildenv.2015.03.037
Zhang, J., Cui, P., and Song, H. (2020). Impact of urban morphology on outdoor air temperature and microclimate optimization strategy base on Pareto optimality in Northeast China. Build. Environ. 180, 107035. doi:10.1016/j.buildenv.2020.107035
Keywords: building heights, sustainable housing projects, PMV, hot areas, width-to-height ratio, sky view factor
Citation: Salameh M, Elkhazindar A and Touqan B (2023) The effect of building height on thermal properties and comfort of a housing project in the hot arid climate of the UAE. Front. Built Environ. 9:1174147. doi: 10.3389/fbuil.2023.1174147
Received: 25 February 2023; Accepted: 10 April 2023;
Published: 03 May 2023.
Edited by:
Khaled Galal Ahmed, United Arab Emirates University, United Arab EmiratesReviewed by:
Junsong Wang, South China University of Technology, ChinaChiara Burattini, Unitelma Sapienza University, Italy
Copyright © 2023 Salameh, Elkhazindar and Touqan. This is an open-access article distributed under the terms of the Creative Commons Attribution License (CC BY). The use, distribution or reproduction in other forums is permitted, provided the original author(s) and the copyright owner(s) are credited and that the original publication in this journal is cited, in accordance with accepted academic practice. No use, distribution or reproduction is permitted which does not comply with these terms.
*Correspondence: Muna Salameh, bS5zYWxhbWVoQGFqbWFuLmFjLmFl
 Muna Salameh
 Ayat Elkhazindar
 Basim Touqan2