- Department of Architecture and Interior Design, College of Engineering, University of Bahrain, Sakhir, Bahrain
This article assesses the technological, economic, and environmental aspects of installing the first 7.8 kW PV installation on a rooftop of a domestic house in Bahrain for a period of 2 years (20th March 2018 to 31st March 2020). The maximum solar electricity generated was 1,228.9 kWh (August 2018), and the least was 728.16 kWh (December 2019). The maximum daily specific yield (SY) was 6.12 kWh/kWp (on 14 April 2019). The annual average daily specific yield for this domestic building was 4.13 kWh/kWp. The average performance ratio (PR) of the PV system was 73.0% in 2019. The self-sufficiency (SS) of this installation was found to vary from 15.3% to 50.7%. The average SS value in 2018 was 22.8%, while in 2019 it was 28.6%. Furthermore, a cubic relation correlation was established, relating the month number (X) and the monthly average of the daily specific yield (Y). It was found that installing a solar PV system will cut about 39.0% of CO2 annually, which is equal to 4.637 tons and hence saves 38,567 ft3 of natural gas. The initiative of encouraging the use of rooftops in Bahrain to produce zero-carbon electricity is a step towards retrofitting the built environment to combat climate change.
1 Introduction
The Government of Bahrain had established an initiative to financially support 10 households to install a 7.8 kWPV system on the rooftop of their houses (domestic building) in different areas of Bahrain in 2017. The purpose was to monitor the performance of these PV systems and explore any difficulties facing the owners and residents. This was a step towards encouraging the use of solar energy in domestic houses to generate solar electricity to fulfil Bahrain’s target of attaining a 5% renewable energy share of the total conventional energy by 2025 and a 10% target by 2035, which was then modified and announced in COP-26 to be 20% by 2035 (SEU, 2017).
The first non-domestic 4 kWPV system to provide solar electricity installed in a Bahraini building was in 2010 (Alnaser, 2015; Abdali et al., 2019) in the Princess Sabeeka Park in the town of Awali. This installation was part of 6.9 kW hybrid renewable energy project (4 kW solar PV, 1.7 kW wind, 1.2 kW hydrogen fuel cells) managed by the Bahrain Petroleum Company (Bapco) (Figure 1).

FIGURE 1. The first non-domestic 4 kW photovoltaic (PV) panel to provide solar electricity installed in a Bahraini building was in 2010. On the left is the specification of the installed PV system, and on the right shows the location of the renewable energy system (PV and wind) in Princess Sabeeka Park in Awali. The project is managed by Bapco (Alnaser, 2015).
The second PV installation was conducted on the Sadeem building in Awali in 2014 by Bapco (Alnaser, 2017; Alnaser and Alnaser, 2017). There are 36 PV panels on the roof of this building, each having 240 Wp, meaning the total installed power is 8.64 kW. The panels’ orientation is 225° from the north and is at a tilt angle of 25°, although the latitude of Bahrain is 26.138°N and the latitude is 50.88° E. The total area of PV panels on the roof is about 60 m2 (Figure 2).
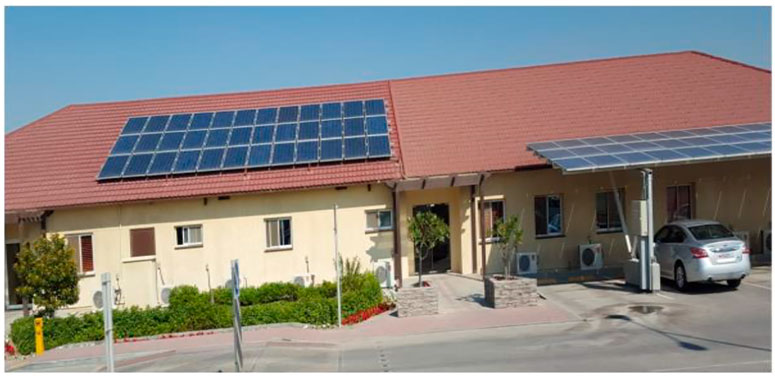
FIGURE 2. The second 8.64 kW PV installation on a building in Bahrain (Sadeem building) in Awali in 2014 by Bapco. There are 36 PV rooftop panels, each having 240 Wp (Alnaser, 2017; Alnaser and Alnaser, 2017).
Subsequently, the first large PV installation in Bahrain (5 MW) was in 2014 (Alnaser et al., 2014; Alnaser et al., 2015; Alnaser et al., 2018; Alnaser and Alnaser, 2019). This PV installation is located at Princess Sabeeka Park in Awali (26.1° N, 50.6° E). The minimum and maximum values of the monthly average daily global solar radiation in Awali were 4.00 kWh/m2 and 4.79 kWh/m2 in January and July of 2015, respectively (Abdali et al., 2019).
In February 2016, the Tatweer Petroleum company, Bahrain, installed a 1 MW solar PV as a ground installation connected to the electricity grid of Tatweer to provide enough electricity to meet the total energy requirements of the company’s headquarters in the region (Trade Arabia, 2016). Later, on 30th December 2019, Tatweer Petroleum installed another ground 3 MW Solar PV generating more than 5,400 MWh per year, which is equivalent to the energy used by 300 Bahraini homes, bringing the company’s use of renewable energy to 6% (Barakat, 2019).
Nearly 46 MW of solar PV installation has been either executed or is planned to be in operation by 2024 in Bahrain (Kim, 2022), as referred to in Table 1.
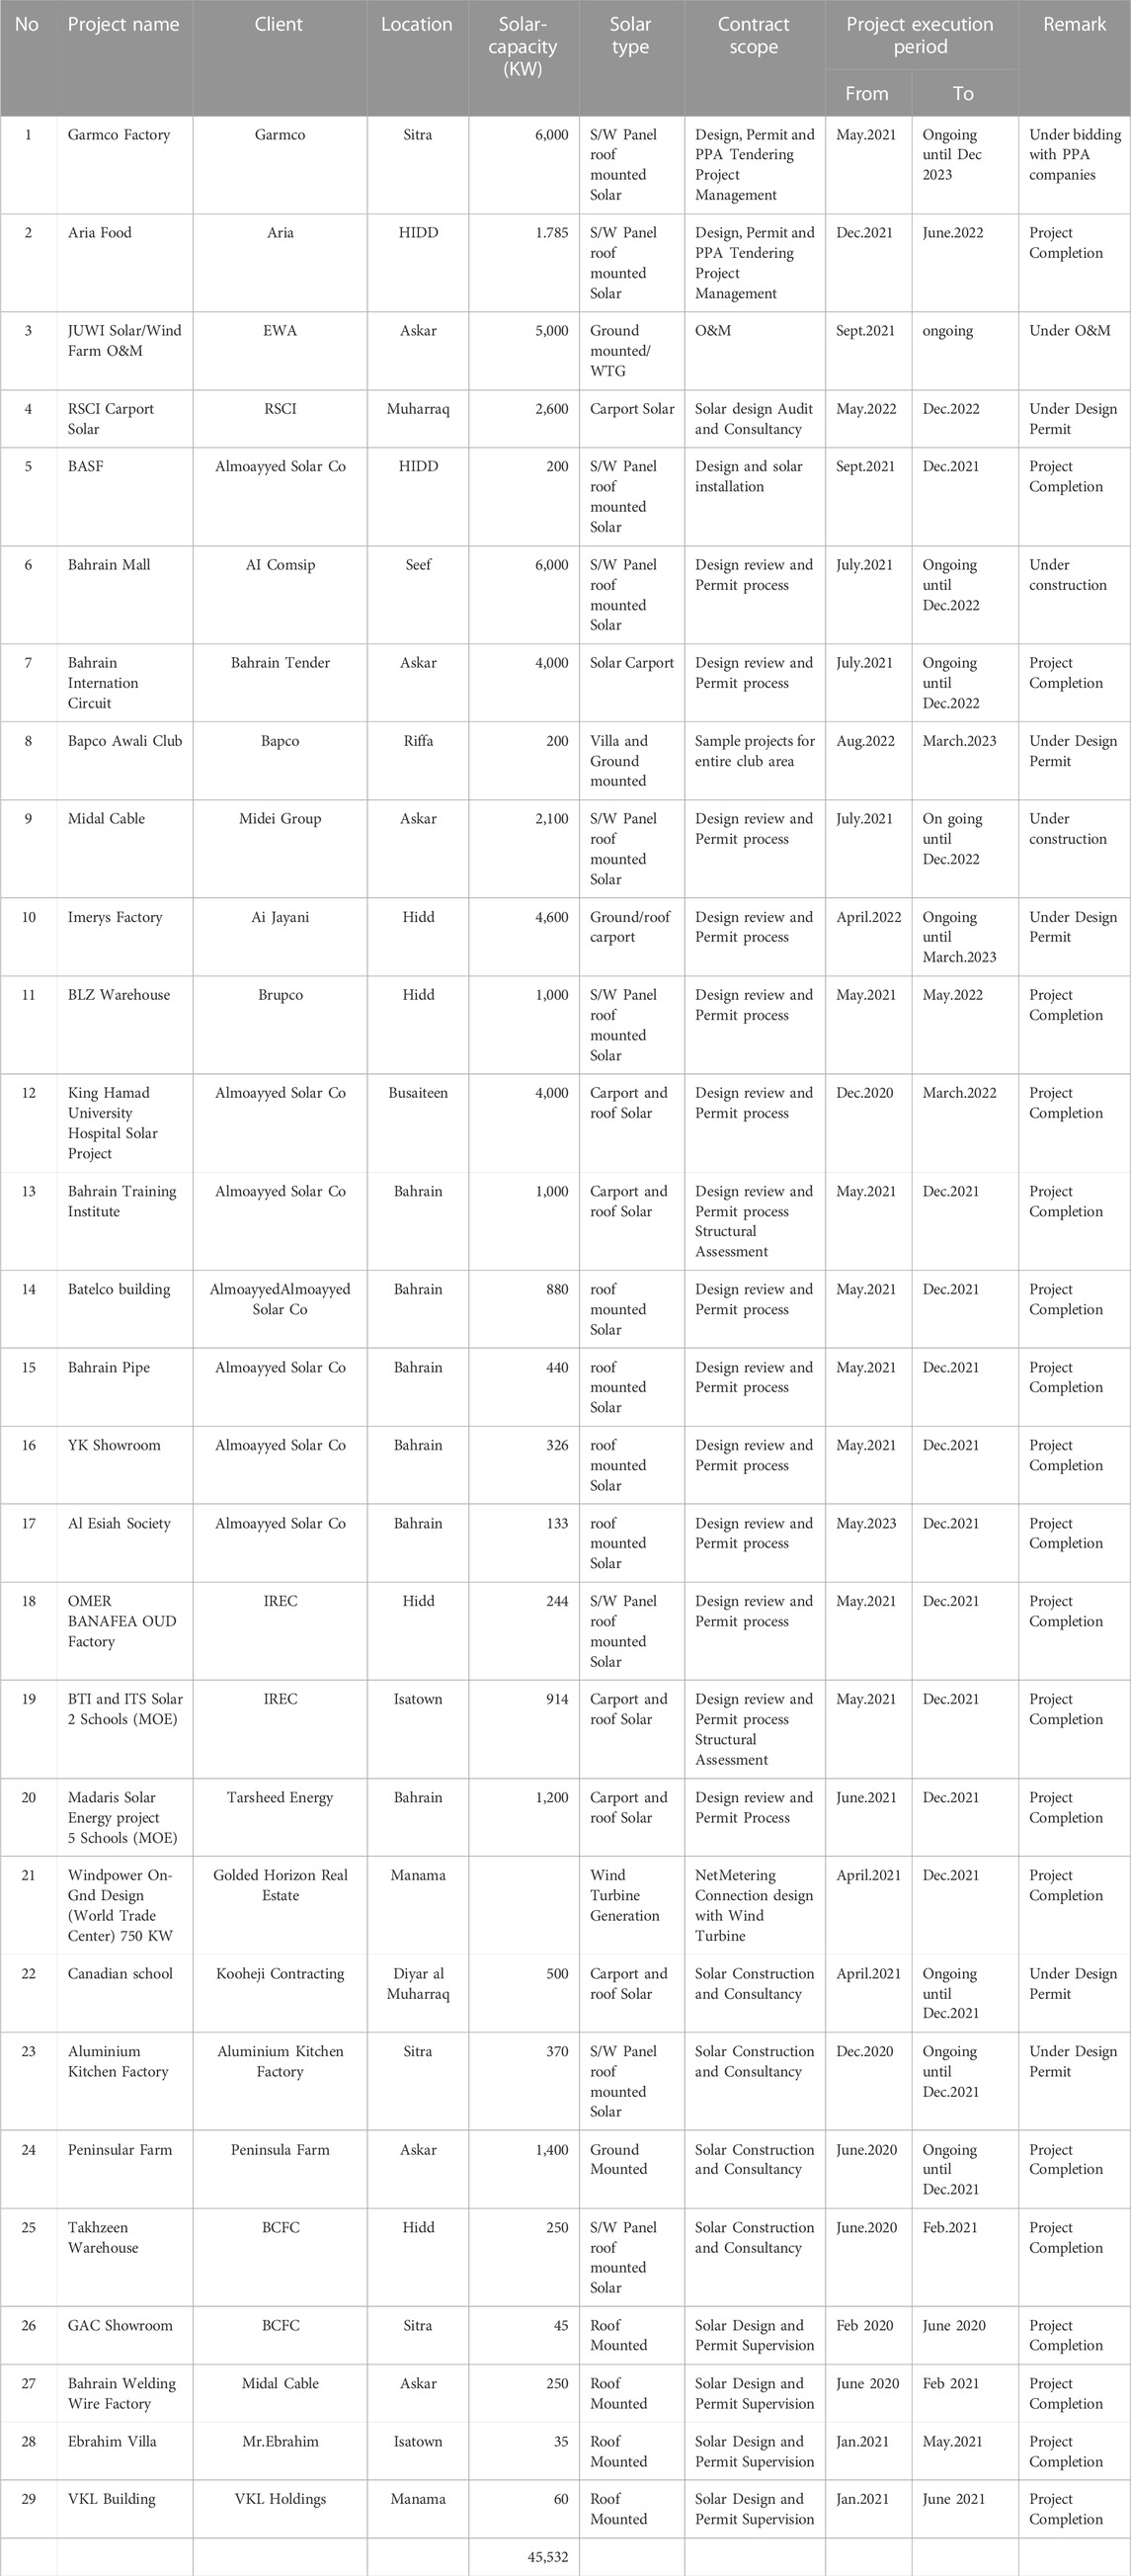
TABLE 1. The executed and planned solar PV installation in Bahrain. Nearly 46 MW of solar PV installation has been either executed or is planned to be in operation by 2024 (Kim, 2022). The red color indicates the projects managed by a single company, i.e., Y&K Company.
The projects in red color in Table 1 are managed by the Y&K Company, a Korean technology launching in Bahrain and the GCCC. Y&K Company is the contractor of nearly 18 MWPV solar projects (Figure 3) (Kim, 2022). Bahrain has kicked off a tender to award a 20-year contract to a local or international company to build, operate, and transfer (BOT) and maintain a grid-connected solar project with a minimum capacity of 72 MW in the southern area of Bahrain (Maisch, 2022). There is over 250 MW in planning or execution to be delivered by 2025.
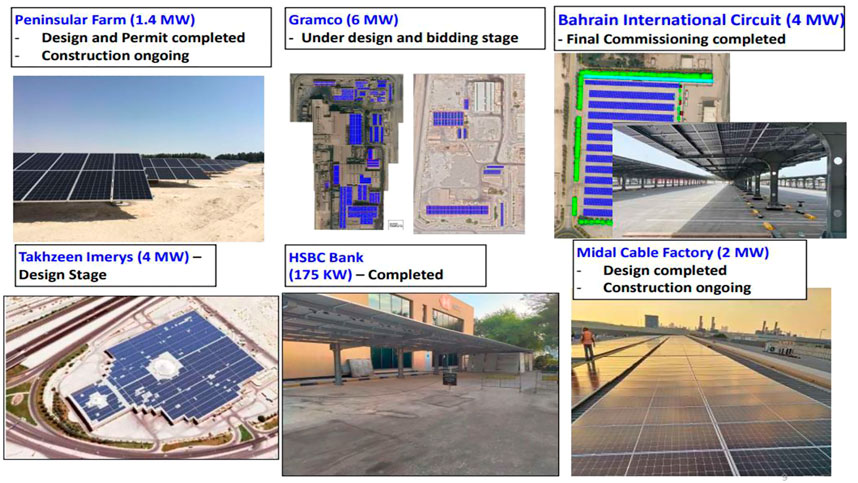
FIGURE 3. The relatively large-scale solar PV installations in Bahrain executed and managed by Y&K company, a Korean technology launching in Bahrain and other Gulf Cooperation Council Countries (GCCC) (Kim, 2022).
A pilot project for installing solar PV on 10 houses commenced in 2017. For these decentralized rooftop solar projects, the cabinet proposed and approved net metering in 2017, targeting residential-, commercial-, and industrial grid-tied electricity customers.
In a survey (Alsabbagh, 2019) comprising 764 respondents (63% were women and 37% men), four important questions were asked.
1- Is it possible to install residential PV in Bahrain?
2- Is there a PV solar panel manufacturing company operating in the country?
3- Has PV already been installed in selected houses in Bahrain?
4- Does electricity generation from residential PV reduce the electricity bill?
The answers were as follows (Alsabbagh, 2019): more than 80% answered Q1 and Q4 correctly, though only around 40% answered Q2 and Q3 correctly. This result indicates the participants overall had general knowledge about solar energy but were less knowledgeable about the status of the use of solar PV in Bahrain.
Only around 33% of participants expressed willingness to pay for installing residential PV, which costs BD 3,500 (USD 9,300). This cost covers the installation of 24 solar panels that produce 12,500 kWh per year, as estimated by the Electricity and Water Authority in Bahrain (Alayam, 2019)—74% of the participants were willing to pay only 50% of the capital cost. However, 48.2% expressed interest in installing PV in their house if the government fully subsidized it. This indicates an acceptance of solar PV in Bahrain, as a majority of the participants supported it when not factoring in who would pay the capital cost. The barrier most commonly chosen was the relatively high capital cost, at 37% of all replies. This seems realistic, as the payback period is not attractive (the payback period is around 10 years). This is considering that a net metering policy is implemented, by which the purchasing rate of the generated electricity equals the selling rate.
This aim of this article is to disseminate knowledge to the government, public, investors, and policymakers on the performance of the first domestic house with a rooftop PV system—this house was one of 10 other government-built houses as part of the identified seven projects and three policies for achieving the RE target (SEU, 2017) set by the government in Bahrain, which focus mainly on projects financed by the private sector and regulated and supported by the government, including the installation of rooftop solar PV systems on existing residential and commercial buildings (SEU, 2017). This will help in the refinement and modification of many conditions, laws, policies, and criteria set in this regard.
2 Methodology
The data of the performance of the PV system on the roof of the first domestic PV house in Bahrain were collected from a local company in Bahrain, the Almoayyed Solar Company (ASC), which specializes in energy service and energy auditing to improve the overall energy performance of the commercial, industrial, and residential sectors. This house was one of 10 domestic houses supported by the government to use a PV Solar System. ASC was assigned to manage and monitor the solar input and solar electricity output, cleaning, troubleshooting, and maintenance. All the solar electricity was recorded and tabulated.
According to ASC, this first solar PV domestic house (House 4 #108)—owned by Hussain Hassan Mansour Sanad—may have had the best performance due to the cleaning of the PV panels once every 15 days in the period from 03/06/2018 to 03/05/2019. In addition, the owner of the house was the most cooperative house owner with ASC. After the expiration of the cleaning contract, the household cleaned the PV system once a month.
2.1 PV system description
The 7.8 kWp PV system of the house consists of the following.
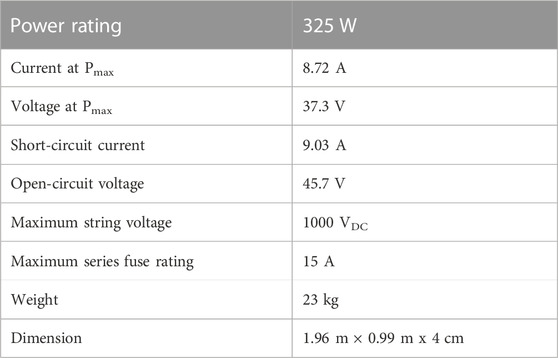
i- Twenty-four (24) polycrystalline silicon (Poly-Si) PV panels, manufactured by Jiangsu Seraphim Solar System Co. Ltd., Model SRP-325-6pA, China. Based on STC:1000 W/m2, air mass (AM) 1.5, T = 25°. The technical data of each panel are as follows:
The PV panels were facing 160° (instead of 180°, due south) because of a rooftop limitation and to avoid the shadowing of the panels. The panels were titled at 12° (instead of 26°, which is the latitude of Bahrain) to avoid wind force stress on the PV panels, because they were anchored on a concrete foundation that can withstand wind speeds of no more than 30 m/s (110 km/h). The flow of turbulent air under the panels may cause serious stress on their stability. This is shown in Figure 4.
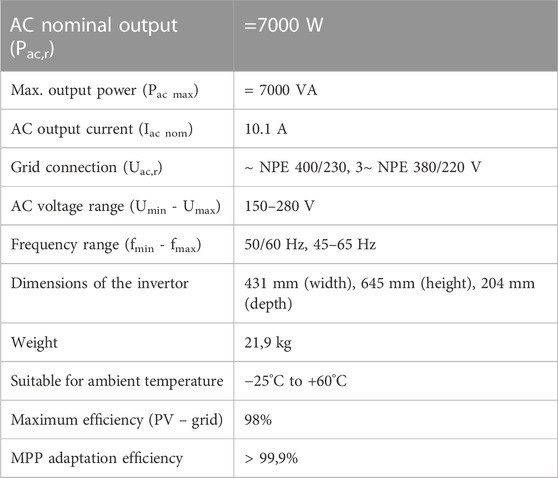
ii- Invertor: An inverter with AC nominal output of 7000 W was used. It was manufactured by Fronius International GmbH, model SYMO -7.0-3-M, Austria. The inverter features a simple, standardized mounting system, making installation and maintenance easy and simple. The solar DC connection area is separate from the power stage set compartment, with both being installed separately. The inverter is simply placed in the wall bracket and then secured. This means that it is not necessary to remove the entire inverter for servicing, just the power stage set. All the cabling remains in place. The inverter allows for a data communication package with fully integrated datalogging, WLAN, Ethernet, energy management, a web server, and a range of interfaces. The inverter is connected to the internet by a network cable or WLAN—without additional cabling—and grants an overview of how the PV system is operating. Connection to third-party components is provided by means of interfaces such as Modbus TCP SunSpec, Modbus RTU SunSpec, or Fronius Solar API (JSON). The inverter has the following OUTPUT features:
iii- DC SPD box: This is a DC surge protective device to protect the DC electric system from surge. Moreover, it allows replacement of the protective metal oxide varistor (MOV), i.e., a voltage-dependent device that has an electrical behavior similar to back-to-back Zener diodes. This ensures convenience and a reduced cost.
iv- PV Array junction box: This is also referred to as PV combiner boxes. It collects DC power from the 7.8 PV strings with blocking diodes on each string for protecting panels from the reverse current flow. The collected power is then transferred to the inverter to be converted into AC.
v- Smart PV meter: The smart PV meter, also called the renewable energy meter, measures the solar energy generated from the solar PV system. This is in contrast to a bi-directional billing meter, which only measures the energy being sent back to the grid, not the total solar produced by the PV system. Net metering is a billing mechanism that allows the plant operators to feed electricity they do not use back into the grid and credits solar PV system owners for what they add to the grid in terms of kWh credit (no money but energy credits). The PV meter is installed as part of the PV system and is used to determine the self-consumed part of the solar power in kWh in conjunction with the data from the billing meter. The billing meter is owned by EWA, the grid system operator.
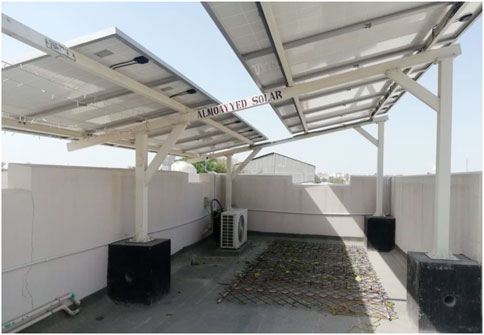
FIGURE 4. The PV panels on the rooftop of the first 7.8 kW PV domestic building (House 4 #108) in Bahrain were anchored on a concrete foundation that can withstand wind speeds of no more than 30 m/s (110 km/h).
Figure 5 illustrates the four components of the PV electronic systems in house #108, and Figure 6 shows the electric connections of the system. Such a system is made for all protype domestic 7.8 kW solar PVs in Bahrain. It is planned to charge each household about BD 3,500 (USD 9,300) for the whole system.
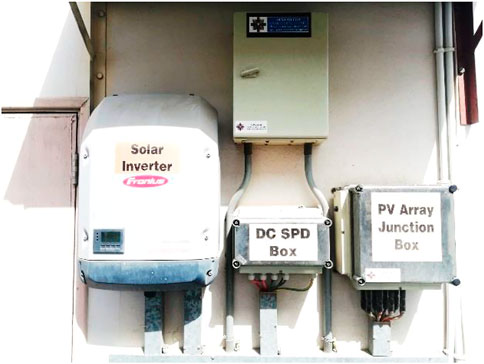
FIGURE 5. The main components of PV power electronic systems for PV array installed in the first 7.8 kW PV domestic building (House 4 #108) in Bahrain. These components are a smart PV meter, PV array junction box, DC SPD box, and solar inverter.
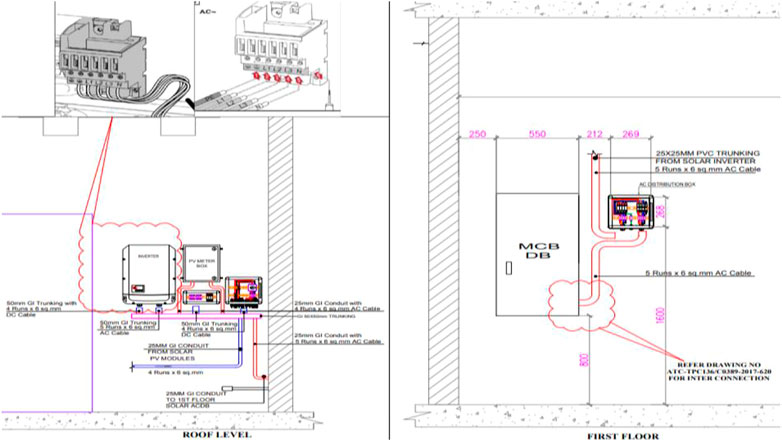
FIGURE 6. The diagram of the PV electric systems installed in the first 7.8 kW PV domestic building (House 4 #108) in Bahrain.
Figure 7 shows the layout of the roof of House 4 #108 without PV array and with PV array. It is very clear that the PV occupies about 20% of the roof. This has advantage of providing shade on the roof and hence less heat transfer from roof to rooms through the ceiling; it also has the advantage of allowing space for social gatherings or activities on the roof, as the PV panels were raised off the roof deck.
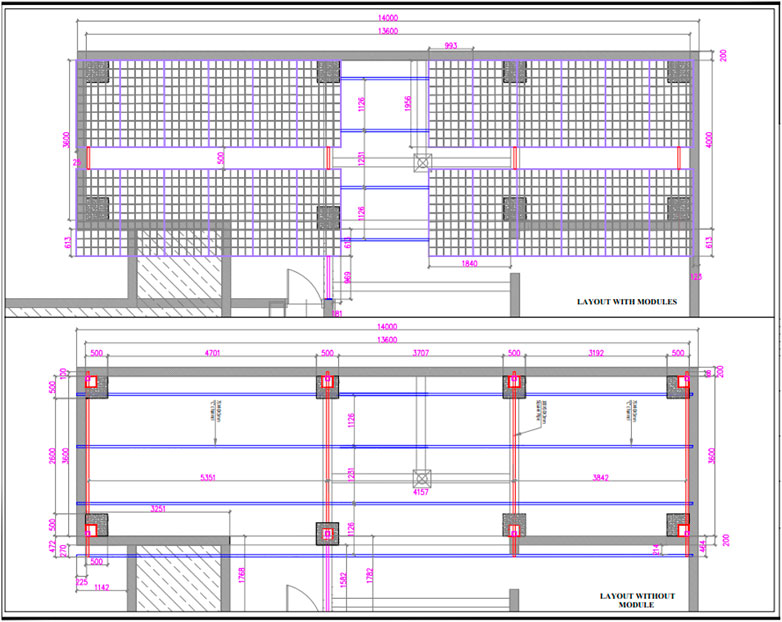
FIGURE 7. The layout of the first 7.8 kW PV domestic building (House 4 #108) in Bahrain with PV (top) array and without PV array (bottom).
Figure 8 shows the actual layout of the roof from the top of the PV panels (top right), below the PV panels (top left), the official inauguration of the project (bottom right), and a view of the installed of the roof PV from the ground and from the neighborhood (bottom left). All the recorded data of solar generation were stored and processed at ASC and were kindly provided to the author in the form of Excel sheets. The data were tabulated and analyzed statically.
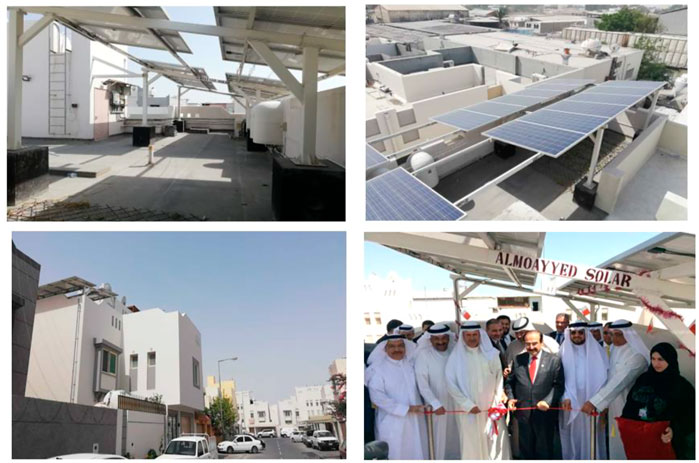
FIGURE 8. The layout of the PV panels of the first 7.8 kW PV domestic building (House 4 #108) in Bahrain. Top of PV panels (top right), below the PV panels (top left), the official inauguration of the project (bottom right), and view of the roof PV from the ground (bottom left).
3 Results and discussion
3.1 Performance of PV solar electricity generation
According to the raw data provided for the solar electricity generation of the first domestic building using solar 7.8 kWp PV in Bahrain, the maximum obtained solar electricity on a particular day in the 2 years under study was 47.78 kWh (on 14 April 2019), followed by 46.60 kWh (on 18 April 2018).
Figure 9 shows the monthly solar electricity (in kWh) in 2018 and 2019 produced for the first domestic building in Bahrain (House 4 #108) to have a 7.8 kW solar PV system on its rooftop. The data are from 20 March 2018 up to 31 March 2020 (2 years).
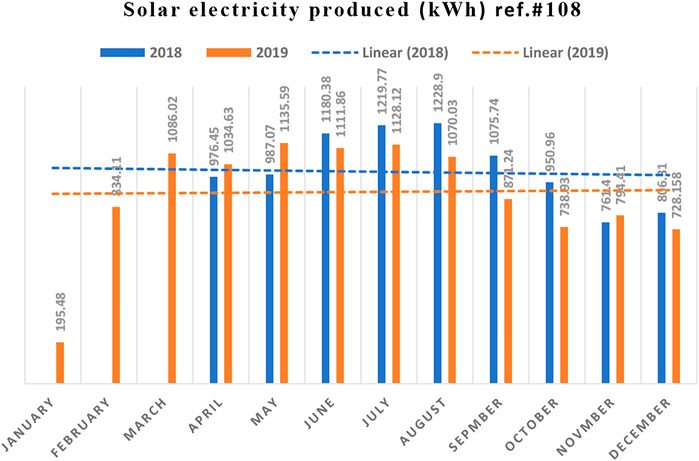
FIGURE 9. The monthly solar electricity (in kWh) in 2018 and 2019 produced for the first domestic building in Bahrain (House 4 #108) to have a 7.8 kW solar PV system on its rooftop. The data are from 20 March 2018 up to 31 March 2020 (2 years).
Table 2 shows that the total solar electricity generated in the year 2019 was 11,328.58 kWh (full year), while in 2018 it was 9,186.98 kWh; it was expected that the total in 2018 would be less than in 2019 because the operation started in 20 March 2018, and thus 3 months (January, February, and March) were not counted. Table 2 also shows that July and August were the months that produced the highest monthly average; for example, in 2018, the months August and July were the most productive at 1228.9 kWh and 1219.77 kWh, respectively. In 2019, June and July had the highest yield at 1135.59 kWh and 1128.12 kWh, respectively. Surprisingly, in all summer months of 2018 and 2019 we detected no daily solar yield at more than 45.25 kWh. This clearly attributed to effect of the solar PV tilt angle (12
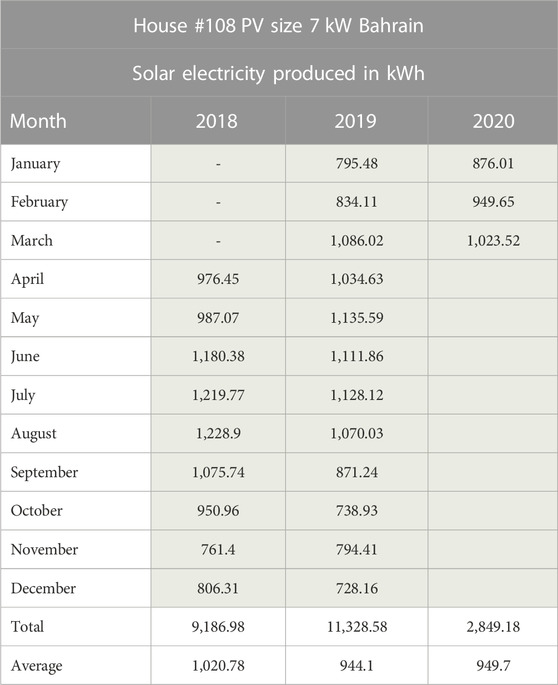
TABLE 2. The monthly solar electricity produced for the first domestic building in Bahrain to have a 7.8 kW solar PV system on its rooftop. The data are from 20 March 2018 to 31 March 2020.
It was also found that the minimum obtained solar electricity on a particular day in 2 years was 1.14 kWh (on 23 January 2020), followed by 2.08 kWh (on 5 January 2020). In the year 2018, the lowest daily solar electricity yield was 5.23 kWh (on 11 April) kWh, followed by 6.4 kWh (on 25 November). Again, looking at Table 2, it clearly shows that in November 2018, the least monthly solar electricity yield was harvested (761.4 kWh), while in 2019 it was in December (728.15 kWh). The annual average per month for the year 2018 was 1,020.78 kWh (9 months; January, February, and March are excluded), while in 2019 it was 944.1 kWh. This reduction may be attributed to a tiny deterioration in the PV system component or less solar potential that year.
Figure 10 shows the measured monthly average global solar radiation at Bahrain International Airport (lat. 26° 16′N, long. 50° 39′E, height 2 m). The total monthly solar potential in 2018 was 5,351.8 W/m2, and the average monthly solar radiation was 446.0 W/m2, while in 2019 these were 5,452.9 W/m2 and 454.4 W/m2, respectively. This means that the year 2019 was more solar rich than 2018, which led us to conclude that the lower solar electricity yield from the PV panels may be attributed more to the degradation of the PV cell, i.e., due to heat, and a consequently higher PV panel temperature and connecting cables, as well as due to the effect of high UV radiation, which reaches about 26–30 W/m2 (Som, 1992; Alnaser, 1997), and may be due to other weather conditions such as sky turbidity and humidity.
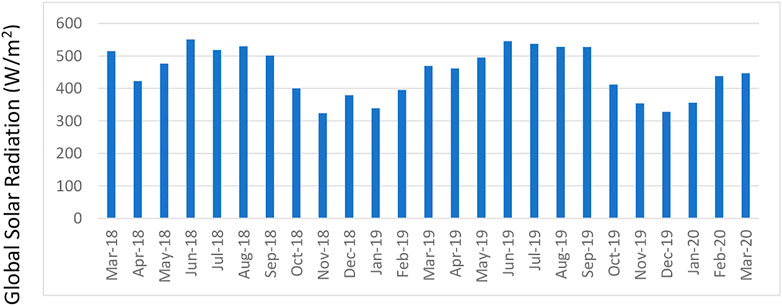
FIGURE 10. The monthly average of global solar radiation (W/m2) measured at Bahrain International Airport (lat. 26° 16′N, long. 50° 39′E, height 2 m). The total monthly solar potential in 2018 was 5,351.8 W/m2, and the average monthly solar radiation was 446.0 W/m2, while in 2019 these were 5,452.9 W/m2 and 454.4 W/m2, respectively.
3.2 The specific yield values for the PV system
The specific yield (SY) (final yield) (kWh/kWp) is usually calculated from the energy output EAC (daily, monthly, or yearly) divided by the rated power output PPV,rated (Wp) of the PV system (Gulkowski, 2022). The energy output, herein, is calculated as the amount of AC (alternating current) power produced by the system over a given period of time.
This term complements the known terminology of the so-called performance ratio (PR), which indicates the efficiency of the yield of the PV system. The PR is calculated using the following relation (Youtube, 2022):
where GH is the global inclined irradiation (kWh/m2/y), and Pnom PV is the PV module installed capacity (kWp). For example, from the result in Section 1 of the discussion (Table 2), E AC in 2019 for the 7.8 kWp PV (= Pnom PV) was 11,328.58 kWh, while GH (from Figure 12) was nearly 1,990 kWh/m2/yr, leading to the average PR for 2019 = 73.0%, while for 2018 it was 60.3% (GH = 1,953.4 kWh/m2/yr; E AC = 9,187 kWh). This lower value for 2018 is expected, since no solar electricity was generated from the PV system in January, February, and March.
According to the raw data provided for the monthly specific yield (in kWh/kWp) of the building under study, it was found that the maximum SY obtained on a particular day in 2 years was 6.12 kWh/kWp (on 14 April 2019), followed by 6.10 kWh/kWp (on 23 April 2019).The highest value SY per day in 2018 was 5.97 kWh/kWp (on 18 April), followed by 5.76 kWh/kWp per day (on 23 June).
Table 3 clearly shows that July and August were the months with the highest SY daily average; for example, in 2018, the months of August and July had the highest SY at 5.05 kWh/kW and 5.08 kWh/kW, respectively. In 2019, June and July were the months with the highest daily SY at 4.75 kWh/kW and 4.82 kWh/kW, respectively.
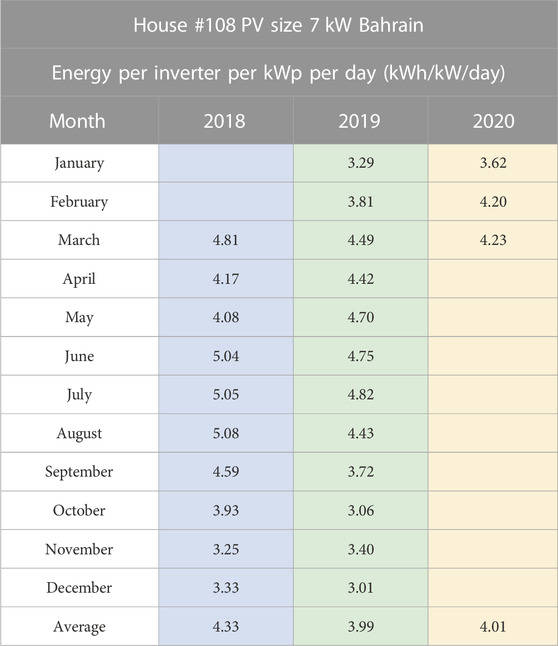
TABLE 3. The average daily specific yield per month produced for the first domestic building in Bahrain to have a 7.8 kW solar PV system on its rooftop. The data are from 20 March 2018 up to 31 March 2020 (2 years).
Figure 11 shows the monthly average specific yield per day (in kWh/kWp) of the building under study for the period from 20 March 2018 to 31 March 2020 (2 years). The annual average of the specific yield for this domestic building was 4.13 kWh/kWp/day. In comparing this value with the first 8.64 kW BIPV at Sadeem building of Bapco in Awali (company building (Alnaser and Alnaser, 2017), Bahrain), this value (4.13 kWh/kW/day) seems to be close to that reported for the Bapco house, which has an SY ranging from 3.6 kWh/kW/day to 4.6 kWh/kW/day, with an average 4.13 KWh/kW/day.
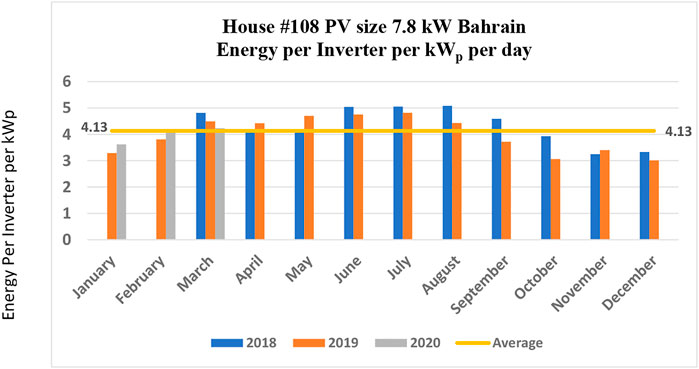
FIGURE 11. The average daily specific yield per month (in kWh/kWp/day) produced for the first domestic building in Bahrain to have a 7.8 kW solar PV system on its rooftop (House 4 #108). The data are from 20 March 2018 up to 31 March 2020 (2 years). The annual average of the specific yield is 4.13.
In comparing with other Gulf Cooperation Council Countries (GCCC), for a building in Abu Dhabi (AlAli and Emziane, 2013), the SY was 4.7 kWh/kW/day on average. In the Kingdom of Saudi Arabia (Alabduljabbar et al., 2019), the average SY was 4.49 kWh/kW/day. In Oman (Elmenreich et al., 2014), the SY was 5.13 kWh/kW/day. In Qatar (Abdallaha et al., 2015), on average, it was 5.5 kWh/kW/day. In Poland (Gulkowski, 2022), for July and August 2021, the highest median value of SY was 5.3 kWh/kWp/day, and the maximum SY was 7.0 kWh/kWp/day. For this house under study (House 4 #108), the maximum SY per day was 6.12 kWh/kWp, which is less than the Polish value, because in their work the panels were facing south with a tilt angle of 20° (Poland’s latitude is 35° N) and made of Longi Solar LR6-60HPH, efficiency 19.3%.
3.3 The self-consumption ratio
The self-consumption ratio (SC), defined as the amount of energy consumed locally, was calculated using Equation (Bošnjakovi´c et al., 2021):
where EC is the amount of energy consumption from PV, and EE is the amount of energy exported to the grid.
The self-sufficiency ratio (SS), defined as the amount of consumption delivered by the local production from the PV system, can be calculated using the following equation (Bošnjakovi´c et al., 2021):
where EI is the amount of energy imported from the grid for a remaining load. Table 4 shows the calculated monthly SC for the period from April 2018 to March 2020 (2 years). For example, in June 2018, EC = 1,180 kWh and EE = 0, which gives SC = 100%. If EC is less than the consumption from the grid (EI), then SC will be always equal to 100%.
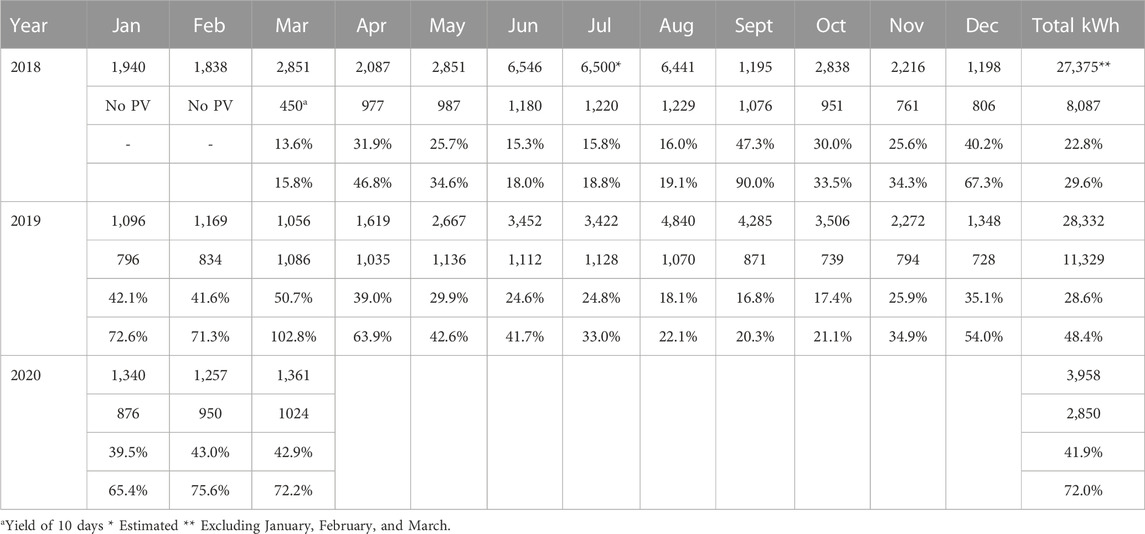
TABLE 4. The electricity consumption (in kWh), solar electricity production (in kWh), amount of consumption delivered by the local production from the PV system (SS), and energy saving for the first domestic building in Bahrain to have a 7.8 kW-PV on its rooftop (House 4 # 108). The first line (in black) in each cell is for the consumption of conventional electricity from the utility, the second line (in red) is the yield of solar electricity from the rooftop 7.8 kW PV panels, the third line (in purple) is for the self-sufficiency ratio (SS), and the fourth line (in green) is for the percentage of conventional electricity saving.
In Table 4, it is only March 2019 where EC = 1,086 kWh and EE = 30 kWh, where SC = 97.3%. However, the table shows that amount of consumption delivered by the local production from the PV system (SS) varies from as low as 15.3% and 15.8% in June and July 2018, respectively, and 16.8% in September 2019 to relatively larger values of 50.7% in March 2019.
The average SS value for this house in 2018 was 22.8%, while in 2019 it was 28.6, compared to the 30.16 kW PV system in Poland (Gulkowski, 2022), with its PV panels tilted 25° (Poland’s latitude is 35°), facing south-east, and with an efficiency of 17.7%. In their work, the SC values were than 90% in November, December, and January and less than 50% in June, July, and August. For the SS, they were less than 10% in December, January, and February and more than 60% from May to August but did not exceed 70.6%. It is expected that the energy demand in Poland will be orders of magnitude different than in the GCCC due to the demand for cooling, which is normally met by local electricity consumption; by comparison, in Poland and other northern regions, heating is the big energy demand, but this is most often met with district heating networks or non-electric means. Hence, their electricity demand is greatly reduced.
3.4 The environmental benefits
Bahrain has set a national target of achieving carbon neutrality by 2060, with an interim goal of a 30% reduction in CO2e emissions by 2035. Among the proposed policies to achieve this (Alsabbagh and Alnaser, 2022) is the adoption of renewable energy technologies. Luckily, solar and wind energies in specific have been extensively explored in the GCCC (Alharb and Csala, 2021; Albuflasa et al., 2022). The initiative of the MEWA with support from Tatweer (a governmental oil and gas company) to financially support 10 domestic buildings to install 7.8 kW PV (among them is the first house, House 4 # 108) is among the endeavors to reduce CO2e emissions by 30% in Bahrain by 2035.
Table 4 (last row, in green) shows that the saving of conventional energy and consequently the CO2 in this house varied from low monthly values of 18% (June to August) for the year 2018 and from 20% to 22% (August to September) in 2019. The annual average saving was 29.6% in 2018 and 48.4% in 2019. If we assume that the house annually consumes 29,000 kWh, which is equal to emissions of 11,890 kg CO2e (11.9 tons)—knowing that every 2,435 kWh = 1 metric ton of CO2 emission or 1 kWh = 0.41 kg of CO2 emission (EIA, 2022), which is used in Bahrain—and another reference considers 1 kWh = 0.309 kge (BEIS, 2018), hence the CO2e emission is 8,961 kg (8.9 ton). Therefore, based on the actual results obtained from this house (House 4 #108), we conclude that installing 7.8 kWp of PV in domestic houses in Bahrain will annually save about 39.0% of CO2, which is equal to 4637.1 kg (4.637 ton) and also saves 38,567 ft3 of natural gas annually, assuming that each kWh equals 3.41 ft3 of natural gas (Traditionoven, 2022). This saving can be used for the petrochemical industry instead of burning for electricity. This means that if all houses in the form of domestic buildings (villas) in Bahrain, which number 137,284 (out of 273,733 buildings) (Tribune, 2022), are installed with a 7.8 kW PV on their rooftops, then the cut in CO2 will be about 636,586 tons (0.64 million tons or 0.64 billion kg).
3.5 The payback period
The government had arranged with developers that the cost of every 7.8 kW PV rooftop system should not exceed BD 3,500, including fixing, maintenance, equipment, and 2 years of cleaning. Now, when referring to Table 5, it is clear that no more than 12,000 kWh of solar electricity can be generated from the PVs annually. A total of 1,000 kWh of monthly solar electricity was generated. This is clearly understood from our findings in Section 2, Table 3; the maximum SY was 5.08 kWh/kWp/day, which means that the per month (30 days) maximum generated solar electricity was 1,189 kWh. This solar electricity production will be purchased @ 3 fils/kWh (US¢ 0.8/kWh), since it falls in the subsidized category (0—3,000 kWh), whereas from 3001 to 6000 kWh it costs 9 fils/kWh (US ¢2.3/kWh) for local first home domestic consumption. This means that in a year the customer will produce 14,268 kWh, which worth nearly BD 43 (USD114), and nearly 81 years are required to cover the cost of BD 3,500 (USD 9,259). This is not encouraging for a customer wants to invest in solar energy application. Previous studies (Al-Alawi et al., 2017) suggested a purchased tariff of for each kWh of solar electricity is 75fils/kWh (US ¢ 20/kWh) to 85 fils/kWh (US¢ 23/kWh). They also suggested adopting an FIT policy along with a government subsidy of 30% of the capital cost of the residential PV system. In a previous article (Alnaser, 2017), it was suggested that a suitable purchase for each 1 kWh solar electricity is 380 fils (about USD1.0) for a payback period of 5 years for the Sadeem house, Bapco (governmental building), where the cost of the installation was relatively very high. In this study, a purchase of 100 fils/kWh (US¢ 27/kWh) for solar electricity may be attractive for payback in 3 years for domestic houses.
According to Alsabbagh (Alsabbagh, 2019), although net metering is widespread, it was found to be ineffective for Bahrain because the tariff for residential electricity consumption is relatively low. Net metering is more successful when the tariff is high and per capita electricity consumption is relatively high (RCREEE, 2016).
3.6 Modeling the monthly average of daily specific yield (SY)
The daily SY data per day per month of the 2-year period (from 20 March 2018 to 31 March 2020) was entered in MS Excel and analyzed using Statistical Package for the Social Sciences (SPSS) Version 28. A p-value of less than 0.05 was considered statistically significant, which indicates strong evidence against the null hypothesis, as there is less than a 5% probability that the null is correct.
According to the data, the value of the Pearson correlation coefficient shows no significant relation (R = 0.31, p > 0.131; R2 = 0.096 (only 9.6%)) when using SPSS program between the month of the year (X) and the monthly average of the daily specific yield (Y), i.e., the energy per inverter per kW per day in a particular month (kWh/kW/day/month). For example, the specific yield (SY) per day in February (X = 2) was 4.38 kWh/kWp, in June (X = 6) it was 4.15 kWh/kWp and in November (X = 11) it was 3.87 kWh/kWp, which is far from the actual measured values, which were 4.00 kWh/kWp, 4.9 kWh/kWp, and 3.30 kWh/kWp, respectively. This linear relation contradicts the reality; the relation indicates that the SY per day reduces as we depart from January.
A cubic relation correlation was established (Figure 12) and gives the highest correlations (r = 0.85 and R2 = 0.73, with significance P ˂ 0.001). The following relation was found between the month number (X) and the monthly average of the daily specific yield (Y):
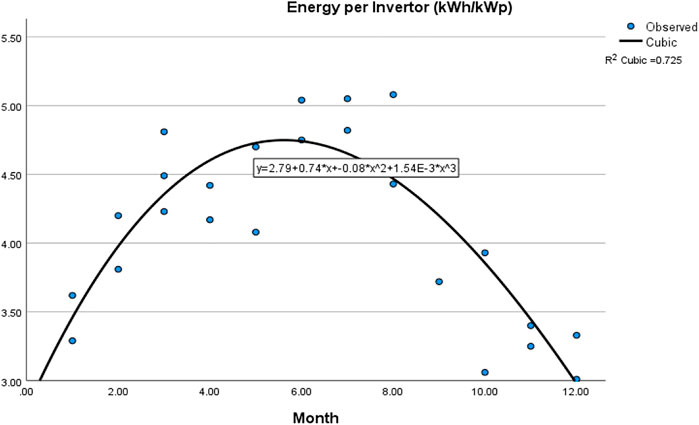
FIGURE 12. The cubic relation between the month number and specific yield, i.e., the energy per inverter per kW per month per day using actual measured data for the 2-years performance of solar generation for the first house integrated with a rooftop 7.8 kW PV system in Bahrain. Data are from March 2018 to March 2020.
Eqn. 5 is novel; it gives the best estimate for solar electricity produced by a PV Solar System in each month. To explain the result of this model, the yield (Y) in February (X = 2) was 3.96 kWh/kWp, in June (X = 6) it was 4.68 kWh/kWp and in November (X = 11) it was 3.29 kWh/kWp; these values are very close to the actual measured values, which were 4.00 kWh/kWp, 4.90 kWh/kWp, and 3.30 kWh/kWp, respectively. The outcome of this cubic equation is by far much better than the linear one.
Table 5 compares the findings of our study with a similar study in Sohar, Oman (Elmenreich et al., 2014), Kuwait City, Kuwait (Al-Otaibi et al., 2015), Abu Dhabi, UAE (AlAli and Emziane, 2013), and Riyadh, KSA (Alabduljabbar et al., 2019); all these locations are in an arid zone and give close figures, which validates the performance of this first domestic house.
It is interesting to note that the performance of a 5 kWp rooftop photovoltaic system in the University of Lucknow (latitude 26.30° to 27.10° N and longitude 80.30° and 81.13° E) in India shows that the final yield was about 4 kWh/kWp/day, with an annual average daily performance ratio of 76.97% (Bajpai and Yadav, 2018), which also agrees with our result.
3.7 The owner’s response toward installing rooftop PV system
In an interview on 30 July 2022, the owner of the first domestic building in Bahrain to have a 7.8 kW PV system (House 4 #108) summarized the advantages and drawbacks of installing a PV system on the roof. These are.
1. Solar energy is a renewable energy source and is abundance in Bahrain. Therefore, it has to be utilized to reduce the load on the national grid.
2. The maintenance requirement is very low; this indicates reliance on the component of PV installation.
3. It saves the country from background noise pollution, as gas turbines produce heat and noise.
4. It is attractive looking and gives more beauty to the house.
5. Family members can use the area under the installed PVs as a lounge for social gatherings.
6. The roof of the house will be cooler due to the shade provided by the PV panels. The shadow forecasted on the split-unit air conditioners improve the conditioners’ performance. Moreover, the heat flow from the roof to the rooms through the ceiling will reduce significantly. This makes the interior temperature of the house lower than usual and accordingly leads to less electricity consumption.
The drawbacks, which are very few, are.
1. The PV system is very expensive.
2. The regular cleaning, either once a week, twice a month, or once a month.
The outcome of this solar PV rooftop project may encourage Bahrain and other Gulf Cooperation Council Countries (GCCC) to use the roof space for solar electricity.
Alsabbagh (Alsabbagh, 2019) had discussed the disadvantages of using solar PV at a vast scale in Bahrain, which include land use, where solar energy requires a considerable area (1 MW requires 36,000 m2 in the USA and about 13,000 m2 in Bahrain), and water use for cleaning the PV panels (about 120 L/MWh) (Alsabbagh, 2019). The outcome of this work provides a solution and drops these barriers by suggesting the use of rooftops.
It is believed that disseminating more knowledge of the successful experience in domestic rooftop PV installation, which is the aim of this article, will contribute to breaking down the barriers against using solar electricity in domestic houses, along with the lack of trained and technically skilled labor, lack of public acceptance, and absence of governing bodies and legislation (IEA, 2014; Ali et al., 2017; Lewis, 2022). According to Kazim el (Albadi et al., 2017), other than the financial barriers to using solar technologies, the grid-connected PV (GCPV) system must be understood and studied intensively, as it could help in reducing peak load demand and could offer an alternative energy source.
The performance of the PV Solar System can be improved by different paths (direct, spiral, and curved) for water flow in a photovoltaic/thermal (PV/T) system (Hoseinzadeh and Garcia, 2021). Moreover, the expansion of renewable energy installations that leads in involving more territories and providing benefits to the local energy mix—which depends on the density of the energy demand and the closeness of the producers, i.e., the penetration of renewable energy in increasing the boundaries of the urban energy system—can be used as a tool to disseminate the use of the PV system on rooftops more widely (Hoseinzadeh et al., 2022a; Hoseinzadeh et al., 2022b). Moreover, by using the DesignBuilder Software, the energy consumption of the building was determined, and this will contribute to reducing energy consumption in buildings in humid areas (HoseinzadehZakeriShirkhani and Chamkha, 2019).
Currently, we are in process of performing this evaluation for 10 domestic houses in Bahrain, which will allow policymakers to overcome any drawbacks and waive out the hurdles that prevent the installation of rooftop PV systems on most houses in Bahrain to achieve the country’s commitment to zero emissions by 2060.
Conclusion
The initiative of the Government of Bahrain to support the installation of domestic rooftop PV systems is a great step toward retrofitting the country’s built environment to combat climate change. The results provided by the first house to be retrofitted with a 7.8 kW solar PV system are promising and encouraging. The maximum solar electricity generated in a month was 1,228.9 kWh (August 2018), and the least was 728.16 kWh (December 2019). The maximum specific yield obtained on a particular day in 2 years was 6.12 kWh/kWp/day (on 14 April 2019). The annual average SY was 4.13 kWh/kWp/day. The average performance ratio (PR) of this PV system in 2019 was 73.0%, and the self-sufficiency (SS) varied from 15.3% to 50.7%, while the average SS value was 22.8% in 2018 and 28.6% in 2019.
The annual cut in CO2 emissions from this house was about 39.0%, which is equal to 4.637 tons, saving 38,567 ft3 of natural gas. This saving can be used for a clean petrochemical industry instead of burning for electricity and producing greenhouse gases. This means that if all 137,284 domestic houses (out of 273,733 buildings) in Bahrain were to be integrated with a 7.8 kW PV system on their rooftops, then the cut in CO2 would amount to about 636,586 tons (0.64 million tons or 0.64 billion kg).
Data availability statement
The raw data supporting the conclusions of this article will be made available by the authors, without undue reservation.
Author contributions
This work is completely done by the author. The author confirms being the sole contributor of this work and has approved it for publication. All authors contributed to the article and approved the submitted version.
Acknowledgments
The author would like to thank the University of Bahrain for its support. The author is also grateful to NA, professor of applied physics (incomplete title) at the Arabian Gulf University for his generous help and assistance in all the topics discussed in the article. Special thanks are given to Eng. Alexander Al Samahiji, executive director and project manager, Sustainable Energy Unit, Bahrain, for proofreading the article. Thanks are extended to Eng. Sukrit Ranjan, business development manager at Almoayyed Solar Company, for making the solar generation electricity data available. Special thanks to the owner of House 4 # 108, the first domestic solar PV building in Bahrain, for providing the necessary required data and sharing his opinions of the advantages and drawbacks of this PV installation.
Conflict of interest
The author declares that the research was conducted in the absence of any commercial or financial relationships that could be construed as a potential conflict of interest.
Publisher’s note
All claims expressed in this article are solely those of the authors and do not necessarily represent those of their affiliated organizations, or those of the publisher, the editors and the reviewers. Any product that may be evaluated in this article, or claim that may be made by its manufacturer, is not guaranteed or endorsed by the publisher.
References
Abdali, A., Akbar, A. S., Alsaffar, A., Bin Shams, M., and Haji, S. (2019). Energy analysis of Bahrain’s first hybrid renewable energy system. Int. J. Green Energy 16 (10), 733–748. doi:10.1080/15435075.2019.1619567
Abdallaha, A., Figgisa, B. W., Martinez-Plazaa, D., and Mirza, T. (2015). Performance improvement techniques for photovoltaic systems in Qatar: Results of first year of outdoor exposure. Energy Procedia 77, 386–396. doi:10.1016/j.egypro.2015.07.054
Al-Alawi, Y., Durazi, A., and Haji, S. (2017). Feed-in tariff structure development for photovoltaic electricity and the associated benefits for the kingdom of Bahrain. Int. J. Sustain. Energy 37 (5), 479–497. doi:10.1080/14786451.2017.1304940
Al-Otaibi, A., Al-Qattan, A., Al-Mulla, A., and Fairouz, F. (2015). Performance evaluation of photovoltaic systems on kuwaiti schools’ rooftop. Energy Convers. Manag. 95, 110–119. doi:10.1016/j.enconman.2015.02.039
Alabduljabbar, A. M., Alsubaie, A., Al-Hsaien, S., and Elshurafa, M. (2019). Solar PV on mosquerooftops: Results from a pilot study in Saudi Arabia. J. Build. Eng. 25, 100809–100811. doi:10.1016/j.jobe.2019.100809
AlAli, M., and Emziane, M., (2013). Performance analysis of rooftop PV systems in Abu Dhabi”, Energy Procedia, 42, 689–697. doi:10.1016/j.egypro.2013.11.071
Alayam (2019). Installing solar PV for 3 houses in Bahrain. Available at: http://www.alayam.com/alayam/first/719623/News.html.
Albadi, H. A., Al-Busaidi, A. H., Chaichan, M. T., Kazem, H. A., and Al-Waeli, M. H. (2017). Technoeconomic feasibility analysis of 1 MW photovoltaic grid connected system in Oman”. Case Stud. Therm. Eng. 10, 131–141. doi:10.1016/j.csite.2017.05.008
Albuflasa, H. M., Alnaser, N. W., and Alnaser, W. E. (2022). The transition in solar and wind energy usein Gulf Cooperation Council countries (GCCC). Renew. Energy Environ. Sustain. 7, 4. doi:10.1051/rees/2021034
Alharb, F. R., and Csala, D. (2021). Gulf Cooperation Council countries’ climate change mitigation challenges and exploration of solar and wind energy resource potential. Appl. Sci. 11 (6), 2648. doi:10.3390/app11062648Available at: https://www.mdpi.com/2076-3417/11/6/2648
Ali, A., Ali, A., Abdullah, D. Z., Ali, S., Jebran, K., and Shah, T. (2017). Acceptance and willingness to pay for solar home system: Survey evidence from northern area of Pakistan. Energy Rep. 3, 54–60.
Alnaser, N. W., Al Othman, A. A., Al Othman, M. J., Al Shawaikh, H., Alnaser, W. E., Batarseh, I., et al. (2018). Comparison between performance of man-made and naturally cleaned PV panels in a middle of a desert. Renew. Sustain. Energy Rev. 82, 1048–1055. doi:10.1016/j.rser.2017.09.058
Alnaser, N. W., Al Othman, M. J., Alnaser, W. E., Batarseh, I., Dakhel, A. A., Lee, J. K., et al. (2015). Dust accumulation study on the Bapco 0.5 MWp PV project at University of Bahrain. Int. J. Power Renew. Energy Syst. 2, 39–54. doi:10.13140/RG.2.2.14181.35049
Alnaser, N. W., and Alnaser, W. E. (2019). Analyzing the Impact of Bapco 5MW solar PV grid–connected project on Bahrain’s outlook for energy – mix production. Int. J. Mod. Nonlinear Theory Appl. 8 (3), 72–91. doi:10.4236/ijmnta.2019.83006
Alnaser, N. W., Alnaser, W. E., and Batarseh, I. (2014). Bahrain’s Bapco 5MW PV grid–connected solar project. Int. J. Power Renew. Energy Syst. 1, 72–84. doi:10.4236/ijmnta.2019.83006
Alnaser, N. W., and Alnaser, W. E. (2017). Modelling the yield of 8.64 kW PV panels installed on a rooftop of a building in the Kingdom of Bahrain. Smart Sustain. Built Environ. 11 (1), 162–174. doi:10.1108/SASBE-05-2020-0060
Alnaser, N. W. (2015). Building integrated renewable energy to achieve zero emission in Bahrain. J. Energy Build. 93, 9332–9339. doi:10.1016/j.enbuild.2015.01.022
Alnaser, N. W. (2017). First smart 8.64 kW BIPV in a building in Awali town at kingdom of Bahrain. Renew. Sustain. Energy Rev. 82, 205–214. doi:10.1016/j.rser.2017.09.041
Alnaser, W. E. (1997). Solar ultra-violet radiation changes in Bahrain. Appl. Energy 57, 25–35. doi:10.1016/S0306-2619(96)00023-2
Alsabbagh, M., and Alnaser, W. (2022). “Transitioning to carbon neutrality in Bahrain: A policy brief,” in Arab Gulf journal of scientific research (Bingley: Emerald Group Publishing). Available at: https://www.emerald.com/insight/publication/issn/1985-9899.
Alsabbagh, M. M. (2019). Public perception toward residential solar panels in Bahrain. Energy Rep. 5, 253–261. doi:10.1016/j.egyr.2019.02.002
Bajpai, U., and Yadav, S. K. (2018). Performance evaluation of a rooftop solar photovoltaic power plant in Northern India. Perform. Eval. a rooftop Sol. Photovolt. power plant North. India, Energy Sustain. Dev. 43, 130–138. doi:10.1016/j.esd.2018.01.006
Barakat, N. (2019). Tatweer Petroleum 3MW solar power plant becomes operational, 24/7 news. Available at: https://www.twentyfoursevennews.com/2019/11/tatweer-petroleum-3mw-solar-power-plant-becomes-operational/(Accessed on July 19, 2022).
BEIS (2018). Government GHG conversion factors for company reporting: Methodology paper for emission factors: Final report. Available at: https://www.gov.uk/government/uploads/system/uploads/attachment_data/file/726911/2018_methodology_paper_FINAL_v01-00.pdf (Accessed on July 19, 2022).
Bošnjakovi´c, M., Zlatuni´c, B., and Ciki´c, A. (2021). Cost-benefit analysis of small-scale rooftop PV systems: The case of dragotin, Croatia. Appl. Sci. 11 (19), 119318. doi:10.3390/app11199318
EIA (2022). Independent Statistics and Analysis, U.S. Energy Information Administration How much carbon dioxide is produced per kWh of U.S. electricity generation? Available at: https://www.eia.gov/tools/faqs/faq.php?id=74&t=11#:∼:text=In%202020%2C%20total%20U.S.%20electricity,CO2%20emissions%20per%20kWh (Accessed on July 27, 2022).
Elmenreich, W., Kazem, H. A., Khatib, T., and Sopian, K. (2014). Performance and feasibility assessment of a 1.4kW roof top grid-connected photovoltaic power system under desertic weather conditions. Energy Build. 82, 123–129. doi:10.1016/j.enbuild.2014.06.048
Gulkowski, S. (2022). Specific yield analysis of the rooftop PV systems located in south-eastern Poland. Energies 15 (10), 3666. doi:10.3390/en15103666
Hoseinzadeh, S., Nastasi, B., and GroppiGarcia, D. D. A. (2022). Exploring the penetration of renewable energy at increasing the boundaries of the urban energy system – the PRISMI plus toolkit application to Monachil, Spain. Sustain. Energy Technol. Assessments 54, 102908. doi:10.1016/j.seta.2022.102908
Hoseinzadeh, S., and Garcia, D. A. (2021). Numerical analysis of thermal, fluid, and electrical performance of a photovoltaic thermal collector at new micro-channels geometry. ASME. J. Energy Resour. Technol. 144 (6), 062105. doi:10.1115/1.4052672
Hoseinzadeh, S., Groppi, D., Sferra, A. S., Di Matteo, U., and Astiaso Garcia, D. (2022). The PRISMI plus toolkit application to a grid-connected mediterranean island. Energies 15, 8652. doi:10.3390/en15228652
HoseinzadehZakeriShirkhani, S. M. H. A., and Chamkha, A. J. (2019). Analysis of energy consumption improvements of a zero-energy building in a humid mountainous area. J. Renew. Sustain. Energy 11, 015103. doi:10.1063/1.5046512
Kim, J. (2022). Renewable energy business introduction, scientific research day program. Kingdom of Bahrain: College of Graduate Studies CGS, Arabian Gulf University. Available at: https://www.agu.edu.bh/en/Events/PublishingImages/Pages/CGSRESEARCHDAY2022/CGS%20Research%20Day%202022.pdf (Accessed on July 19, 2022).
Lewis, M. (2022). Here’s how Americans feel about rooftop solar and how it affects their house values. Electrek Available at: https://electrek.co/2022/05/12/heres-how-americans-feel-about-rooftop-solar-and-how-it-affects-their-house-values/(Accessed on July 28, 2022).
Maisch, M. (2022). Bahrain launches tender for 72 MW of solar. Available at: https://www.pv-magazine.com/2022/08/19/bahrain-launches-tender-for-72-mw-of-solar/(Accessed on August 20, 2022).
RCREEE (2016). Arab future energy index: 2016 - renewable energy. [cited 2018 14 October]. Available from: http://www.rcreee.org/content/arab-future-energyindex%E2%84%A2-afex-2016-renewable-energy.
Som, A. K. (1992). Solar UV-B radiation measurement over Bahrain. Renew. Energy 2, 93–98. doi:10.1016/0960-1481(92)90065-B
Trade Arabia (2016). Tatweer launches 3 projects including solar power plant. Available at: http://www.tradearabia.com/news/OGN_300970.html (Accessed on July 19, 2022).
Traditionoven (2022). Energy units conversion. Available at: https://www.traditionaloven.com/tutorials/energy/convert-kilo-watt-hr-kwh-to-cubic-foot-natural-gas.html (Accessed on July 19, 2022).
Tribune, D. (2022). Bahrain has total 274733 buildings. Available at: https://www.newsofbahrain.com/bahrain/73728.html#:∼:text=The%20total%20number%20of%20buildings,houses%20and%207%2C540%20traditional%20homes (Accessed July 30, 2022).
Youtube (2022). Minutes 2 energy. Available at: https://www.youtube.com/watch?v=-YIcTkTg0-U (Accessed July 26, 2022).
Keywords: domestic building, rooftop PV installation, retrofitting built environment, solar electricity, CO2 emission
Citation: Alnaser NW (2023) A domestic rooftop PV system: a step towards retrofitting the built environment to combat climate change in Bahrain. Front. Built Environ. 9:1178512. doi: 10.3389/fbuil.2023.1178512
Received: 02 March 2023; Accepted: 02 May 2023;
Published: 05 June 2023.
Edited by:
Ayman Mahmoud, Cairo University, EgyptReviewed by:
Siamak Hoseinzadeh, Sapienza University of Rome, ItalyAndrea Frattolillo, University of Cagliari, Italy
Copyright © 2023 Alnaser. This is an open-access article distributed under the terms of the Creative Commons Attribution License (CC BY). The use, distribution or reproduction in other forums is permitted, provided the original author(s) and the copyright owner(s) are credited and that the original publication in this journal is cited, in accordance with accepted academic practice. No use, distribution or reproduction is permitted which does not comply with these terms.
*Correspondence: Naser W. Alnaser, bmFsbmFzZXJAdW9iLmVkdS5iaA==
 Naser W. Alnaser