 Raghdah Al-Chalabi
 Ahmed Elshaer*
- Department of Civil Engineering, Lakehead University, Thunder Bay, ON, Canada
During strong wind events, building roofs are subjected to high wind uplift forces (suctions), which often lead to severe roofing component damage, or even roof total failure, flying debris, and water intrusion, hence, interior damages. Typical roof shapes (e.g., gable and hip) are generally designed using provision codes and standards to accurately estimate peak load impacting the roofs during wind events for design purposes. Complex roof geometry can be efficiently examined using wind tunnel testing and computational modeling to provide quantitative assessment for wind to narrow down the design alternatives and to examine the improvement gained from mitigation techniques. In this study, an isolated low-rise building with a complex roof shape is examined using large eddy simulation (LES) to numerically assess wind load prediction by validating it with wind tunnel results. This study presents two roof modification scenarios using parapets added to roof corners and ridgelines to displace the flow from the separation locations to reduce the wind impact on the roof. The current study aims to 1) evaluate wind load on an isolated low-rise building with complex roof geometry for various angles of attack and 2) mitigate the roof aerodynamically using parapets, added corners, and ridgeline to reduce the wind impact on the roof. The validation shows that both the mean and RMS of the pressure coefficients are in good agreement with the wind tunnel results. The research results suggest that parapets with 500 mm height located at the corner and edges of complex roof geometry can effectively reduce extreme corner suction by 29% and roof uplift by 5.6%.
1 Introduction
It is crucial to perceive wind hazards in the design of low-rise buildings to improve their structural resiliency over time. The majority of structures built in Canada are categorized as low-rise buildings used mainly for residential and commercial purposes. In fact, according to Census Canada in 2016, the overall housing stock was classified as single detached houses, with more than
Wind-induced damages for roofs are typically initiated due to the high suction regions caused by flow separations at edges and corners, leading to the development of conical and separation bubbles vortices, which are demonstrated in Figure 1A. The extreme suction initiated by the vortices can lead to cladding or total roof failure (Lin et al., 1995). Any breach of the building envelope, in addition to causing water intrusion and interior damage, can alter the aerodynamics of the building by adversely affecting the internal pressure that increases wind forces on roofs, doors, and windows (Bitsuamlak et al., 2013; Elshaer et al., 2019).
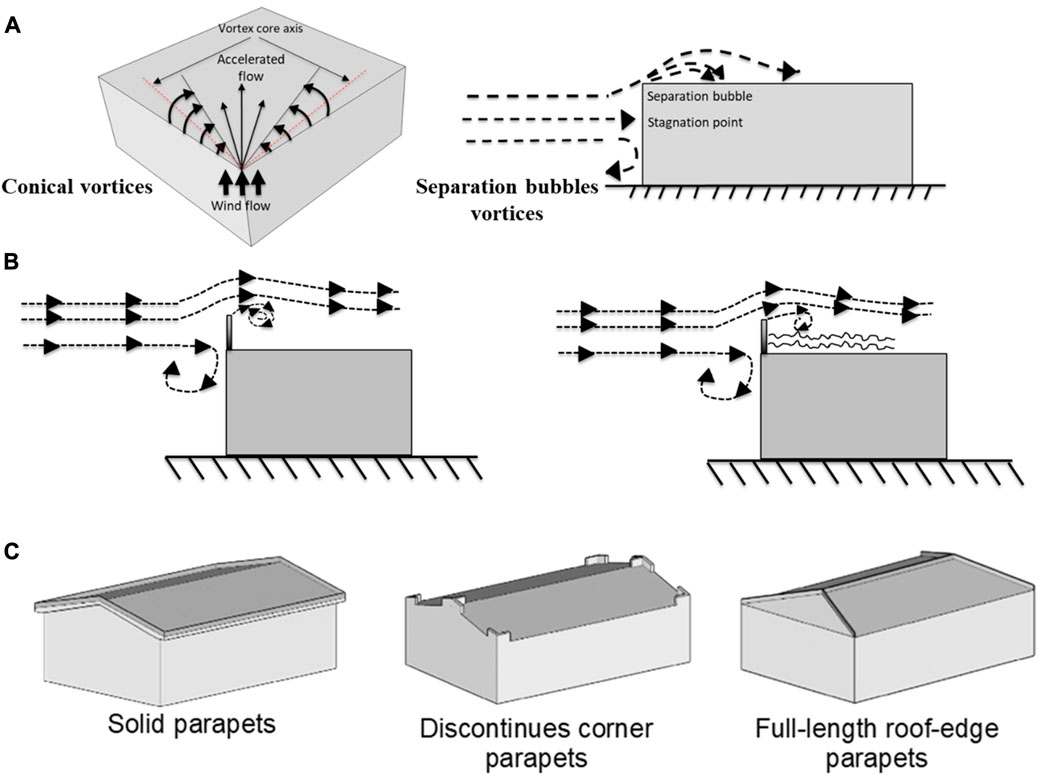
FIGURE 1. (A) The formation of conical vortices and separation bubbles over building roofs, (B) the parapet’s mechanism of working over a flat roof using solid and porous parapets, and (C) various aerodynamic modification techniques on the roof.
Many studies have investigated modifying the roof shape by utilizing roof mitigation techniques that can change the roof flow pattern, reduce wind loads, and, consequently, decrease the damage risk to low-rise buildings. These modification techniques, such as pergolas and parapets, can be installed on edges and corners and used as permanent architectural features or for rehabilitation purposes. Parapets were commonly used with flat-roof versions of the early Mediterranean revival-style homes (Bitsuamlak et al., 2013). The parapets installed at the roof edges and corners aim to change the wind flow pattern on the roof by disrupting the formation of corner vortices or diverting the flows in the separation zone, as demonstrated in Figure 1B. They are often mounted on the edge and corner areas, as shown in Figure 1C, where their height and orientation are crucial factors impacting their efficiency (Stathopoulos et al., 1990; Mans et al., 2005; Al-Chalabi et al., 2022).
Introducing aerodynamic mitigation techniques for roofs of low-rise buildings can bring answers in the area of wind-induced hazards, where the wind load can be lowered or mitigated instead of strengthening the structure to sustain a higher wind impact. Many previous studies investigated the efficiency of modifying the roof corners or edges by adding various aerodynamic modifications to reduce the severity of vortex-induced uplift initiated on the roof of low-rise buildings (Baskaran and Stathopoulos, 1988; Surry and Lin, 1995; Pindado and Meseguer, 2003; Kopp et al., 2005a; Suaris and Irwin, 2010; Bitsuamlak et al., 2013; Aly and Bresowar, 2016; Azzi et al., 2020). A summary of previous studies’ scope and main findings is provided in Table 1. Based on the findings of previous studies, it was found that the modification techniques can effectively reduce the magnitude of wind load on various components, subsequently reducing the wind-induced risk of damage to roofs of low-rise buildings and the building cost. Furthermore, some previous studies have adopted the concept of linking the mitigation techniques to an optimization algorithm to find the optimal configuration of the mitigation techniques in terms of reducing wind load (Bobby et al., 2014; Bernardini et al., 2015; Elshaer et al., 2017; Elshaer et al., 2018).
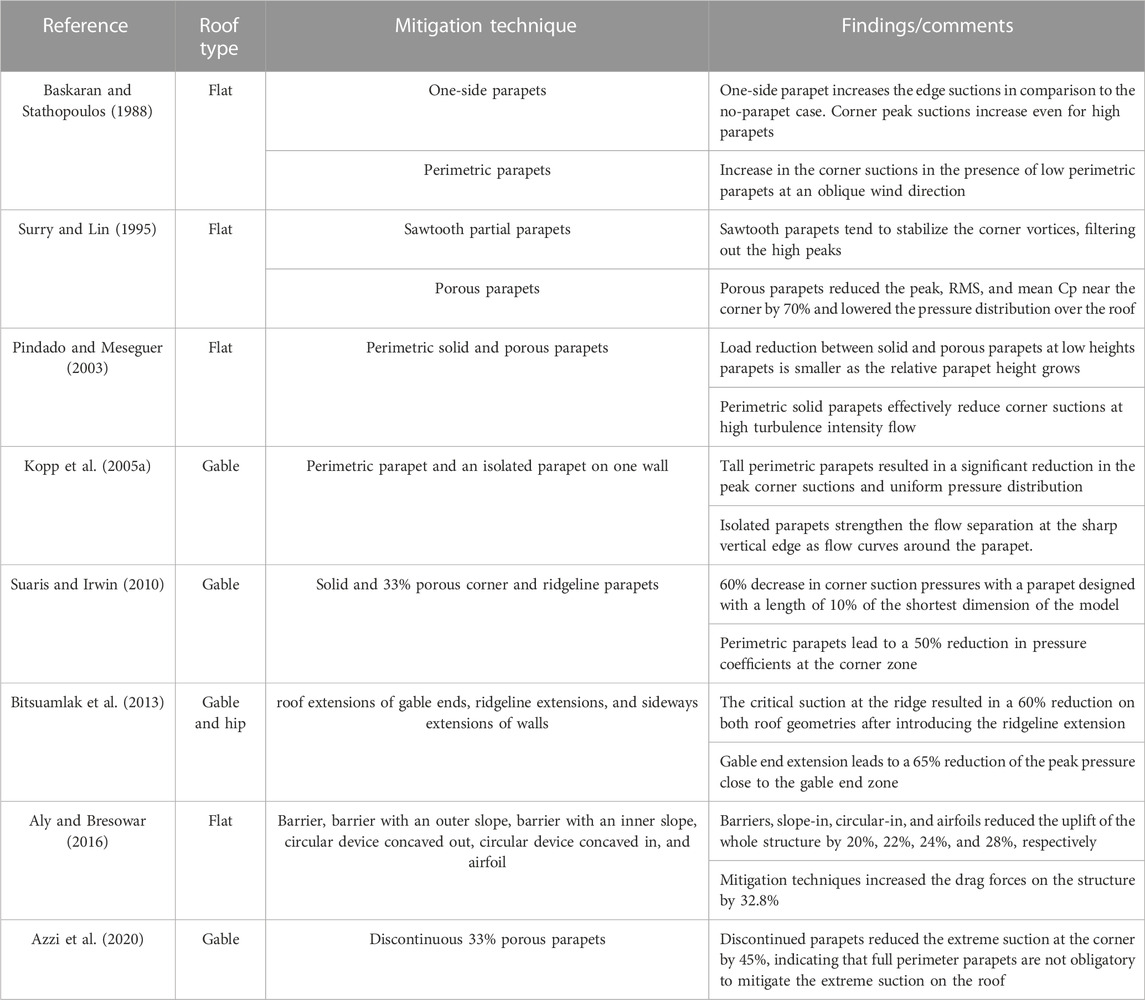
TABLE 1. Scope and the main findings of previous studies focused on building aerodynamic mitigation.
Studying wind load on parapets is crucial since these loads must be included in the design of the main wind force-resisting systems of buildings, in addition to being essential for the design of parapets themselves, including their connection to the roof surface. Parapet failures caused by strong wind forces can become sources of flying debris that can damage other buildings. Wind standards and codes provide very little guidance regarding quantifying the wind load on parapets. It is worth mentioning that the ASCE-7 (2005) standards estimate the wind loads on parapets conservatively based on the net pressure coefficients on both windward and leeward parapet surfaces.
While the impact of parapets on the uplift forces for typical roof geometry (i.e., gable or hip) has been the topic of numerous experimental and numerical studies, the effect of parapets on complex roof structures has remained largely less examined. Therefore, there is a need to investigate the impact of discontinuous corner and ridgeline parapets on stand-alone low-rise buildings with complex roof geometry located in suburban terrain in reducing wind load by displacing the flow separation zones from the corners and edges. Parapets located at the corners and edges can lead to an increase in the load on interior roof zones, thus influencing the overall effectiveness of parapets as a mitigation technique. Therefore, this study will evaluate wind load on the interior roof zones as the parapets may increase the load on these locations, as previously stated and found by Sarkar et al. (2001). As mentioned earlier, there is also a need to study the loads generated on the added parapets to prevent them from becoming a source of flying debris injuring life, and damaging surrounding structures.
This paper is divided into four sections. Section 1 (the current section) presents an introduction that includes a review of the related literature examining the impact of adding aerodynamic modifications to the roof perimeter and interior zones, in addition to elaborating on the existing gap in studying complex roof geometries and wind-induced forces on parapets. Section 2 presents the methodology of validating the CFD model with the experimental results along with describing the adopted mitigation techniques and extreme value analysis adopted in the study. Section 3 discloses this study’s main findings in terms of the effectiveness of corner and edge parapets in reducing wind load on the complex roof geometry, including an assessment of the wind load generated by the mitigation techniques themselves. Finally, Section 4 will conclude the main findings of adding parapets in reducing both extreme corners and edges suction pressure and forces acting on the roof surfaces without substantially increasing the loads on the roof’s internal zones while producing minimum wind load on the mitigation techniques.
2 Methodology framework
Since this study aims at investigating the effectiveness of adding aerodynamic mitigations (i.e., parapets) to a complex roof of a low-rise building to minimize the wind-induced loads and pressures, the aerodynamic performances of a non-modified model will be compared to two configurations of modifications (i.e., Config-1 and Config-2), which will be described in Section 2.1. The modified configurations are designed by adding corner and ridgeline parapets to the original roof configuration to displace the high local edge suctions over a much larger area, hence, lowering the pressure magnitudes at these locations. The original non-modified model has a complex roof geometry with varieties of roof slopes and a chimney, occupying a total footprint of
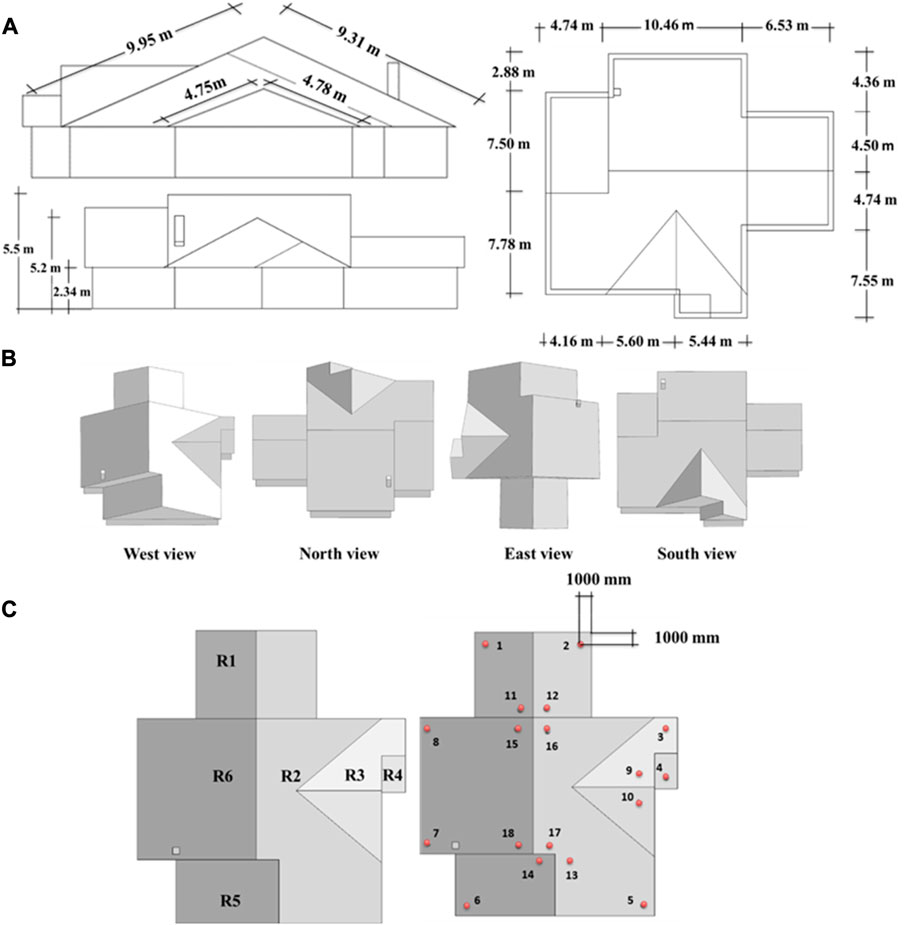
FIGURE 2. Original building geometry used in this study (A) dimensions, (B) 3D view layout, and (C) pressure probe locations and roof surfaces.
This study starts with a validation step to ensure the accuracy of the adopted Large Eddy Simulation (LES) used in evaluating wind load for a complex roof of a low-rise building by comparing the extracted data with wind tunnel test data from the literature. Once the model is validated, the same LES details and assignments will be used to examine the modified models. Mitigation techniques (i.e., parapets) will then be added to the non-modified roof in two scenarios, namely, “Config-1” and “Config-2,” as will be explained in the following (Section 2.1). To count for the wind directionality, evaluating the peak wind loads and pressures on the roof surface will require repeating the previous procedure for eight wind angles of attack ranging from 0° to 315° with an increment of 45°. The wind load on the roof surfaces is evaluated by dividing the complex geometry’s roof surface into six surfaces, namely, R1, R2, R3, R4, R5, and R6, as shown in Figure 2C. In addition, corner probes (i.e., tabs) are added to the roof corners to extract pressure time histories for the peripheral and interior corners of the roof. The pressure probes are located within the expected flow separation zones, as shown in Figure 2C. The wind load on the building is evaluated by extracting the time histories of the wind loads and pressure coefficients in x, y, and z directions from corner probes for both Config-1 and Config-2. The critical values of the mean pressure that can govern the design of the aerodynamically modified complex roof geometry are extracted after comparing eight wind angles of attack for all probes. The extreme statistical values of the pressure and wind load for a design return period of 50 years are evaluated using the Gumbel approach to conduct a fully probabilistic assessment of wind loads for the critical wind angle of attack. The Extreme value analysis gives suitable predictions within the range of the data and extrapolates to risks of exceedance beyond (Gumbel, 1961). Details of the extreme value analysis approach will be explained in Section 2.3, where the critical values of the mean pressure are extracted from all the peripheral and interior probes.
The proposed procedure is concluded by conducting a comparative study between the original roof configuration and the modified roof configurations (i.e., Config-1 and Config-2) in terms of wind-load induced to examine the effectiveness of adding the parapets to complex roof geometry in reducing the suction-acting on the roof surfaces and corners. Figure 3 summarizes the framework proposed in the study.

FIGURE 3. Framework of the aerodynamic mitigation technique for complex roof geometry.
2.1 Aerodynamic mitigation techniques
This subsection introduces the layout and dimensions for the original building configuration and the modified roof configurations. The current study is carried out using a parapet height of 500 mm installed on the roof at corners (for Config-1) and at both edges and corners (for Config-2). The parapet dimensions are chosen to be of low height and smaller length to ensure cost-effectiveness, ease of installation, and architectural aesthetics to the retrofitted building while lowering the wind forces initiated on the parapets. The first roof modification (Config-1) is developed by adding parapets at the peripheral corners of the complex roof geometry with a height of 500 mm, a width of 160 mm, and a length of 1,000 mm on each side, as shown in Figure 4A. The aerodynamic improvement intended from the placement of corner parapets is to displace the conical vortices, reducing the suction at these damage-prone locations (Kopp et al., 2005a; Bitsuamlak et al., 2013; Aly and Bresowar, 2016). The second roof modification (Config-2) is carried out by employing the same eight corner parapets as Config-1 while adding additional parapets along the ridgeline to avoid the creation of high negative pressure zones at the interior surfaces of the roof, as illustrated in Figure 4B.
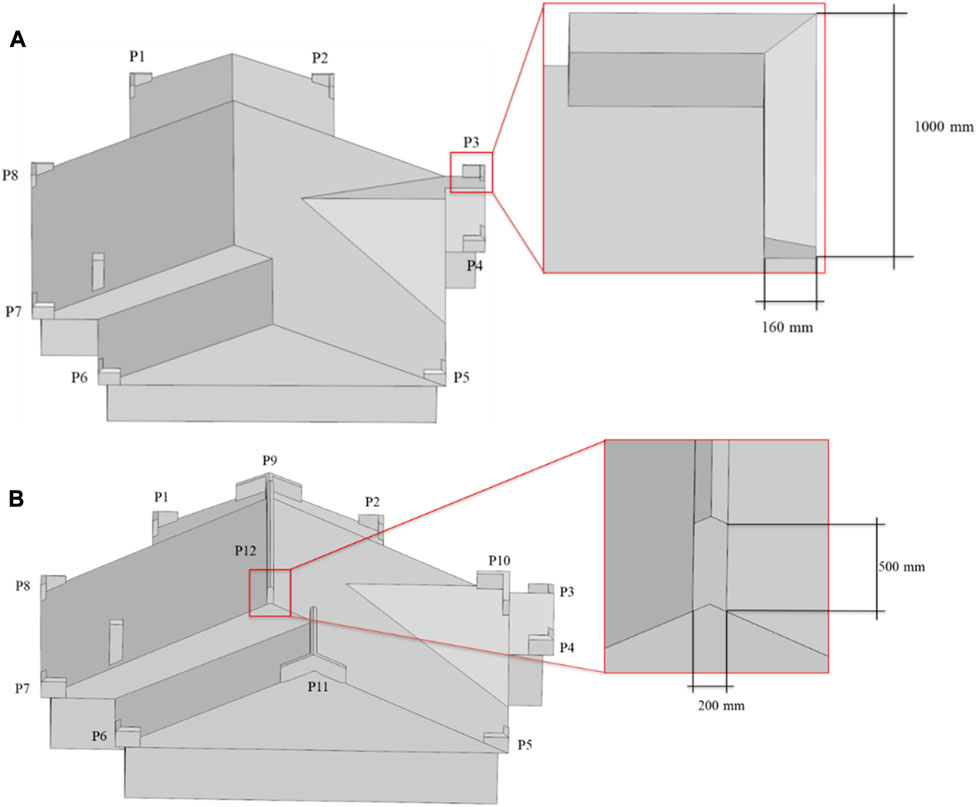
FIGURE 4. (A) Location and dimensions of the parapets used in Config-1, and (B) location and dimensions of the parapets used in Config-2.
2.2 Model validation
This subsection will present the validation process and results for the numerical model adopted in this study. The adopted CFD model, presented in Figure 5, is validated by comparing the mean and RMS of pressure coefficient values for the taps located at the roof of the east end of the building geometry to the experimentally obtained data presented by (Kopp and Gavanski, 2010). The mean velocity profile obtained from the wind tunnel experimental test compared well with the inlet velocity profile corresponding to suburban terrain roughness,
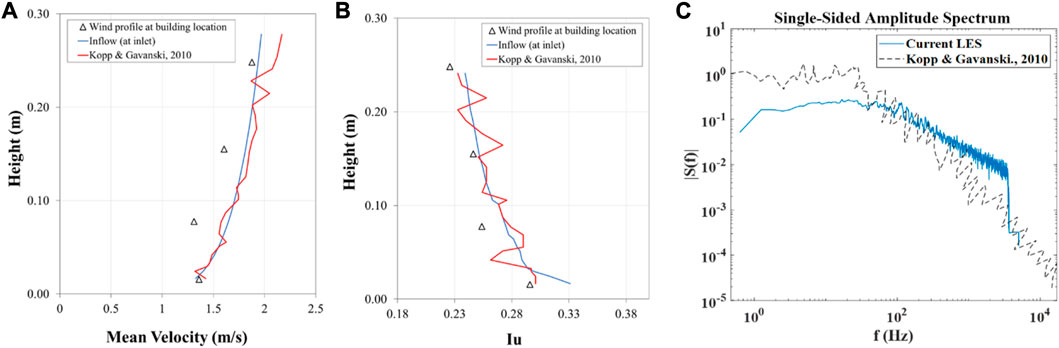
FIGURE 5. (A) Mean velocity profile and (B) turbulence intensity profile, and (C) longitudinal spectra at the roof reference height.
Similar to the wind tunnel testing, the CFD is modeled at a scale of 1:50, where the utilized reference wind velocity (
The computational domain dimensions and boundary conditions are shown in Figure 6A. As observed, the computational domain size satisfied the minimum values set by (Franke et al., 2011). The boundary conditions at the top and side surfaces of the computational study domain are set as symmetry plane boundary conditions. The ground and building surfaces are defined as a non-slip wall boundary condition, while the outlet surface is defined as an outflow. The inlet wall was defined as a time-varying inlet velocity boundary condition using the CDRFG technique described by (Aboshosha et al., 2015) and adopted by (Elshaer et al., 2017). Since the building is located within a rough terrain, accurately modeling the turbulence impacting the model is crucial. Therefore, turbulence’s effects on the wind flow will be initiated using turbulence modeling methods, namely, Large Eddy Simulation (LES). LES is a reliable and applicable than other turbulence modeling methods (Mansouri et al., 2022).
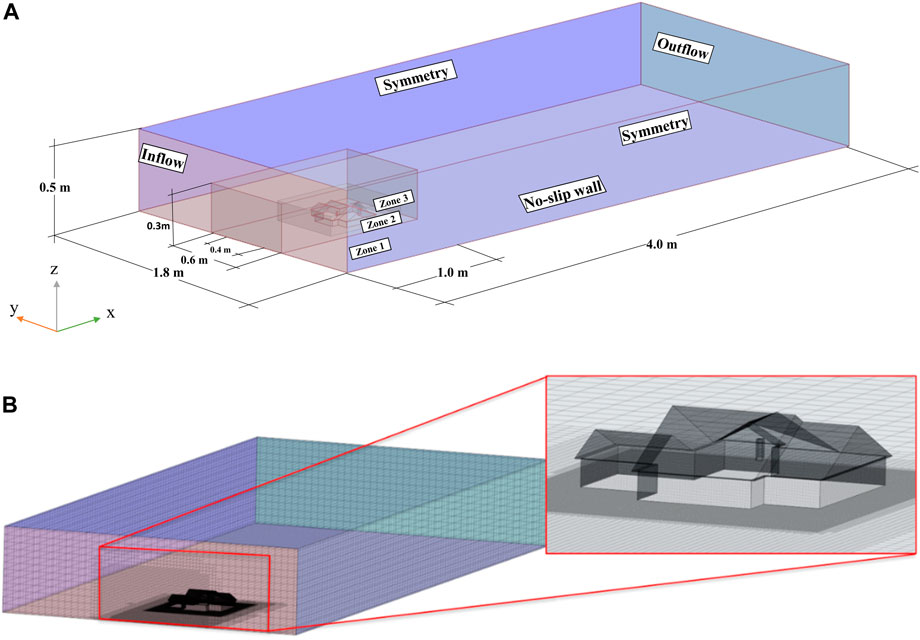
FIGURE 6. (A) Computational domain dimensions (in model-scale) and boundary conditions, and (B) mesh grid resolution utilized in the CFD simulations.
A mesh sensitivity analysis is conducted by examining the impact of the mesh refinements zones on the mean and RMS of the pressure across a gable roof model. The results are then compared to experimental data presented by (Ho et al., 2005) where the discrepancies are evaluated by using the RMSE. The mesh refinement zones ranged from coarse, medium, and fine which yielded 1, 2.1, and 3 million mesh cells, respectively. Overall, when compared to the experimental testing, the pressure parameters (i.e., mean and RMS of pressure), presented in Table 2, show consistent numerical results with a maximum of 4.5% discrepancy recorded for RMS readings of the pressure when a medium-mesh size is adopted compared to 3.3% for the fine meshing scheme. The coarse mesh scheme recorded a discrepancy of 8% in RMS of pressure compared to the experimental results. Therefore, all the numerical simulations of CFD models were performed by adopting the medium mesh scheme.
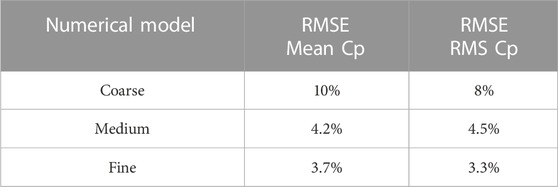
TABLE 2. Results of the mesh sensitivity analysis using three mesh size schemes.
The adopted computational domain was discretized to a hexahedral ranging from
The validation was performed on the study model corresponding to a wind angle of attack of
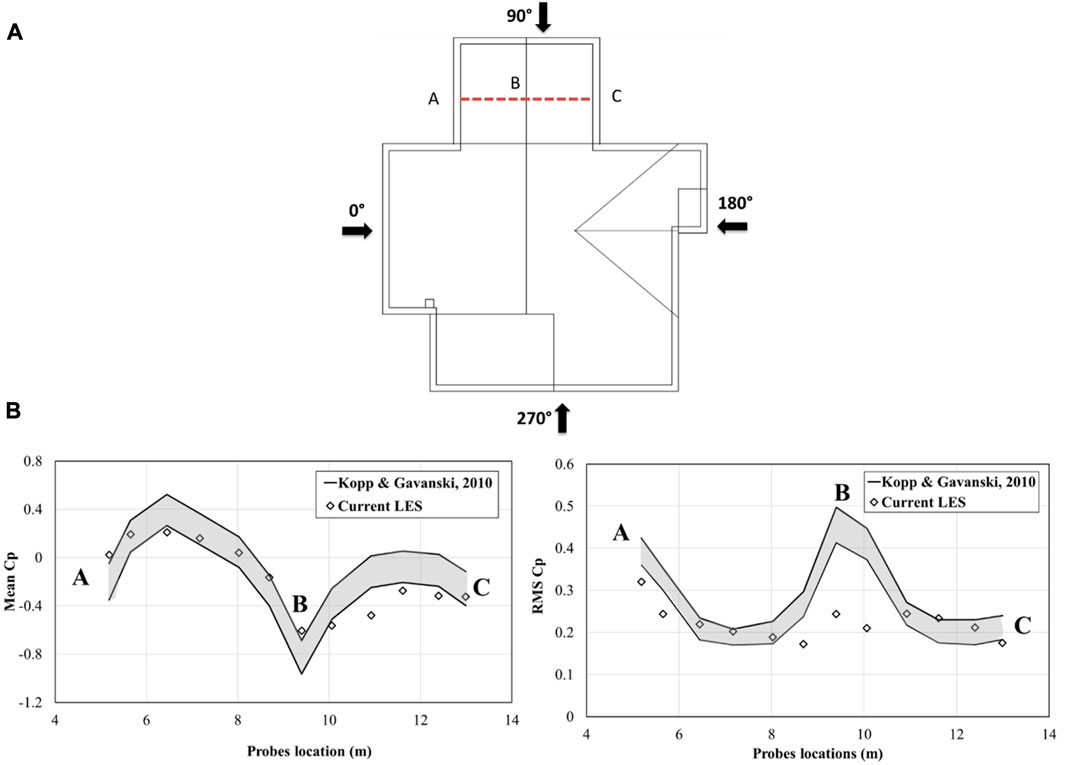
FIGURE 7. (A) Locations of the pressure taps on the east side used for validation, and (B) mean and RMS of the pressure coefficient at a wind angle of attack of 130°.
2.3 Method for determining the extreme values
This subsection will briefly explain the extreme value analysis (EVA) followed in this study to obtain the extreme statistical values for wind load and pressure acting on the roof. To ensure the safety and reliability of designed structures, accurate estimation of the extreme values of externally applied load effects attributable to the wind is vital (Holmes and Moriarty, 1999). In principle, this study employs EVA analysis using the Gumbel approach to evaluate extreme values for wind forces and pressure (Gumbel, 1961). A sample of time history for turbulence can be divided into subintervals of sufficient duration that peak values occurring can be treated as independent events. In this study, a total of 4,200 data points are divided into 22 segments, each of 190 data points. For each segment, the peak value is selected to be used to perform extreme value analysis using the Gumbel method. The following analysis is applied throughout this study to find the extreme values of the pressure and forces (Gumbel, 1961). In turbulence simulation, we can estimate the probability that the peak pressure coefficient will not exceed the value
m is the order, and N is the total number of values.
Then the plotted parameter was transformed into a reduced variate by
3 Results and discussion
This section studies the effectiveness of adding corner and ridgeline parapets to reduce the wind load on roof surfaces. The study compares the mean and extreme pressure values between the original roof configuration and both modified roof configurations. The wind load assessment applies to 18 probs locations situated on both peripheral and internal corners, edges, and six roof surfaces (Section 3.1 and Section 3.2). Furthermore, this study presents a wind load evaluation on the parapets (Section 3.3) as a step to prevent these mitigation techniques from dislodging and becoming flying hazard debris to the surrounding.
3.1 Wind-induced pressure on corners and edges
A total of 18 probes located on the roof are examined in this section to investigate the impact of the mitigation technique on extreme pressure for probes located at the corners/ridges for non-modified and modified roof configurations. The probe’s locations are selected as they are the most prone locations for roof damage to initiate during a windstorm. To demonstrate the impact of the parapets without the consideration of various wind angles of attack, the oblique wind angle of attack of

FIGURE 8. (A) Mean, and (B) RMS, of the pressure coefficient for the wind angle of attack of 135° for the non-modified and modified building configurations.
In addition to reducing the negative pressure (suction) at the leading corners and edges of the building, parapets are also found to cause significant positive or downward pressures. These observations are found along the leading roof surfaces and interior zones. The latter observation is believed to act as a stabilizing force on the roof; however, it may also be governing when combined with other gravity loads (e.g., snow load and dead load) (Kopp et al., 2005a). Furthermore, in the wake zones of the ridgeline parapets, it is found that 500 mm height increases the intensity of pressure in the cornering wind direction. The latter finding may probably be due to the interaction between the small vortices of the wake of the parapet and the conical vortex of high-intensity core occurring at the flow separation along the roof edge, which was previously noted by (Baskaran and Stathopoulos, 1988). To reduce the aggravated pressure, increasing the height of the parapets may be required, as was recommended by previous studies (Baskaran and Stathopoulos, 1988; Kopp et al., 2005b).
Additionally, it was observed that pressure coefficients measured on the interior zones for Config-1 are similar to those estimated on roofs without modifications. The latter indicates that a modified roof with peripheral corner parapets may not significantly mitigate suction at the interior zones. This was also concluded by (Lin et al., 1995). The latter finding supported the idea of adding ridgelines for the Config-2 roof design. The extreme pressure values recorded for the three models in this study are displayed in Figure 9A. It is found that the extreme values of the suction are decreased when compared to the values evaluated at the corners of the non-modified roof configuration. The reduction reached a maximum of
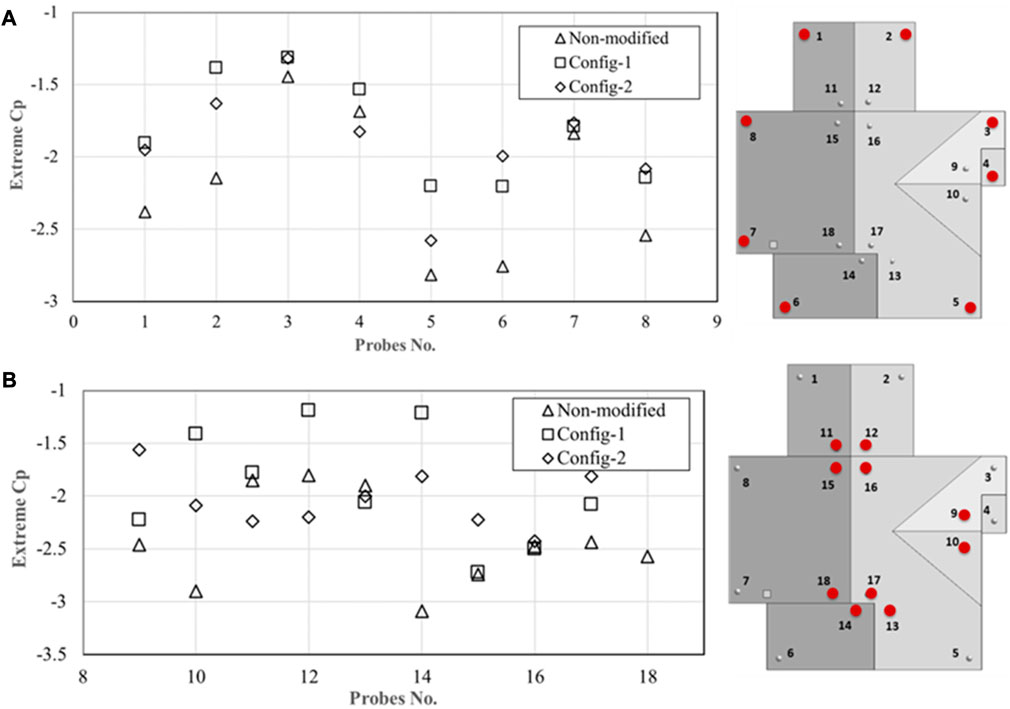
FIGURE 9. Extreme pressure coefficient values extracted from probes located at the (A) peripheral corners, and (B) interior corner.
To further investigate the effect of adding parapets on the pressure of interior zones within the complex roof configuration, Figure 9B displays the extreme pressure readings for ten probs at the corners of the internal roof zones. The values of the intense pressure coefficients extracted from probs
Figure 10 displays the mean and RMS of the critical pressure coefficient values extracted from the probes investigated in this study. It can be observed that critical RMS of the pressure coefficients for the internal and peripheral corner probs are reduced by a maximum of
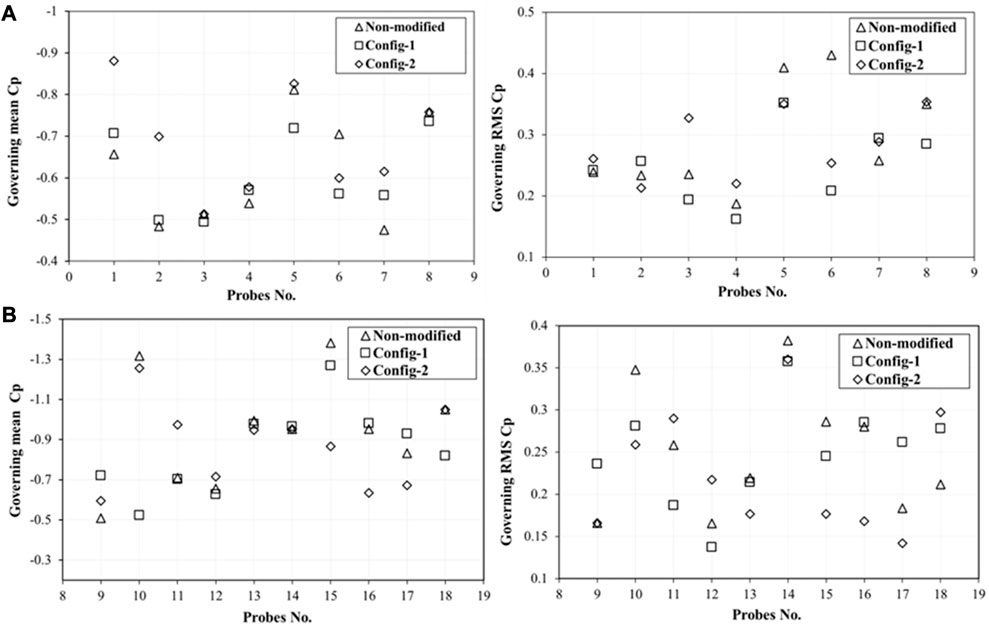
FIGURE 10. Critical mean and RMS of the pressure coefficient extracted from probes located at the (A) peripheral corners, and (B) interior corner.
3.2 Wind-induced forces on surfaces of the roof
As expected, the change in pressure distribution on roof surfaces has resulted in a consequence change in the uplift forces, which can also show the effectiveness of adding parapets on the studied complex roof. Figure 11 shows the normalized extreme uplift force of the entire roof surface at various wind angles of attack ranging from

FIGURE 11. Normalized roof uplift for non-modified and modified roof surfaces for wind angle of attack ranging from 0° to 315°.
As it can be noticed, oblique wind directions are the most critical (i.e., highest) and, therefore, will govern the design of the roof. In fact, the non-modified roof configuration at the wind angle of attack of

FIGURE 12. Time history for the roof surface (R2) uplift at a wind angle of 135° for modified roof configurations.
It is worth mentioning that the uplift wind forces on individual surfaces resulting from Config-2 have shown a decrease in magnitude, which is detailed in Figure 13. The maximum reduction of extreme wind pressure on the roof is found to be 11% on R1. However, it is noticed that roof surfaces R3 and R4 have a substantial increase in the wind uplift force when added the corner parapets at the only peripheral of the roof configuration (i.e., Config-1). This increase in the uplift is probably due to redirecting the flow by the added parapets, magnifying the separation bubble at these roof surfaces. The latter can initiate corner damage during a windstorm. However, adding a 500 mm ridgeline (in Config-2) is found to reduce the uplift forces by 5% compared to the original roof configuration on roof surface R4.
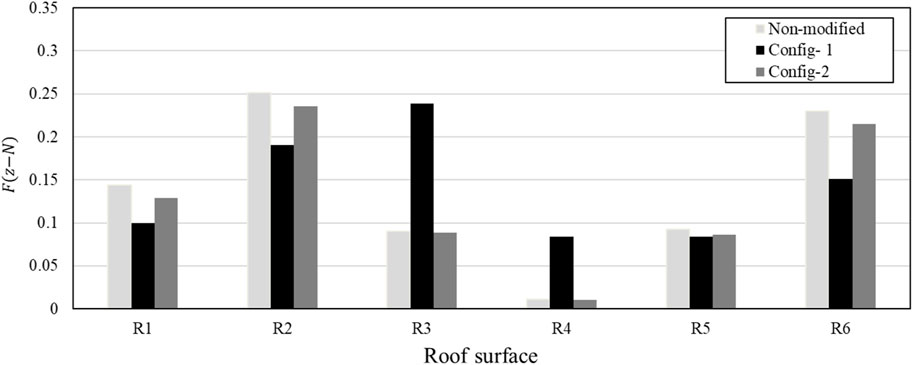
FIGURE 13. Normalized extreme roof uplift force on individual surfaces for Non-modified and modified roof configurations.
3.3 Wind loads on the parapets
Adding parapets to low-rise buildings can cause an additional risk resulting from attracting elevated wind forces on the roof surfaces. Accordingly, this sub-section evaluates the wind loads on parapets for the studied configurations to acquire a better understanding of the added damage risk from the implementation of parapets to avoid them becoming flying hazards to the surroundings (Aly and Bresowar, 2016). Since the parapets can alter the flow over the roof, evaluating the loads on parapet surfaces is crucial to be accounted for in designing the main wind force-resisting system (MWFRS) (Kopp et al., 2005a). Figure 14 shows an example of time histories for forces in the x, y, and z directions acting on parapet “P11,” subjected to an oblique wind angle of attack of
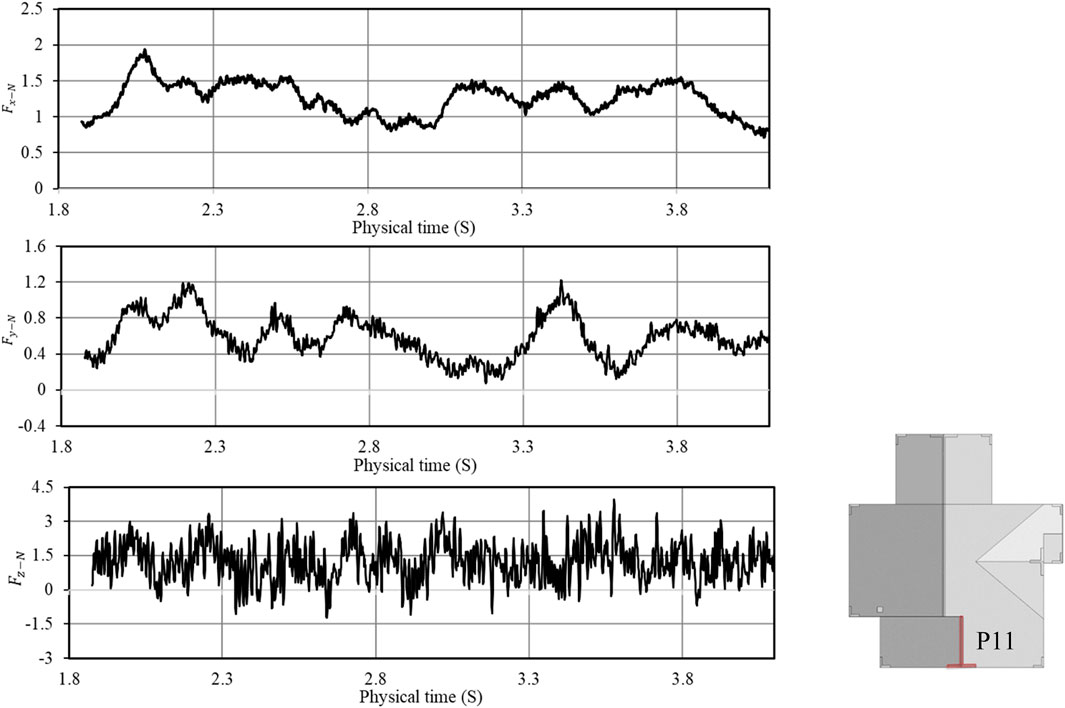
FIGURE 14. Forces acting on parapet “P11” at wind angle of attack 225°.
A comparison of the extreme along and uplift force impacting the parapets in both modified configurations is presented in Figure 15. The overall extreme uplift wind forces acting on the parapets located on the ridgeline are found to be higher than those of the along wind forces. In other words, the extreme uplift force reached a value of
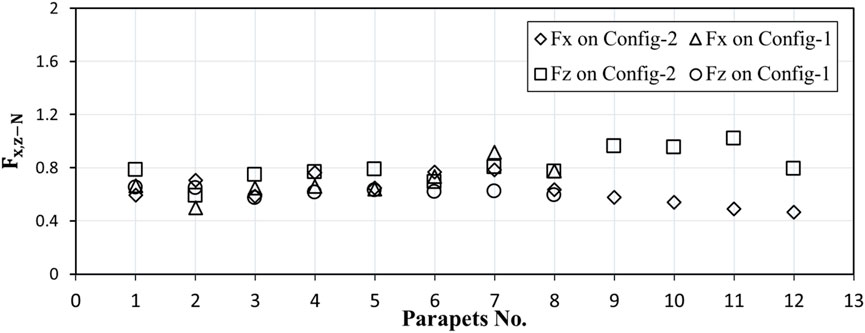
FIGURE 15. Normalized extreme forces impacting parapets for different configurations.
4 Conclusion
This study presents preliminary but promising results aiming at mitigating damages for low-rise buildings with complex roof geometry to enable them to withstand windstorms. The current study proposes aerodynamic mitigation techniques for a low-rise building with complex roof geometry. The procedure utilized Computational Fluid Dynamics (CFD) to examine the effectiveness of adding corner and ridgeline parapets. The mitigation techniques aim to reduce wind loads at corners, edges, and interior roof surfaces, by weakening the vortices responsible for initiating damages. In addition, the study investigated the wind load on the parapets to assess the optimal parapet configuration design. It is found that parapets located at the peripheral corners have reduced extreme suction by a maximum of 29% compared to the Non-modified roof design. Probes located on the interior roof corners showed a significant decrease in the pressure values when introducing parapets on the ridgeline (i.e., Config-2), reaching 53%. The latter indicates that adding ridgeline parapets is crucial to reducing wind load on the interior zone surfaces of the complex roof geometry. Furthermore, the extreme roof uplift is decreased by a maximum of 5.6% when adding ridgeline parapets compared to the Non-modified roof. It is also found that extreme uplift occurs for winds approaching the roof in an oblique wind direction to the parapet face. After examining both along and uplift forces impacting the parapets, it is concluded that uplift forces are the governing ones in the design, thus impacting the design of the parapet. The study showed that corner and ridgeline parapets can be utilized to enhance the roof aerodynamic performance successfully (i.e., reduce wind load) on complex roof geometry for both retrofitting and new construction purposes. These techniques can alleviate roof damage, which is considered one of the biggest concerns during windstorms.
It is worth mentioning that adding parapets to low-rise building roof pose a risk of its own if the parapets are insufficiently anchored to the roofing system. Hence, they can dislodge and become a source of flying hazard debris and hence impacts the neighboring building. Furthermore, insulations installed at the locations where the parapet walls meet with the roof can increase the risk of water leaks if they are breached. In addition, parapets may require a drainage system and regular maintenance throughout the seasons.
Data availability statement
The original contributions presented in the study are included in the article/supplementary material, further inquiries can be directed to the corresponding author.
Author contributions
RA-C and AE contributed to the conception and design of the study. RA-C performed the required numerical simulation and discussion of the results. RA-C prepared the first draft of the paper. RA-C and AE prepared the final version of the paper. AE provided supervision of the research project. RA-C and AE wrote sections of the manuscript. All authors contributed to the article and approved the submitted version.
Funding
This work was made possible through financial support from the Ontario Graduate Scholarship. The authors would like to thank the financial support from the National Science and Engineering Research Council of Canada (NSERC) (# RGPIN-2022-04755).
Acknowledgments
The authors would also like to acknowledge the Digital Research Alliance of Canada for providing access to their high-performance computation facility and Siemens Digital Industries Software for providing the numerical package.
Conflict of interest
The authors declare that the research was conducted in the absence of any commercial or financial relationships that could be construed as a potential conflict of interest.
Publisher’s note
All claims expressed in this article are solely those of the authors and do not necessarily represent those of their affiliated organizations, or those of the publisher, the editors and the reviewers. Any product that may be evaluated in this article, or claim that may be made by its manufacturer, is not guaranteed or endorsed by the publisher.
References
Aboshosha, H., Elshaer, A., Bitsuamlak, G. T., and El Damatty, A. (2015). Consistent inflow turbulence generator for LES evaluation of wind-induced responses for tall buildings. J. Wind Eng. Ind. Aerodyn. 142, 198–216. doi:10.1016/j.jweia.2015.04.004
Al-Chalabi, R., Ibrahim, M., and Elshaer, A. (2022). “Computational wind load evaluation and aerodynamic mitigation of low-rise building with complex roof geometry,” in Proc. Can. Soc. Civ. Eng. Annu. Conf (Seoul, Republic of Korea: Spinger).
Aly, A. M., and Bresowar, J. (2016). Aerodynamic mitigation of wind-induced uplift forces on low-rise buildings: A comparative study. J. Build. Eng. 5, 267–276. doi:10.1016/j.jobe.2016.01.007
Azzi, Z., Habte, F., Elawady, A., Gan Chowdhury, A., and Moravej, M. (2020). Aerodynamic mitigation of wind uplift on low-rise building roof using large-scale testing. Front. Built Environ. 5, 149. doi:10.3389/fbuil.2019.00149
Baskaran, A., and Stathopoulos, T. (1988). Roof corner wind loads and parapet configurations. J. Wind Eng. Ind. Aerodyn. 29, 79–88. doi:10.1016/0167-6105(88)90147-X
Bernardini, E., Spence, S. M. J., Wei, D., and Kareem, A. (2015). Aerodynamic shape optimization of civil structures: A CFD-enabled kriging-based approach. J. Wind Eng. Ind. Aerodyn. 144, 154–164. doi:10.1016/J.JWEIA.2015.03.011
Bitsuamlak, G. T., Asce, M., Warsido, W., Edward, L., and Chowdhury, A. G. (2013). Aerodynamic mitigation of roof and wall corner suctions using simple architectural elements. Ascelibrary. Org. 139, 396–408. doi:10.1061/(ASCE)EM.1943-7889.0000505
Bobby, S., Spence, S. M. J., Bernardini, E., and Kareem, A. (2014). Performance-based topology optimization for wind-excited tall buildings: A framework. Eng. Struct. 74, 242–255. doi:10.1016/J.ENGSTRUCT.2014.05.043
Courant, R., Friedrichs, K., and Lewy, H. (1928). Über die partiellen Differenzengleichungen der mathematischen Physik. Math. Ann. 100, 32–74. doi:10.1007/BF01448839
Elshaer, A., Asce, A. M., and Bitsuamlak, G. (2018). Multiobjective aerodynamic optimization of tall building openings for wind-induced load reduction. J. Struct. Eng. 144, 04018198. doi:10.1061/(ASCE)ST.1943-541X.0002199
Elshaer, A., Bitsuamlak, G., and Abdallah, H. (2019). Variation in wind load and flow of a low-rise building during progressive damage scenario. Wind Struct. Int. J. 28, 389–404. doi:10.12989/WAS.2019.28.6.389
Elshaer, A., Bitsuamlak, G., and El Damatty, A. (2017). Enhancing wind performance of tall buildings using corner aerodynamic optimization. Eng. Struct. 136, 133–148. doi:10.1016/J.ENGSTRUCT.2017.01.019
Franke, J., Hellsten, A., Schlünzen, K. H., and Carissimo, B. (2011). The cost 732 best practice guideline for CFD simulation of flows in the urban environment: A summary. Int. J. Environ. Pollut. 44, 419–427. doi:10.1504/IJEP.2011.038443
Ho, T. C. E., Surry, D., Morrish, D., and Kopp, G. A. (2005). The UWO contribution to the NIST aerodynamic database for wind loads on low buildings: part 1. Archiving format and basic aerodynamic data. J. Wind Eng. Ind. Aerodyn. 93, 1–30. doi:10.1016/J.JWEIA.2004.07.006
Holmes, J. D., and Moriarty, W. W. (1999). Application of the generalized Pareto distribution to extreme value analysis in wind engineering. J. Wind Eng. Ind. Aerodyn. 83, 1–10. doi:10.1016/S0167-6105(99)00056-2
Khaled, M. F., Aly, A. M., and Elshaer, A. (2021). Computational efficiency of CFD modeling for building engineering: an empty domain study. J. Build. Eng. 42, 102792. doi:10.1016/J.JOBE.2021.102792
Kopp, G. A., and Gavanski, E. (2010). Wind tunnel pressure measurements on two FCMP houses. London: Boundary Layer Wind Tunnel Test, 1–30.
Kopp, G. A., Mans, C., and Surry, D. (2005b). Wind effects of parapets on low buildings: part 4. Mitigation of corner loads with alternative geometries. J. Wind Eng. Ind. Aerodyn. 93, 873–888. doi:10.1016/J.JWEIA.2005.08.004
Kopp, G. A., Surry, D., and Mans, C. (2005a). Wind effects of parapets on low buildings: part 1. Basic aerodynamics and local loads. J. Wind Eng. Ind. Aerodyn. 93, 817–841. doi:10.1016/j.jweia.2005.08.006
Lin, J. X., Surry, D., and Tieleman, H. W. (1995). The distribution of pressure near roof corners of flat roof low buildings. J. Wind Eng. Ind. Aerodyn. 56, 235–265. doi:10.1016/0167-6105(94)00089-V
Mans, C., Kopp, G. A., and Surry, D. (2005). Wind effects of parapets on low buildings: part 3. Parapet loads. J. Wind Eng. Ind. Aerodyn. 93, 857–872. doi:10.1016/J.JWEIA.2005.08.007
Mansouri, Z., Selvam, R. P., and Chowdhury, A. G. (2022). Maximum grid spacing effect on peak pressure computation using inflow turbulence generators. Results Eng. 15, 100491. doi:10.1016/J.RINENG.2022.100491
NBCC (2005). “Supplement to the national building code of Canada,” in Association; committee on the national building code (Ottawa, Ont. Norris: National Research Council of Canada. Associate Committee on the National Building Code).
Pindado, S., and Meseguer, J. (2003). Wind tunnel study on the influence of different parapets on the roof pressure distribution of low-rise buildings. J. Wind Eng. Ind. Aerodyn. 91, 1133–1139. doi:10.1016/S0167-6105(03)00055-2
Sandink, D., Kopp, G., Stevenson, S., and Dale, N. (2019). Increasing high wind safety for Canadian homes: A foundational document for low-rise residential and small buildings institute for catastrophic loss reduction building resilient communities. SCC.
Sarkar, P., Wu, F., Sarkar, P. P., and Mehta, K. C. (2001). Full-scale study of conical vortices and roof corner pressures. Wind Struct. 4, 131–146. doi:10.12989/was.2001.4.2.131
SHARCNET (2022). Is a consortium of colleges, universities and research institutes operating a network of high-performance computer clusters across south western, central and northern Ontario. Avaliable At: www.sharcnet.ca.
Stathopoulos, T., Baskaran, A., and Goh, P. A. (1990). Full-scale measurements of wind pressures on flat roof corners. J. Wind Eng. Ind. Aerodyn. 36, 1063–1072. doi:10.1016/0167-6105(90)90103-J
Suaris, W., and Irwin, P. (2010). Effect of roof-edge parapets on mitigating extreme roof suctions. J. Wind Eng. Ind. Aerodyn. 98, 483–491. doi:10.1016/j.jweia.2010.03.001
Keywords: wind engineering, low-rise buildings, aerodynamic mitigation, wind load, dynamic analysis
Citation: Al-Chalabi R and Elshaer A (2023) Aerodynamic mitigation of low-rise building with complex roof geometry. Front. Built Environ. 9:1200383. doi: 10.3389/fbuil.2023.1200383
Received: 04 April 2023; Accepted: 08 August 2023;
Published: 28 August 2023.
Edited by:
Matthew Stephen Mason, The University of Queensland, AustraliaReviewed by:
David James Henderson, James Cook University, AustraliaAntonino Maria Marra, University of Florence, Italy
Copyright © 2023 Al-Chalabi and Elshaer. This is an open-access article distributed under the terms of the Creative Commons Attribution License (CC BY). The use, distribution or reproduction in other forums is permitted, provided the original author(s) and the copyright owner(s) are credited and that the original publication in this journal is cited, in accordance with accepted academic practice. No use, distribution or reproduction is permitted which does not comply with these terms.
*Correspondence: Ahmed Elshaer, YWVsc2hhZXJAbGFrZWhlYWR1LmNh