 Javeriya Hasan
 Emily Zheng
 Miljana Horvat
- Department of Architectural Science, Toronto Metropolitan University, Toronto, ON, Canada
Introduction: This Toronto-based study explores how density metrics relate to the solar potential of rooftops and facades of buildings in neighbourhoods differentiated by their use classifications. In the context of Toronto’s 2040 Net Zero Strategy, this research contributes insight on identifying neighbourhood types in Toronto that are suitable for undergoing retrofits of active solar technologies.
Methods: The methodological approach adopted in this investigation mainly entails the selection of representative neighbourhood archetypes in the city; compilation of density metrics representing the neighbourhood morphological form and conducting solar analysis and regression assessments using relevant computational tools. By identifying 14 distinct neighbourhood archetypes and examining 20 relevant density metrics, the variation of roof and façade solar potential has been evaluated through a least squares regression-based approach.
Results: The findings indicate a negative correlation between certain density metrics, such as the standard deviation of height, plot density, nearest neighbour ratio, and complexity with the roof solar potential, thereby demonstrating that certain neighbourhoods such as those categorized as Employment or Institutional may be more suitable for active solar technologies retrofits. Additionally, there is no significant relationship between most density metrics and façade solar irradiance, apart from the open space ratio, which only affects it moderately. Façade solar potential is unique to building position and orientation and can vary non-uniformly across neighbourhood-use classifications based on the extent of overshadowing inherent to that configuration.
Discussion: The study provides valuable insights for urban planning and neighbourhood design, specifically in terms of density metrics that need to be considered when opting for active solar technology retrofits of existing Toronto neighbourhoods. Additionally, the study’s methodological approach can be emulated as a framework for future research exploring neighbourhood archetypes in other cities and climatic conditions. The findings of this research also contribute to promoting sustainable energy transition in Toronto’s neighbourhoods.
1 Introduction
In the backdrop of climate change, cities worldwide are driving efforts in tackling the challenge of energy transition in the built environment (International Energy Agency, 2021). Canada has been at the forefront of legislating on reducing greenhouse gas (GHG) emissions. Through the Canadian Net-Zero Emissions Accountability Act and the associated 2030 Emissions Reduction Plan, a strategic framework exists to chart out ways of reducing the energy consumption of the building sector (Environment and Climate Change Canada, 2022). At the municipal level, Toronto has ratified the 2040 Net Zero Strategy, whereby the Toronto Green Standard mandates minimum performance requirements centering on retrofits and the integration of renewable technologies for new and existing buildings in the city (City of Toronto, 2019).
However, it is important to contextualise this in light of trends in recent decades that show increased population growth in urban areas. In 2022, Canada had an annual overall population growth rate of 2.7%, where this record-high rate placed it in the top 20 fastest-growing countries in the world (Statistics Canada, 2023). Approximately 75% of Canadians live in urban centres with Toronto having the highest population (Statistics Canada, 2022). The rapid urban densification that Toronto experienced in the last decade has led to a high number of 50 + storey high-rise buildings built in the downtown core and along the main avenues. One of the positive outcomes of this is that many residents can live, work and study in the downtown area: the creation of walkable cities can reduce the reliance on fossil-fuel-dependent transportation and urban sprawl (Hachem, 2016). At the same time, uncontrolled densification poses a concern to the neighbourhood by disrupting the local microclimate, daylight available to residents, and solar accessibility (Wang et al., 2021). Daylight is vital in the design of liveable urban neighbourhoods, as adequate exposure to the Sun is known to improve physical and mental health (Czachura et al., 2022).
The reduced solar accessibility can also delay the City of Toronto’s plans to reduce community-wide greenhouse gas (GHG) emissions to net zero by 2040 using the Net Zero Strategy (City of Toronto, 2021a). Buildings contribute to 57% of Toronto’s total GHG emissions and the primary source is residential buildings, making up 56% of GHG emissions in the building sector (City of Toronto, 2020) (see Figure 1). Commercial and institutional buildings comprise 32%, followed by industrial buildings with 12%. The rising threat of climate change manifested as increased frequency and severity of storms, winds, and precipitations that often cause power supply disruptions in many parts of the city has emphasized the need for on-site renewable energy and storage technologies to reduce emissions and improve building resiliency by supplying power to the community during outages (City of Toronto, 2021a).
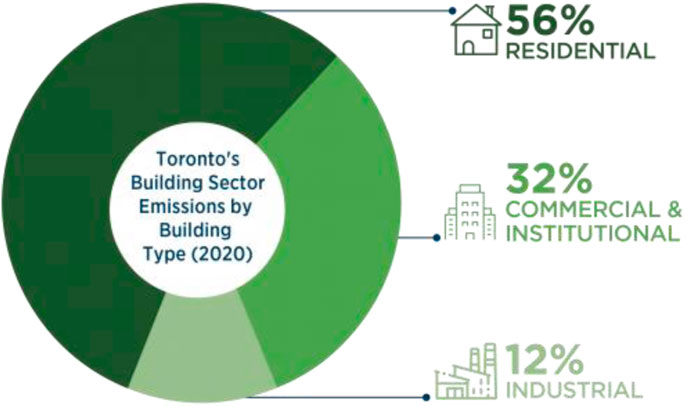
FIGURE 1. Toronto’s building sector emissions by building type (City of Toronto, 2023).
Compact and high-density neighbourhoods offer residents the benefit of a reduced commute time due to the proximity to amenities, academic institutions, workplaces, and residences (Toronto Public Health, 2012). However, a drawback of this type of neighbourhood configuration is the Urban Heat Island (UHI) effect, which is exacerbated due to the paved surfaces and buildings closely clustered together (Wang et al., 2015). However, in dense urban cities, roofs and facades are often obscured by the shadows of surrounding buildings, which could impede the efficiency of building-integrated technologies when implemented on those surfaces. To avoid this and balance the need for increased urban densities while allowing direct access to sunlight, adequate zoning requirements could play an important role.
2 Background
2.1 Urban densification
Rapid growth continues at unprecedented rates in downtown Toronto with a population increase of 16.14% between 2016 and 2021 (Statistics Canada, 2022). The population between the downtown core and distant suburbs is also rising but growing at a slower rate compared to previous years (Statistics Canada, 2022). Increased urbanization has been attributed to multiple driving factors that include a general lack of land availability, demographic changes, economic growth, and an overall improvement in transport infrastructure (Chokhachian et al., 2020). In Toronto, different zoning permissions across the city have a considerable impact on neighbourhood density and growth rates, as zoning regulations can dictate building type, use, location, and form. A study observed that more permissive zone types tend to result in denser neighbourhoods (Toronto City Planning, 2021).
Furthermore, there are environmental concerns associated with increased building activity that may compromise the standard of living for city residents in the long term (Chatzipoulka et al., 2016). Residents in dense neighbourhoods typically face issues related to indoor and outdoor thermal comfort due to the urban heat island effect (Aghamolaei et al., 2020). As the emphasis on liveable cities continues to grow, studies investigating the impact of density on neighbourhood sustainability at various scales, typologies, and climates become more important. One way to measure neighbourhood sustainability is with environmental performance.
2.2 Solar access
In the past decade, the demand for on-site renewable energy production to enhance building resiliency and meet rigorous energy performance standards has led to numerous studies investigating the correlation between urban geometry and solar potential as an environmental performance measure. Solar potential is the irradiance intensity on building surfaces and can essentially translate into the potential for electricity production through photovoltaic systems or solar thermal systems (Amado and Poggi, 2014). A combination of high-performance buildings and on-site renewable energy supports the City of Toronto’s ambitious goal to achieve Net-Zero Emission by 2040 (City of Toronto, 2021a). Several studies have confirmed that building geometry, orientation, and adjacent obstructions can influence solar access to the roof, facade, and ground (Amado and Poggi, 2014; Chatzipoulka et al., 2016; Mohajeri et al., 2016; Lobaccaro et al., 2019). The solar potential for roofs is less affected than facades by neighbourhood density, which can be attributed to the inter-building effect, another term for the overshadowing of neighbourhood surfaces caused by tall buildings built close to one another (Wang et al., 2021). Buildings located in the north and west parts of downtown Toronto experience less solar access due to the majority of high-rise buildings being located in the south and east parts of the city (R. Zhu et al., 2020b).
Recent studies have also presented evidence regarding the impact of urban morphology on building energy demand, thermal energy generation, daylighting, indoor thermal comfort, and outdoor thermal comfort (Chokhachian et al., 2020; Pan and Du, 2021; Wang et al., 2021; Giostra et al., 2022). Using a generative approach to produce different parametric models of urban forms, Chokhachian et al. (2020) explored the relationship between density metrics representing these forms and outdoor solar access. In this study, outdoor solar access was regarded as an environmental performance measure that is signified by the ratio of the pedestrian area that gets at least 50% of direct sunlight on the summer and winter solstices. The density of urban forms were represented through parameters such as building block size, canyon width (the inter-building distance), number of floors, and floor area ratio (FAR). The study found that a high canyon width improved outdoor solar access, and this was specifically significant in summer. Another notable finding of this study was that a high urban density characterized by a high FAR value (for example, FAR = 7) can have an important bearing on outdoor solar access during the winter causing it to drop by about 96.5%. In a similar study, Giostra et al. (2022) examined how different urban forms characterized by three different building block typologies, namely, the tower, courtyard, and bar blocks impact solar access, whilst exploring geometrical indicators such as building form and layout, notably building width, length, height, depth, inter-building distance, size of inner courtyards, orientation and the number of buildings. The study also found that towers have the highest solar potential, followed by the bars and courtyard block typologies. Orientation has an insignificant impact on the solar potential, as vertical surfaces receive more diffuse and reflected radiation than horizontal surfaces. Using a different methodological approach compared to the aforementioned studies, Pan and Du (2022) investigated the relationship of urban form density metrics with outdoor solar access, which was represented by horizontal illuminance levels (HIL) and site illuminance uniformity (SUo), by measuring these metrics onsite using digital equipment. The study found that Sky View Factor (SVF), Mean Building Height (MBH), and vertical uniformity are positively correlated with HIL and SUI, while Building Coverage Ratio (BCR) and Floor Area Ratio (FAR) are negatively correlated with these metrics. They also found that Mean Nearest Neighbour Distance (MNN), which represents building dispersion within a neighbourhood block, is positively correlated with HIL and SUI, such that a 1% increase in building dispersion can increase HIL by 0.07 lux and SUI by 0.01lux. Wang et al. (2021)’s review study found that through the interbuilding effect, a metric that qualitatively represents reduced solar access on building surfaces (roofs and facades) owing to the proximity of buildings to one another, the power generation output of roof-integrated active solar technologies can diminish by 50.73%.
2.3 Typological methods
Many similar studies analysed the impact of neighbourhood morphology on the rooftop and façade solar potential in two ways. The first method employs a simplified quasi-generic model consisting of a single building typology organized in a uniform layout. Parametric simulations commonly use the courtyard, tower, and slab typologies (Natanian et al., 2019; Czachura et al., 2022; Giostra et al., 2022). The best-performing typologies to optimize energy demand, solar potential, and daylighting are low-rise courtyard and slab buildings (Giostra et al., 2022). Natanian et al. (2021) noted that the courtyard typology is preferable in terms of energy balance. The hypothetical models are ideal for typology performance comparisons and sensitivity analyses. The main drawback to this method is the oversimplification of building geometries, creating a scenario that does not reflect the complex conditions of the built environment (Shi et al., 2021).
The second method simulates existing neighbourhoods that comply with local building codes and zoning regulations. Chatzipoulka et al. (2016) conducted a solar analysis for 24 urban sites with varying levels of density located in London, England. The research found that comparing sites with different layouts, but similar densities changed the irradiance by 11% for facades and 32% for ground surfaces. Sarralde et al. (2015) also examined various metrics and indicators to assess the solar potential of buildings' roofs and façades. Their analysis considered the increase in solar irradiation over a base-case scenario and compared different scenarios for optimizing solar irradiation, whereby potential increases ranged from 0.44% to 8.78%. A similar study confirmed that compact neighbourhoods received a lower solar irradiance compared to less dense neighbourhoods (Mohajeri et al., 2019). A case study approach provides designers and urban planners with a guideline for the real-world integration of solar technology in urban centers. From a Toronto context, the authors of this paper have also investigated how modifying roof morphologies in an existing suburban neighbourhood led to higher rooftop solar potential and solar power generation (Hasan et al., 2021). However, this study, in particular, examines existing neighbourhoods forming part of Toronto’s organic urban sprawl, whereby they manifest varying morphological configurations and use classifications, making the second typological method entailing the assessment of existing neighbourhoods’ solar potential the most relevant methodological approach to undertake.
2.4 Density metrics
Several studies have utilized various density metrics to examine the relationship between existing urban forms and solar energy potential, energy consumption, and environmental quality. A seminal study in this domain is by Mohajeri et al. (2016) who investigated the impact of urban compactness on solar energy potential using site coverage (SC), plot ratio (PR), volume-area ratio, building density (BD), nearest neighbour ratio (Rn), and entropy (S) with solar access. They found that a higher SC reduced solar access, while a higher entropy increased it. Chatzipoulka et al. (2016) studied the relationship between urban geometry and solar availability using SC, mean building height, the standard deviation of building height (Sdheight), the standard deviation of building footprint (Sdarea), directionality, complexity (CX), compacity (CP), number of buildings (NoB), and mean outdoor distance. The results showed that complexity, Sdarea, and directionality were the most influential metrics for the solar performance of building facades. Waibel et al. (2017) explored the impact of building geometry on energy consumption and solar energy potential using building footprint ratio (BFR), building height-to-width ratio (BHW), and floor area ratio (FAR). BFR and FAR are also known as SC and PR, respectively. They identified optimal building geometries that maximize solar potential and minimize energy consumption. Chokhachian et al. (2020) adopted a generative modeling approach entailing variation of parameters representing urban geometry. They investigated how daylighting, urban heat island, and solar access varied based on changes in BD, FAR, open space ratio (OSR), and building-to-street width ratio (BHSW). Zhu D. et al. (2020) investigated ten different cities to understand the effect of urban morphology on solar potential. They observed a general correlation where neighbourhoods with a higher density of tall buildings and significant variation in building height offer greater solar potential. The density metrics used include BD, Sdheight, average neighbourhood building height (ANBH), average building perimeter (AP), and envelope-to-roof surface area ratio. Boccalatte et al. (2022) proposed a general GIS-based methodology that explored the impact of building height, building distance, building footprint, total floor area, mean building volume (MBV), volume-to-facade ratio, FAR, and the number of neighbourhoods on the rooftop overall shading rate at a city-scale. The density metrics that were common to most of these studies were BD, SC, and PR. Table 1 summarises the density metrics obtained from the review of the literature, commonly used terminologies to represent them, and the corresponding formulas.
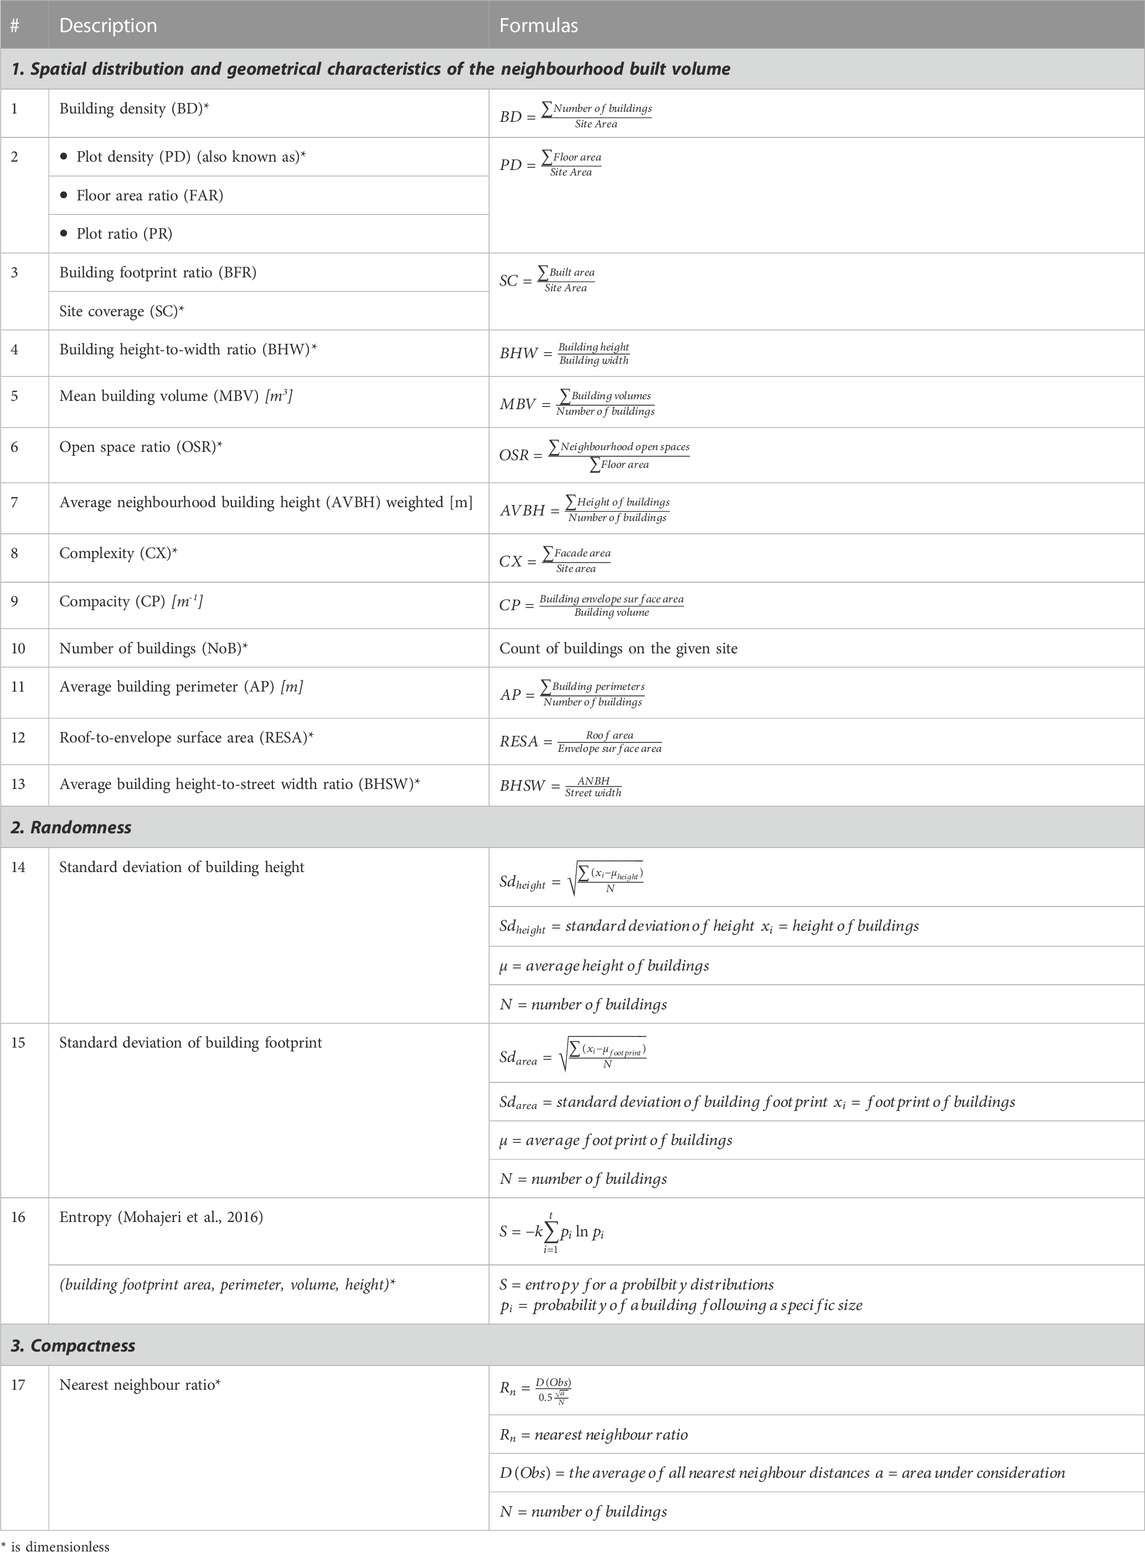
TABLE 1. A summary of the density metrics and associated formulas to describe neighbourhood morphology.
3 The local context
The area of this study is the City of Toronto, which is located at a latitude of 43.65˚N and 79.38˚W. The average solar radiation intensity on a horizontal surface is 1,385 kWh/m2 (The World Bank, 2019). The city, consisting of 25 wards, has undergone a mushroomed growth of development recently, whereby today’s neighbourhoods bear hallmarks of a circumvented urban planning process that delineates a rapidly evolving city having a significantly stratified morphological texture and character. Compared to other parts of Ontario, there is great diversity in the types of neighbourhoods present in the city, and they can typically be differentiated by their use classifications. However, it is not uncommon that these characterizations are sporadically disrupted by an organic rate of building development (Toronto City Planning, 2021) (see Figure 2).
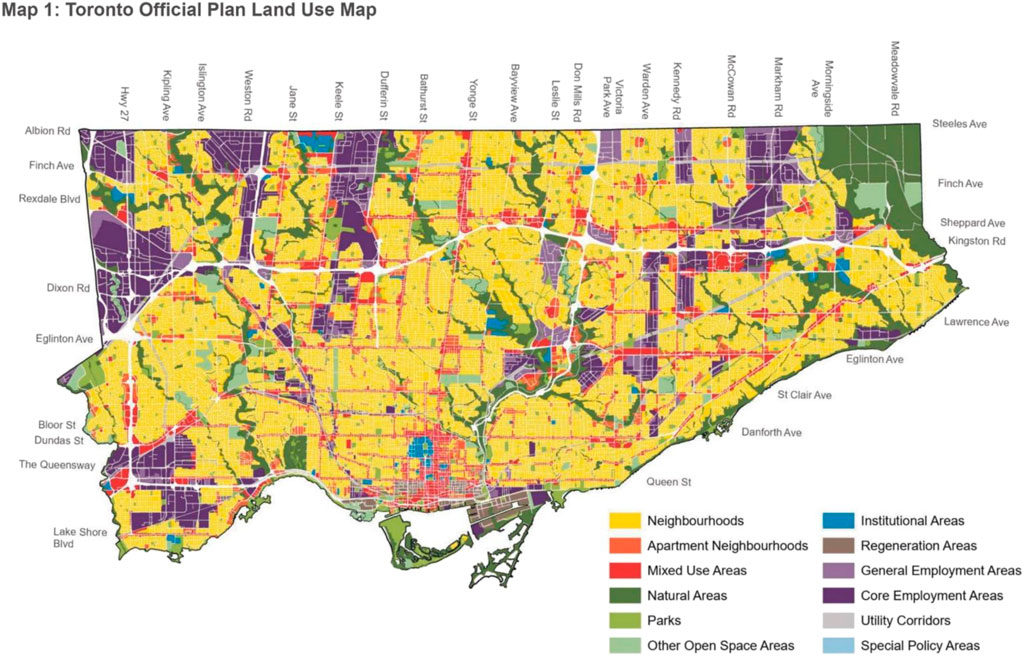
FIGURE 2. The land use classifications of different Toronto neighbourhoods (Toronto City Planning, 2021).
As the City of Toronto’s 2040 Net Zero Emissions goals entails conducting a large-scale retrofit of existing buildings in the city’s neighbourhoods, the integration of renewables such as photovoltaics and solar thermal technologies is considered an increasingly important strategy in meeting future building energy demand. The recommended application of solar technologies is predominantly building rooftops and facades, depending on the building use type considered. Given that it is estimated that 14% of the city’s total building electricity is to be met by photovoltaics on the rooftops of the buildings, the study seeks to examine specific neighbourhood configurations and their respective representative density metrics, to determine the magnitude of the solar potential of building surfaces, and hence the feasibility of integrating solar technologies (City of Toronto, 2021b).
4 Research objective
In comparison to most Toronto-based studies that have predominantly focused on the solar potential at either a macro-level (urban) or individual buildings level, this study not only identifies neighbourhood archetypes that are recipients of typically higher levels of solar irradiation but, also, specifically investigates the relationship between neighbourhood characteristics and the solar irradiation potential of building roofs and facades within those neighbourhoods (Chow et al., 2014; Hailu and Fung, 2019; Zhu D. et al., 2020). Similar to past studies on this domain, these morphological characteristics are numerically quantified by a set of density metrics (Chatzipoulka et al., 2016; Mohajeri et al., 2016). Thus, the research objective is to establish a methodological framework for the selection of neighbourhood archetypes based on density metrics that would serve to provide an understanding of the feasibility of implementing active solar technologies and other solar strategies for transforming existing Toronto neighbourhoods potentially into net-zero energy neighbourhoods.
5 Methodology
A five-step approach has been adopted to investigate neighbourhood-level solar potential in Toronto and the relevant density metrics that bear influence on it (see Figure 3). Each step in the workflow has been discussed in the subsequent sections. The methodological process entailed 1) using the City of Toronto Zoning Map for the identification and selection of different neighbourhoods representing varying use classifications; () extraction and preprocessing of the 3D models of these neighbourhoods on Rhino; 3) computation of density metrics of the different neighbourhoods through Grasshopper scripts; 4) a solar potential analysis using the Ladybug tools (plugin on Grasshopper) and, 5) regression analysis on the density metrics and solar potential was done on Python.
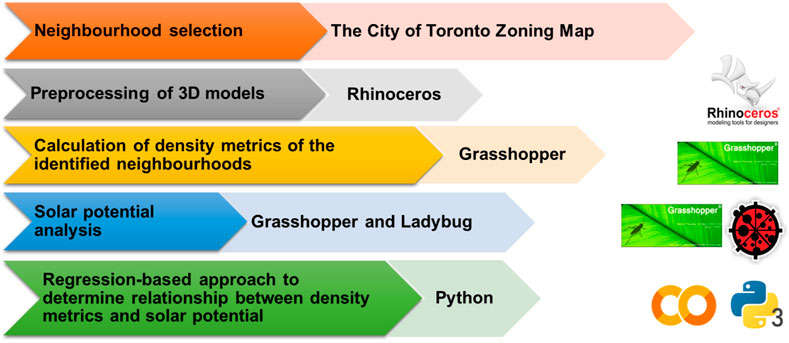
FIGURE 3. The study’s workflow process.
5.1 Neighbourhood archetype identification
The City of Toronto’s Zoning Map indicates several use classifications and sub-classification, which are mainly categorized as Residential, Commercial, Employment, and Institutional (City of Toronto, 2013a). The residential category is subdivided into low-rise (typically houses) and high and mid-rise buildings referred to as Apartment. The Commercial category is further subdivided into Local, Residential, and Residential–Employment. For the Institutional category, the sub-divisions were General, Hospital, Education (typically colleges and universities), School, and Place of Worship. In the Employment category, the sub-categories included Light Industrial, Industrial, Heavy Industrial, and Industrial Office. A distinction between the Employment Industrial Office and Commercial categories is that they represent different types of building functional uses. A building classified as an ‘Industrial Office’ can support both office and industrial functions, such as manufacturing or warehousing, whereas the ‘Commercial - Residential Employment’ use classification refers to a building that can only support office-related functions, such as administrative activities or related services (in case of the employment sub-classification) (City of Toronto, 2022). The zoning map had additional categories such as Open Space and Utility and Transportation, which are areas without building development, and hence were out of the scope of this study. Given that large-scale integration of solar technologies on existing low-rise residential buildings is feasible on a case-to-case basis, but in actuality depends upon a multitude of factors unique to an individual building’s rooftop configuration, orientation, and proximity to shading structures, low-rise residential buildings were also omitted from the study analysis (Hasan et al., 2021). Similarly, the Place of Worship sub-category was also not considered, as the integration of technologies on the building envelope may compromise the protected heritage status of the buildings and disrupt its ability to blend in architecturally with the surrounding neighbourhood (Munari and Roecker, 2015). A summary of the land-use classifications used in this study for neighbourhood selection has been identified in Table 2.
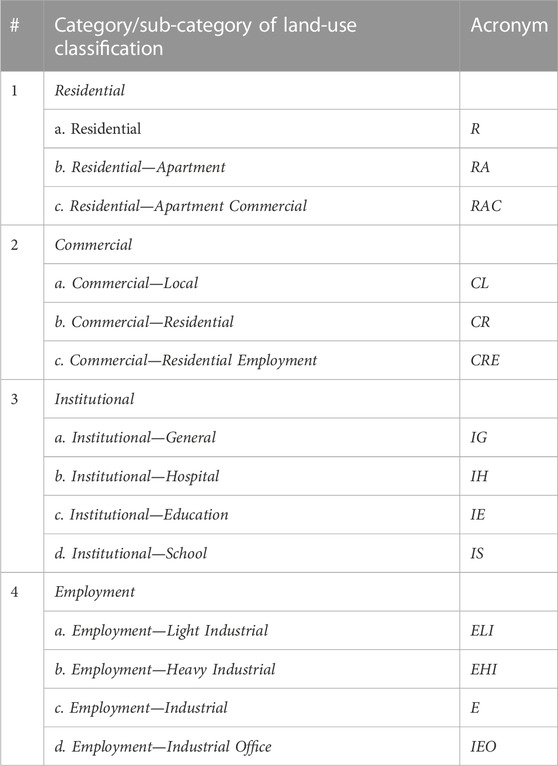
TABLE 2. The different categories and sub-categories of land-use classification adopted for neighbourhood selection.
The City of Toronto has numerous neighbourhood blocks that match the land use classifications investigated in the study. To select blocks that could be potential case studies, visual examinations were made using the City of Toronto Zoning Map and Google Maps. The following constraints were applied to ensure consistency in the selection approach.
1 Neighbourhood blocks that were close to buildings or blocks that represented different land-use classifications were filtered out, to ensure homogeneity in neighbourhood form and density.
2 Only one neighbourhood block per land use classification was selected, where the boundaries were defined based on paths, minor roads, and major roads’ layers in the Rhino neighbourhood model.
3 Based on the visual examination of the neighbourhood blocks, those blocks were excluded that had overshadowing from adjacent buildings, as the goal was to investigate the density arising from intra-neighbourhood characteristics.
For example, it was ensured that ‘E’ was close to a similar type of neighbourhood and was not potentially overshadowed by a high-rise building in the vicinity, as this is essentially an anomaly and does not reflect the density of such archetypical neighbourhoods. The neighbourhoods identified for further analysis in this study are indicated in Figure 4.
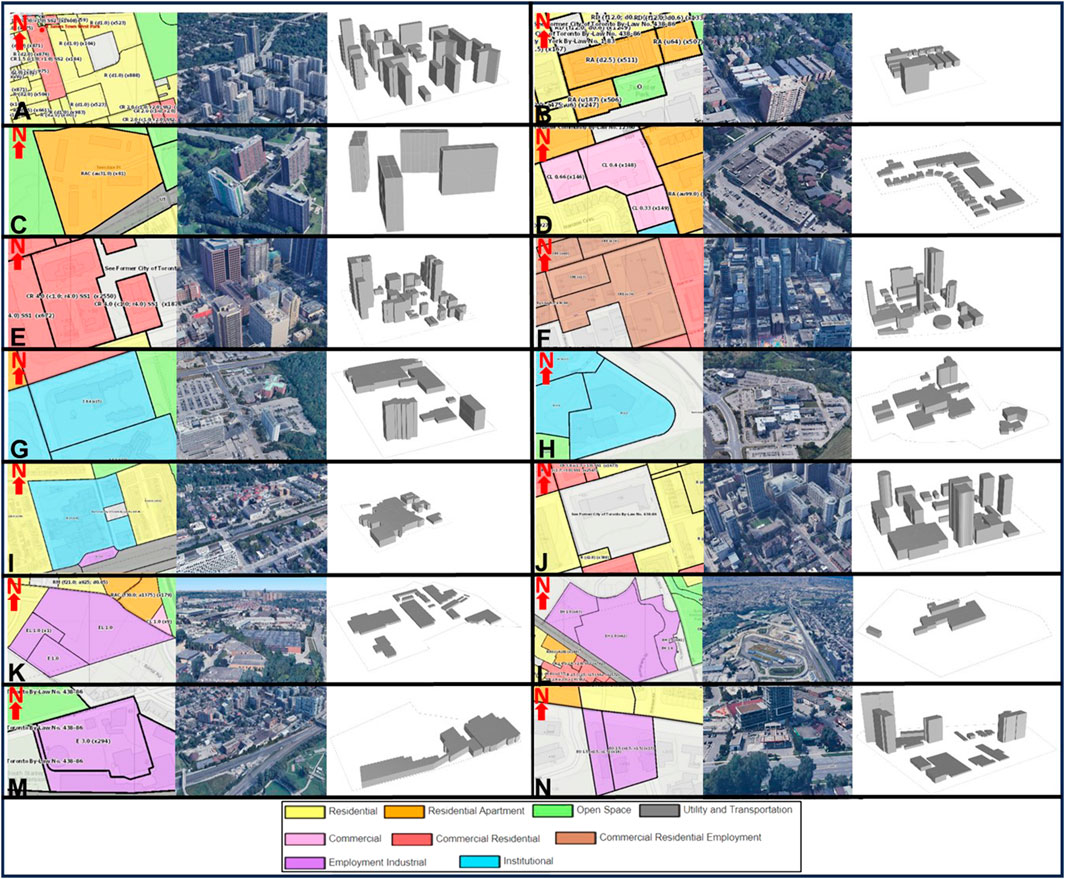
FIGURE 4. The neighbourhoods identified for analysis in this study are (A) Residential, (B) Residential–Apartment, (C) Residential–Apartment Commercial, (D) Commercial–Local, (E) Commercial–Residential, (F) Commercial–Residential Employment, (G) Institutional–General, (H) Institutional–Hospital, (I) Institutional–Education, (J) Institutional–School, (K) Employment–Light Industrial, (L) Employment–Heavy Industrial, (M) Employment–Industrial and (N) Employment–Industrial Office. Each neighbourhood use classification is represented by images (left) from The City of Toronto Zoning Map (City of Toronto, 2013b) indicating the zoning classifcations, (middle) from Google Map (Google Maps, 2023) and (right), a 3D Rhino model of the neighbourhood.
As can be seen from Figure 4, most of the neighbourhoods and surrounding areas are uniform in terms of use classifications. The selected neighbourhoods for the Residential zone are near ravines and creeks. High-rise buildings with identical heights are grouped to create the R and RAC zones. Predominantly low-rise apartments can be seen in RA. Located near the Toronto core, CR and CRE are similar high-rise residential neighbourhoods with commercial at-grade. Common characteristics include limited street trees and narrow street widths. The CL site includes low-rise buildings located in a typical suburban area. Single-family detached houses, parking lots, and wide streets surround the site. The Institutional neighbourhoods are composed of low-rise buildings. IE and IS are surrounded by mostly residential buildings, while IG and IH are healthcare centres that feature extensive parking lots and adjacencies to substantial green spaces. The neighbourhoods classified as Employment are near parks and similar in density to the healthcare centers. Large parking lots and roads keep the buildings spaced far apart. It can be observed that the neighbourhoods become more compact with closer proximity to downtown Toronto. Additionally, use classifications such as CRE or CR, despite being densely clustered, may also higher prevalence of buildings that are configured non-uniformly i.e., having a great variation of height. On the other hand, other use classifications particularly those from E or I are more dispersed and are located in neighbourhoods that are fragmented having predominantly buildings of the same height.
5.2 Data collection
5.2.1 Pre-processing of 3D neighbourhood models and data collection
The pre-processing of Rhino 3D neighbourhood models in a form that would enable accurate data extraction initially involved obtaining neighbourhood models from the Cadmapper website (https://cadmapper.com/). The model was compared to the neighbourhood form observed in the City of Toronto Zoning Map (City of Toronto, 2013b) and Google Maps (Google Maps, 2023). Where necessary, curves indicative of missing buildings within the neighbourhood model had to be redrawn to the height estimated from Google Maps 3D (see Figure 5). The surfaces in the Cadmapper model were by default Meshes, a series of vertices and polygons consisting of triangles and quadrilaterals that form the shape of objects, but they had to be converted into NURBS (Non-Uniform Rational B-Splines), mathematically expressed 3D geometry consisting of points connected by curves, which would enable subsequent analysis on Grasshopper. Additionally, any redundant objects, surfaces, and boxes were removed as this would impact the accuracy of the density metrics calculated. Similarly, each building in the neighbourhood was simplified to be represented as a closed-volume object in its entirety, without any superfluous details such as balconies or overhangs. It was important to identify the site boundaries, which were drawn based on the path, minor roads, and major road layers in the Rhino model. The boundary essentially dictated the limits of the analysis. There were also overlaps between the chosen neighbourhood’s land use classifications with those in the vicinity, however, in some cases, these adjacent buildings had to be accounted for due to potential overshadowing effects.
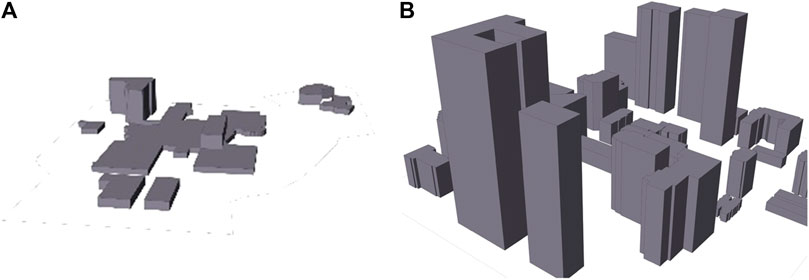
FIGURE 5. An example of some of the pre-processed 3D Rhino neighbourhood models, where the land-use classifications, in this case, are (A) Institutional and (B) Commercial–Residential.
5.2.2 Calculation of density metrics
The calculations for the density metrics were performed on the Grasshopper interface due to the ease with which data on different geometrical and typological attributes can be extracted for further processing. A Grasshopper script was developed to carry out different mathematical operations; recognize the neighbourhood surfaces based on the volumes and curves in the Rhino neighbourhood model, and finally compute results (see Figure 6). Some of the building-level characteristics that the script was designed to automatically extract included the width and height of each neighbourhood building; the building footprint area; the area of roof, facades, and the site; the number of buildings; the distance between building centroids; the gross floor area and the building perimeter. It is noteworthy that native Grasshopper components such as the “deconstruct vector” (functioning to split vertices/points on a surface into constituent x, y, and z-axes); “list item” (functioning to hierarchize data based on specified criteria) and “equality” (functioning as a filter to remove instances of specific datapoints) was useful in accurately identifying information relevant to the calculations.
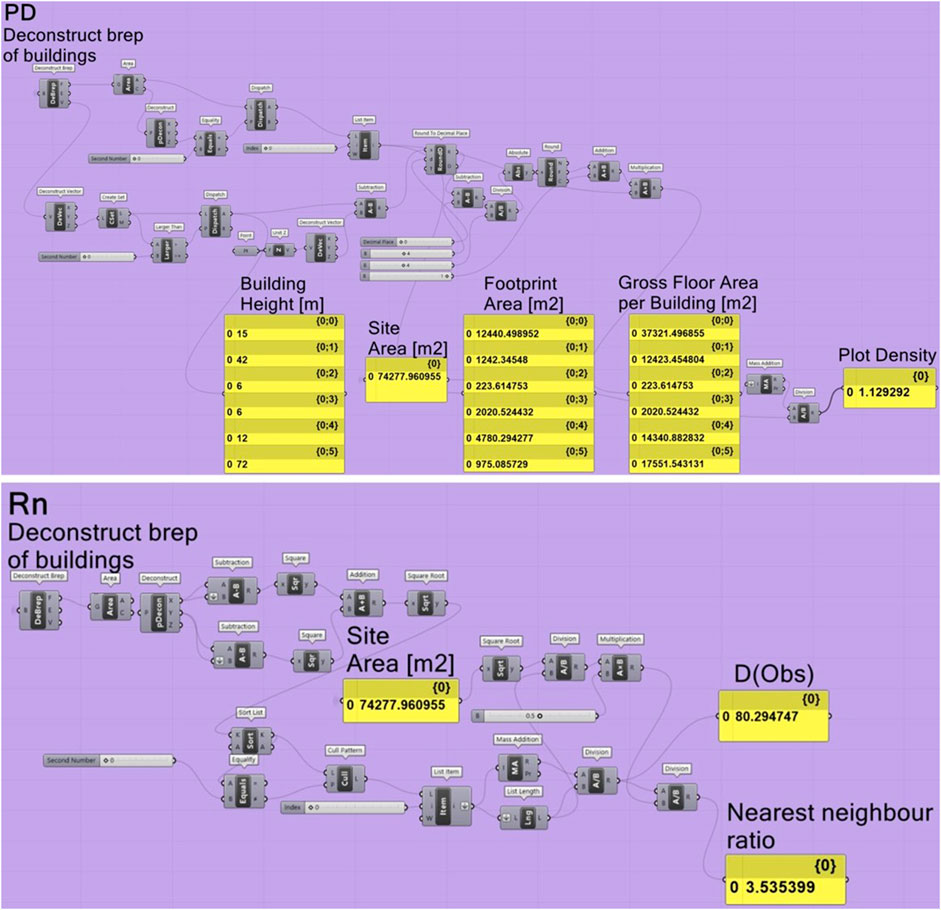
FIGURE 6. A typical outlook of the Grasshopper script used to calculate the different density metrics, where the components constituting the computation of (top) Plot Density (PD) and, (bottom) Nearest neighbour ratio (Rn), are illustrated.
5.2.3 Solar potential analysis
The Grasshopper script was able to differentiate between the roofs and facades of the buildings, whereby the Ladybug tools plugin within the interface, helped perform a neighbourhood-level assessment of the solar potential (see Table 3 for the main input features). The sequence of steps entailing the differentiation of the roofs from the facades broadly involved deconstructing building volumes into individual faces; determining the Z-coordinate of each face’s centroid; identifying the maximum Z-value for each building as its roof height (assuming roofs were flat and parallel to the ground plane). All other surfaces were considered to be facades and had the same heights. The average solar radiation intensity of the building roofs and facades of each neighbourhood archetype was thus determined.
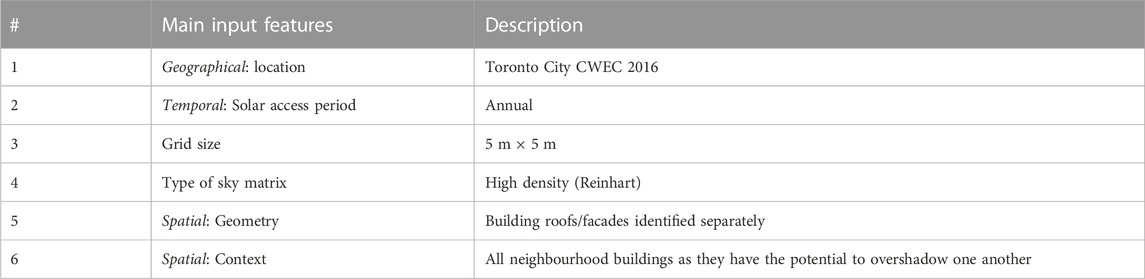
TABLE 3. The main input features in components of the Ladybug tools and their respective description for the neighbourhood solar potential analysis.
The adopted uniform grid size (5 × 5 m) was an optimal balance to maximize resolution, while also allowing the computations for every model to complete within a reasonable timeframe. Lower grid sizes, such as 1 × 1 m, were tested but resulted in substantially slower processing times and simulation crashes specifically in neighbourhood models that had closely clustered buildings, such as in the “Commercial–Residential Employment” neighbourhood.Least Squares Regression Approach.
Studies in this domain have typically used least square regression-based approaches to investigate the relationship between solar potential and density metrics (Mohajeri et al., 2019; Shahsavar et al., 2020). This method has also been employed in the forecasting of solar power generation in the context of given climatic data (Kaur et al., 2022). In the least square regression approach, a best-fit straight line that pivots upon lessening the sums of squared residuals is determined. This line is in effect used to predict the influence of a specific independent variable on the solar potential. Therefore, the strength of the relationship between density metrics (independent variables) and the roof/facade solar potential (dependent variables) is represented by the coefficient of determination, also referred to as R-squared (R2). The value of the R2 here essentially indicates the magnitude of variance that occurs in the roof/facade solar potential owing to a specific density metric, whereby values that are near 1 represent a good fit. The analysis of the least square regression method was performed on the Python platform. The sample dataset was loaded on the interface, whereby the script plotted the scatter graphs and the respective least squares regression lines of best fit. The following expressions (see Equation (1–Equation 3) fundamental to the method were used in the computations (Chicco et al., 2021):
N is the number of variables
MST is the Mean Sum of Total Squares
6 Results
6.1 Analysis of neighbourhood density metrics and solar potential (roof and facade)
For the distinct Toronto neighbourhood archetypes, 20 different density metrics that are holistic representations, albeit in varying capacities, of the spatial distribution and geometrical characteristics of the built volume; the extent of spatial randomness between neighbourhood buildings and compactness were computed in this study. These neighbourhood archetypes were differentiated based on the land-use classifications mainly categorized as Institutional, Industrial, Residential, Employment, and Commercial. Within each classification category, there were further sub-classifications that bore intra-neighbourhood morphological variations too. Table 4 summarizes the values for the density metrics for the 14 neighbourhood archetypes. The relatively higher values for PD, SC, Rn, NoB, and BHSW (plot density, site coverage, nearest neighbour ratio, number of buildings, and building height to street width ratio, respectively) and lower values for OSR (open space ratio) are indicative of dense and compact neighbourhood archetypes, and those that stand out are, namely, CRE, CR, and IS, whereby this corroborates the visual observations of the sites as they are located in Toronto downtown. Additionally, the same neighbourhood archetypes also have higher values for CX and AVBH (complexity and average building height), which would be high-level indicators of the level of inter-building overshadowing in the respective neighbourhood. For relatively less dense neighbourhoods, namely, IEO, ELI, EHI, CL, and RA, Sdheight, has been lower in the latter four. In some neighbourhood archetypes, there is a high probability of finding buildings with very different geometrical characteristics, which is signified as S. This is another way of representing “organic” or great uncertainty in the geometrical characteristics of buildings in a neighbourhood. For example, in the E and, IE, the distribution of building heights is non-uniform. Additionally, E, CR, and CRE also have the most variation in terms of the footprint of buildings.
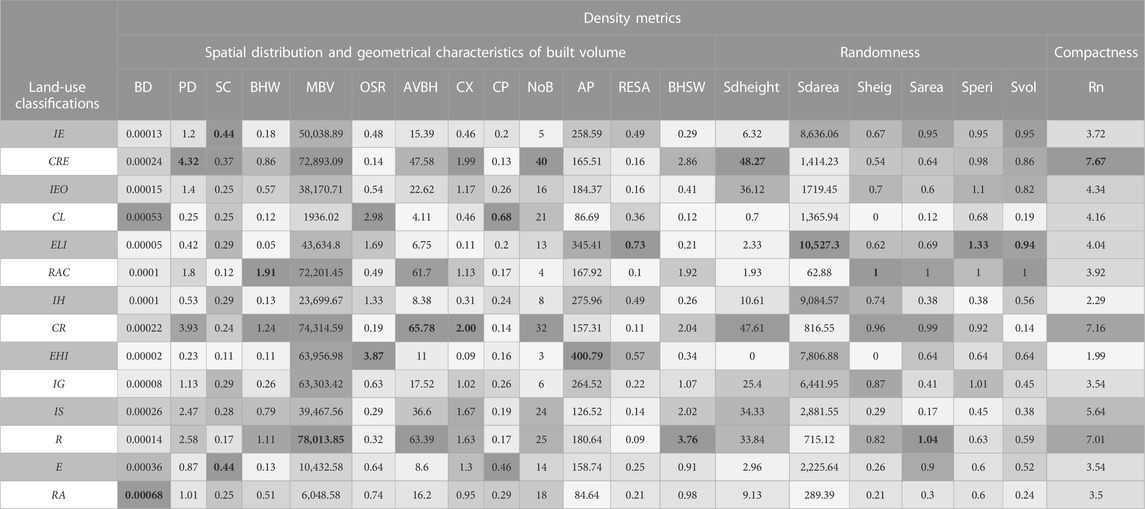
TABLE 4. The density metrics for the neighbourhood land-use classifications where the gradient scale of light to dark grey colors in each density metric category represents the progression from low to high values. The cell containing the maximum value in each density metric category has been highlighted with a bold values.
Figure 7 and Figure 8 delineate the average of the annual solar irradiance on all building roofs and facades in each of the 14 neighbourhood archetypes. The average roof solar potential of all the neighbourhoods hovers around 1,259 kWh/m2, and about 64% of the neighbourhoods in the study sample have an above-average roof irradiance. Neighbourhoods that have the highest and lowest rooftop solar irradiance are CL (1,341 kWh/m2) and CR (1,101 kWh/m2) respectively. The denser neighbourhoods, particularly the CR, CRE and IS (all present in the Toronto downtown core) have below-average rooftop potential. These neighbourhoods also have greater randomness, in terms of the magnitude of height difference between adjacent buildings whereby the average Sdheight = 43.4 m, and this is indicative of the overshadowing of building rooftops due to other buildings in proximity (see Figure 9). In contrast to the solar radiation intensities of the neighbourhood roofs in the study sample, a greater level of variation in the facade solar irradiance is observed, whereby as expected the typical dense neighbourhoods have a lower than average solar potential. However, the anomaly also worth identifying is the lower solar potential for the lesser dense archetypes, which could plausibly be explained by the Sarea, which represents the non-uniform distribution of facade sizes and their orientation along specific directions. This also indicates the potential for overshadowing.
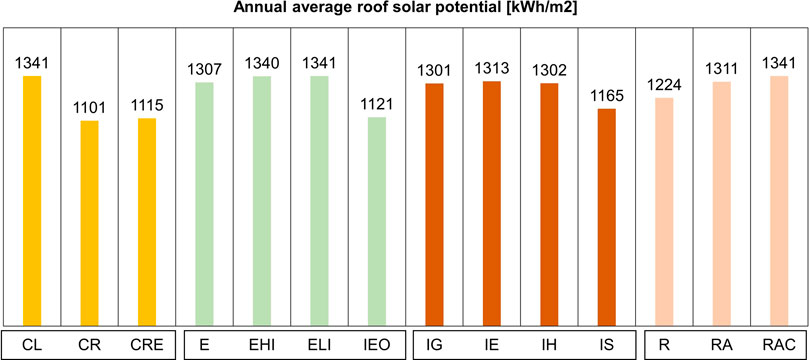
FIGURE 7. The variation of the roof solar potential of different neighbourhood use classifications.
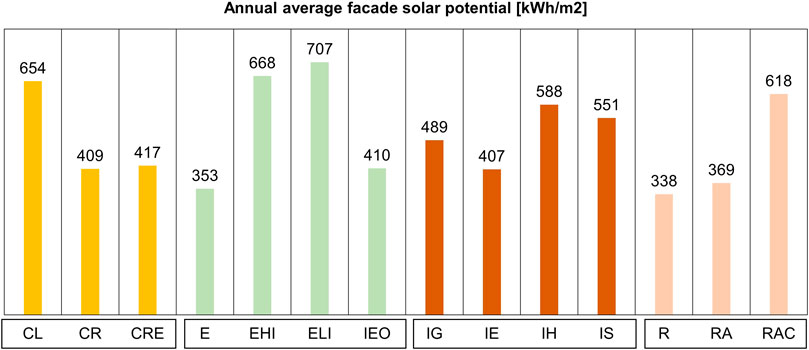
FIGURE 8. The variation of the facade solar potential of different neighbourhood use classifications.
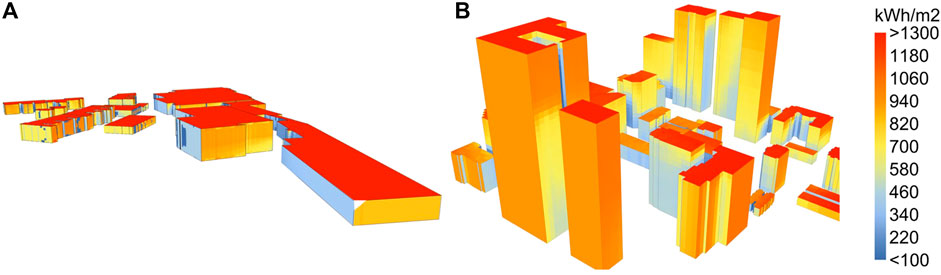
FIGURE 9. An example of the variation of solar radiation intensity on the building roofs and facades in one of the (A) less dense Employment neighbourhoods and (B) the denser Commercial–Residential (CR) neighbourhoods.
The results on the variation of solar potential on building rooftops and facades across the different neighbourhod use-classifications is especially important from the standpoint of identifying the applicability of retrofits involving the integration of solar energy technologies, such as photovoltaics and solar thermal technologies. Therefore, for urban planners, architects, and energy modelers, this is an invaluable insight into which neighbourhoods and building surfaces would be a priority in being recipients of active solar technology retrofits. The density metrics discussed earlier provide a quantified assessment of neighbourhood characteristics and this correlates with the solar potential of certain neighbourhood-use classifications, whereby an evaluation of these metrics would determine the feasibility of potential sustainability measures in existing Toronto neighbourhoods.
6.2 Analysis on the relationship between density metrics and neighbourhood roof/facade solar potential
Scatter graphs of the annual average solar potential of the roofs and facades of the sample neighbourhood archetypes versus the respective density metrics were plotted. A least square regression best-fit line was drawn to investigate the influence of each metric on the solar potential of the neighbourhoods, whereby the value of R2 represented the strength of the relationship and the level of variance owing to the metric (see Figures 10, 11). Figure 12 plots the R2 values for each neighbourhood archetype indicating the metrics having the highest influence on the roof and façade solar potential. For the roof solar potential, it is evident that the metrics bearing the most influence include Sdheight, PD, Cx, Rn, and NoB (standard deviation of neighbourhood building height, plot density, complexity, nearest neighbourhood ratio, and the number of neighbourhood buildings respectively). The R2 values for these metrics are 0.90, 0.68, 0.63, 0.60, and 0.58, respectively. As seen from past neighbourhood solar potential studies, these density metrics together present a quantitative representation of the level of compactness and proximity to tall buildings (Chatzipoulka et al., 2016; Mohajeri et al., 2016). All these metrics are negatively correlated with the roof solar potential. In contrast, density metrics that were seen to have a moderate effect (0.5 < R2 < 0.25) on the roof solar potential were AVBH, OSR, RESA, and BHSW (average building height, open space ratio, roof-to-envelope surface area ratio, building height to street width ratio, respectively).
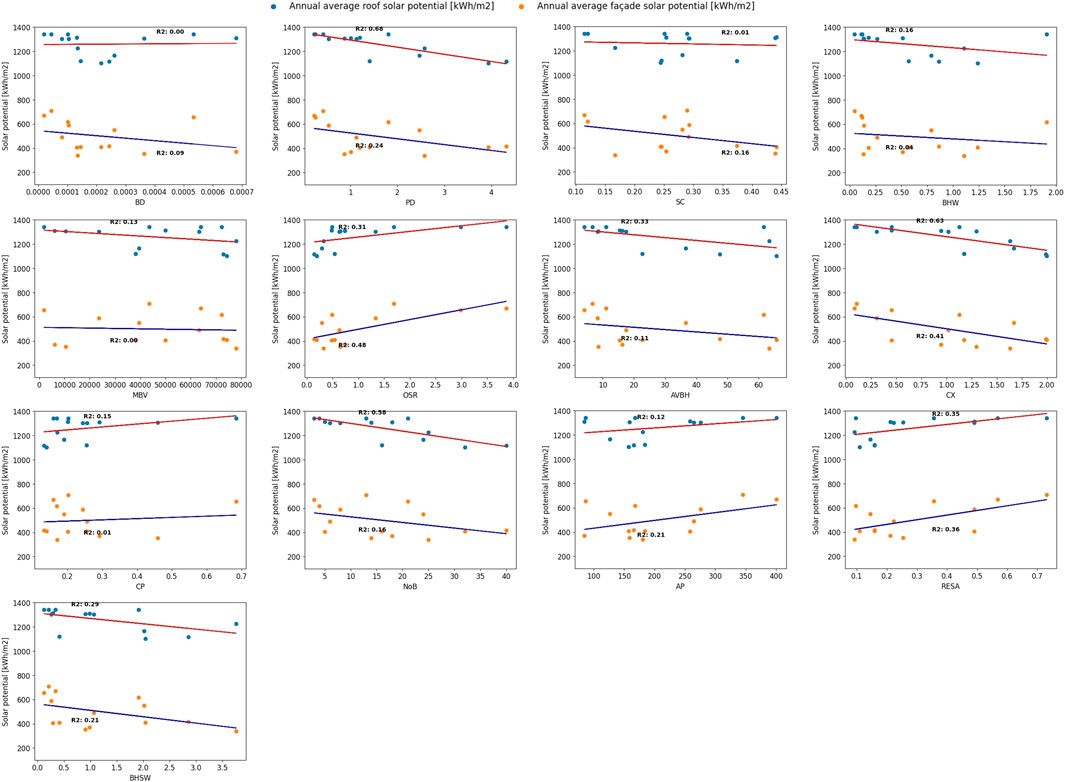
FIGURE 10. Scatter plots investigating the relationship between different density metrics (spatial distribution and geometrical characteristics of the neighbourhood-built volume) and buildings' roof and façade solar potential [kWh/m2]. The regression lines and corresponding values for R2 indicate the strength of that relationship.
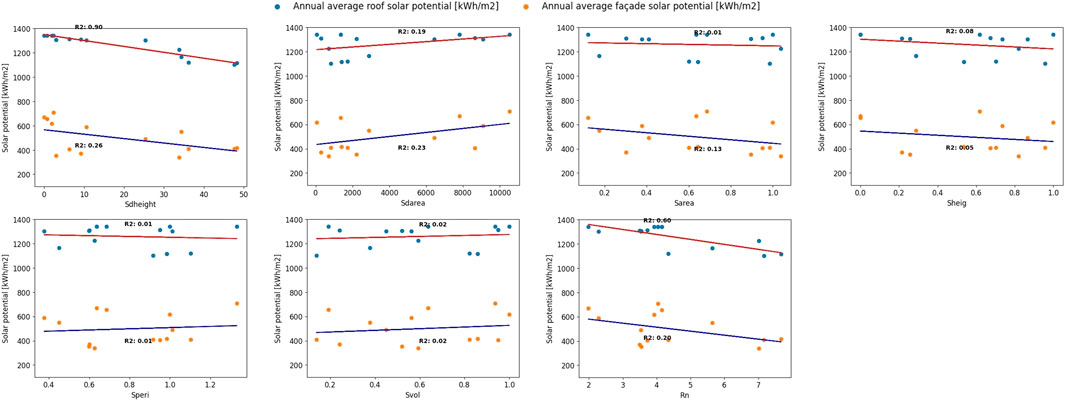
FIGURE 11. Scatter plots investigating the relationship between different density metrics (randomness and complexity) and buildings' roof and façade solar potential [kWh/m2]. The regression lines and corresponding values for R2 indicate the strength of that relationship.
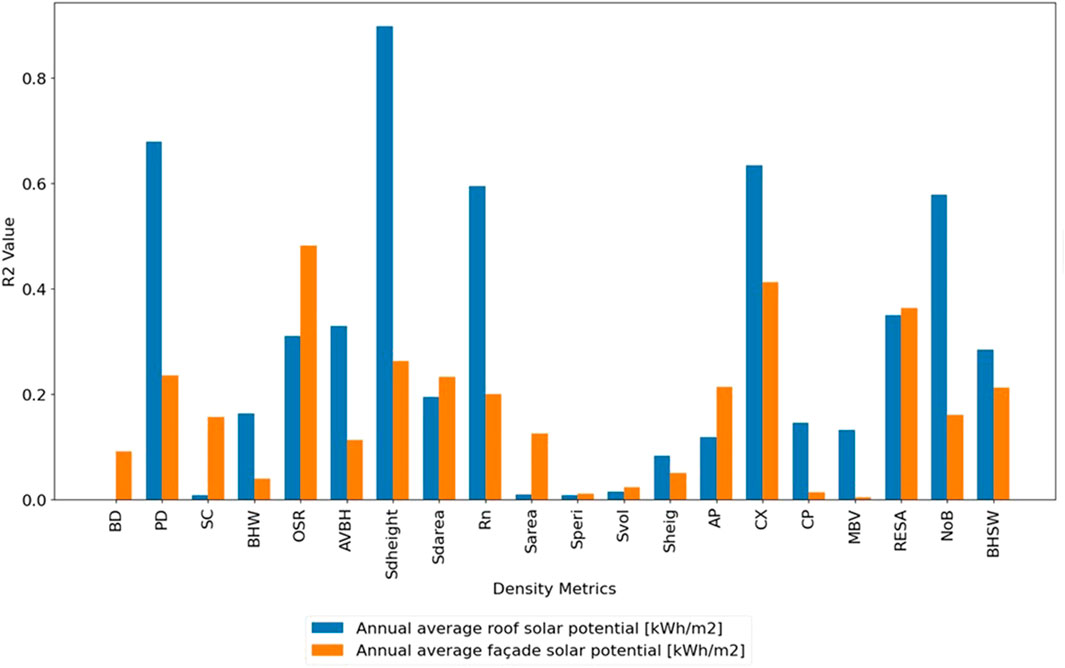
FIGURE 12. The R2 (coefficient of determination) values represent the strength of the relationship between the density metrics and the annual average roof and façade solar potential [kWh/m2] investigated in this study.
In contrast to the trends seen in the scatter graphs investigating the relationship between density metrics and neighbourhood roof solar potential, the plots for the facade solar potential did not present a clear indication of the extent of influence of each metric. In this case, the annual average facade solar potential of each neighbourhood archetype was greatly dispersed, and the absence of clustering led to relatively lower R2 values. Nevertheless, the density metric that has the highest influence on the neighbourhood facade solar potential are OSR, Cx, and RESA (open space ratio, complexity, and roof envelope to surface area), which are 0.48, 0.41, and 0.36. The listed density metrics are moderately correlated to the irradiance values. Both the CX and RESA are a factor of the facade area, hence a larger facade area of adjacent buildings may potentially cause significant overshadowing on facade surfaces. Similarly, as OSR is positively correlated with solar irradiance, spaces between buildings such that the inter-building distance is higher would lead to facade surfaces having better solar access. The non-uniform distribution of facade solar radiation intensity could be attributed primarily to their orientation and the size of surfaces (area) orientated in a particular direction, which varies even in similar neighbourhood use classifications.
7 Discussion
This Toronto-based study derived fundamental insights from the seminal Mohajeri et al. (2016) study, which explored a set of urban compactness indicators representing diverse residential neighbourhood forms in Geneva and used a least square regression approach to examine the strength of their relationship with the solar potential of the rooftops and facades. A literature review for Toronto-based studies has indicated a gap in knowledge on how density metrics representing different existing neighbourhoods and corresponding land-use classifications relate to the level of solar irradiance on building surfaces. Therefore, this study’s methodological framework, which is unique in being customized to investigate organically developed Toronto neighbourhoods, predominantly differed from the Mohajeri et al. (2016) study in four aspects: (a) the size and scales of neighbourhoods, (b) the adoption of neighbourhood archetypes that bore different use classifications, (c) the number and type of density metrics used to define the morphological characteristics of the neighbourhoods, and (d) the computational tools used to assess the solar potential. Fourteen different Toronto neighbourhood archetypes were identified; 20 different relevant density metrics that quantitatively represented the morphological characteristics of the neighbourhood built form were compiled from the literature reviewed, and the annual average solar irradiance potential of the rooftops and facades were assessed. The process entailed extracting out relevant neighbourhoods that would adequately capture the intricate variety and diversity of different use classifications, namely, Residential, Institutional, Commercial, and Employment. The results show that across all the sample neighbourhood archetypes (irrespective of the use classifications), specific density metrics were relatively better than others in terms of their influence on the solar potential of the roofs and facades. For example, density metrics, such as OSR and PD, indicated a stronger relationship with solar potential by adequately capturing how varying density values corresponding to different neighbourhood use-classificaions correlated with roof and facade solar potential. In contrast, metrics like BD and SC were less effective in explaining the same variations.
This study shows that many of the density metrics such as Sdheight, PD, Rn, and CX (standard deviation of building height, plot density, nearest neighbourhood ratio, and complexity, respectively) are negatively correlated to the roof solar potential, whereby depending upon the metric, the magnitude of influence may essentially dictate the feasibility of implementing retrofits involving active solar technologies. Certain neighbourhood use classifications, such as those categorized as Employment and Institution, fared better in terms of the rooftop solar potential inherently due to lower values corresponding to these metrics. These results also corroborate the findings on the influence of these particular metrics on solar irradiation intensity on building surfaces in the Zhu R. et al. (2020) and Mohajeri et al. (2016) studies. From the standpoint of planning active solar technology retrofits, it is thus important to consider the distribution of building heights in a neighbourhood and the proximity of buildings to one another. As per the R2 values assessed for the strength of the relationship between the density metrics and solar irradiance on the façade, no specific metric stands out as having a significant influence. On the other hand, OSR (open space ratio) and those factoring in facade area have a moderate effect on the facade solar potential. However, it is important to recognize that solar access to facades is dependent upon the position of the buildings in the neighbourhood and their specific orientation, whereby depending upon the proximity of the surface to a larger facade, there may be overshadowing. This may not be a uniform occurrence in neighbourhoods belonging to the same land-use classifications, therefore, density metrics alone cannot effectively predict the level of façade solar potential, as also demonstrated by Chatzipoulka et al. (2016). Façade solar potential in essence is a function of many intricately connected neighbourhood characteristics that greatly varies in existing conditions.
7.1 Limitations of the study
From an urban planning and neighbourhood design standpoint, the findings of this study are an important and much-needed precedent as introducing novel knowledge on a plausible methodological framework in the assessment of the state of solar accessibility and retrofit viability in Toronto neighbourhoods. The research can also help guide planning policy by providing evidence-based recommendations for increasing the solar energy generation potential of other cities in Canada. However, in light of the study’s results, it is also important to recognize the limitations of the study in terms of the methodological approach opted for.
• Small dataset
While a relatively small dataset may be pointed as a limitation of this study, it is important to emphasize that, from the standpoint of the results on the relationship between density metrics and facade solar potential, this could have been augmented to determine a more meaningful relationship between density metrics and the solar irradiance levels. It is also apparent that roof solar potential, barring some exceptions, is typically uniform across the neighbourhood use classifications whereby the study did not consider the shading from trees and other ancillary structures that could potentially have further skewed the results.
• Façade solar potential
As the objective of this study was to investigate neighbourhood-level density and morphological impacts on solar potential, the architectural features of buildings were not accounted for in the simulation analysis. However, it is important to acknowledge the implications of simplifying building facades on the study results. The exclusion of balconies and overhangs from facades of residential high-rises inevitably impacted the estimated overall annual facade solar potential, likely making the simulated values an overestimation of the irradiance in reality. The effects are greater on south-facing facades where balconies cause localized shading, whereas north-facing balconies have less significant impacts. This is especially significant for residential classifications (Commercial-Residential Employment, Commercial-Residential, Residential, Residential-Apartment, and Residential-Apartment Commercial) where balconies typically exist. In contrast, for non-residential categories (Employment and Institutional) lacking balconies, the solar potential computed is closer to that in reality.
• Case studies as a representation of different land-use sub-classifications
While the results of this study provide useful insights into which neighbourhood use classifications and building surfaces are suitable for implementing active solar technology retrofits, it is also important to note that the selected case study neighbourhoods may not be fully representative of each land-use subclassification. Given the small sample sizes analysed for each classification, the results cannot necessarily be generalised to all neighbourhood blocks categorised under those use types. Further analysis across a broader selection of neighbourhoods would be needed to determine retrofit priorities at a city-wide scale.
• Correlation between density metrics
One potential reason for the low correlation (R2 values) found between density metrics and the façade solar potential is that this study considered the average solar potential across all building facade orientations. By not differentiating based on orientation, key variables like obstruction angles were not accounted for (Catita et al., 2017; Desthieux et al., 2018; Sepúlveda et al., 2023). Thus, the averaging approach used may have skewed the relationship between neighbourhood density and facade solar potential.
• Future climatic context
The weather file (CWEC 2016) used in the study’s solar analysis provides a reasonable representation of typical meteorological conditions in Toronto based on historical weather data. However, under future climate scenarios, higher mean temperatures resulting in increased cloud cover and precipitation may contribute to reduced solar irradiance on buildings in Toronto (Li et al., 2018).
8 Conclusion
This study is an important step towards understanding the complex interrelationships between density metrics and solar irradiance of neighbourhood surfaces in Toronto. From a solar neighbourhood planning perspective, this would help architects, urban planners, and engineers alike identify existing neighbourhoods where the overall buildings’ energy use can be decreased to meet the City of Toronto’s 2040 goals. The study findings, particularly the variation of solar potential on the roofs and facades of different classifications of neighbourhoods, in addition to the connection of this with the prevailing density metric representing their morphological form, provide an evidence-based context to planning for retrofits involving active solar technologies on existing neighbourhoods buildings and identifying areas which would yield greater profitability in terms of the magnitude of the solar power generated. For example, density metrics on the Employment and Institutional neighbourhood use classifications indicate the viable potential for large-scale deployment of active solar technologies on the building rooftops. Additionally, optimizing neighbourhood form variables, specifically in regards to the density metrics that have been investigated, which may involve changing building attributes such as height, and neighbourhood density, may enhance the solar irradiation intensity on roofs and façades. This is important if ‘solar neighbourhood planning’ is prioritized at the initial stage of a new neighbourhood’s development.
The methodological framework laid out in this study is unique in that it investigates disparate neighbourhoods, whereby future studies could plausibly examine more diverse neighbourhood archetypes that have a robust number of typologies under each land-use classification, to enable exploring the application of Machine Learning (ML) algorithms. This would help minimize the variation of results, as seen in the case of scatter plots investigating the relationships between the density metric and facade solar potential. ML algorithms may also help in predicting the influence of specific density metrics and the collinearity between metrics with greater ease and accuracy.
Data availability statement
The raw data supporting the conclusion of this article will be made available by the authors, without undue reservation.
Author contributions
JH, EZ, and MH contributed to conception and design of the study. JH performed the simulations and the statistical analysis. JH and EZ wrote sections of the manuscript. MH reviewed the manuscript and advised for relevant changes. All authors contributed to the article and approved the submitted version.
Conflict of interest
The authors declare that the research was conducted in the absence of any commercial or financial relationships that could be construed as a potential conflict of interest.
Publisher’s note
All claims expressed in this article are solely those of the authors and do not necessarily represent those of their affiliated organizations, or those of the publisher, the editors and the reviewers. Any product that may be evaluated in this article, or claim that may be made by its manufacturer, is not guaranteed or endorsed by the publisher.
References
Aghamolaei, R., Azizi, M. M., Aminzadeh, B., and Mirzaei, P. A. (2020). A tempo-spatial modelling framework to assess outdoor thermal comfort of complex urban neighbourhoods. Urban Clim. 33, 100665. doi:10.1016/j.uclim.2020.100665
Amado, M., and Poggi, F. (2014). Solar urban planning: A parametric approach. Energy Procedia 48, 1539–1548. doi:10.1016/j.egypro.2014.02.174
Boccalatte, A., Thebault, M., Ménézo, C., Ramousse, J., and Fossa, M. (2022). Evaluating the impact of urban morphology on rooftop solar radiation: A new city-scale approach based on Geneva gis data. Energy Build. 260, 111919. doi:10.1016/j.enbuild.2022.111919
Catita, C., Redweik, P., Brito, M. C., Freitas, S., and Guimar, S. (2017). The importance of facades for the solar PV potential of a Mediterranean city using LiDAR data 111.
Chatzipoulka, C., Compagnon, R., and Nikolopoulou, M. (2016). Urban geometry and solar availability on façades and ground of real urban forms: using London as a case study. Sol. Energy 138, 53–66. doi:10.1016/j.solener.2016.09.005
Chicco, D., Warrens, M. J., and Jurman, G. (2021). The coefficient of determination R-squared is more informative than SMAPE, MAE, MAPE, MSE and RMSE in regression analysis evaluation, 1–24.
Chokhachian, A., Perini, K., Giulini, S., and Auer, T. (2020). Urban performance and density: generative study on interdependencies of urban form and environmental measures. Sustain. Cities Soc. 53, 101952. doi:10.1016/j.scs.2019.101952
Chow, A., Fung, A. S., and Li, S. (2014). GIS modeling of solar neighborhood potential at a fine spatiotemporal resolution. Buildings 4, 195–206. doi:10.3390/buildings4020195
City of Toronto (2022). City of Toronto zoning by-law 569-2013, as amended (office consolidation). Toronto, Ontario: City of Toronto.
City of Toronto (2013a). City of Toronto zoning by-law [WWW document]. Available at: https://map.toronto.ca/maps/map.jsp?app=ZBL_CONSULT (accessed August 24, 2020).
City of Toronto (2019). Energy efficiency report submission & modelling guidelines - for the Toronto green standard (TGS) version 3. Toronto, Ontario: City of Toronto.
City of Toronto (2021b). Net zero existing buildings strategy 1–40. Toronto, Ontario: City of Toronto.
City of Toronto (2023). Net zero homes & buildings [WWW document]. Available at: https://www.toronto.ca/services-payments/water-environment/net-zero-homes-buildings/ (Accessed July 24, 2023).
City of Toronto (2021a). TransformTO net zero strtegy - a climate action pathway to 2030 and beyond 136. Toronto, Ontario: City of Toronto.
City of Toronto (2013b). Zoning by-law interactive map aerial View of neighbourhood [WWW document]. Available at: https://map.toronto.ca/maps/map.jsp?app=ZBL_CONSULT (accessed July 26, 2023).
Czachura, A., Kanters, J., Gentile, N., and Wall, M. (2022). Solar performance metrics in urban planning: A review and taxonomy. Buildings 12, 393. doi:10.3390/buildings12040393
Desthieux, G., Carneiro, C., Camponovo, R., Ineichen, P., Morello, E., Boulmier, A., et al. (2018). Solar energy potential assessment on rooftops and facades in large built environments based on lidar data, image processing, and cloud computing. Methodological background, application, and validation in geneva (solar cadaster). Front. Built Environ. 4. doi:10.3389/fbuil.2018.00014
Environment, Climate Change Canada (2022). 2030 emissions reduction plan: Canada’s next steps to clean air and a strong economy.
Giostra, S., Masera, G., and Monteiro, R. (2022). Solar typologies: A comparative analysis of urban form and solar potential. Sustainability 14, 9023. doi:10.3390/su14159023
Google Maps (2023). Toronto [WWW document]. Available at: https://www.google.com/maps/place/Brock+Towers/@43.7559304,-79.2662172,1917m/data=!3m1!1e3!4m5!3m4!1s0x89d4d1c3740772ff:0xab62fc780b08e56c!8m2!3d43.7534842!4d-79.2626668 (accessed 22 February, 2023).
Hachem, C. (2016). Impact of neighborhood design on energy performance and GHG emissions. Appl. Energy 177, 422–434. doi:10.1016/j.apenergy.2016.05.117
Hailu, G., and Fung, A. S. (2019). Optimum tilt angle and orientation of photovoltaic thermal system for application in greater Toronto area. Canada: Sustain.
Hasan, J., Horvat, M., Riddell, C., and Wang, R. (2021). The impact of roof morphology on solar potential: making Toronto suburbs solar ready. J. Phys. Conf. Ser. 2042, 012101. doi:10.1088/1742-6596/2042/1/012101
International Energy Agency (2021). Empowering cities for a net zero future, empowering cities for a net zero future.
Kaur, J., Goyal, A., Handa, P., and Goel, N. (2022). “Solar power forecasting using ordinary least square based regression algorithms,” in 2022 IEEE Delhi Sect. Conf. DELCON, New Delhi, India, 11-13 February 2022, 1–6.
Li, Z., Huang, G., Huang, W., Lin, Q., Liao, R., and Fan, Y. (2018). Future changes of temperature and heat waves in Ontario, Canada. Theor. Appl. Climatol. 132, 1029–1038. doi:10.1007/s00704-017-2123-8
Lobaccaro, G., Lisowska, M. M., Saretta, E., Bonomo, P., and Frontini, F. (2019). A methodological analysis approach to assess solar energy potential at the neighborhood scale. Energies 12, 3554. doi:10.3390/en12183554
Mohajeri, N., Gudmundsson, A., Kunckler, T., Upadhyay, G., Assouline, D., Kämpf, J. H., et al. (2019). A solar-based sustainable urban design: the effects of city-scale street-canyon geometry on solar access in geneva, switzerland. Appl. Energy 240, 173–190. doi:10.1016/j.apenergy.2019.02.014
Mohajeri, N., Upadhyay, G., Gudmundsson, A., Assouline, D., Kämpf, J., and Scartezzini, J. L. (2016). Effects of urban compactness on solar energy potential. Renew. Energy 93, 469–482. doi:10.1016/j.renene.2016.02.053
Munari, C., and Roecker, C. (2015). Solar energy promotion & urban context protection: leso-qsv (quality-site-visibility) method. Plea 2015 Bol. Archit. Revolut.
Natanian, J., Aleksandrowicz, O., and Auer, T. (2019). A parametric approach to optimizing urban form, energy balance and environmental quality: the case of mediterranean districts. Appl. Energy 254, 113637. doi:10.1016/j.apenergy.2019.113637
Natanian, J., Luca, F. D., Wortmann, T., and Capeluto, G. (2021). The solar block generator: an additive parametric method for solar driven urban block design. J. Phys. Conf. Ser. 2042, 012049. doi:10.1088/1742-6596/2042/1/012049
Pan, W., and Du, J. (2021). Effects of neighbourhood morphological characteristics on outdoor daylight and insights for sustainable urban design. J. Asian Archit. Build. Eng. 21, 342–367. doi:10.1080/13467581.2020.1870472
Pan, W., and Du, J. (2022). Effects of neighbourhood morphological characteristics on outdoor daylight and insights for sustainable urban design. J. Asian Archit. Build. Eng. 21, 342–367. doi:10.1080/13467581.2020.1870472
Sarralde, J. J., Quinn, D. J., Wiesmann, D., and Steemers, K. (2015). Solar energy and urban morphology: scenarios for increasing the renewable energy potential of neighbourhoods in london. Renew. Energy 73, 10–17. doi:10.1016/j.renene.2014.06.028
Sepúlveda, A., Seyed Salehi, S. S., De Luca, F., and Thalfeldt, M. (2023). Solar radiation-based method for early design stages to balance daylight and thermal comfort in office buildings. J. Build. Eng. doi:10.1016/j.foar.2023.07.001
Shahsavar, A., Moayedi, H., Al-Waeli, A. H. A., Sopian, K., and Chelvanathan, P. (2020). Machine learning predictive models for optimal design of building-integrated photovoltaic-thermal collectors. Int. J. Energy Res. 44, 5675–5695. doi:10.1002/er.5323
Shi, Z., Fonseca, J. A., and Schlueter, A. (2021). A parametric method using vernacular urban block typologies for investigating interactions between solar energy use and urban design. Renew. Energy 165, 823–841. doi:10.1016/j.renene.2020.10.067
Statistics Canada, (2022). Canada’s large urban centres continue to grow and spread [WWW Document]. Available at: https://www150.statcan.gc.ca/n1/daily-quotidien/220209/dq220209b-eng.htm (accessed July 24, 2023).
Statistics Canada, (2023). Canada’s population estimates: record-high population growth in 2022 [www document]. Available at: https://www150.statcan.gc.ca/n1/daily-quotidien/230322/dq230322f-eng.htm (accessed July 26, 2023).
The World Bank (2019). World development indicators [WWW document]. Available at: https://data.worldbank.org/indicator/SP.URB.TOTL.IN.ZS?end=2019&locations=CA&start=1960&view=chart (accessed September 21, 2020).
Toronto Public Health (2012). The walkable city: Neighbourhood design and preferences, travel choices and health.
Waibel, C., Evins, R., and Carmeliet, J. (2017). Efficient time-resolved 3D solar potential modelling. Sol. Energy 158, 960–976. doi:10.1016/j.solener.2017.10.054
Wang, P., Liu, Z., and Zhang, L. (2021). Sustainability of compact cities: A review of inter-building effect on building energy and solar energy use. Sustain. Cities Soc. 72, 103035. doi:10.1016/j.scs.2021.103035
Wang, Y., Berardi, U., and Akbari, H. (2015). The urban heat island effect in the city of Toronto. Procedia Eng. 118, 137–144. doi:10.1016/j.proeng.2015.08.412
Zhu, D., Song, D., Shi, J., Fang, J., and Zhou, Y. (2020a). The effect of morphology on solar potential of high-density residential area: A case study of shanghai. Energies 13, 2215. doi:10.3390/en13092215
Keywords: solar neighbourhoods, urban morphology, regression, urban density metrics, roof and façade solar potential
Citation: Hasan J, Zheng E and Horvat M (2023) A least squares regression-based approach in the investigation of the influence of density metrics of 14 distinct Toronto neighbourhoods on the roof and facade solar potential. Front. Built Environ. 9:1248259. doi: 10.3389/fbuil.2023.1248259
Received: 26 June 2023; Accepted: 22 August 2023;
Published: 21 September 2023.
Edited by:
Gabriele Lobaccaro, Norwegian University of Science and Technology, NorwayReviewed by:
Abel Sepulveda Luque, Karlsruhe Institute of Technology (KIT), GermanyFrancesca Poggi, NOVA University of Lisbon, Portugal
Copyright © 2023 Hasan, Zheng and Horvat. This is an open-access article distributed under the terms of the Creative Commons Attribution License (CC BY). The use, distribution or reproduction in other forums is permitted, provided the original author(s) and the copyright owner(s) are credited and that the original publication in this journal is cited, in accordance with accepted academic practice. No use, distribution or reproduction is permitted which does not comply with these terms.
*Correspondence: Javeriya Hasan, amF2ZXJpeWEuaGFzYW5AdG9yb250b211LmNh