 Weronika Sredniawa
 Bartlomiej Skawina
 Jorge Recio Garcia2
- 1Department of Civil, Environment and Natural Resources Engineering Division of Mining and Rock Engineering, Luleå University of Technology, Luleå, Sweden
- 2Luossavaara-Kiirunavaara Aktiebolag (LKAB), Kiruna, Sweden
Ore passes play a vital role in underground mining operations by facilitating the gravity-driven movement of ore from production levels to lower levels. Failure of the ore pass has serious consequences, including possible production disruptions and substantial financial investments in reconstruction or rehabilitation. Failure mechanisms are often associated with rock mass quality, stress conditions, and wear of the ore pass walls. This study investigated the degradation of ore pass walls using scanning data at LKAB’s Kiirunavaara mine in Sweden. Geotechnical information obtained from various sources aided in further understanding the ore passes’ conditions. The study revealed variations in the ore pass growth rates, highlighting potential stability concerns and the correlation between throughput and pass growth. The findings underscore the need for continuous monitoring and regular inspection to manage wall degradation. The paper proposes potential rehabilitation measures to ensure the stability and safety of ore passes in mining operations.
1 Introduction
Ore passes are a critical component of underground mining operations, used to transfer ore by gravity from production levels to the levels below (Hambley, 1987; Beus et al., 2001; Esmaieli et al., 2013; Skawina et al., 2018). An ore pass failure causes significant problems; redevelopment or rehabilitation of the pass often leads to production disturbances and requires large financial investments (Esmaieli et al., 2013; Skawina et al., 2018). Mechanisms leading to ore pass failure are often associated with the quality of the rock mass, stress conditions, and wearing of the ore pass walls (Stacey and Swart, 1997; Beus et al., 2001). The extent of the damage can be significantly affected by the mechanical properties of the rock mass of the ore pass walls; that is, the weaker the rock, the greater the wear of the walls (Stacey and Swart, 1997; Hadjigeorgiou et al., 2005; Hadjigeorgiou and Mercier-Langevin, 2008; Esmaieli and Hadjigeorgiou, 2009). Particle shape, hardness, density, and size distribution are key material properties responsible for the wearing of the walls (Esmaieli and Hadjigeorgiou, 2009). The orientation of an ore pass is another significant factor affecting ore pass stability; unfavorable orientation, along the bedding, can accelerate the ore pass expansion (Stacey et al., 2005; Hadjigeorgiou and Mercier-Langevin, 2008). The wear of ore pass walls is intensified when repeated blasting aims at restoring material flow (Hadjigeorgiou and Mercier-Langevin, 2008). To prevent excessive wear, ore passes are often lined with abrasion-resistant materials (De La Vergne, 2003). Some studies suggest keeping the ore pass full can reduce the wear of the walls (Hambley, 1987; Hadjigeorgiou and Mercier-Langevin, 2008; Skawina et al., 2022). Sjoberg et al. (2003) conducted a research project at the LKAB Kiirunavaara mine in Sweden, analyzing the stability of the ore passes with a combination of numerical modeling, empirical data, and engineering judgment. They found rock conditions, stress state, and wear were the most important controlling factors. The study of ore pass degradation is complex, as it is usually the result of multiple mechanisms operating simultaneously (Hadjigeorgiou et al., 2005). Hadjigeorgiou et al. (2005) studied the probable failure mechanisms in Canadian mines and found 53% of the studied ore passes experienced structural failure; 27% of the failures were caused by abrasion, 23% were caused by an impact, and 17% were stress-related. Hadjigeorgiou et al. (2005) observed that the rate of abrasion is influenced by the abrasive nature of the ore pass walls and by the density of the transported material. It has also been observed that the structural integrity of the ore pass does not appear to be compromised by wall wear when only a relatively few fractures, such as joints, faults, dykes, and veins, are present (Hadjigeorgiou et al., 2005). Wear zones or impact damage can be caused by falling material and boulder collisions (Sjoberg et al., 2003) or due to the interaction of moving material with the ore pass walls (Hadjigeorgiou et al., 2005). The area where wall damage is caused by impact tends to be at the intersection of ore pass and finger raises (Hadjigeorgiou et al., 2005; Hadjigeorgiou and Mercier-Langevin, 2008; Esmaieli and Hadjigeorgiou, 2009). In general, the footwall surface of the ore pass has the highest wear, but this may not always be the case when there is an interaction with weak rock and stress scaling (Stacey and Swart, 1997). Scaling is a stress-induced fracture, and it occurs when the stress on the ore pass walls is higher than the rock’s strength (Stacey and Swart, 1997; Stacey et al., 2005). Scaling is an issue, especially in deep mines, as it results in significant enlargement of the ore pass (Stacey et al., 2005) and can intensify the wear of the ore pass walls (Stacey and Swart, 1997; Esmaieli and Hadjigeorgiou, 2009; Esmaieli et al., 2013).
Recent studies employ scans and numerical models to simulate the mechanical behavior of the rock mass under specific conditions. Esmaieli et al. (2013) used a two-stage numerical method to enhance understanding of ore pass failure mechanisms and Esmaieli and Hadjigeorgiou (2014) conducted a series of numerical experiments to explore how rock mass foliation affects damage on ore pass walls from impacts. Gohl et al. (2014) assessed the feasibility of utilizing a micro aerial vehicle (MAV) for autonomous inspection and 3D reconstruction of underground mines, they also evaluated the accuracy of the data and its potential for use in a fully autonomous mine inspection setup. Li and Qin (2016) introduced a novel ore pass repair method, that incorporates precise detection and modeling techniques, enabling the integration of repair and protection processes. Benecke et al. (2017), presented advancements in technology for inspecting mine shafts, including completed developments and ongoing projects Adjiski et al. (2020) investigated the impact of different angles between the ore pass and finger raise configurations using Discrete Element Method (DEM), with the objective to minimize both hang-ups and damage to ore pass walls. Parhusip et al. (2021) provided a comprehensive description of the utilization of LiDAR drone technology in underground mines, concluding that this technology has the potential to improve the quality of survey data in a safe manner, and support sustainable production.
This study analyzed the degradation process of ore pass walls using scanning data. The findings highlight the importance of continuous inspection of ore passes in mining operations where regular inspections and monitoring of the pass condition are necessary to manage degradation.
2 Case study - Kiirunavaara mine
The LKAB-owned Kiirunavaara mine, situated in northern Sweden, is an underground mine (Table 1). Using the sublevel caving method, the mine extracts iron ore from a 4 km long, 80 m thick orebody of unknown depth, with an annual 26.9 Mtonnes (2018) of iron ore production. The rock mass quality in Kiirunavaara is typically good, with an average Rock Mass Rating (RMR) of 60 for the footwall. However, it is important to note that rock conditions vary. The dominant joint orientations in the area are north-south (parallel to the orebody) and east-west; both have steep dip angles (Sjoberg et al., 2003). The ‘roof’ of the ore pass is in the hangingwall, and its ‘floor’ is located in the footwall (Sjoberg et al., 2003). The footwall is categorized into three groups: trachyandesite rocks, also known as ‘syenite porphyries’ (Sp1,2,4), nodular porphyries (Sp3), and altered volcanic rocks (Sp5) (Andersson, 2021). Brick-red granite is common in the lower sections (Andersson, 2021). Rhyodacites, known as ‘quartz-bearing porphyries’ (Qp), are in the hangingwall, along with a network of porphyry dyke (Dp) rocks (Andersson, 2021).
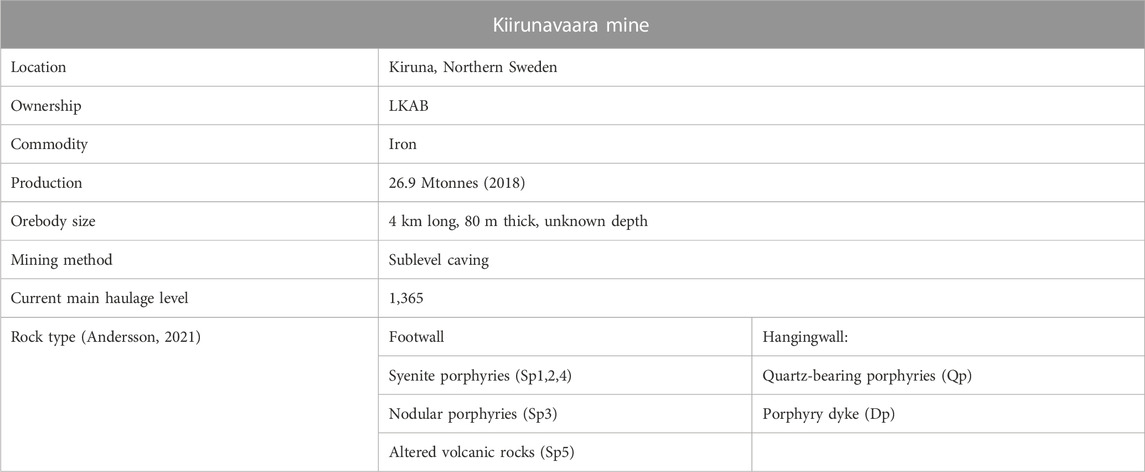
TABLE 1. Kiirunavaara mine information.
The primary hauling level is currently located at the 1,365 level. The mine is divided into 10 main production blocks, each consisting of two to four ore passes. The ore passes are spaced 30–50 m apart and split into three sections, allowing rehabilitation and inspection of specific sections rather than the entire shaft length. The ore passes have a circular cross-section with a designed diameter of 3 m and an inclination of approximately 60°. A simplified version of ore pass configuration is presented in Figure 1.
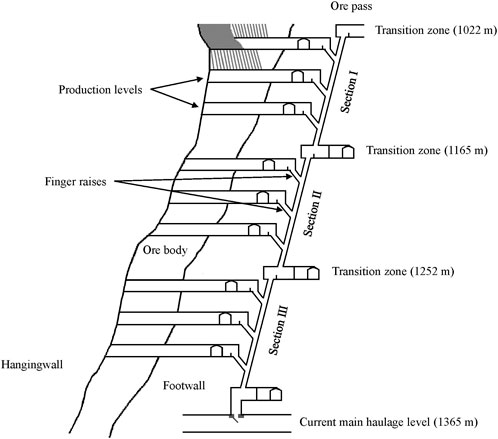
FIGURE 1. Simplified version of the ore pass configuration in Kiirunavaara mine.
3 Methodology
This study focuses on four shafts (OP1 to OP4). The primary consideration for selecting a shaft was to maximize the number of available scans. The scanning process in Kiirunavaara uses ore pass ‘buggies’ fitted with video recording cameras and drones equipped with LiDAR. The LiDAR drone technology proves to be a valuable tool, offering a safer, more efficient, and data-rich solution for surveying tasks in underground mining environments (Parhusip et al., 2021). Data collected from scans and information provided by the mine were used to determine the rate of wear of the ore passes. The volume growth between each scan was estimated by subtracting the volume of the previous scan from the volume of the current scan. The scans were processed in Deswik.CAD and include information about the quantity of material passing through the shafts between scans, collected by the GIRON system. The area above 1,022 m was excluded from calculations and analyses since it is located above the previous main haulage level. The ore passes are divided into three sections: Section 1—from 1,022 to 1,165 m; Section 2—from 1,165 to 1,252 m; Section 3—from 1,252 to 1,338 m. Each section was analyzed separately in each ore pass. Another important criterion was that the chosen shaft had not undergone prior rehabilitation. This criterion was established to observe the natural growth of the ore pass before any rehabilitation efforts took place. In this mine, shaft rehabilitation involves the pouring of concrete over the shafts and subsequently raise bored to their original form.
3.1 Ore pass information
Geotechnical information included data from drill cores, internal reports, and interviews with qualified specialists from the mine. However, some information was unavailable. In such instances, the parameters were estimated by considering data from the surrounding area and consulting with experts in conversations and discussions. The GIRON program (a program used by LKAB to store operational data) provided the throughput information, and the forecasted tonnes yet to pass through the ore pass were derived from the life of mine plan (LOMP). Additional information was obtained using Deswik.CAD and internal reports. A summary of the collected data is presented in Table 2.
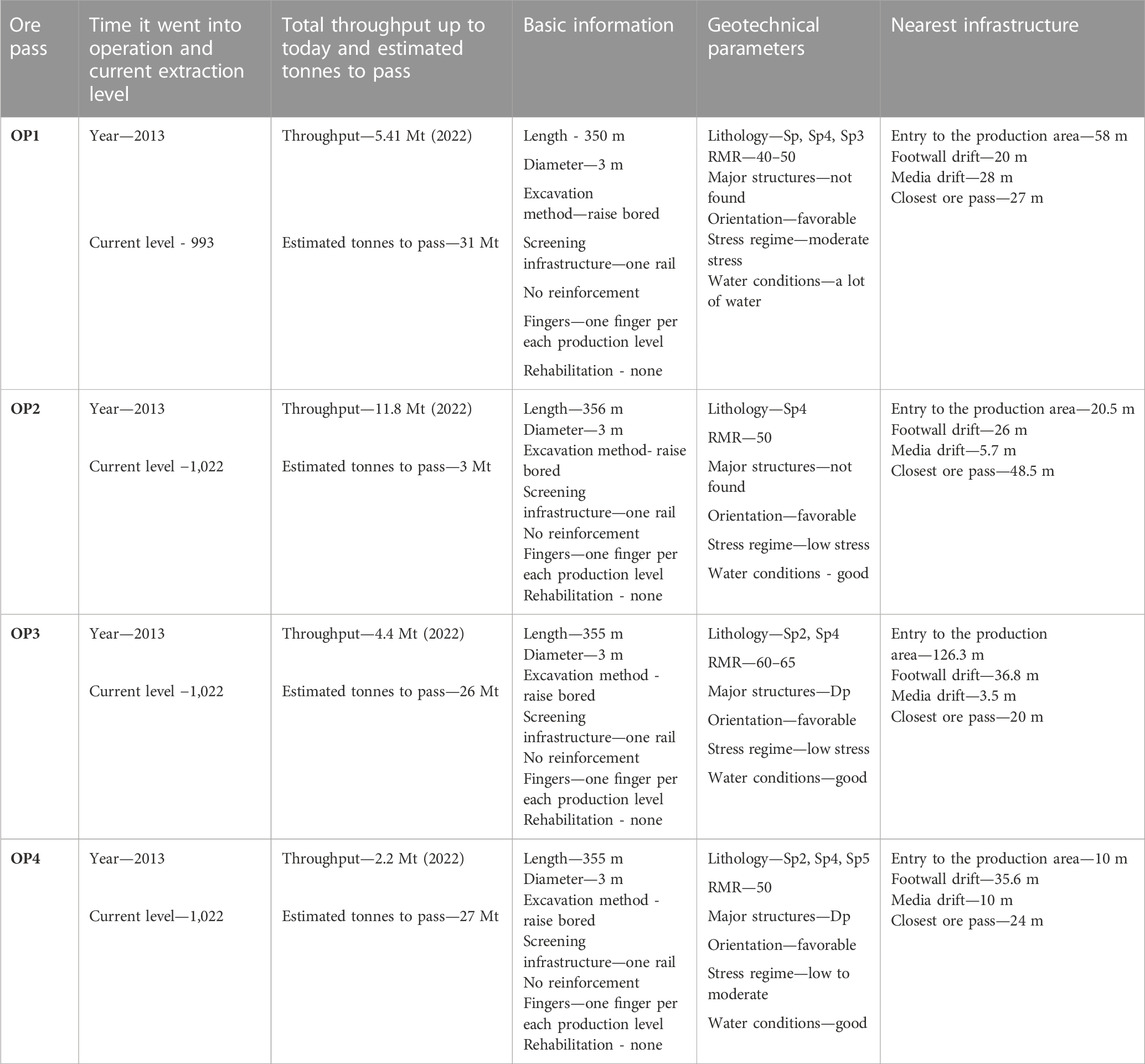
TABLE 2. Ore pass information (June 2023).
All ore passes in this study are raise bored, with a diameter of 3 m. The length of the ore passes ranges from 350 to 355 m. The ore passes are operated empty with a scalper screening infrastructure, and no reinforcement or lining is used. All the studied ore passes have a favorable orientation with respect to the bedding. It was observed that there was a significant amount of water in OP1, and not a lot of water in the other ore passes.
The extraction level of OP1 is currently at a depth of 993 m. By 2022, approximately 5.41 Mt of ore had been extracted through the OP1 shaft, and the mine expects another 31 Mt (this value can vary depending on the production plan changes and availability of the ore pass) to be pushed through that ore pass. The walls of the ore pass primarily consist of syenite porphyries and nodular porphyries. Overall, the rock quality is competent, with a moderate level of stress. There is no significant presence of major structures, or no specific information on them is available. The shortest distances measured for OP1 show that OP1 is located 58 m from the entry to the production area, 20 m from the footwall drift, and 28 m from the media drift. The closest ore pass is 27 m away.
The extraction level of OP2 is situated at a depth of 1,022 m. By 2022, 11.8 Mt of ore had been transported through the shaft, with an estimated 3 Mt remaining to be pushed through. The walls of the ore pass mainly comprise syenite porphyries. The overall rock quality is considered to be fairly good, with low levels of stress. As in OP1, according to current information, there is no significant presence of major structures. The shortest distance between the entry to the production area and OP2 is 20.5 m. The footwall drift is 26 m away, the media drift is 5.7 m away, and the closest ore pass is 48.5 m away.
The extraction level of OP3 is situated at a depth of 1,022 m. By 2022, 4.4 Mt of ore had passed through the shaft, with an estimated remaining 26 Mt yet to be pushed through. The walls of the ore pass are primarily composed of syenite porphyries. There is a porphyry dyke located in close proximity to the shaft. The shortest distance between OP3 and the entry to the production area is 126 m. The footwall drift is 36.8 m away, the media drift is 3.5 m away, and the closest ore pass is 20 m away.
The current extraction level of OP4 is at a depth of 1,022 m. By 2022, 2.2 Mt of ore had been pushed through the shaft, leaving an estimated 27 Mt yet to be transported. The walls of the ore pass mainly consist of syenite porphyries. The overall rock quality is considered to be good, with low to moderate stress levels. A porphyry dyke is situated in the vicinity of the shaft. The shortest distance to the entry to the production area is located 10 m from OP4. The footwall drift is 35.6 m away, the media drift is 10 m away, and the closest ore pass is 24 m away.
3.2 Scans
Scans were collected from the mine at different times between 2016 and 2022. Regular scans were not previously conducted, so there was a limited quantity of available data. In some cases, the scanning process was conducted only in one section, thus requiring the extrapolation of data from previous scans. In such cases, it is possible that the ore passes may have already undergone enlargement, but this was not visually observed. To determine the rate of wear of the ore passes, the volume growth between each scan was estimated by subtracting the volume of the previous scan from the volume of the current scan. The scans were processed in Deswik.CAD (Figure 2). The designed volume of the ore passes is indicated by V0, and they were put into operation in 2013. The V1 scans vary: OP1 V1 stands for the 2017 scan, OP2 V1 indicates the 2016 scan, and OP3 V1 and OP4 V1 are the 2020 scan. V2 stands for the 2022 scan.
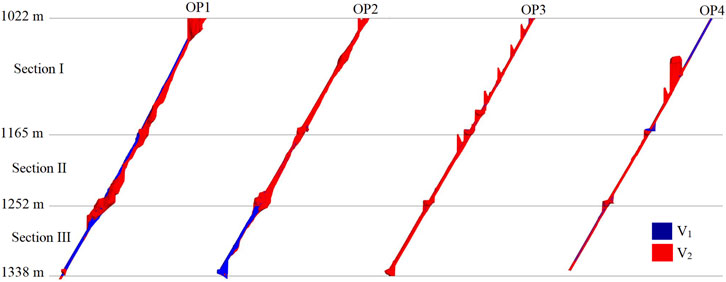
FIGURE 2. Scans of selected ore passes.
Table 3 contains the data on the volume of the shafts obtained from scans using Deswik.CAD. Table 4 includes information about the quantity of material passing through the shafts between scans, collected by the GIRON system.
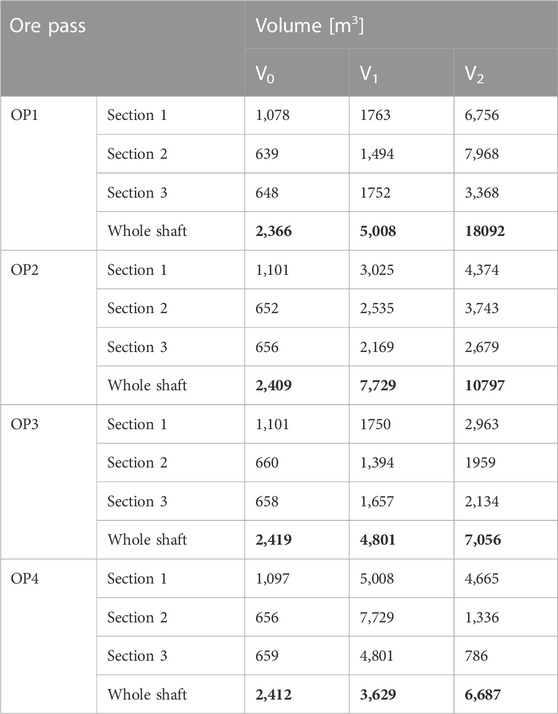
TABLE 3. Data from scans.
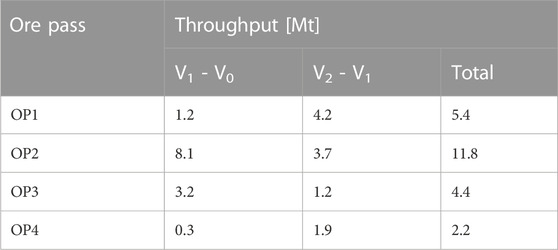
TABLE 4. Material passing through the shafts.
4 Results
This study evaluated the growth of ore passes using scanning data and other information collected from the Kiirunavaara mine. The Deswik.CAD software was used during the analysis for estimating the volumes. The volumes from the scans are also used for estimating the costs and time required for rehabilitation activities. The results of the growth rates of the ore passes are shown in Figure 3. As the figure shows, the passes had different growth patterns with the highest growth for OP1.
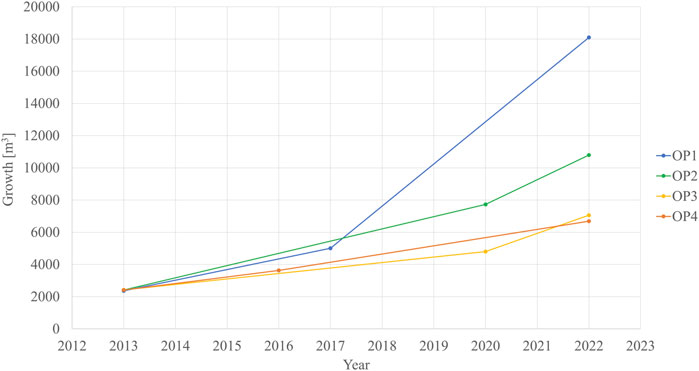
FIGURE 3. Growth chart.
In addition, Table 5 contains information on increments in volume for each section of the four studied ore passes and the results of the collected scans presented in Table 3.
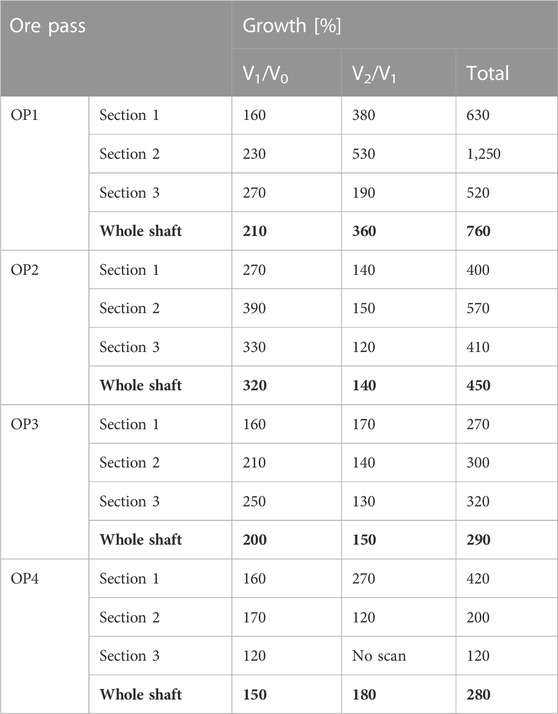
TABLE 5. Ore pass growth data.
5 Discussion
Based on the information in Figure 3 and Table 3–5, and the scans conducted in OP1 in May 2017 (V1) and March 2022 (V2) show a 210% increase from the designed value (V0) of the first scan, with a throughput of 1.24 Mt. Between the first and second scans, the ore pass increased 3.6 times and passed a total of 4.17 Mt of material. Over the whole period, the ore pass grew 7.65 times and passed 5.41 Mt of material. This represents a significant increase in volume, indicating the ore pass experienced accelerated growth over time which is a concern for future stability in OP1. Further investigation and monitoring of this ore pass are recommended to ensure its stability and to address any potential issues arising from the growth patterns. Moreover, the presence of water in OP1 poses additional risks, such as degradation and mud rushes. Scans conducted in OP2 in December 2020 (V1) and February 2022 (V2) show an increase of 320%, with a throughput of 8.1 Mt. Between the first and second scans, the ore pass increased 1.4 times and passed 3.73 Mt of material. In total, the ore pass grew 4.4 times and passed 11.8 Mt of material. OP2 exhibited moderate growth between the scans, with the largest increase observed in Section 2. Despite handling the largest amount of material among all ore passes, OP2 did not experience the greatest growth among the others. It is probably relatively better rock quality and lower stress contributing to less structural damage. Regular monitoring and scanning are recommended to manage OP2’s growth and ensure safe and efficient mining operations. Scans conducted in OP3 in November 2020 (V1) and May 2022 (V2) show an increase of 200%, with a throughput of 3.2 Mt. Between the first and second scans, the ore pass increased 1.4 times and passed 1.2 Mt of material. Overall, the ore pass grew almost 3 times and passed 4.4 Mt of material. The largest increase was observed in the last section. OP3 exhibited a relatively lower growth rate than the other passes. The shape of the enlargements in Section 1 is caused by the finger raises. While no immediate rehabilitation is needed, regular monitoring and scanning are recommended to ensure the continued safe operation of OP3. Scans conducted in OP4 in May 2016 (V1) and December 2022 (V2) show an increase of 150%, with a throughput of 0.3 Mt. Between the first and second scans, the ore pass grew 1.8 times and passed 1.86 Mt material. Overall, the ore pass increased its volume 2.8 times and let through 2.17 Mt of material. The biggest increase was observed in the first section, in the finger raise. Rehabilitation and regular inspections are recommended to manage the growth in the finger raise in Section 1 and ensure its continued safe and efficient operation.
The recommendations and potential cause on the ore pass growth is shown in Table 6. As the table shows, in the first two ore passes (OP1 and OP2), the potential cause was the impact of falling and bouncing rock; in the other two (OP3 and OP4), the potential cause was the closeness of nearby infrastructure and other openings. The table also provides recommendations for each ore pass.
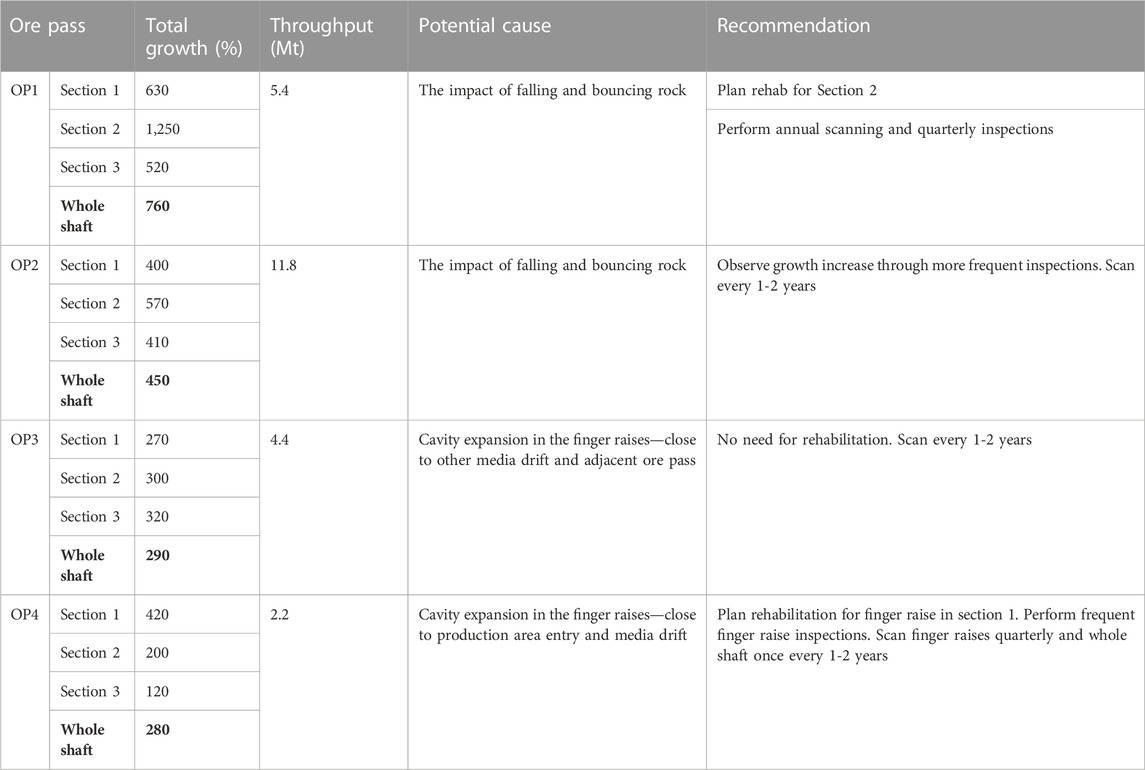
TABLE 6. Ore pass recommendation.
For all the shafts, the more transported material, the greater the growth. This observation suggests a potential correlation between the volume of transported material and the extent of ore pass growth. It also suggests the unfavorable stress regime and geotechnical conditions speed up the growth process. Information gathered from inspections and scans can provide information on the overbreak of ore passes and suggest guidelines on when rehabilitation should start. Further observations can be made if caving does not influence the stability of nearby infrastructure or cause production disturbances.
6 Conclusion
This study analysed the degradation of ore pass walls in Kiirunavaara mine in northern Sweden using scanning data and found the growth rates of the ore passes varied. The findings indicate the importance of the continuous inspection of ore passes in mining operations; however, the frequency of scanning was found to be subject to various considerations, including the availability of resources, implementation plans, and challenges faced by the mine. The current method of analyzing the scans has its limitation related to the type of equipment used and frequency and historical information of the past scans as in some cases there are not many scans available. The credibility of the result was confirmed by video inspections.
Based on the analysis of the data, the following conclusions have been reached.
- OP1 showed a significant volume increase over time, indicating accelerated growth. OP1 had the highest expansion overall, which could have been caused by lower rock and stress conditions. Water presence in OP1 may accelerate degradation and lead to potential issues such as mud rushes.
- OP2 showed moderate growth. OP2 has better rock quality than the other ore passes; this may explain why its structural damage was not as severe despite handling the largest amount of material.
- OP3 and OP4 had slow growth rates. The first sections showed the most significant growth, in the finger raises. In OP3, it might be sufficient to rehabilitate only this specific area. However, as throughput increases, it is recommended to increase the frequency of inspections. The volumes revealed by scans can serve as the basis for the estimation of the costs and time required for rehabilitation.
- Ideally, ore passes with increased throughput should be scanned every 1–2 years. However, when critical overgrowth is observed, more frequent scanning is advisable, i.e., every few months.
To ensure the long-term stability and structural integrity of ore passes, it is essential to conduct comprehensive investigations into the causes of the observed growth patterns. Factors such as geological conditions, design specifications, and operational practices should be thoroughly evaluated. Implementing monitoring systems to track the growth and structural behavior of ore passes over time would provide valuable data for ongoing assessment and timely intervention if necessary. By addressing these issues proactively, the mine can mitigate potential risks and ensure the continued safe and efficient operation of the ore pass systems.
The future work should include implementation of continuous monitoring systems to track the growth and structural behavior of ore passes over time. The scanning process can be optimized by develop techniques to minimize the time required for scanning, such as improved scanning methodologies or scanning during scheduled maintenance shutdowns to reduce production stops.
Data availability statement
The raw data supporting the conclusion of this article will be made available by the authors, without undue reservation.
Author contributions
WS and BS contributed to the conception and design of the study. JR and JG collected the data. WS, JG, and BS performed the analysis of the collected data. WS wrote the first draft of the manuscript. All authors contributed to manuscript revision, read, and approved the submitted version.
Conflict of interest
The authors declare that the research was conducted in the absence of any commercial or financial relationships that could be construed as a potential conflict of interest.
Publisher’s note
All claims expressed in this article are solely those of the authors and do not necessarily represent those of their affiliated organizations, or those of the publisher, the editors and the reviewers. Any product that may be evaluated in this article, or claim that may be made by its manufacturer, is not guaranteed or endorsed by the publisher.
References
Adjiski, V., Panov, Z., Popovski, R., and Karanakova Stefanovska, R. (2020). Implementation of discrete element method to evaluate the design and material flow in ore pass systems.
Andersson, U. B. (2021). Compilation and evaluation of uniaxial compressive strength tests of rocks from Kiirunavaara. LKAB Investigation. 20061.
Benecke, N., Engelhardt, H., Heyduk, A., Jendryz, M., Jung, B., Kleta, H., et al. (2017). iDeepMon–intelligent deep mine shaft inspection and monitoring. BHM Berg-und Hüttenmännische Monatsh. 162, 430–433. doi:10.1007/s00501-017-0648-x
Beus, M. J., Pariseau, W. G., Stewart, B. M., and Iverson, S. R. (2001). “Design of ore passes,” in Underground mining methods: engineering fundamentals and international case studies, 627–634.
Esmaieli, K., Hadjigeorgiou, J., and Grenon, M. (2013). Stability analysis of the 19A ore pass at Brunswick mine using a two-stage numerical modeling approach. Rock Mech. rock Eng. 46, 1323–1338. doi:10.1007/s00603-013-0371-1
Esmaieli, K., and Hadjigeorgiou, J. (2014). Impact-induced damage on foliated ore pass walls. CIM J. 5 (1), 39–47.
Esmaieli, K., and Hadjigeorgiou, J. (2009). “Influence of finger configuration on degradation of ore pass walls,” in Proceedings of the 3rd CANUS rock mechanics symposium Editors M. Diederichs, and G. Grasselli Toronto.
Gohl, P., Burri, M., Omari, S., Rehder, J., Nikolic, J., Achtelik, M., et al. (2014). “Towards autonomous mine inspection,” in Proceedings of the 2014 3rd International Conference on Applied Robotics for the Power Industry, Foz do Iguacu, Brazil, 14-16 October 2014 (IEEE), 1–6.
Hadjigeorgiou, J., Lessard, J. F., and Mercier-Langevin, F. (2005). Ore pass practice in Canadian mines. J. South. Afr. Inst. Min. Metallurgy 105 (11), 809–816.
Hadjigeorgiou, J., and Mercier-Langevin, F. (2008). “Estimating ore pass longevity in hard rock mines,” in The 42nd US rock mechanics symposium (USRMS) (OnePetro).
Li, C., and Qin, H. (2016). A new ore pass repair method based on cavity auto scanning laser system accurate detection technology. Int. J. Min. Mineral Eng. 7 (1), 37–50. doi:10.1504/ijmme.2016.074594
Parhusip, A., Hutauruk, B., Meigy, E., and Widodo, A. (2021). “Use of drones with LiDAR technology in PT. Freeport Indonesia underground mines,” in Proceedings of the TPT XXX Kongres XI PERHAPI 2021. Jakarta.
Sjoberg, J., Lundman, P., Nordlund, E., and Quinteiro, C. (2003). “Stability analysis of ore passes in the Kiirunavaara mine,” in 10th ISRM congress (OnePetro).
Skawina, B., Greberg, J., Salama, A., and Gustafson, A. (2018). The effects of orepass loss on loading, hauling, and dumping operations and production rates in a sublevel caving mine. J. South. Afr. Inst. Min. Metallurgy 118 (4), 409–418. doi:10.17159/2411-9717/2018/v118n4a11
Skawina, B., Salama, A., Gunillasson, J., Strömsten, M., and Wettainen, T. (2022). Comparison of productivity when running filled, near-empty, or flow-through orepass using Discrete event simulation. Mining 2 (2), 186–196. doi:10.3390/mining2020011
Stacey, T. R., and Swart, A. H. (1997). Investigation into draw points, tips, ore passes and chutes. Saf. mines Res. Advis. Comm. 1, 105.
Keywords: ore passes, wall degradation, growth rate, scanning data, monitoring, underground mining
Citation: Sredniawa W, Skawina B, Garcia JR and Rapp J (2023) Analyzing degradation of ore pass walls in Kiirunavaara mine using scanning data. Front. Built Environ. 9:1250671. doi: 10.3389/fbuil.2023.1250671
Received: 30 June 2023; Accepted: 28 August 2023;
Published: 14 September 2023.
Edited by:
Hesam Dehghani, Hamedan University of Technology, IranReviewed by:
Parviz Sohrabi, Shahrood University of Technology, IranPavlo Maruschak, Ternopil Ivan Pului National Technical University, Ukraine
Viktoria Mannheim, University of Miskolc, Hungary
Copyright © 2023 Sredniawa, Skawina, Garcia and Rapp. This is an open-access article distributed under the terms of the Creative Commons Attribution License (CC BY). The use, distribution or reproduction in other forums is permitted, provided the original author(s) and the copyright owner(s) are credited and that the original publication in this journal is cited, in accordance with accepted academic practice. No use, distribution or reproduction is permitted which does not comply with these terms.
*Correspondence: Weronika Sredniawa, d2Vyb25pa2Euc3JlZG5pYXdhQGx0dS5zZQ==