 Pranjal Mandhaniya
 Anish Kumar Soni2
 Abdullah Ansari
- 1Department of Mechanical and Industrial Engineering, Norwegian University of Science and Technology Trondheim, Trondheim, Norway
- 2Department of Civil Engineering, Indian Institute of Technology Delhi, New Delhi, India
- 3Department of Civil Engineering, Inha University, Incheon, Republic of Korea
- 4Department of Smart City Engineering, Inha University, Incheon, Republic of Korea
A high-quality railway track resting on an excellent foundation is required to support high-speed railway transportation. The foundations of high-speed railway tracks are generally constructed on the lifted embankment with the improved ground using different reinforcement agents like geosynthetics and rigid lateral support. The present study performed dynamic finite element simulations on a ballasted rail track laid over a geosynthetically reinforced embankment with and without facing wall support. Three foundation geometries were analyzed to examine the effect of facing wall support and geosynthetics on the lateral resistance of the foundation. An area loaded with a constant pressure was moved at a constant speed, causing the load motion at different speeds in the 90–360 km/h range. Different parameters were calculated at node paths to help understand the lateral effect of moving load. The results showed that the lateral resistance based on nodal acceleration and velocity increased with facing wall support in the range of 40%–57%. Any increment over the minimum facing wall thickness of 300 mm does not significantly increase lateral resistance. Geosynthetics provided a vital function in the foundations with a less bulk volume of soil and increased the lateral resistance by 10%.
1 Introduction
Careful construction of the foundation is the basis for high-speed rail corridors. The natural ground (subgrade) requires improvement if its strength is below the standards. Soil reinforcement using geosynthetics is one of the universal and popular methods for such improvement, which is used for elevated embankments for the high-speed railway in Japan (Tatsuoka et al., 2014). Recently, the Indian government planned a high-speed railway corridor between the cities of Mumbai and Ahmedabad (Japan International Cooperation Agency JICA, 2015). This railway line will offer travel speed in the range of 200–300 km/h, and based on its implementation, other railway track corridors will be built in the country.
The design of the Mumbai-Ahmedabad high-speed rail (HSR) corridor was adopted from Japan’s Shinkansen HSR tracks (Tatsuoka et al., 2014), which uses geosynthetically reinforced earth (GRE) foundations. The design of GRE structures in Japan was inspired by the Terre Armee method developed by Vidal (1969) in France. The method requires reinforcement layers to be placed in an alternate arrangement with the soil layers to strengthen the whole structure. The GRE structures are generally supported by a facing wall, which can either be constructed as a rigid cantilever wall or as smaller interconnected panels. The material strength of geosynthetics, vertical spacing, and length of reinforcement elements can be controlled to change the capacity of GRE structures (Berg et al., 2009; Koerner, 2012).
The finite element model for reinforcement using geosynthetics from the experimental outputs were validated by Jiroušek et al. (2010). There have been analytical models for the same in the literature (Rajesh et al., 2015). Then, there are purely laboratory-based studies in literature (Horníček et al., 2010; Chawla and Shahu, 2016a) as well, which used cyclic loading of geosynthetically reinforced ballast and subballast to analyze the effect of the reinforcements. Some researchers have validated the laboratory cyclic loading results of geosynthetically reinforced railway tracks using finite element procedures (Chawla and Shahu, 2016b; Hussaini and Sweta, 2021).
The effect of rigid continuous facing (Yang et al., 2009; Tatsuoka et al., 2014) and discrete facing for the wall support (Riccio et al., 2014) on GRE structures has also been analyzed using laboratory testing in the literature. Field monitoring takes a long time (more than a year) due to the overall planning and construction process; thus, its topical literature is scarce (Ung Jin and Dae Sang, 2020). There has been research done on the effect of geosynthetics on railway tracks (Jiang and Nimbalkar, 2019; El-kady et al., 2023). The literature study on the geosynthetic reinforcement of railway tracks outlines several research gaps.
1) The numerical analysis of GRE foundations under moving load is almost non-existent in the literature.
2) Most numerical simulations attempted for geosynthetic reinforced railway tracks concentrate on ballast and subballast reinforcement.
3) Almost all the researchers simulate the moving load problem using cyclic loading in the laboratory and simulations.
This study analyzes an overall or macroscopic response of railway tracks with different GRE foundations under moving load. Thus, meticulous interaction between geosynthetics and the subgrade was replaced with a simpler subgrade-geosynthetic embedded condition. The discrete element method is also the best-known simulation procedure for granular material like ballast and subballast (Chen and McDowell, 2016). However, the present study does not target the particle separation and subgrade-geosynthetic interaction at a microscopic level; thus, finite element simulation will be appropriate. Further, a detailed wheel-rail interaction was replaced by a simplified subroutine for moving load, assuming a smooth rail without corrugations.
2 Description of the simulation model
The upper structure of the railway track, which consists of rails, sleepers, ballast and subballast, was adopted from the typical Indian broad gauge double-line ballasted railway track based on Chawla and Shahu (Chawla and Shahu, 2016a) and Mandhaniya et al. (Mandhaniya et al., 2022a). The cross-sections of the upper structure are shown in Figure 1A. The arrangement of sleepers and the simplified cross-section of the 60E1 rail were shown in Figures 1B, C, respectively.
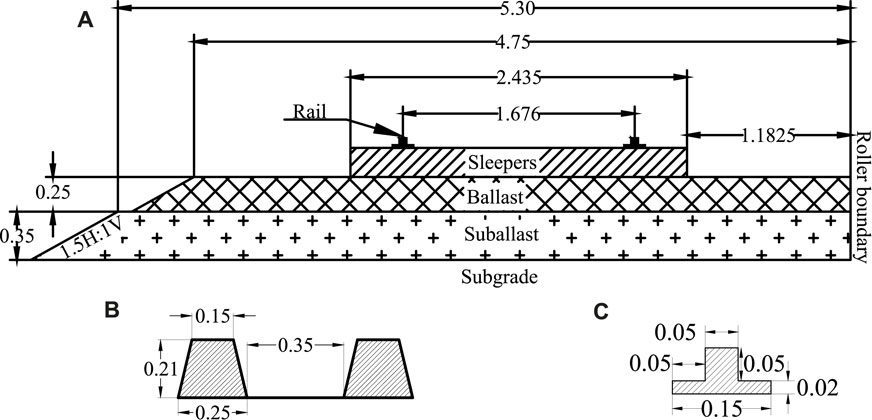
FIGURE 1. Cross-sections of (all dimensions are in meters) (A) upper structure (B) sleeper arrangement (C) rail.
Positively using the symmetry, only half of the cross-section was modeled to decrease computational resources. In this order, an equivalent rail section was modeled, with the same second moment of the area as the E60 rail section. Meanwhile, three GRE foundation configurations, as shown in Figure 2, were adopted to represent the effect of facing walls and geosynthetics.
1) Foundation-1 (Figure 2A) was adopted from the Mumbai-Ahmedabad high-speed rail (HSR) corridor (Japan International Cooperation Agency JICA, 2015). Mumbai-Ahmedabad HSR is a 505 km long corridor, a major section (313 km) of which will be built over an elevated embankment without any lateral support, like a vertical facing wall. Foundation-1 geometry is similar to the 313 km long stretch of the Mumbai-Ahmedabad HSR corridor.
2) Foundation-2 (Figure 2B) was adopted from the Osong railway test line, which was monitored by Kim and Kim (Ung Jin and Dae Sang, 2020). This section consists of a combination of the embankment and facing wall. Thus, lateral support was present for the foundation’s half-height (3 m).
3) Foundation-3 (Figure 2C) was adopted from Japanese HSR, which is also used in Shinkansen Tatsuoka et al. (2014). This geometry consists of a vertical GRE foundation with a full-height facing wall, i.e., lateral support was present for full-height (6 m) of the foundation.
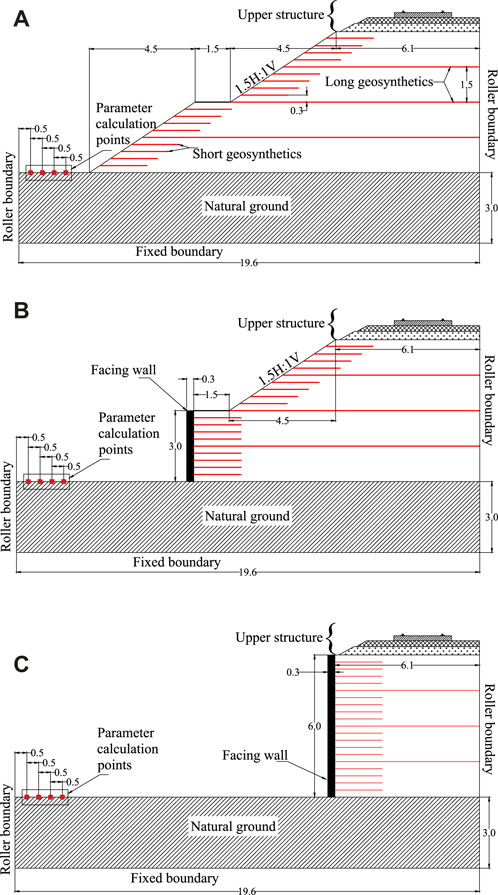
FIGURE 2. Cross-sections of (all dimensions are in meter) (A) foundation-1 (B) foundation-2 (C) foundation-3.
The length of the geosynthetic reinforcement and their vertical spacing were adopted from Japan International Cooperation Agency Japan International Cooperation Agency JICA (2015) and Tatsuoka et al. (2014). Two types of geosynthetic reinforcement layers were present in the foundations.
1) Long geosynthetics were applied at every 1.5-m vertical spacing. These geosynthetics will cover the whole cross-section length based on their depth.
2) Short geosynthetics were applied at every 0.3-m vertical spacing except where long geosynthetics will occur. The length of these reinforcements was 2 m.
2.1 Material properties of the model
The material properties of the railway track layers were adapted from Mandhaniya et al. (2022b) and (Chawla and Shahu, 2016a). The density (ρ), Young’s modulus (E), Poisson’s ratio (ν) and angle of internal friction (ϕ) of all layers were mentioned in Table 1. Cast iron rails, concrete sleepers, concrete wall and geosynthetics were modeled as elastic, while ballast, subballast, and subgrade were modeled as elastoplastic with Mohr-Coulomb plasticity. However, a cohesion of 0.1 kPa was used for initial convergence. The tension cutoff was calculated as c. cot(ϕ), and the dilation angle was taken as ϕ - 30. The properties of geosynthetics were acquired from Abu-Farsakh et al. (Abu-Farsakh et al., 2014); their thickness was taken as 3 mm.
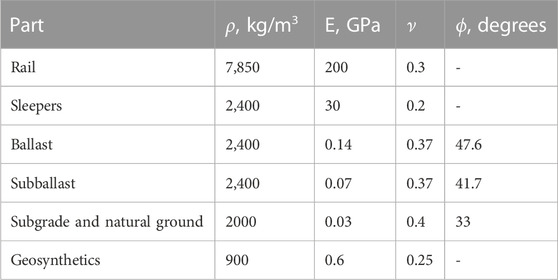
TABLE 1. Mesh and material properties of track components.
2.2 Material damping and infinite boundaries
Material damping parameters are required to simulate its behavior more practically. Thus, mass (α) and stiffness (β) proportional damping coefficients were adopted in a finite element analysis. The values of α and β were calculated from Eq. 1.
The damping constant of the material, first resonant frequency, and the applied highest load frequency were depicted as ξ, ω1 and ω2. ω1 was computed from the modal analysis of the structure (Nsabimana and Young-hoon, 2015). In contrast, ω2 is the highest loading velocity and is calculated as per Eq. 2 based on the moving speed (V) and the diameter (D) of the wheel.
The infinite boundaries (Lysmer and Kuhlemeyer, 1969; Zienkiewicz et al., 1983) were used at the boundaries of the geometry. The infinite mesh elements absorb the normal (σ) and shear (τ) stress at the boundary based on Eqs 3, 4.
Vp and Vs represent P-wave and S-wave velocity. While w and u represent normal and shear velocities in the material. The normal (σ) and shear (τ) stress in the material will be zero if constants a and b equal 1, thus imitating the infinite nature of the boundaries.
2.3 Meshing details and interface conditions
A mesh convergence study is required to compute a mesh size with minimal computation time without compromising accuracy. The mesh of different components was changed from finer to coarser. Finally, the optimum mesh size for rail was computed as 100 mm. The mesh size of sleepers, ballast, subballast and subgrade (natural ground) was kept the same and equal to 500 mm, while the geosynthetics mesh size was 1,000 mm. Three-dimensional solid eight-node elements (C3D8R) were used for all solid layers, and planer shell (S4R) mesh elements were used for geosynthetics. No displacements and rotations were allowed at the bottom boundary; only vertical settlements were allowed in all vertical boundaries. This is also shown in Figure 2 in the form of roller boundary and fixed boundary at peripheries of the geometries.
Tie constraints (no slip allowed; surfaces glued together) were used for rail-sleepers, sleepers-ballast, ballast-subballast, subballast-subgrade, and wall-subgrade interfaces. A 0.5-m thick infinite mesh element (Three-dimensional solid eight-node infinite elements; CIN3D8) layer was added to the boundaries.
2.4 Motion of loaded area
The contact area of the wheel and rail can be correlated to the wheel load and diameter. A higher wheel load will cause the wheel to attain more surface contact with the rail, while a larger wheel diameter can increase this contact area. For a wheel load of 162.5 kN and a wheel diameter of 1 m, the value of the loading area was calculated from Andrews (Andrews, 1959). An area of 225 mm2 on the top of the rail surface was loaded with pressure equal to 722 MPa (162.5 kN divided by 225 mm2) and then moved at a constant speed. The speed of motion was controlled by controlling the ratio of applied displacement and step time. The displacement covered by the moving load was fixed, while the time to cover was changed to perform load motion at different speeds. This procedure was performed by applying a Fortran subroutine VDLOAD (Simulia, 2009). The simulations were performed at 90, 108, 162, 180, 216, 270, 324 and 360 km/h. This subroutine calculates the position of the load with increasing time and applies the pressure on the loaded area. As the time increases, the loaded area moves forward, thus creating a moving load simulation.
2.5 Simulation procedure and damping coefficients
An explicit analysis was used for simulating the moving load problem, suitable for frictional materials. It is inherently stable as the time increments are calculated such that wave propagation remains uninterrupted through the smallest of the mesh elements. The damping ratio (ξ) for cohesionless soils at strain rates greater than 0.1% can be adopted as 0.05 (Delfosse-Ribay et al., 2004). The first resonant frequency (ω1) from modal analysis of foundation-1 geometry was 15.1 rad/s (2.4 Hz). The highest loading frequency (ω2) equal to 200 rad/s (31.83 Hz), corresponding to the speed of 360 km/h (100 m/s), was obtained from Eq 2. The standard wheel diameter for the Indian railways is approximately 1 m (Andrews, 1959). Based on these parameters, the values of α and β were calculated as 1.4 s−1 and 0.0004 s.
3 Validation of moving load simulation
The validation for the dynamic loading procedure was performed by comparing the results of simulation from the field measurements given in Bowness et al. (2007) and Quinn et al. (2010), also adopted in a study by Mandhaniya et al. (2022a). A similar material model-based geometry was prepared to replicate the sources, and the results are shown in Figure 3. Bowness et al. (2007) measured ground velocity under the subballast layer at train speeds of about 100 km/h under a 17.6-ton axle load. The peak vertical velocity encountered in the simulation was 5.12 mm/s, which almost matches the results of Bowness et al. (2007).
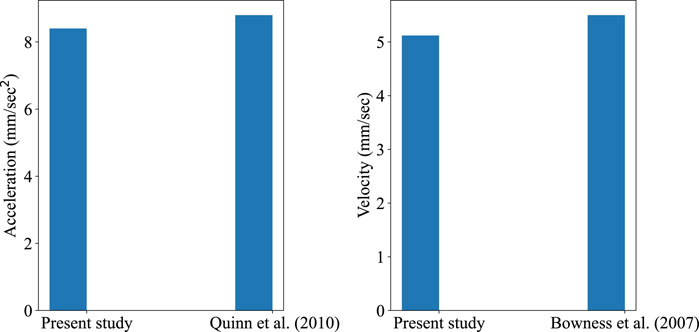
FIGURE 3. Validation from the Bowness et al. (2007) and Quinn et al. (2010).
On the other hand, Quinn et al. (2010) recorded sleeper vibrations under a 15-ton axle load moving at around 300 km/h. The peak vertical acceleration encountered in the simulation was 8.4 mm/s2, which matches the results of Quinn et al. (2010). Thus, the adopted simulation procedure is suitable for conducting moving load analysis.
4 Results of numerical analysis
The present study was concerned with the improvements caused in the lateral direction under moving load. Thus, the track response parameters were calculated at four node paths, as shown in Figure 4. The first node path was situated at a distance of 0.5 m from the vertical interface of infinite and finite subgrade layers. The other three node paths then move inwards toward the toe of the foundation with a spacing of 0.5 m. The node paths shown in Figure 4 were for foundation-1 geometry. However, the relative position of these node paths will be the same for foundation-2 and foundation-3 geometry. The distance between the last node path and the toe of foundations will increase from foundation-1 to foundation-3, as the overall width of the model was 19.6 m (Figure 2).
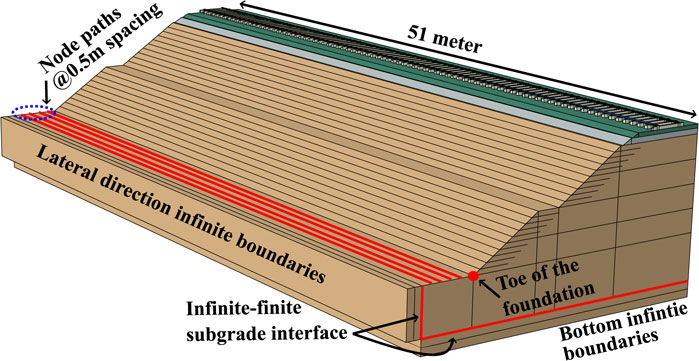
FIGURE 4. Location of node paths in foundation-1 geometry.
Figure 4 also shows the longitudinal extents, i.e., 51 m of the foundation geometries shown previously in Figure 2. The load motion was performed for the 45 m, starting at the 3-m mark from the origin and finishing at the 48-m mark from the origin. These extents were substantial to analyze the macroscopic effect of moving load and the lateral improvement in different cases (Bashir et al., 2023).
The magnitudes of four parameters, i.e., displacement, stress, acceleration, and velocity, were calculated at node paths. Once the loaded area had covered the 45-m mark, the node-path output was computed. The absolute area under the curve (AUC), which portrays the macroscopic effect of moving load, was evaluated as per Figure 5 from the node-path output curves. The dimension of the AUC of a given parameter will be equal to that parameter multiplied by the dimension of length (m). For example, the dimension of stress AUC will be Pascal × meter. Other parameters were calculated in the present study from node-path output curves, but they did not represent the macroscopic behaviors the same as AUC.
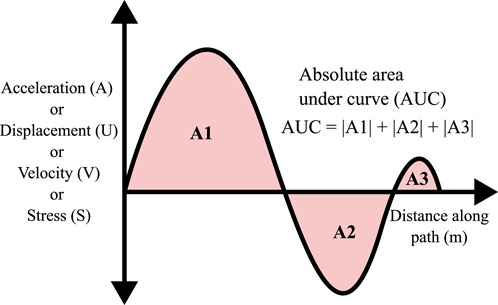
FIGURE 5. Calculation of absolute area (AUC) under the node-path output curve.
4.1 Dynamic structural response of GRE foundations
The GRE foundations were analyzed based on two specifications to check the suitability of a parameter. The suitable parameters were later used to evaluate the load response of the three foundations.
1) The parameter must increase with the motion speed or must not react to load retention effect as seen in literature (Mandhaniya et al., 2022c; Mandhaniya et al., 2023). A moving load retains at a location before going forward. Faster moving loads retain for a shorter time, and thus, simulation cannot catch their effect. This means that slow-moving loads will cause higher deformations in simulation.
2) The magnitude of the parameter should decrease as the simulation goes from foundation-1 to foundation-3 geometry. The basis of this specification lies in the increasing lateral support from the inclusion of a facing wall. The increasing distance of node paths from the toe of the foundations will also cause the parameter to decrease from foundation-1 to foundation-3.
The parameter AUC values calculated at the four node paths were first averaged. The averaged values were then plotted against the speed of motion for the four parameters and three foundation geometries. These plots are shown in Figure 6.
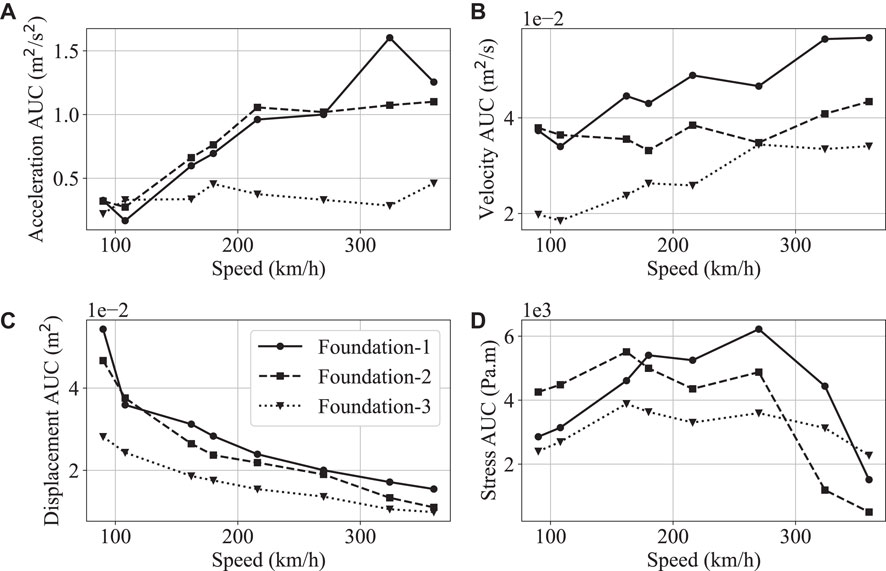
FIGURE 6. Different parameters at the three foundations plotted against speed (A) acceleration AUC (B) velocity AUC (C) displacement AUC (D) stress AUC.
The acceleration AUC (Figure 6A) curves of foundation-1 and foundation-2 showed a strong following of the two specifications, while the foundation-3 curve shows a relatively weaker trend. The foundation-3 acceleration AUC curve almost remains constant with increasing speed. The velocity AUC (Figure 6B) curves for all the foundations adhered to the two specifications.
The displacement AUC (Figure 6C) showed a decreasing trend with speed, while stress AUC (Figure 6D) does not follow the increasing trend with speed. Thus, displacement AUC trends were ignored for further analysis.
Further examination of the parameter trends was performed by visualizing the boxplots as shown in Figure 7. Figure 7 compares the parameter AUC values of the three foundation geometries for all speeds plotted as a box and whisker plot (boxplot). The box in the boxplots implies the 50 percentile values, while the whisker arms show the extreme values. The line in the box indicates the median of the dataset. Thus, a boxplot will be most suitable for comparing the overall response parameters of the three foundations. In addition to the boxplots, a line connecting the average values of the parameter datasets was also drawn to show the overall pattern.
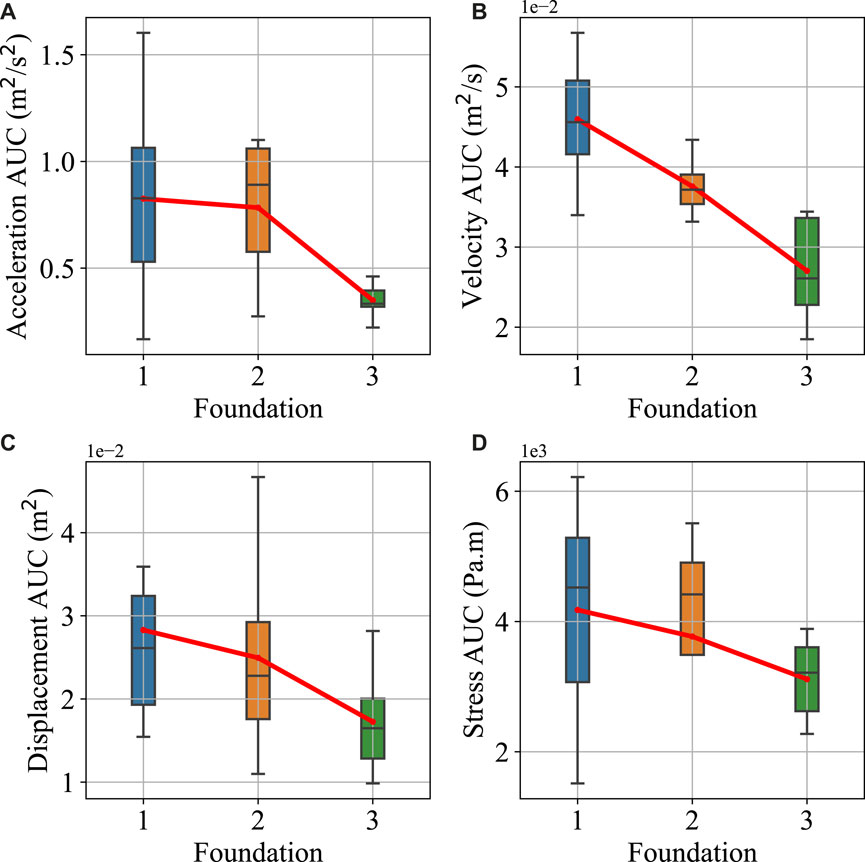
FIGURE 7. The parameter boxplots for the three foundations (A) acceleration AUC (B) velocity AUC (C) displacement AUC (D) stress AUC.
In general, it can be seen that all the parameters show an overall decreasing pattern from foundation-1 to foundation-3 based on the average connecting line. Acceleration AUC boxplots (Figure 7A) show a weak pattern with slightly increased values at foundation-2 after foundation-1 but later decreasing at foundation-3. The ranges of boxplots of acceleration AUC for the three foundations were quite overlapping. However, the average acceleration AUC pattern decreased in Figure 7A. The velocity AUC (Figure 7B) shows an almost linear decrease in the average values from foundation-1 to foundation-3. The velocity AUC boxplots showed relatively less overlap between different foundations. The displacement AUC (Figure 7C) and stress AUC (Figure 7D) also shows a decreasing trend, but these parameters were to be ignored based on the non-compliance of the first specification.
The mean acceleration AUC values decrease by 5% in foundation-2 compared to foundation-1. However, the acceleration values decreased by 55% in foundation-3 compared to foundation-2. The overlap of acceleration AUC boxplots of foundation-1 and foundation-2 in Figure 7A would have caused them to show a lower difference. Meanwhile, a slight overlap in foundation-2 and foundation-3 acceleration AUC boxplots makes the sudden increase in lateral resistance of foundation-3 reasonable. The mean velocity AUC decreased by 18% from foundation-1 to foundation-2 and by 28% from foundation-2 to foundation-3. This uniform decrease in parameter value shows how a facing wall can affect the lateral capacity of a GRE foundation.
The next step was to determine the effect of reinforcement agents on the dynamic response of the structure. In other words, the effect of facing wall thickness and the presence of long and short geosynthetics on the dynamic response needed to be analyzed.
It was observed that acceleration and velocity AUC are the most suitable parameters to determine the dynamic response of the foundations. Thus, the results are presented as either acceleration AUC or velocity AUC boxplots based on the suitability of comparison. The parameters were calculated at the node paths as shown in Figure 4, and the average AUC values were calculated to create the final dataset.
4.2 Geosynthetic reinforcement and change in lateral response
Two variations of the simulated models were adopted apart from the reference simulation model, as shown in Figure 2 to pursue the effect of geosynthetics.
1) 2M-GS: In this simulation model, all the long geosynthetics were replaced by short geosynthetics. Thus, the length of all geosynthetic reinforcements was 2 m.
2) NO-GS: All the reinforcements were removed in this simulation model, and plain subgrade foundations were used.
Based on these terminologies, the reference case with long and short geosynthetics was named RF-GS. Figure 8 shows the Acceleration AUC boxplots of the three foundation geometries for the three cases of geosynthetic reinforcements (NO-GS, 2M-GS, and RF-GS).
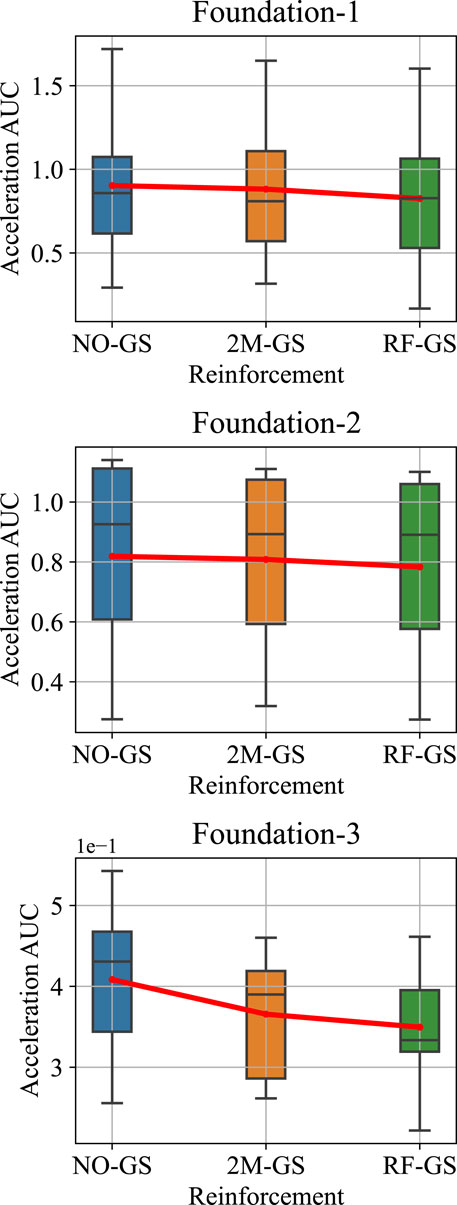
FIGURE 8. Acceleration AUC boxplots of three foundation geometries for different geosynthetic reinforcement conditions.
The boxplots show almost complete overlap for NO-GS, 2M-GS, and RF-GS cases for all the foundation geometries. Thus, the improvement in the structure’s lateral response will be determined by comparing the mean values. The red lines in Figure 8 connect the mean values of the datasets represented by the respective boxplots.
In foundation-1 geometry, the mean acceleration AUC decreased by 2.4% in NO-GS compared to 2M-GS, while it decreased by 6.4% in RF-GS compared to 2M-GS in foundation-1 geometry. A 1.3% drop was recorded in the mean acceleration AUC in NO-GS compared to 2M-GS in foundation-2 geometry. The acceleration AUC dropped by 3% in RF-GS compared to 2M-GS for foundation-2. In foundation-3 geometry, the mean acceleration AUC was reduced by 10.5% in NO-GS compared to 2M-GS, and the mean acceleration AUC decreased by 4.4% in RF-GS compared to 2M-GS.
The removal of geosynthetics affected the foundation-3 geometry the most and the foundation-2 geometry the least. It can be inferred that the bulk volume of the subgrade is also effective in preventing the spread of lateral vibrations. The subgrade volume in foundation-3 geometry is the lowest; thus, the geosynthetics affect it the most. This behavior was highlighted in Figure 9, which shows the nodal velocity contours of the foundation-3 subgrade for RF-GS and NO-GS cases. The gray color in the contour implies maximum nodal velocity (mostly under moving load), and the color change to red, green, and blue, implying decreasing magnitude of nodal velocity. The contours show a larger wheel shadow area in the NO-GS case compared to the RF-GS case. Although these contours highlight the subgrade zone immediately under the load, similar behavior will be seen at the node paths in the lateral direction.
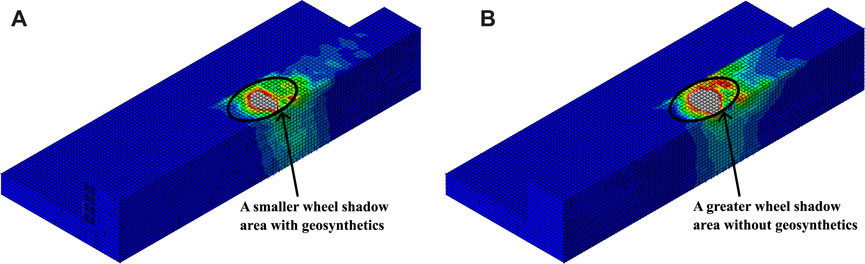
FIGURE 9. Velocity contours of foundation-3 subgrade for (A) complete geosynthetic reinforcement (RF-GS) (B) no geosynthetic reinforcement (NO-GS).
4.3 Effect of facing wall thickness on lateral response
In addition to geosynthetics, the effect of facing wall thickness was also examined in the present study. The facing wall thicknesses adopted for this examination were 450 mm and 600 mm. Figure 10 shows the velocity AUC box plots for the mentioned facing wall thicknesses for foundation-2 and foundation-3 geometries. Foundation-1 geometry does not consist of a facing wall; thus, it was not involved in the comparison.
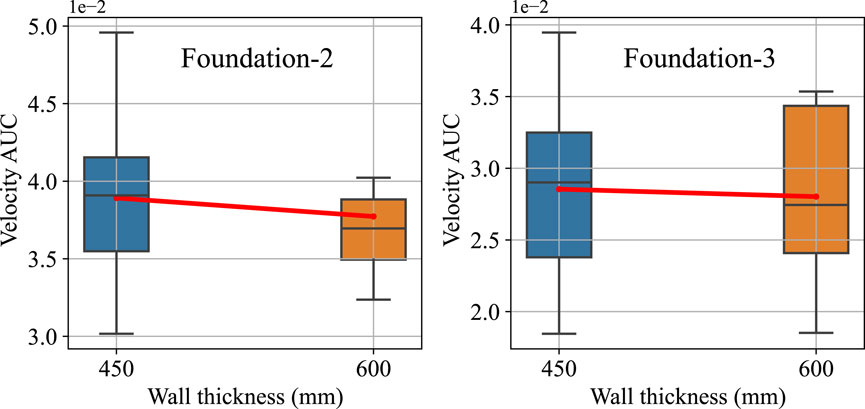
FIGURE 10. Velocity AUC boxplots of three foundation geometries for two wall thicknesses.
A 3% drop was recorded in the mean velocity AUC when the facing thickness was increased from 450 to 600 mm in foundation-2 geometry. Meanwhile, with the same thickness change, the mean velocity AUC dropped by 1.8% in foundation-3 geometry. Any surplus to the facing wall thickness does not affect the lateral resistance significantly. However, a wall itself increases the lateral resistance of the overall structure, as seen in the literature (Mandhaniya et al., 2022b).
Figure 11 shows the velocity contours of the foundation-2 subgrade for facing wall thicknesses of 450 and 600 mm. The contour area behind the moving load was slightly larger in the case of 450 mm thick facing wall than 600 mm thick facing wall. However, the wheel shadow for both cases was almost unchanged. This observation bolsters that the improvement is almost negligible as the thickness of the facing wall is increased beyond 300 mm.
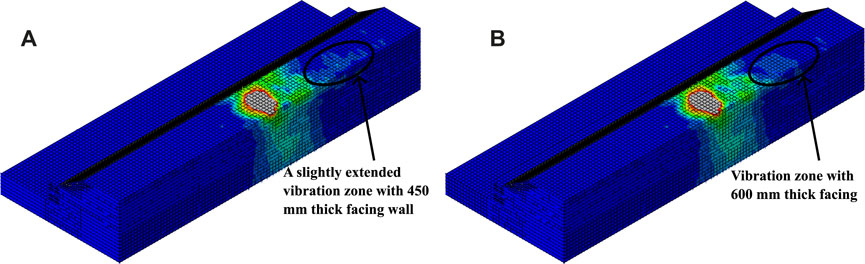
FIGURE 11. Velocity contours of foundation-2 subgrade for (A) 450 mm thick facing wall (B) 600 mm thick facing wall.
4.4 Effect of the height of foundation embankment on lateral response
The total height of all the foundation geometries analyzed in the present study was 6 m. There is a clear indication that the height of the embankment is adopted to acquire the required structural capacity. A higher embankment also hinders any trespassing. However, the dynamic response at smaller embankment heights should also be compared to justify a higher embankment. Thus, foundation-3 geometry was modeled without geosynthetic reinforcements (NO-GS) for three embankment heights. The first was the reference height of 6 m, while the other two were 4.5 and 3 m. The height of the facing wall was also reduced according to the embankment. The extent of the overall model geometry was not changed. Foundation-3 geometry was the most suitable for this analysis as the distance of node paths, and the toe of the foundation will be unchanged.
Figure 12 shows the acceleration and velocity AUC at three embankment heights for foundation-3. The lateral resistance showed a general increase with the embankment height. The mean acceleration and velocity AUC dropped by 6.3% and 6%, respectively, as the embankment height increased from 3 m to 4.5 m. Meanwhile, mean acceleration and velocity AUC showed a reduction of 2% and 19% for embankment height increments from 4.5 to 6 m. The parity of improvement in the two height increments is mostly due to outliers in the datasets. Nonetheless, it was observed that at every 1.5 m height increment (50% increase), the lateral resistance increased by 6%–10%.
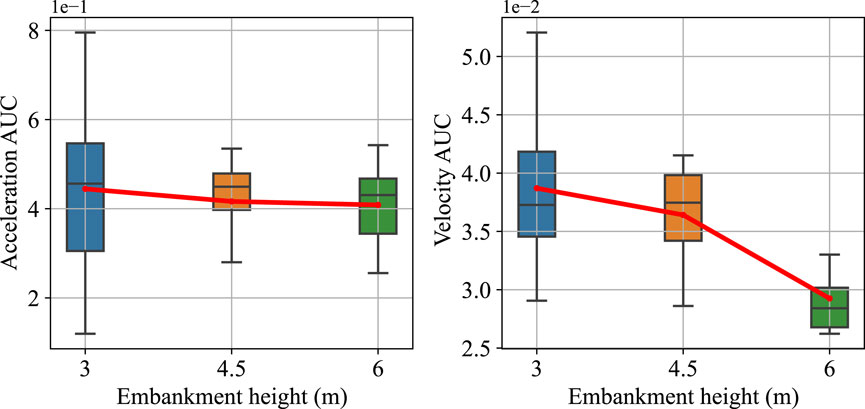
FIGURE 12. Acceleration and velocity AUC boxplots of three embankment heights for foundation-3 geometry.
5 Conclusion
A summary of the outcomes of the present study is outlined in the form of the following conclusions.
• The lateral resistance of different foundations can be analyzed with the help of two parameters: ground acceleration and velocity. With increasing speed, the lateral resistance in foundation-3 geometry will be 40%–57% higher than the foundation-1 geometry.
• Foundation-2 and foundation-3 showed a lateral resistance increase in the range of 2%–3% as the thickness of the facing wall doubled. Thus, any increment after 300 mm facing wall thickness does not affect the lateral resistance significantly.
• The bulk volume of subgrade in any foundation geometry is also an important factor for vibration attenuation, as removing geosynthetics affected foundation-3 geometry the most. Removing geosynthetics reduced the lateral resistance by 10% in foundation-3 geometry.
• The foundation-2 geometry showed the most consistent load response with removing geosynthetics and changing wall thickness compared to foundation-1 and foundation-3. Thus, foundation-2 is most suitable for large-scale, reliable construction.
• The height of the embankment of a foundation geometry also affects the lateral resistance. It was recorded that a 50% increase in height will increase the lateral resistance in a range of 6%–10%.
Data availability statement
The raw data supporting the conclusion of this article will be made available by the authors, without undue reservation.
Author contributions
PM: Writing–original draft, Writing–review and editing. AS: Writing–review and editing. KC: Writing–review and editing. AA: Writing–review and editing.
Funding
The author(s) declare that no financial support was received for the research, authorship, and/or publication of this article.
Acknowledgments
The authors thank IIT Delhi High Performance Computing (HPC) facility for generously providing necessary computational resources.
Conflict of interest
The authors declare that the research was conducted in the absence of any commercial or financial relationships that could be construed as a potential conflict of interest.
Publisher’s note
All claims expressed in this article are solely those of the authors and do not necessarily represent those of their affiliated organizations, or those of the publisher, the editors and the reviewers. Any product that may be evaluated in this article, or claim that may be made by its manufacturer, is not guaranteed or endorsed by the publisher.
References
Abu-Farsakh, M. Y., Gu, J., George, Z. V., and Chen, Q. (2014). Mechanistic–empirical analysis of the results of finite element analysis on flexible pavement with geogrid base reinforcement. Int. J. Pavement Eng. 15 (9), 786–798. doi:10.1080/10298436.2014.893315
Andrews, H. I. (1959). The contact between a locomotive driving wheel and the rail. Wear 2 (6), 468–484. ISSN 00431648. doi:10.1016/0043-1648(59)90161-9
Bashir, S., Mandhaniya, P., and Akhtar, N. (2023). Influence of plasticity and vibration isolators on an underground floating slab track using finite element analysis. Structures 55, 1783–1792. doi:10.1016/j.istruc.2023.06.109
Berg, R. R., Barry Rodney, C., and Samtani, N. C. (2009). Design and construction of mechanically stabilized earth walls and reinforced soil slopes. McLean, VA, United States: US Department of Transportation, Federal Highway Administration, National Highway Institute. Available at: https://www.fhwa.dot.gov/engineering/geotech/pubs/nhi10024/nhi10024.pdf.
Bowness, D., Lock, A. C., Powrie, W., Priest, J. A., and Richards, D. J. (2007). Monitoring the dynamic displacements of railway track. Proc. Institution Mech. Eng. Part F J. Rail Rapid Transit 221 (1), 13–22. ISSN 09544097. doi:10.1243/0954409JRRT51
Chawla, S., and Shahu, J. T. (2016a). Reinforcement and mud-pumping benefits of geosynthetics in railway tracks: model tests. Geotext. Geomembranes 44 (3), 366–380. doi:10.1016/j.geotexmem.2016.01.005
Chawla, S., and Shahu, J. T. (2016b). Reinforcement and mud-pumping benefits of geosynthetics in railway tracks: numerical analysis. Geotext. Geomembranes 44 (3), 344–357. doi:10.1016/j.geotexmem.2016.01.006
Chen, C., and McDowell, G. R. (2016). An investigation of the dynamic behaviour of track transition zones using discrete element modelling. Proc. Institution Mech. Eng. Part F J. Rail Rapid Transit 230 (1), 117–128. doi:10.1177/0954409714528892
Delfosse-Ribay, E., Djeran-Maigre, I., Cabrillac, R., and Gouvenot, D. (2004). Shear modulus and damping ratio of grouted sand. Soil Dyn. Earthq. Eng. 24 (6), 461–471. ISSN 02677261. doi:10.1016/j.soildyn.2004.02.004
El-kady, M. S., Azam, A., Yosri, A. M., and Nabil, M. (2023). Modelling of railway embankment stabilized with geotextile, geo-foam, and waste aggregates. Case Stud. Constr. Mater. 18, e01800. doi:10.1016/j.cscm.2022.e01800
Horníček, L., Tyc, P., Lidmila, M., Krejčiříková, H., Jasanskỳ, P., and ovsky, P. (2010). An investigation of the effect of under-ballast reinforcing geogrids in laboratory and operating conditions. Proc. Institution Mech. Eng. Part F J. Rail Rapid Transit 224 (4), 269–277. doi:10.1243/09544097JRRT330
Hussaini, S. K. K., and Sweta, K. (2021). Investigation of deformation and degradation response of geogrid-reinforced ballast based on model track tests. Proc. Institution Mech. Eng. Part F J. Rail Rapid Transit 235 (4), 505–517. doi:10.1177/0954409720944687
Japan International Cooperation Agency (JICA) (2015). Ministry of Railways (MOR), Republic of India, and Japan International Consultants for Transportation Co. Ltd., Oriental Consultants Global Co. Ltd., Nippon Koei Co. Ltd. Joint Feasibility Study for Mumbai-Ahmedabad High Speed Railway Corridor https://www.jica.go.jp/english/our_work/social_environmental/id/asia/south/india/c8h0vm00009v1ylc-att/c8h0vm0000bzv95t.pdf.3
Jiang, Y., and Nimbalkar, S. (2019). Finite element modeling of ballasted rail track capturing effects of geosynthetic inclusions. Front. Built Environ. 5, 69. doi:10.3389/fbuil.2019.00069
Jiroušek, O., Jíra, J., Hrdlička, O., Kuneckỳ, J., Kytỳř, D., Vyčichl, J., et al. (2010). Numerical modelling of the reinforcing effect of geosynthetic material used in ballasted railway tracks. Proc. Institution Mech. Eng. Part F J. Rail Rapid Transit 224 (4), 259–267. doi:10.1243/09544097JRRT319
Koerner, R. M. (2012). Designing with geosynthetics. 6th edition. Bloomington, Indiana, USA: Xlibris Corporation.
Lysmer, J., and Kuhlemeyer, R. L. (1969). Finite dynamic model for infinite media. J. Eng. Mech. Div. 95 (4), 859–877. ISSN 0044-7951. doi:10.1061/jmcea3.0001144
Mandhaniya, P., Shahu, J. T., and Chandra, S. (2022a). An assessment of dynamic impact factors for ballasted track using finite element method and multivariate regression. J. Vib. Eng. Technol. 10, 2609–2623. –2623. doi:10.1007/s42417-022-00507-x
Mandhaniya, P., Shahu, J. T., and Chandra, S. (2022b). Numerical analysis on combinations of geosynthetically reinforced earth foundations for high-speed rail transportation. Structures 43, 738–751. doi:10.1016/j.istruc.2022.07.003
Mandhaniya, P., Shahu, J. T., and Chandra, S. (2022c). Analysis of dynamic response of ballasted rail track under a moving load to determine the critical speed of motion. J. Vib. Eng. Technol., 1–17. doi:10.1007/s42417-022-00741-3
Mandhaniya, P., Shahu, J. T., and Chandra, S. (2023). A parametric study of embedded slab track system for high-speed applications on cohesive subgrade. Transp. Infrastruct. Geotechnol. 10, 1–16. doi:10.1007/s40515-021-00206-2
Nsabimana, E., and Young-Hoon, J. (2015). Dynamic subsoil responses of a stiff concrete slab track subjected to various train speeds: a critical velocity perspective. Comput. Geotechnics 69, 7–21. doi:10.1016/j.compgeo.2015.04.012
Quinn, A. D., Hayward, M., Baker, C. J., Schmid, F., Priest, J. A., and Powrie, W. (2010). A full-scale experimental and modelling study of ballast flight under high-speed trains. Proc. Institution Mech. Eng. Part F J. Rail Rapid Transit 224 (2), 61–74. doi:10.1243/09544097JRRT294
Rajesh, S., Choudhary, K., and Chandra, S. (2015). A generalized model for geosynthetic reinforced railway tracks resting on soft clays. Int. J. Numer. Anal. Methods Geomechanics 39 (3), 310–326. doi:10.1002/nag.2318
Riccio, M., Ehrlich, M., and Dias, D. (2014). Field monitoring and analyses of the response of a block-faced geogrid wall using fine-grained tropical soils. Geotext. Geomembranes 42 (2), 127–138. ISSN 02661144. doi:10.1016/j.geotexmem.2014.01.006
Simulia, A. (2009). User manual. Available at: http://130.149.89.49:2080/v6.14/books/usb/default.htm.
Tatsuoka, F., Tateyama, M., Koseki, J., and Yonezawa, T. (2014). Geosynthetic-reinforced soil structures for railways in Japan. Transp. Infrastruct. Geotechnol. 1 (1), 3–53. doi:10.1007/s40515-013-0001-0
Ung Jin, K., and Dae Sang, K. (2020). Load sharing characteristics of rigid facing walls with geogrid reinforced railway subgrade during and after construction. Geotext. Geomembranes 48 (6), 940–949. doi:10.1016/j.geotexmem.2020.08.002
Vidal, H. (1969). The principle of reinforced earth. Highw. Res. Rec. 282, 1–16. 282 https://onlinepubs.trb.org/Onlinepubs/hrr/1969/282/282-001.pdf.
Yang, G., Zhang, B., Lv, P., and Zhou, Q. (2009). Behaviour of geogrid reinforced soil retaining wall with concrete-rigid facing. Geotext. Geomembranes 27 (5), 350–356. ISSN 02661144. doi:10.1016/j.geotexmem.2009.03.001
Keywords: railway tracks, finite element simulation, geosynthetics, moving train, infinite layers, ballast, reinforced earth
Citation: Mandhaniya P, Soni AK, Choudhary K and Ansari A (2023) A comparative study of geosynthetically reinforced earth foundations in multi-utility transportation infrastructure for high-speed railways. Front. Built Environ. 9:1301722. doi: 10.3389/fbuil.2023.1301722
Received: 25 September 2023; Accepted: 09 November 2023;
Published: 22 November 2023.
Edited by:
Sanjay Shrawan Nimbalkar, University of Technology Sydney, AustraliaReviewed by:
Ben Leshchinsky, Oregon State University, United StatesYao Shan, Tongji University, China
Copyright © 2023 Mandhaniya, Soni, Choudhary and Ansari. This is an open-access article distributed under the terms of the Creative Commons Attribution License (CC BY). The use, distribution or reproduction in other forums is permitted, provided the original author(s) and the copyright owner(s) are credited and that the original publication in this journal is cited, in accordance with accepted academic practice. No use, distribution or reproduction is permitted which does not comply with these terms.
*Correspondence: Pranjal Mandhaniya, cHJhbmphbC5tYW5kaGFuaXlhQG50bnUubm8=