 Douglas Stuart Walkinshaw1*
 Raymond Henry Horstman2
- 1Indoor Air Technologies Inc, Ottawa, ON, Canada
- 2American Society of Heating, Refrigerating, and Air-Conditioning Engineers, Atlanta, GA, United States
From pandemic to seasonal, the COVID-19 pandemic experience suggests many common respiratory infections rather than likely having a fomite etiology as previously thought, are primarily caused by the inhalation of infectious aerosols shed by ill persons during coughing and normal breathing and talking. Given this new understanding, the good news is that, unlike indoor-sourced noxious and irritating gases that can only be mitigated practically by diluting them with outdoor air ventilation, the indoor infectious aerosol illness transmission route can be addressed by circulating already conditioned air through commonplace commercial filters. Given that infectious aerosols released from the breath of occupants were practically an unknown vector of respiratory disease in the healthcare community for many decades, understandably HVAC regulations have not addressed this issue yet. However, this is about to change. To further this new end, this paper develops the formulae needed to set conditioned air recirculation rates through such filters for design infectious aerosol emission and inhalation rates, HID values, exposure times and occupancies, and target significantly lower than currently normal airborne infection reproduction rates. The analysis extends the equations previously developed for group inhalation of infectious aerosols to develop equations predicting the number of infections likely to occur from this inhalation and the rate of disease spread (reproduction). The governing equations provided and exemplified use group exposures since the number of infections (reproduction number) is group based. Examples using the equations provided are given for many different settings and two case study findings are compared with their predictions. Some settings such as the typical office are shown to already have a relatively low infection reproduction rate. Alternatively, others such as a typical school classroom or a longer commercial air flight require increased filtered ventilation air flows to yield a similarly low reproduction rate. The formulae and their application will be of interest to government and industry health and HVAC standard setting bodies.
Introduction
The importance of aerosol virion inhalation as a COVID-19 infection route, and not primarily fomites from coughs or sneezes, was not initially recognized during the COVID-19 pandemic. Neither was it for decades in the case of tuberculosis bacterial infections. TB for some time was thought to be transmitted through droplets and fomites because it occurred most often after close contact. We now know that TB can be transmitted only via the air from speaking, coughing or singing, and not by fomites, kissing or sharing a drink or a toothbrush (Centers For Disease Control and Prevention, 2021a). Similarly, that perception also changed for the COVID-19 pandemic. Led by Morawska and many others, it is now recognized that airborne transmission is a primary COVID-19 infection route and that building engineering measures such as outdoor air ventilation and infectious aerosol recirculation air filtration are warranted (Morawska and Milton, 2020; Morawska, 2020). Leung pointed out the efficacy of mask wearing aerosol filtration, and this became an important CDC measure in addressing the pandemic (Leung, 2020) (Centers For Disease Control and Prevention, 2021b).
It is thought that the importance of airborne respiratory aerosol disease transmission does not end with COVID-19 and TB. A review by Fennelly, for example, found that humans produce pathogens predominately as aerosols or small respirable particles (<5 microns) with PCR studies identifying infectious aerosols in the air of rooms with persons ill with COVID-19, the common cold, influenza A and B, TB, measles, herpes, and chicken pox (Fennelly, 2020). Others have found that humidity and temperature play important roles affecting virion survival, droplet aerosolization and lung mucociliary clearance (Marr et al., 2019) (Lowen, 2007) (Wolkoff, 2018) (Kudo et al., 2019).
Virion aerosol shedding can be substantial. For example, in influenza-infected subject virion shedding testing, Yan et al measured the geometric mean RNA copy numbers from breath as 76,000 copies/hour fine (particles <5 micron) aerosol and 24,000 copies/hr coarse aerosol and found that sneezing was rare, and that sneezing and coughing were not necessary for influenza infectious aerosol shedding (Yan, 2018).
A mathematical study by Chen et al found that, in exposure to exhaled droplets during close contact (<2 m) via both short-range airborne and large droplet sub-routes, the large droplet route only dominates when the droplets are larger than 100 μm and when the subjects are within 0.2 m while talking or 0.5 m while coughing. The smaller the exhaled droplets, the more important the airborne route. The large droplet route contributes less than 10% of exposure when the droplets are smaller than 50 μm and when the subjects are more than 0.3 m apart, even while coughing (Chen et al., 2020).
There have been infectious doses identified for influenza caused by a similar sized virion to CoV-2, but not yet for COVID-19. For example, Nikitin et al identified TCID50 (tissue culture 50% infectious dose) for Influenza ranging between 300 virus copies, to 3,000 virus copies with an HID50/TCID50 ratio of 3–5 giving an HID50 range from 900 to 15000 HID50 (Nikitin, 2014).
CFD studies and experiments investigating the spread of aerosols, for example, Bennett et al. (2013), Horstman and Rahai (2021) and Silcott (2020) (see Figure 1) have shown that ventilation created air currents can spread aerosols quite far in terms of numbers of persons who might be infected by these aerosols in aircraft cabins if they are susceptible. Nevertheless, while aerosols will disperse much further than droplets, Morgenstern pointed out that the concentration of infectious aerosol particles generally falls with distance, even when those infectious particles are carried by aerosols (Morgenstern, 2021).

Figure 1. Example Transcom particle dosimeter measurement seat locations surrounding the particle generator. From USTRANSCOM 777-200 hangar dosimeter.
COVID-19 brought to light another issue—adequate residential ventilation for homes with teleworkers. This also requires follow up by researchers, ventilation standards committees and policymakers. For example, one study found that due primarily to concern over domestic energy savings, the lack of suitable ventilation and the more intensive use of cleaning products and disinfectants during the COVID-19 crisis, indoor pollutant levels were typically higher then than compatible with healthy environments (Domínguez-Amarillo et al., 2020). Another study found that the COVID-19 situation requiring people to spend more time at home and indoors to comply with social isolation and mandatory telework identified a linkage between residential IAQ and the symptoms and diseases observed in at-home teleworkers who participated in the study (Ferreira and Barros, 2022).
So how can HVAC systems help with infectious aerosol exposures? By lowering the concentration of respiratory aerosols as needed in public spaces, workers may not need not be confined to their homes during future pandemics and if they do only home outdoor air ventilation and recirculation air filtration efficiency and not use of surface disinfectants, etc., may need to be increased. Building, residential and transportation HVAC systems circulate thermally conditioned indoor air plus some outdoor air through filters many of which in common use are sufficiently efficient to remove a significant portion of any occupant generated infectious aerosols from the air passing through them at normal air flows. For example, MERV 12 filters are estimated to remove 20% of the infectious aerosols in from the air passing through them, MERV 13 50%, MERV 14 60% and HEPA 100% (Maroto, 2011) (Owen and Kerr, 2020). All HVAC systems are required by current building codes to inject outdoor make up air into the space in amounts sufficient to dilute indoor sourced air contaminants to acceptable odor, sensory irritation and health levels (Ansi/Ashrae, 2018; Ansi/Ashrae 2022a; Ansi/Ashrae, 2022b). So a combination of outdoor (make up) air plus some percent of the filtered recirculated air will be free of infectious aerosols for most commonly used filters including some used for residential HVAC systems.
So how much can HVAC systems help? It all depends upon the amount of virion-free air that can be supplied on average to each of the occupants in the space. The more the better.
There is a general misconception about the role of spatial air change rates when it comes to respiratory aerosol mitigation. Air change comparisons between volumes of different occupant density can be misleading. Simply reducing the volume provided the occupants by lowering the ceiling or closing in the walls will not reduce the risk of airborne disease transmission. On the contrary, the risk increases for two main reasons - proximity and faster concentration build-up. As the volume is decreased, the occupants sit closer together and germ transmission through the air is more likely. Although the air could be replaced more frequently, the rate that germs are generated does not change, resulting in a more rapid concentration buildup That is why some environments like transportation (trains, airplanes and buses) classroom and entertainment venues can be more infectious than the ACH would indicate. There are additional concerns with high air change rates. Fresh human breath aerosols enter the spatial air and are dispersed some 10 to 20 times more frequently than the spatial air is changed in even the highest air exchange settings. So as a result there are always fresh human breath aerosols in the air. In aircraft and other typical transportation systems, for example, infectious aerosols will be some 15 times fresher on average than in offices, for example,. That is, the average age of air in aircraft will be 15 times younger than in offices and the younger the age of air the potentially higher the virulency of the airborne virion all other factors being equal (Walkinshaw, 2020).
Part of the misinterpretation problem by lay persons in this field is that the term ‘air change’ is itself misleading since it might imply to a non-expert that the air and its contents is completely replaced with virion-free air in the time of an air change. But that of course is not the case in any public space of which we are aware. The air in the space is never emptied of human generated breath and coughing aerosols even in spaces with the highest air change rates. Instead, inhalation dose is a function of aerosol concentration times the duration of exposure, and aerosol concentration is a function of the ventilation rate of virion-free air per occupant. You can see that air change rate has no correlation whatsoever with steady state (maximum) breath aerosol concentration in the eight transportation and building venues addressed in Ref. (Walkinshaw, 2020) (Figure 1).
The objective of this investigation then is to illustrate that while the introduction of more outdoor air than the minimum required by ASHRAE standards will reduce occupant-generated aerosol concentrations, and a large United States office building survey by Persily and Gorfain (Persily and Gorfain, 2008) found that many office spaces did indeed substantially exceed ASHRAE minimum outdoor air (make-up air) requirements, this is not necessary to reduce infectious aerosol illness transmission. Simply using good common place filters in HVAC recirculation systems and, for some spaces such as schools, increasing the recirculation rate through them, the average number of persons who will be infected by a person ill with that disease can be significantly reduced.
Inhalation equations
The average occupant emitted aerosol concentration in the air after their entering the space (this same equation applies for occupant emitted gases such as CO2 or ethanol) is given by Walkinshaw as (Walkinshaw, 2020)
C = average virion aerosol spatial concentration spatial at time t, whether emitted by one, some or all its occupants
no = number of ill occupants shedding virion.
NT = number of occupants in the space
t = occupancy time after the exposed group including the infector enter the space
VE = ventilation air effectiveness in reaching occupants. VE can be greater than, equal to or less than 1.
VE = 1 in a uniformly mixed space.
Eq. 1 also holds for non-uniformly ventilated spaces by applying the average breathing zone VE.
Group dose equations are based on a single control volume and average aerosol concentration over the group based on the virion free ventilation rate for the group. That rate in turn is based on the average ventilation effectiveness VE for the group. The concentration field over the group need not be uniform, nor the temporal distribution. In many cases, the temporal distribution range could be large as time is required for the particles to travel after a cough to more distant seat locations.
The total dose of an exposed group of occupants to infectious aerosols, including the lag function after occupancy until equilibrium concentration is reached then, as pointed out by Walkinshaw, is the time integral of Eq. 1 (Walkinshaw, 2020).
It can be written
where.
DG = the dose for the exposed group of occupants.
ACH = spatial virion-free air changes per hour.
QB = respiratory inhalation rate per occupant.
Eq. 2 is a good group dose approximation (including re-ingestion by the sources) for non-uniform as well as uniform occupant emitted aerosol exposures if the occupants are spread out evenly in the space. When they are not, simply plug in the local VE.
In terms of the susceptible group:
If the group is large enough
If the emission of infectious aerosol emission ends at time t1, the group dose afterwards is given by
where
t1 = the length of time the infector is present, t1 < t.
Ns = number of susceptible occupants = NT-no
QT = spatial virion-free ventilation rate = NTQp
Infection equations
The Wells–Riley equation predicts the number of respiratory infections based on infector quanta shedding (1 quanta dose infects 63% of the group), inhalation and ventilation rates. It assumes infectious particles are randomly distributed throughout the air of confined spaces, together with a Poisson probability distribution. The equation was developed by Riley and colleagues in an epidemiological study on a measles outbreak in combination with the concept of a ‘quantum,’ or a quantity of virion required to infect n percent of an exposed group of weighted by their infectiousness, as proposed by Wells and Riley for a well-mixed room (Wells, 1955) (Riley et al., 1978).
Rearranging to solve for qn
The relationship between the virus and quanta shedding rates is defined as
Where
TCID50 = tissue culture median (not medium) infectious growth.
HID50 = virus copies for 50% human infectious dose.
QD50 = 50% quanta dose.
So.
QD50 = 0.693 quanta for 50% infection risk.
Eq. 6, can be modified to account for the time lag
where
NT = total occupants.
The reproduction number, r0, is
where
Filters
Maroto, in a landmark building filter study, measured aerosol mitigation per Figures 2, 3 for commonly available HVAC filters at normal air flow face velocities Moroto, M.D. 2011. The filter efficiencies she measured shown here have the rough equivalence of F6 = MERV 11–12, F7 = MERV 13, F8 = MERV14.
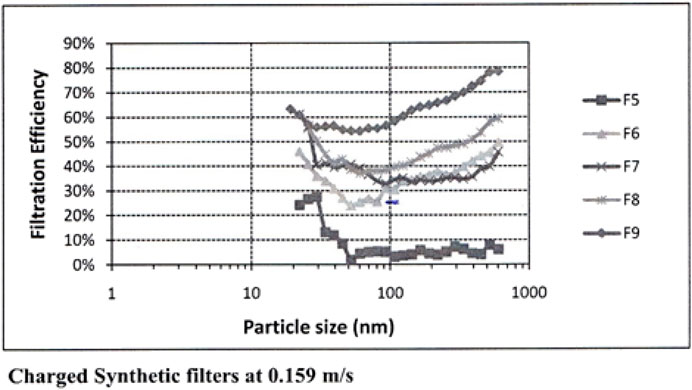
Figure 2. Charged filter performance from Moroto.
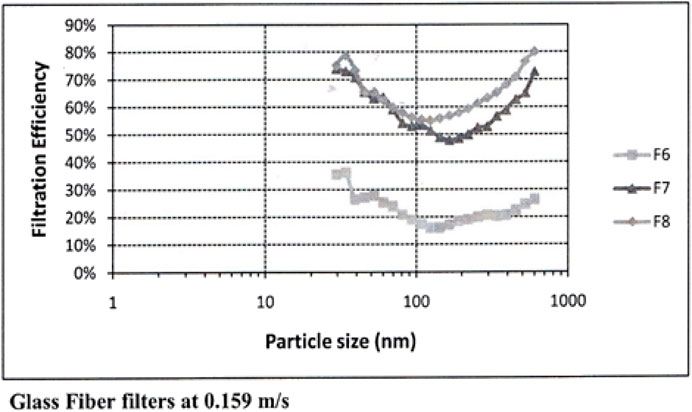
Figure 3. Glass fiber filter performance from Moroto.
Case studies
Case 1: Wide body commercial aircraft dose experiments
A group dose occupant generated aerosol inhalation comparison by Walkinshaw between the industry led TRANSCOM wide body aircraft experimental individual dose measurements and Eq. 2 predictions showed good agreement (Walkinshaw, 2020). The Transcom group dose measurement versus Eq. 2 prediction comparison is further investigated here.
In high air change settings such as commercial aircraft cabins and subway cars with high air change rates based on low occupant specific volumes (high occupancy density) the time to equilibrium concentration is 10 min or less (Walkinshaw, 2020). So for exposure times of hours, 1/ACH = ∼0, and Eq. 2 for group dose becomes
For the Transcom 777–200 tests, individual dose samples were taken at 3.5 L/min (QB = 0.1236 cfm); the airplane was ventilated with virion free air at 35 air changes per hour (ACH) with a volume of 15075 cubic feet and 333 seats giving a ventilation rate per seat/occupant Qp = 26.4 CFM/p. From Eq. 2 for VE = 1 and no = 1, the percent predicted to be inhaled, 100QB/Qp = 0.468%.
In comparison, each of the Transcom 777–200 ten different infector location group measurements over 5 adjacent rows where most of dispersion was contained, as illustrated in Figure 1 for one release test, are shown in Table 1. Their average is 0.469% with a standard deviation of 0.09486% which is within two figure accuracy versus the predicted value.

Table 1. Particle counter data from USTRANSCOM 777-200 hangar dosimeter tests.
Case 2: Quanta shedding rate during a bus trip
In January 2020, a bus carrying 67 passengers and one COVID-19 infectious passenger travelled 50 min each way to an event in Ningbo, China (Shen et al., 2020). The bus HVAC was on recirculation mode, so the air was exchanged once (before boarding) every 50 min. The bus was probably like an MCI 102DL3 Motor Coach Industries. After completing the round trip journey, there were 23 infections resulting from the index (shedding infector). No one wore masks.
Assuming an inhalation rate of 0.3 cfm, 67 susceptible passengers, an equivalent flow of 45.9 cfm (one air change every 50 min with a volume of 2,295 ft3) and VE = 1 the quanta source is (Eq. 7):
This COVID-19 infector shedding rate is consistent with influenza breath measurements by Yan et al (Yan, 2018) and the corresponding infectiousness measured by Nikitin et al. (Nikitin, 2014)
- 1,267 (fine) to 1,667 (fine + coarse) virus/minute (Yan et al.).
- 3< HID50/TCID50 < 5 (Nikitin, Alford).
From Eq. (11) there is a range of TCID50 from shedding rates:
The measured influenza TCID50 ranges between 300 and 3,000 virus copies (Nikitin) and with virion measured in airplanes and other settings (Yang et al., 2018) as calculated by Horstman and Rahai for two cases: qn = 0.645 case I, qn = 0.681 case II). (Horstman and Rahai, 2021).
Other infector shedding rates that might be compared include.
- Indoor infection risk of common respiratory infections and influenza based on carbon dioxide level qn = 0.25 to 2.13 quanta/min (Rudnick and Milton, 2003).
- Indoor infection risks for influenza and severe acute respiratory syndrome (SARS) qn = 1.12 quanta/minute (Chung-Min et al., 2005).
- Influenza indoor infection risks in an urban community qn = 0.467 quanta/minute (Gao et al., 2009).
Note that if VE = 0.7 on the bus, the infector quanta shedding rate would have been
qn = 0.7*0.675 = 0.473 quanta/minute.
Designing HVAC systems
For the purpose of developing a ventilation standard, the reproduction number is calculated for the beginning of the disease spread when only a single infector is present, and the setting occupants all are susceptible. Suppose epidemiology studies conclude that a basic reproduction number of ro = 2 for a generic disease would be a good target for the average infectious period of the index, the disease prevalence at the beginning then is
The current outside air requirements in ASHRAE Ventilation Standards provide some dilution of contagion (Ansi/Ashrae, 2018; Ansi/Ashrae, 2022a; Ansi/Ashrae, 2022b). ASHRAE Standard 62.1 for examples calls for a minimum of 5, 7.5, 10, or 20 cfm/person in different building spaces where people spend time together plus an additional 0.06, 0.12, or 0.18 cfm/ft2 (Ansi/Ashrae, 2022) of outdoor air ventilation based on space floor area. In buildings with high occupant density, the floor area based ventilation becomes a smaller fraction of the outside air flow and in general these buildings will be more susceptible to airborne disease transfer and more likely to benefit from additional filtered recirculation ventilation flow.
Many of the lower occupant density environments could already have a much lower ro with the current levels of ventilation and filtration but the filter virion removal efficiency assumed should be standardized. Many of these environments like offices could have a significant experience fraction (i.e., 40 h/week) but not contribute a proportional amount to ro.
This procedure sets a national reproduction number target based on the disease’s national prevalence. It requires knowledge of the population time fraction spent and occupancy experience present during that time in each indoor setting (schools, grocery stores, pharmacies, arenas, buses, subways, etc.) in order to set the amount of virion-free ventilation air required in that setting. Steady state occupancies only are considered.
Occupancy experience
During COVID-19, Linka et al estimated the basic reproduction number to be ro = 4.22 in Europe (Linka et al., 2020). Many of the lower occupant density environments could already have a much lower ro with their current rates of HVAC make-up air and recirculation air filtration but the filter virion removal efficiency assumed should be standardized. Many of these environments like offices could have a significant staff experience fraction (i.e., 40 h/week) but not contribute a proportional amount to population or staff/occupant ro.
Adding a target infectious aerosol maximum reproduction number into a ventilation standard could be done using for a generic respiratory disease aerosol shedding rate, size range, incubation period and HID50. For the examples here, we will use as the quanta source basis the average infectiousness of influenza.
From Nikitin (2014) the median Tissue Culture Infectious Dose (TCID50) assay for 5 strains of influenza was about qg = 1,460 virus copies and a 50% human infectious dose HID50/TCID50 ratio from 3 to 5 and an average of HID50 = 5,200 virus copies. From Leung (Leung et al., 2015) the average influenza shedding qg was about 1,460 virions/minute.
Each setting will contribute some fraction to the target maximum reproduction number ro either in the setting or nationally. Each setting HVAC design for the amount of virion-free ventilation air (filtered + outside) required to be supplied to each setting occupant might be done using one of the following procedures as required by authorities.
Equal reproduction
This sets the same reproduction target for each setting based on the disease’s national prevalence. This procedure requires knowledge of the typical number of regular and transient (leaving or entering) occupants in each setting and the time spent there by the regular occupants in order to set the amount of virion-free ventilation air required in that setting.
Equal reproduction and local prevalence
This sets the same reproduction target for each setting based on the disease prevalence in that setting. With this procedure, the reproduction number is based on a local prevalence. This procedure also requires knowledge of the typical number of regular and transient occupants in each setting and the time spent there by the regular occupants in order to set the amount of virion-free ventilation air required in that setting.
Occupancy experience example
The outdoor air ventilation and transient exposure times for four example settings might be as illustrated in Table 2. The second column is the hours per week spent in the setting environment. The third is the exposure hours to infectious aerosols per visit, the fourth the number of visits per week, the eighth column the number of occupants encountered in the setting environment each day and the ninth the average number in the setting.
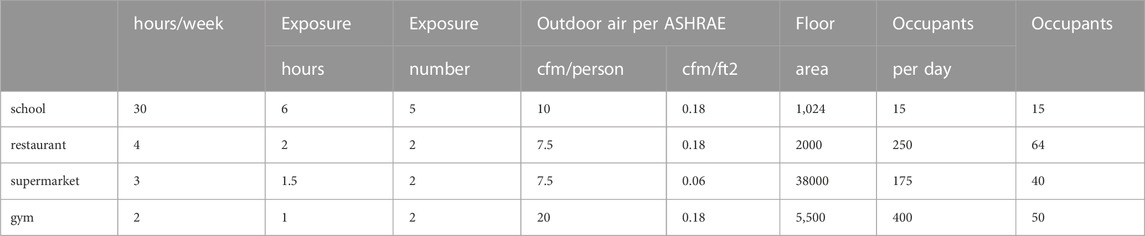
Table 2. Occupancy experience example input data for four settings.
The ventilation flow for all settings is increased by 1 plus the fraction of infections and then by a factor (i.e. 0.898) to obtain the target reproduction number, for example, ro = 2.5, using Eq. 15 gives the results in Table 3.
where
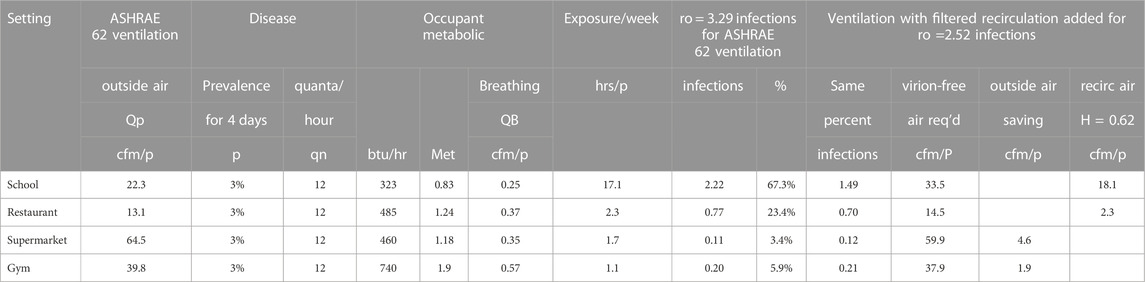
Table 3. Occupancy experience example recirculation flow requirements using Merv 13 filters η = 0.62 to achieve a combined reproduction rate ro of 2.5 for the four settings.
Recirculation and filtered flow
After determining the additional virion-free airflow required, the required filtered recirculation flow is found from the filter efficiency η:
The filter efficiency is determined by imposing the filter efficiency curve over the particle size distribution (Lee and Liu, 2012) (Kowalski and Bahnfleth, 2002). The example in Figure 4 uses a normal distribution to the sizes of influenza virus bearing particles measured in airplanes, daycare centers and health centers (Yang et al., 2018).
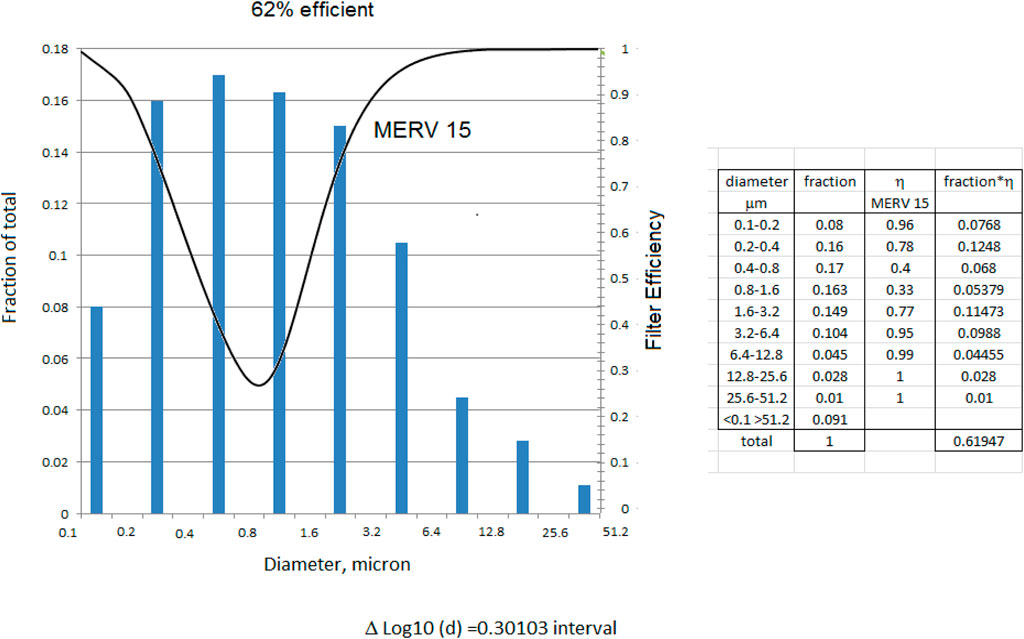
Figure 4. MERV 15 filter efficiency imposed on virus size distribution.
The school would require 18 additional recirculation cfm/person with MERV 15 filters (Table 3) following Maroto’s measurements (Figures 2, 3). (Maroto, 2011) to reduce the reproduction number by proportion to its contribution to airborne infections. This is based on a quanta shedding rate of qn = 0.2 quanta/minute, an infectious prevalence of 3% (pi = 0.03), susceptible population of 97% and an incubation period of 4 days.
This added filtration requirement need not represent a particular disease although the shedding rate applied here was for influenza.
Equal reproduction example
Equation 18 is used in calculating the recirculation flow requirements shown in Table 4 and Figure 5 for the various settings. Suppose the epidemiology studies show that an equal reproduction number should be the goal for all environments rather than the sum of the experience fractions. Also, suppose they show that the reproduction number should be based on a more infectious disease that lies between the quanta source estimated from airplane data (0.645–0.681 quanta/minute) (Horstman and Rahai, 2021) and less than 1.667 quanta/minute from asymptomatic SARS-CoV-2 subjects performing vocalizations (Buonanno et al., 2020).

Table 4. Compilation of Figure 5 using Equation 18 and national prevalence P = 0.03.
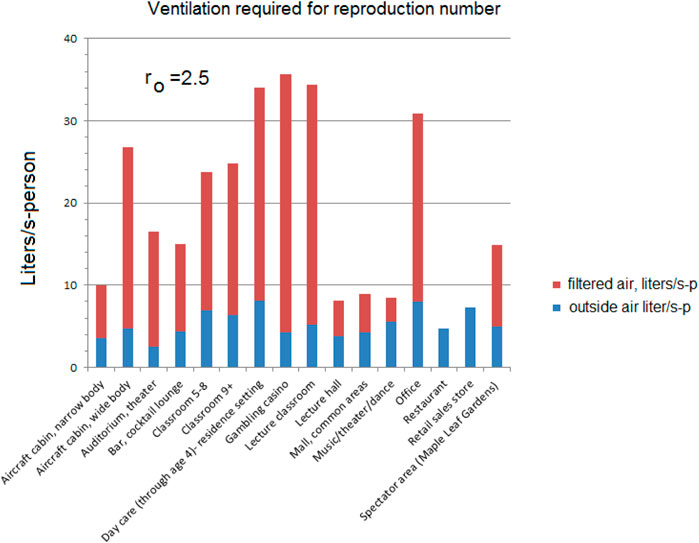
Figure 5. Equal reproduction example using Equation 18 and national prevalence P = 0.03 for ventilation designed for ro = 2.5.
Assumptions for equal reproduction number flows:
The number of infections, n, is calculated from the dose, D from Eq. 13,
The general population prevalence from Eq. 14
And the reproduction number from Eq. 14
Some venues were selected from the ASHRAE Standard 62.1 as examples of how an equal reproduction number standard might be based on filtered flow. The reproduction numbers are calculated from Eq. 6 as:
The amount of additional filtered flow to achieve the reproduction numbers varies with the venue, some not requiring any at all.
The total Ventilation required to obtain ro can be approximated using Eq. 14 where:
The flows required to reach the 2.5 reproduction number are higher using the approximation compared to those for ro = 2.5 in Figure 6; Table 5.
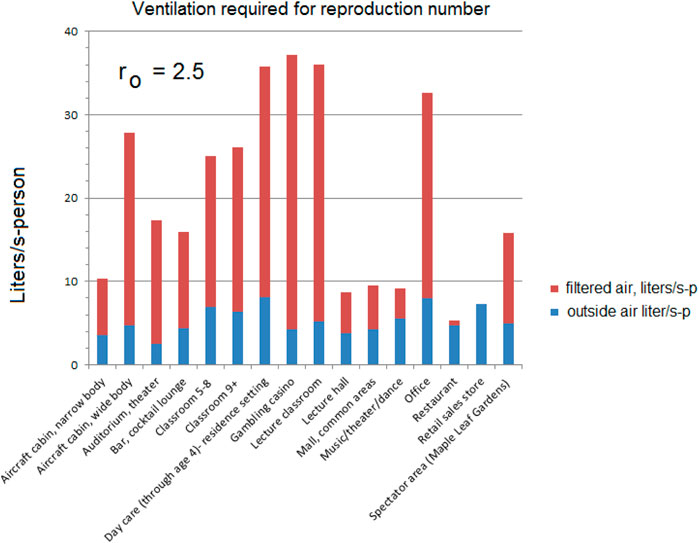
Figure 6. Equal reproduction example using the Wells-Riley approximation Equation 19 and national prevalence P = 0.03 for ventilation designed for reproduction ro = 2.5.
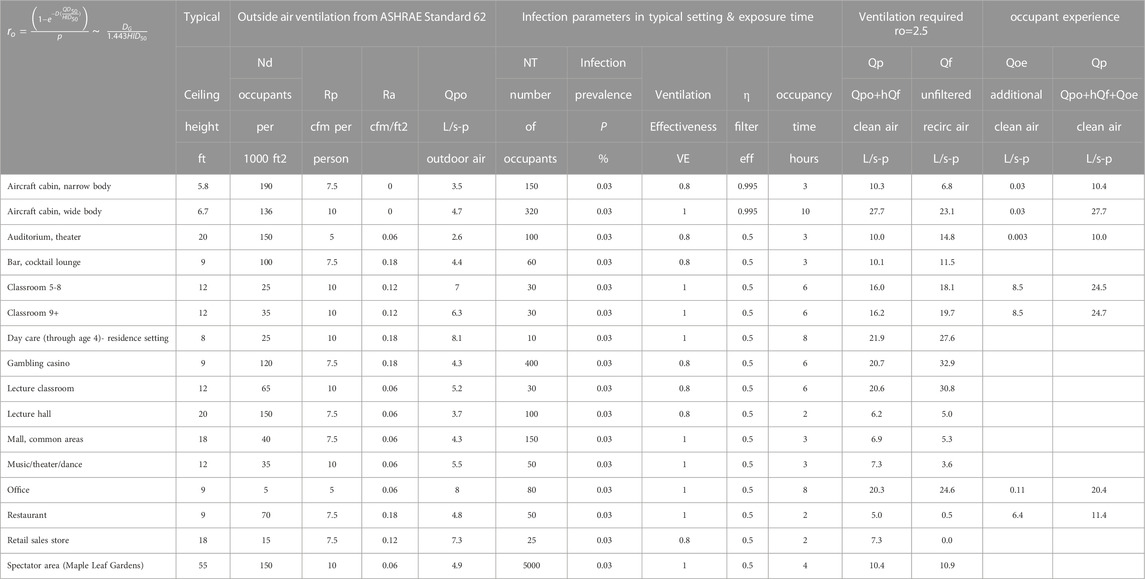
Table 5. Compilation of Figure 6 using Equation 19 and a national prevalence P = 0.03.
Equal reproduction and local prevalence example
With this method, the reproduction number is based on a local prevalence. That is, there is one infector, but the size of the group (number of susceptible) varies. First, the group dose is calculated with prevalence replaced with a single infector (index) no = 1 using Eq. 3 and then the reproduction number where
The possibility of zero infection follows a Poisson distribution:
For zero infection, x = 0
Probability of zero infections
Probability of infection for susceptible individual:
Risk for occupant i:
Total risk for all occupants:
Total risk for all occupants assuming a perfectly mixed volume:
Lambda is the quantity of the statistical unit inhaled for ith individual over time:
For the transient case, the virus dose is:
The reproduction number shows the number of infections from an infector, no = 1:
For steady state case t > 5 air changes:
In terms of quanta:
You get the Wells-Riley equation:
The prevalence for epidemiology enters the calculation as the number of susceptible out of the total number considered.
When applied to the other venues, the differences are less significant. Compare Figure 6; Table 5 with Figure 7; Table 6 there is some reduction in the smaller groups.
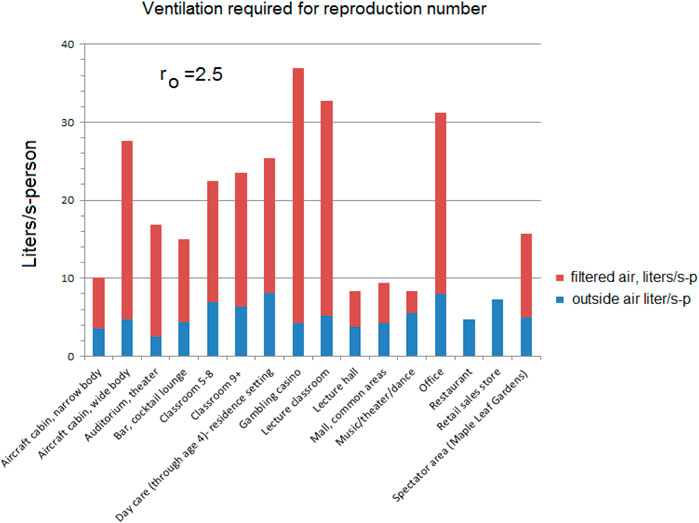
Figure 7. Equal reproduction example ventilation requirements for various settings to achieve ro = 2.5 using Equation 20, the data in Table 6 and local prevalence P = 1/NT (Equation 15).

Table 6. Compilation of Figure 7 using Equation 20 and local prevalence P = 1/NT for various settings for a reproduction rate ro = 2.5.
As noted earlier, some of these environments could already be exceeding these flows; the measured 33 l/s-p recirculation for offices (Persily (Morawska and Milton, 2020)) is higher than that required for ro = 2.5 (22.8 L/s-p).
If an air handling unit is set at 25% outside air and 75% recirculation with a filter efficiency of 0.62 as current practice, many of the environments will exceed the design flows for the reproduction number ro < 2.5 (Figure 8). Office buildings, for example, might have 20% outside air and 80% recirculation air (Walkinshaw, 2010b).
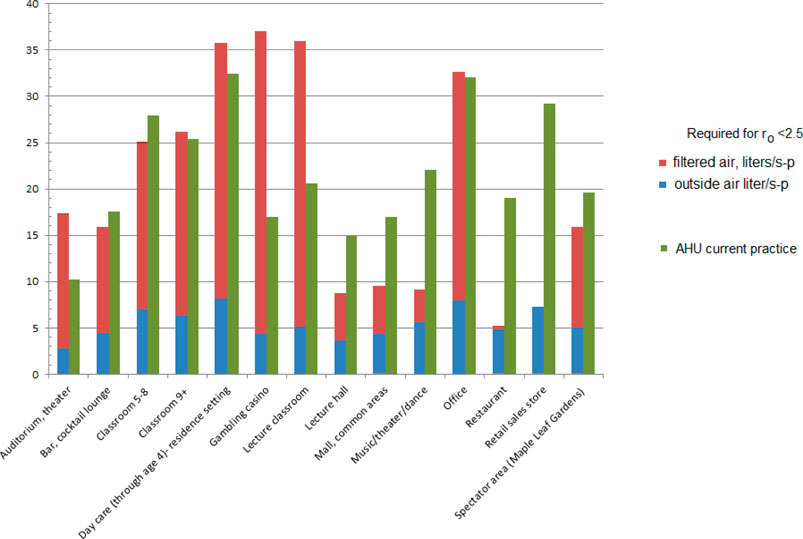
Figure 8. Comparison of design for ro and current practice.
Extremely small group of local prevalence (aka we should stay home)
For 100 people living in 38 houses (2.6 per house) a prevalence of 0.03 would be 3 houses full of infectors, or 7.8 houses if one infector is in each house. If the house volume is 433,244 L, with 0.3 air changes/hour, giving a ventilation of 13.9 l/s-p, VE = 1. There are 1.6 susceptible in each of 3 to 7.8 houses breathing at 0.132 l/s and an index shedding 1,000 virus/minute. If we assume the worst case where occupants can sustain mucociliary defense for 24 h, and the source continues while sleeping, then each of the three would have the group dose of (Eq. 3):
The average dose is for the Ns = 1.6 susceptible:
The infections for susceptible house from Eq. 25 with a single infector:
Compare this to the equal overall prevalence calculation p = 0.03 (Eqs 3, 25):
It is also important to note that these equations over-predict the dose when the groups are small. A more exact calculation of the individual dose using QT = 130000 L/h, QB = 475 L/h and ACH = 0.3
The group dose is 61.5% of the prevalence based group dose since the prevalence group is 2.6 and the susceptible group is 1.6:
Conveyor belt dose example
The preceding examples of reproduction numbers assume that the occupants and index are together during the exposure time and is a good basis for setting the ventilation rate. However, some consideration should be given to a stream of occupants each spending a limited time in a building. A good example is a drug store. Here the occupants spend a limited time and experience a fraction of the rising and falling concentration curves generated by the time spent inside by the index customer also passing through. A good example was given by Buonanno et al. (Buonanno et al., 2020).
The dose follows a rising curve, Eq. 3:
And a falling curve, Eq. 4:
And each customer in the drug store receives a dose relative to the time spent within these curves as if riding a conveyor belt.
In the reference example, there were always 10 customers in the drug store at any given time, each passing through while staying for 10 min. This example has one entering and exiting every minute. The index was in the stream and spent the first 10 min in the store. The doses reach the peak for customer 17, somewhat after the time that the infector departed. After about 2 ½ hours, 150 customers have visited the pharmacy, and all were exposed to varying degree. The 5 employees were present during the entire exposure. The cumulative Wells-Riley risk is 0.44 infections among the 150 customers and 0.22 infections among the 5 employees for a total of 0.66 infections. This is illustrated in Figures 9, 10.
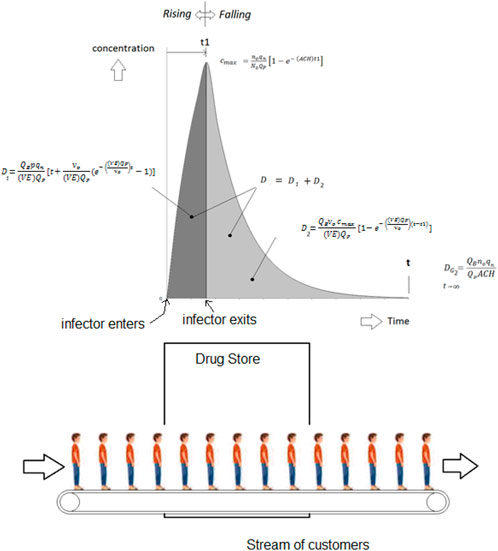
Figure 9. Customers passing through a drug store.
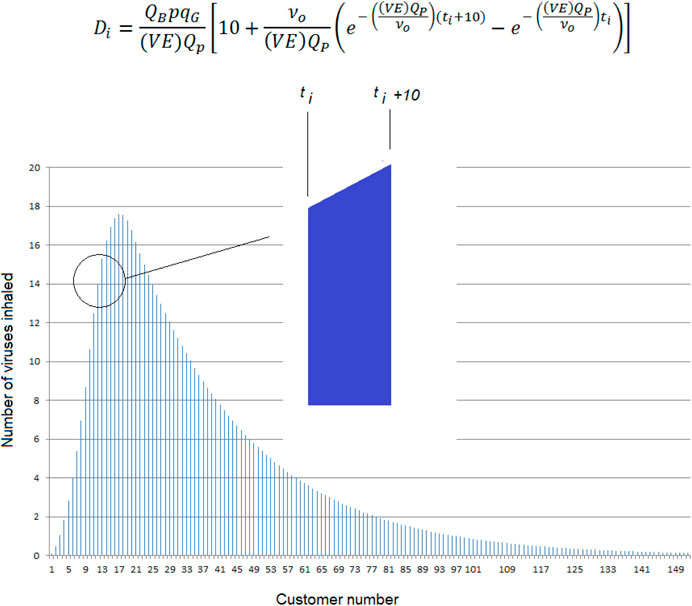
Figure 10. Dose equation applied to intervals of 10 min (descending equation not shown).
Oddly enough, had there been 15 employees present for 2½ hours and no customers except for the index for 10 min the number would have been nearly the same at 0.668 infections. This seems to indicate that the risk could be based on average occupancy over several “air changes.”
However, If one of the employees were the index (present during the 2 ½ hours) there would have been about 6 infections (this was using a rather infectious strain of influenza).
Discussion
While toxic and irritating gases and aerosols have been addressed in Building Code HVAC requirements for non-industrial settings, HVAC systems in the public mind are thought to be addressing thermal comfort rather than occupant health. This is not surprising given that odors seem to disappear in a few minutes once acclimatized in a space and in any case many toxic chemicals are odor-free while feeling too warm or too cold can be sensed by all and rectified by the HVAC system. However, this has all changed since COVID-19 has made the public very aware that what you inhale in an occupied setting whether you sense it or not can result in a very serious respiratory illness a few days later. Further, given that infectious aerosols shed from occupant breath were virtually an unknown vector of respiratory illness in the health community for many decades, it is understandable that HVAC standards have not addressed this infectious aerosol issue before now. However, at the time of writing ASHRAE published a new standard that addresses ventilation/filtration for aerosol infection control for thirteen occupancy categories. The basis for setting the flows is not presented but could eventually be tied to a reproduction number or equivalent infectiousness. The good news for this new understanding is that filtration of conditioned recirculated air, rather than having to add costly outdoor air, appears to be a very cost effective approach to addressing the now understood respiratory illness breath aerosol vector. This article has focused on enhancing the role of central HVAC system filtration to address respiratory illness spread. But there is also an opportunity for local air filtration to make strides as well. In both cases, designers must take care not to introduce air currents that while providing filtered air, coincidently transfer the breath of one occupant into the breathing zone of another.
HVAC engineers and their associations in order to establish minimum virion-free air supply rates for settings whether non-industrial or industrial, will require guidance from health authorities and epidemiologists on target national, regional, local or setting reproduction rates for some generic disease that represents current and future infectious aerosol size QD50, HID50, temperature and humidity criteria. Many strains of influenza or the common cold would be tolerable at the HVAC designed ro = 2.5, but infections like COVID-19, where so many have died, would still require masks and other pandemic measures if the target is to be an as low as possible ro.
There are at least two approaches, ‘occupancy experience’ or ‘equal reproduction,’ to finding a design reproduction number and these sometimes will produce different filtration requirements. A restaurant designed for occupancy experience ro could require an additional 5 cfm/p (2.36 L/-s-p) in total ventilation over the current outside ventilation requirement, but the same restaurant would have adequate ventilation under the current standard to achieve ro = 2.5 if designed for equal reproduction number among all buildings.
Of the HVAC approaches possible for setting virion-free ventilation/filtration rates setting by setting, the ‘occupancy experience’ approach is the most promising while the setting ‘equal reproduction’ approach is the most straightforward as it will not require some spaces to have higher ventilation/filtration per occupant rates than others for the same activity level. Residences with an ill person, while they potentially pose long infectious aerosol exposure times and low outdoor air supply rates per person, benefit intangibly at this point from room isolation.
It is important to note that HID50 is not a threshold limit. So, keeping exposure doses below an HID50 value, or any other such criterion, does not mean no one will get sick at values far below that criterion. Nevertheless, similar criterion should be applied to similar settings, taking into account confounding factors such as humidity and combustion particulate aerosol PM1 concentrations (Lowen, 2007) (Xiong, 2022).
HVAC engineers may be more comfortable working in dose (particles inhaled) calculations, rather than in disease risk and statistics. The former deals with pathogen particle count generation while the latter deals with pathogen toxicity (quanta) and statistics. Both require virion shedding data and the latter also infectiousness data, bearing in mind that pathogen emission rates promise to range widely with occupant age and activity level. Nevertheless, our calculations indicate that ventilation systems designed for the same maximum respiratory illness reproduction number in each setting will reduce the current infection risk posed by many common indoor settings. Similarly, virion-free ventilation rates based on time weighted exposures could potentially reduce the number of respiratory infections occurring seasonally in the entire population, for example, for the common cold. Furthermore, introducing targeted HVAC virion filtration plus mask wearing during pandemics such as COVID-19 where illness could be deadly, could make for the possibility of society continuing to function much more effectively.
The local prevalence of the disease in these equations is the fraction of the occupants that are shedding virus at the rate specified by the quanta. The actual prevalence of the disease is the fraction of the entire population that is infected. For example, during the “flu season” there could be 8% of the population or a prevalence of Pa = 0.08. that are infected but only one of 19 shedding at a high rate (5 × 10⁵ virus/30 min). The infectious prevalence of this infector is then pi = 0.421% or 1 out of 237.5 people. The local prevalence considers only the number of occupants that are present and is often much higher since the group is often much smaller.
If a single infector is shedding at a high rate among a group of NT = 24 occupants then the local prevalence is 1/24 = 4.17%. But the calculation represents only 10% of the occupied spaces containing 237.5 people. In actual situations the number susceptible could be quite low. In a hospital, the majority of the occupants could already be infected but not a source of virion. During cold/flu season, a significant percentage of the population could be excluded from the susceptible number for the same reason.
Diseases could be much more infectious than the target ro = 2 used in the example. For example, during the COVID-19 pandemic Linka estimated the basic reproduction number to be ro = 4.22 in Europe (Linka et al., 2020). Perhaps much of this prevalence could have occurred within family gatherings and under-ventilated social situations unaffected by commercial spaces ventilation, so the importance of requiring specified residential air filtration systems cannot be overemphasized.
The Wells -Riley equation is one of the tools used to predict the probability of respiratory infections occurring, n, and that these infections are more likely to occur if the infected person(s) shedding infectious aerosols are highly infectious and the ventilation rate per exposed person is low. A probability it is not deterministic and so will not predict the exact number of infections for every exposure but rather predicts the average over many exposures and large groups. Since infections of concern at this time normally occur in only a small percentage of those exposed, it is necessary to measure infections over large populations to validate the virion infection rates created on average by an ill person, ro. It is further complicated by the range of individual quanta (infectious dose for each virion of concern) variations within the population for each disease.
The basis for acceptable odor is also probabilistic. One cannot expect to have the same percentage dissatisfied with the perceived air quality in every situation especially for a small number of occupants.
A new basis for setting total ventilation could be another probabilistic relationship in which one cannot expect to have the same percentage infected with an airborne disease in every situation. Odor and airborne infection are similar in this way. Neither can be eliminated with dilution ventilation (Berg-Munch et al., 1986).
For example, Figure 11 illustrates the percent of dissatisfaction with odor (Berg-Munch et al., 1986) compared to the classical Wells-Riley equation for a room ventilated for 6 occupants for 1 hour, an inhalation rate of 0.3 cfm and 53 quanta per hour from the infector (Horstman and Rahai, 2021).
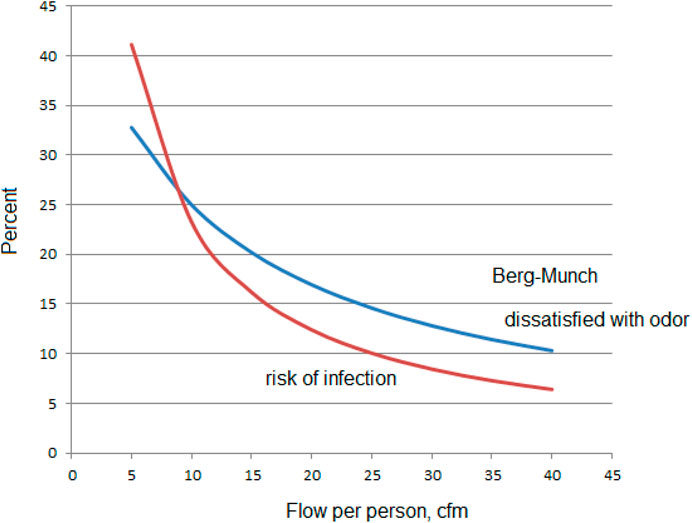
Figure 11. Comparison of two probabilistic criteria for setting ventilation requirements.
The same probabilistic approach is applied to thermal comfort (Fanger, 1970).
Under normal operating conditions, a commercial passenger aircraft ventilation system must be designed to provide each occupant with an airflow containing at least 0.55 lb of fresh (outdoor) air per minute (or about 10 cfm/p at 8,000 ft.) (Ventilation14 CFR 25.831 @ Amendment No. 25-87 (specifies new requirements) ASHRAE Standard 161 contains an outdoor flow requirement of 7.5 cfm/person and a minimum of 7.5 cfm of HEPA filtered recirculation. However, it recommends 12.5 cfm of HEPA filtered air person (Ansi/Ashrae, 2018). The ASHRAE standard provides more dilution
for particles than the FAA requirement and less for odor, but inhalation dose calculations indicate that filtration requirements should be increased for flights longer than 2 h to achieve the lower reproduction numbers (ro<<2.5) expected in many buildings as they are currently ventilated.
Epidemiology is a complex subject beyond the scope of this paper. However, the time and numbers spent by the population on average in each setting presumably can be identified using this tool, and these times can then be used to update ventilation standards setting the amounts of outdoor air plus virion-free filtered recirculation air required in each to setting to achieve a target population maximum respiratory pathogen reproduction number.
The last adjustment to the Wells-Riley model is the spatial/temporal nature of the ventilated volume and that can be addressed by CFD modeling or physical measurement. The equations presented here assume that concentrations rise and fall together but they usually lead or lag each other temporally but can be accounted for through the use of local ventilation effectiveness. However, this is a level of detail that may not be required when setting a ventilation rate standard. If it is, note that VE may be greater in the temporal part of the inhalation equation than it is in the proportional part in high occupancy density settings as concentrations rise more quickly when occupants are in close proximity.
Conclusion
1) The fact that infectious aerosols released from the breath of occupants were practically an unknown vector of respiratory disease in the healthcare community for many decades, understandably HVAC regulations have not addressed this issue yet.
2) While human breath aerosol shedding is still some way off from being fully developed for the range of activity levels and human infectious respiratory dose and illness severity that varies widely with occupant age, HVAC designs can move forward productively to address the infectious aerosol vector problem with the health data and engineering data and tools now available.
3) The increased energy and capital costs of improving and increasing recirculation filtration will be relatively small compared with the health and productivity savings possible.
4) Although it is not possible to eliminate the risk of airborne infection with dilution ventilation. That might not be desirable in any case (Schive, 2020). But if buildings were designed for sufficient virion-free ventilation to reduce the prevalence of most common respiratory diseases to ro = 2.5 this would also provide time for medical science to respond to a more lethal disease when it arrives.
5) The good agreement between the case study findings and these equation predictions indicate the likelihood of both being accurate for all practical purposes.
6) These equations and their example application provide a guide for organizations such as ASHRAE for designing HVAC systems to reduce the spread of colds and flu each winter and to prevent a future rapid reproduction of the next respiratory illness pandemic.
7) The dose equations provided apply to non-uniform as well as uniform occupant emission exposures if the occupants are spread out evenly in the space. When they are not, simply plug in the local ventilation effectiveness. The equations work best when 1.2>VE>0.8. Much lower VE’s could behave differently. More research is needed.
8) Some settings such as the typical office are shown to already have a relatively low respiratory infection reproduction rate.
9) Other settings, such as a typical school classroom or a longer commercial air flight, require increased filtered ventilation air flows to yield a similarly low reproduction rate.
10) Unlike noxious and irritating gases that can only mitigated practically by diluting them with outdoor air ventilation, the infectious aerosol illness transmission route can be addressed by circulating already-conditioned air through commonplace commercial filters.
11) It is critical to establish the size and quantity of the infectious particles required to cause infection to determine the role of filtration, particle settling or other HVAC parameters in reducing the risk.
12) There are at least two approaches, ‘occupancy experience’ or ‘equal reproduction,’ to finding a design reproduction number which sometimes will produce different filtration requirements.
13) The desirable ventilation rates for each environment could be designed on the lines set out here and applied broadly to include indoor spaces where the local population on average spends its time. If all systems are designed to a lower reproduction number that contains a weighting for the fraction of an infector’s time in each environment (percent of time in home, grocery store, movie theater, restaurant, etc.), then the population seasonal as well as potentially pandemic airborne infections should see a substantial decrease from current levels.
14) Filtration of the breath of each seated occupant might be developed as an alternative to or augmentation of mask wearing, as proposed for example, in theaters (Melikov, 2012) and aircraft passenger cabins (Chen, 2021) (Walkinshaw, 2010a).
15) It is time to develop a standard for total ventilation (outdoor air plus filtered recirculation air) with the additional goal of a target reproduction number ro for a specified generic disease.
16) There is no indoor air quality standard for HVAC system standard for recirculation rates. Currently these rates are calculated based only on thermal conditioning requirements. That needs to change.
17) On the basis of our calculations, better targeted HVAC air filtration, if applied on a national scale, will significantly decrease the incidence of respiratory illnesses throughout society with commensurate societal cost, productivity and health benefits. Some buildings may already have adequate infectious aerosol removal. For example, Canadian federal government office buildings are required to use MERV 13 filters which, to meet its thermal comfort standards, provide more than adequate infectious aerosol removal to meet the reproduction target suggested. (Public Works and Government Services Canada, 2012).
18) By lowering the concentration of respiratory aerosols, workers may not need not be confined to their homes during future pandemics, but if they do or if working from home becomes commonplace, increased residential outdoor air ventilation, in addition to improved recirculation air filtration, needs further investigation.
19) The quality and quantity of outdoor air, including fine particulate levels, and house occupancy must be considered in setting outdoor air filtration and quantity requirements.
20) The COVID-19 pandemic has therefore presented a new health paradigm that society as a whole and HVAC engineers in particular need to address before the next pandemic strikes.
Data availability statement
The original contributions presented in the study are included in the article/supplementary material, further inquiries can be directed to the corresponding author.
Author contributions
RH extended the group inhalation equations and calculations originally developed by DW for inhalation only, using the Wells-Riley infection equations. Both authors approved the submitted version.
Acknowledgments
The authors gratefully acknowledge the office building ventilation contribution to this article of Dr. Andrew Persily, the National Institute of Standards and Technology, and the support of Dr. James S. Bennett, CDC/NIOSH/DFSE/EPHB.
Conflict of interest
Author DW was employed by Indoor Air Technologies Inc.
The remaining author declares that the research was conducted in the absence of any commercial or financial relationships that could be construed as a potential conflict of interest.
Publisher’s note
All claims expressed in this article are solely those of the authors and do not necessarily represent those of their affiliated organizations, or those of the publisher, the editors and the reviewers. Any product that may be evaluated in this article, or claim that may be made by its manufacturer, is not guaranteed or endorsed by the publisher.
Footnotes
1Indoor Air Technologies Inc., VEFT Aerospace Inc. and ECHO Air Inc.
2HVAC/ECS Consultant.
3The Motor Coach Industries 102-DL3, part of their D-Series, manufactured 1992 to 2000, was a motorcoach available in Canada and the United States.
References
Ansi/Ashrae (2018). Ansi/ashrae standard 161-2018. Air quality within commercial aircraft. Atlanta, GA: Ashrae.
Ansi/Ashrae (2022a). Ansi/ashrae standard 62.1-2022. Ventilation and acceptable indoor air quality. Atlanta, GA: Ashrae.
Ansi/Ashrae (2022b). Ansi/ashrae standard 62.2-2022. Ventilation and acceptable indoor air quality in residential buildings. Atlanta, GA: Ashrae.
Bennett, J. S., Jones, B. W., Hosni, M. H., and Zhang, Y. (2013). Airborne exposure patterns from a passenger source in aircraft cabins. HVAC&R Res 19 (8).
Berg-Munch, B., Clausen, G., and Fanger, P. O. (1986). Ventilation requirements for the control of body odor in space occupied by women. Environ. Int. 12, 195–199.
Buonanno, G., Stabile, L., and Morawska, L. (2020). Estimation of airborne viral emission: Quanta emission rate of SARS-CoV-2 for Infection Risk Assessment. doi:10.1016/J.Envint.2020.105794
Centers For Disease Control and Prevention (2021). How TB spreads. Available at: https://www.cdc.gov/tb/topic/basics/howtbspreads.htm (Accessed July 15, 2021).
Centers For Disease Control and Prevention (2021). Your guide to masks. Available at: https://www.cdc.gov/coronavirus/2019-ncov/prevent-getting-s (Accessed July 22, 2021).
Chen, Q. Y. (2021). Risk of airborne COVID-19 virus transmissions in Airliner cabins. ASHRAE Winter Conf. Semin. 23, 2021.
Chen, W., Zhang, N., Wei, J., Yen, H., and Li, Y. (2020). Short-range airborne route dominates exposure of respiratory infection during close contact. Build. Environ 176, 106859.
Chung-Min, L., Chao-Fang, C., and Huang-Min, L. (2005). A probabilistic transmission dynamic model to assess indoor airborne infection risks. Risk Anal 25 (5), 1097–1107. doi:10.1111/j.1539-6924.2005.00663.x
Domínguez-Amarillo, S., Jesica, F-A., Sonia, C-G., and Roberto Alonso, G-L. (2020). Bad air can also Kill: Residential indoor air quality and pollutant exposure risk during the COVID-19 crisis. Int. J. Environ. Res. Public Health 17 (19), 1–34.
Fanger, P. O. (1970). Thermal comfort: Analysis and applications in environmental engineering. Denmark: Danish Technical Press, 244.
Ferreira, A., and Barros, N. (2022). COVID-19 and Lockdown: The potential Impact of residential indoor air quality on the health of Teleworkers. Int. J. Environ. Res. Public Health 19 (10).
Gao, X., Yuguo, L., and Gabriel, M. L. (2009). Ventilation control of indoor transmission of airborne diseases in an urban community. Indoor Built Environ. 18 (3).
Horstman, R. H., and Rahai, H. R. (2021). A risk Assessment of an airborne disease inside the cabin of a passenger airplane. SAE Int. J. Adv. Curr. Prac. Mobil. 3 (3), 1263–1271. doi:10.4271/2021-01-0036
Morgenstern, J. (2021). COVID-19 is spread by aerosols: An evidence review. Available at: https://first10em.com/covid-19-is-spread-by-aerosols-an-evidence-review (November 30, 2020).
Fennelly, Kevin P. (2020). Particle sizes of infectious aerosols: Implications for infection control. Lancet Respir. Med. 8, 914–924.
Kowalski, W. J., and Bahnfleth, W. P. (2002). MERV filter models for Aerobiological applications” Researchgate 237558312. Pennsylvania: The Pennsylvania State University.
Kudo, E., Song, E., Yockey, L. J., and Rakib, T. (2019). Low ambient humidity impairs barrier function and innate resistance against influenza infection. PNAS 116 (22), 10905–10910.
Morawska, L., and Milton, D. K. (2020). It is time to address airborne transmission of Coronavirus disease 2019 (COVID-19). Clin. Infect. Dis. 71, 2311–2313. doi:10.1093/cid/ciaa939
Morawska, L. (2020). How can airborne transmission of COVID-19 indoors be minimised? Environ. Int 142, 105832.
Lee, K. W., and Liu, B. Y. H. (2012). On the minimum efficiency and the most penetrating particle size for fibrous filters. J. Air Pollut. Control Assoc. 30 (4), 377–381. doi:10.1080/00022470.1980.10464592
Leung, N. H. L., Chu, C., Ip, D. K. M., and Cowling, B. J. (2015). The fraction of influenza virus infections that are asymptomatic: A systematic review and meta-analysis. Epidemiology 26 (6), 862–872.
Linka, K., Mathias, P., and Ellen, K. (2020). The reproduction number of COVID-19 and its correlation with public health interventions. medRxiv.
Lowen, A. C. (2007). Influenza virus transmission is dependent on relative humidity and temperature. PLoS Pathog. 3, e151.
Maroto, M. D. (2011). Filtration efficiency of intermediate ventilation air filters on ultrafine and submicron particles. Master's thesis. Goteberg (Sweden): Department of Energy and Environment, Division of Building Services Engineering, Chalmers University of Technology, 14.
Marr, L. C., Tang, J. W., Van Mullekom, J., and S Lakdawala, S. (2019). Mechanistic insights into the effect of humidity on airborne influenza virus survival, transmission and incidence. J. R. Soc. Interface 16, 20180298. doi:10.1098/rsif.2018.0298
Melikov, A. K. (2012). Seat Headrest-Incorporated personal ventilation: Thermal comfort and inhaled air quality. Build. Environ. 47, 100–108. doi:10.1016/j.buildenv.2011.07.013
Leung, N. (2020). Respiratory virus shedding in exhaled breath and efficacy of face masks. Nat. Med. 26, 676–680.
Nikitin, N. (2014). Influenza virus aerosols in the air and their infectiousness. Adv. Virol. 2014, 859090. doi:10.1155/2014/859090
Persily, A., and Gorfain, J. (2008). Analysis of ventilation data from the U.S. Environmental Protection Agency Building Assessment Survey and Evaluation (BASE) Study.
Public Works and Government Services Canada (2012). Mechanical; environmental standard for federal office buildings. Available at: https://publications.gc.ca/site/archivee-archived.html?url=https://publications.gc.ca/collections/collection_2013/tpsgc-pwgsc/P4-50-2012-eng.pdf.
Riley, E. C., Murphy, G., and Riley, R. I. (1978). Airborne spread of measles in a suburban elementary school. Am. J. Epidemiol. 107, 421–432.
Rudnick, S. N., and Milton, D. K. (2003). Risk of indoor airborne infection transmission estimated from carbon dioxide concentration. Indoor Air 13 (3), 237–245. doi:10.1034/j.1600-0668.2003.00189.x
Shen, Y., Li, C., and Dong, H. (2020). Community outbreak investigation of SARS-CoV-2 transmission among bus riders in eastern China. JAMA Intern Med180 (12), 1665–1671.
Silcott, D. (2020). TRANSCOM/AMC commercial aircraft cabin aerosol dispersion tests. Available at: https://www.ustranscom.mil/cmd/docs/TRANSCOM%20Report%20Final.pdf (Accessed 1 2, 2021).
Walkinshaw, D. S. (2010). Venturi filtration added to Gaspers, Diffusers, VAV Boxes and air Curtains. ASHRAE Winter Conf.
Walkinshaw, D. S. (2020). ASHRAE Journal pp 12-18. Archival version. Covid 19 and beyond: A Brief introduction to passenger aircraft cabin air quality.
Wolkoff, P. (2018). Indoor air humidity, air quality, and health – an overview. Int. J. Hyg. Environ. Health. Volume 221, 376–390.
Xiong, J. (2022). The association between daily-diagnosed COVID-19 morbidity and short term exposure to PM1 is larger than associations with PM2.5 and PM10. Environ. Res. 210, 113016.
Yan, J. (2018). Infectious virus in exhaled breath of symptomatic seasonal influenza cases from a college community. PNAS January 30, 1081–1086. doi:10.1073/pnas.1716561115
Keywords: respiratory infections, HVAC filtration, infectious aerosols, Wells-Riley, COVID-19, infection reproduction rate, energy, ventilation standards
Citation: Walkinshaw DS and Horstman RH (2023) Covid 19 and beyond: a procedure for HVAC systems to address infectious aerosol illness transmission. Front. Built Environ. 9:999126. doi: 10.3389/fbuil.2023.999126
Received: 20 July 2022; Accepted: 19 April 2023;
Published: 17 July 2023.
Edited by:
Ali Ghahramani, National University of Singapore, SingaporeReviewed by:
Giuseppe Riccio, University of Naples Federico II, ItalyRoberto Alonso González-Lezcano, CEU San Pablo University, Spain
Copyright © 2023 Walkinshaw and Horstman. This is an open-access article distributed under the terms of the Creative Commons Attribution License (CC BY). The use, distribution or reproduction in other forums is permitted, provided the original author(s) and the copyright owner(s) are credited and that the original publication in this journal is cited, in accordance with accepted academic practice. No use, distribution or reproduction is permitted which does not comply with these terms.
*Correspondence: Douglas Stuart Walkinshaw, ZHN3QGluZG9vcmFpci5jYQ==