 Peiyang Li1
 Jacek A. Koziel1,2*
 Bauyrzhan Yedilbayev3Reid Vincent Paris4William B. Walz1
 Brett C. Ramirez1
- 1Department of Agricultural and Biosystems Engineering, Iowa State University, Ames, IA, United States
- 2Livestock Nutrient Management Research Unit, USDA-ARS Conservation and Production Research Laboratory, Bushland, TX, United States
- 3Department of Chemical Processes and Industrial Ecology, Satbayev University, Almaty, Kazakhstan
- 4Department of Statistics, Iowa State University, Ames, IA, United States
Ultraviolet-C (UV-C) germicidal light can effectively inactivate airborne pathogens and mitigate the transmission of infectious diseases. As the application of UV-C for disinfection gains popularity, practical estimation of UV irradiance is essential in determining the UV fluence (dose) and designing tubular UV lamp configurations for indoor air treatment. It is generally understood that the inverse square (∼1/d2) law (i.e., irradiance is proportional to the inverse square of the distance) applies well to point light sources. However, there has been a recognition that the ∼1/d2 law does not work well for tubular light sources in the commonly defined near-field applications where the UV source is relatively close to the treated air. Therefore, practical near-field irradiation estimation is needed for designing portable air cleaners and heating, ventilation, and air conditioning (HVAC) ducts with built-in UV light bulbs. This research investigated UV-C light irradiance from tubular (L = 0.9 m) light bulbs at near distances inside an air cleaner prototype duct under three power output (1-, 4-, and 8-bulb) scenarios and conducted theoretical estimation based on a line-source irradiation model. Similarly sized visible fluorescent bulbs were used as a reference. The data were fitted on both ∼1/d2 and ∼1/d correlation of irradiance with distance. Both measured and line source estimated data fit better (i.e., evaluated by R-square, standard errors, root mean squared errors) with the ∼1/d than the ∼1/d2 relationship in the near distance. Although the differences between the measured and the modeled were observed, the pattern of light distribution generally follows an inverse relationship (∼1/d) with distances (d) shorter than two tubular bulb lengths (d < 2L). The pattern applies to both UV and visible light tested in this study. It is recommended that the inverse (∼1/d) correlation be used for near-distance estimation of light distribution, especially for disinfection purposes in air ducting for indoor air quality improvement and airborne disease mitigation.
Introduction
The resurgence of infectious diseases, such as COVID-19 that can be transmitted through airborne routes has emphasized the need to mitigate the spread of risk from one person to another. In indoor environments, air recirculation in heating, ventilation, and air-conditioning (HVAC) systems has been adopted in many modern buildings for energy-saving and sustainability concerns. However, airtight indoor spaces may increase the concentration of airborne pathogens and lead to higher infection risk. There is a need to enhance indoor air cleaning as an effective control measure for airborne diseases. Besides air filtration, air disinfection or decontamination is a common way to contain airborne pathogens and lessen the spread of infection. In the past few decades, the application of ultraviolet (UV) light has gained popularity for air and surface decontamination for pathogen control, especially during the COVID-19 pandemic (Storm et al., 2020; Bergman, 2021; Browne, 2021). Filtering or treating indoor air by UV can, to some extent, contribute to ventilation rates in terms of adding air changes per hour equivalent (ACHe) to the existing air changes per hour (ACH) to mitigate indoor airborne pathogen concentrations (Allen and Ibrahim, 2021; Kahn and Mariita, 2021). Ultraviolet germicidal irradiation (UVGI, commonly practiced at UV-C wavelength range) can be categorized into three general groups for air treatment purposes: (1) in-duct or one-pass systems, (2) upper-room, and (3) whole-room (Nunayon et al., 2023). To ensure broader and effective adoption of UVGI, there is a need to understand its irradiation pattern and performance to provide credible information for building designers and administrators for better decision-making. For in-duct or one-pass system UV applications, there is a need to practically estimate the UV light irradiation and configurations of the lamps to reach the target UV irradiance and dose targets generally available for common pathogens.
The range of light irradiation or illumination can be described as “near-field” or “far-field,” referring to the distance from the source about the source size. At a far distance, a luminaire (i.e., a light-emitting body) can be regarded as a “point source” (light irradiating from a point, following the inverse square law) for light modeling and calculation because its physical dimension is relatively insignificant compared to the distance to the user or the illuminated objects. The inverse square law states that the light irradiance or illuminance is inversely proportional to the square of the distance from the light source (Keitz, 1971). Keitz (1971) documented the derivation of the inverse square law for light intensity. However, the derivation of the equation was a mathematical derivation based on spatial geometry, not an empirical expression with any observed or experimentally derived parameters.
A common practice “five times rule” or “ten times rule” states that the luminaire can be regarded as a point source when the distance to the target object is at least five times the largest dimension (in the case of tubular source, the length) of the luminaire. Above five distances (in some cases, ten distances, for improved accuracy purposes), the light irradiation can be regarded as far-field, and the inverse square law can be applied with negligible error down to 1% (ANSI/IES, 2022a; Keitz, 1971); with ten distances above, the error can be reduced to 0.5% (Keitz, 1971). However, within five distances, the luminaire can be regarded as near-field irradiation, and the light distribution characteristics in that range are not well documented in the literature. (The definition of the terms “far-field” and “near-field” were adopted from standards ANSI/IES LM-91-22 and ANSI/IES LS-1-22 and should not be confused with the same terminology used in research on electromagnetic fields.)
Studies from luminaire manufacturers’ perspectives have focused on measuring and calculating the UV lamp output (power), especially in terms of power consumption and UV output efficiency, for quality assurance and quality control purposes. From the luminaire users’ standpoint, however, the actual irradiance on the target of disinfection or decontamination is more important in applications aiming to achieve a specific UV dose. In many applications, the effective irradiation or illumination needs to take place in the very near field (much shorter than five times the largest dimension of the luminaire), especially in portable air cleaners (with built-in UV light bulbs), HVAC ducts, and horticultural applications (such as in greenhouse plants with artificial light). Another example of near field UV applications is commercial UV germicidal chamber for pass-through shipment packages and personal items decontamination (Ruston et al., 2021). Keitz (Keitz, 1971, p. 140) recognized the difference in the illumination values of linear light sources between more detailed theoretical models and simpler estimates obtained by the inverse square law. Light designers also discovered noticeable differences in applying far-field characterizations of a luminaire to a near-field application scenario (Ashdown et al., 2022).
Therefore, the objective of this research was to investigate the effects of spatial position, distance, and power output (1-bulb, 4-bulb, and 8-bulb) on UV irradiance and visible illuminance near distance. This paper presents a practical insight into light intensity measurements and modeling analyses investigating the pattern of UV-C and visible light intensity distribution in near-field applications relevant to indoor air.
Materials and methods
Overview of light intensity measurement and estimation
Two methods of quantifying UV and visible light intensity were used in this experiment, including physical measurement and linear (tubular) source estimations. An illustration comparing line and point-source estimation is shown in Figure 1. Due to the nature of the tubular bulb, line source instead of point source estimation was chosen. The light irradiance (W/m2) was measured or estimated for UV-C lamps, and illuminance (lux) was used for fluorescent lamps. The light measurements took place both inside the air duct and outside of the air duct on vertical (virtual) planes parallel to the light bulbs. The theoretical estimations were based on existing photometric equations with simplifications tailored to practical needs. Three different power output and consumption modes (8-bulb, 4-bulb, and 1-bulb) were adopted for the investigation.
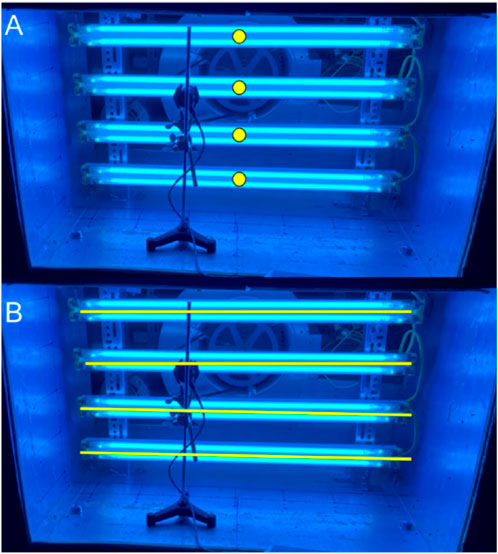
FIGURE 1. Two estimation methods, point source estimation (A) and line source estimation (B), were illustrated. The point source assumption regards the light irradiating or illuminating from the center (an infinitesimal point) of the light bulb (or fixture), while the line source assumption treats the light bulbs or fixtures as finite line segments. Due to the nature of the tubular bulb, line source instead of point source estimation was chosen.
In the three-dimensional space of the shape of the air duct (retrofitted from Li et al., 2022), a Cartesian coordinate system was established for the ease of calculation accommodating the light bulbs and fixtures, as described in Figure 2. The reason for choosing the Cartesian coordinate system instead of the spherical system was that this research dealt with line source modeling and point-based measurements, and therefore, setting a coordinate centralizing the light source as the origin would not be feasible. Cartesian coordinates provide more flexibility in defining and positioning all points and line sections and quantifying the distance between them. The coordinate system was used to document the positions of all the 35 designated points (7 × 5) per plane, with nine planes total. It was also used to calculate the distances between a point to another point and between a point to a line to be used in the line source model estimations. Figure 3; Supplementary Figure S1 illustrate the side view (y-z axis) of all the points of investigation (measured or estimated) from each measurement plane along the y-axis.
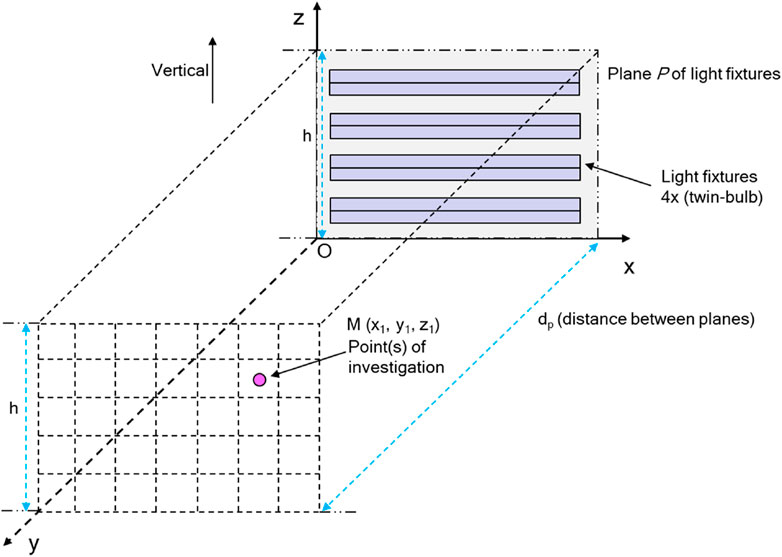
FIGURE 2. A Cartesian coordinate system was used for the coordinates of each measurement point. The light fixtures lay in the x-z plane. All vertical planes were parallel to the x-z plane along the y-axis.
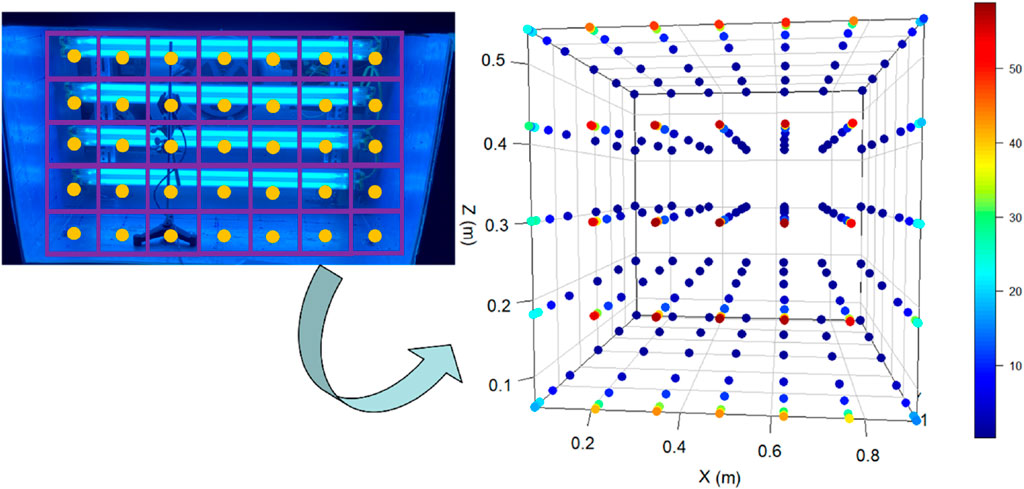
FIGURE 3. The figure on the left indicates the light intensity measurements were conducted on vertical planes with 35 grids. The irradiance and illuminance were measured in the center of each grid (yellow dots) to represent the irradiance of each grid. The right side figure displays a 3-D view of all the points of light measurement, viewed from the light bulb plane towards the measurement planes, from near the light source too far away from the light source. The color gradient refers to the relative light irradiance from high to low (red to green to blue), as the distances from the light source increase (The left side of the figure was adopted from Li et al. (2022), under a Creative Commons license.).
Light measurements for UV-C and visible light bulbs
The UV bulb was a low-pressure monochromatic mercury UV-C bulb (G30T8, Ushio America Inc., Cypress, CA, USA). The UV-C bulb had a central wavelength of 254 nm, with minor components of the visible spectrum and other UV wavelengths. The bulb had a physical dimension of 90 cm (36 in.) in length, and 2.5 cm (1 in.) in diameter, with a nominal UV power output of 13.9 W and nominal power consumption of 30 W. A type of visible light bulb (fluorescent light bulb, F30T8, 4100K color temperature; General Electric, Boston, MA, USA) that had the same physical dimension and nominal power consumption as the UV bulb was also used as a reference. Twin-bulb light fixtures (Lithonia Lighting, Atlanta, GA, USA) were used for mounting and powering each bulb type.
In a recently tested air cleaning prototype (Li et al., 2022; Li et al., 2023) with duct housing UV-C bulbs and fixtures, fibrous and aluminum filters were modified and retrofitted for light measurement on UV-C and visible light as well as light intensity estimation based on current theoretical equations. All the fibrous and aluminum filters were removed prior to the beginning of the experiment to make sure there was no blocking of light distribution. The air-cleaning prototype had a symmetric layout of lamp fixtures, and therefore, only one side was used for the light output experiments. The cross-sectional area of the air cleaner duct was 1.52 × 1.02 m (60 × 40 in.). The distance between the edge of the light bulbs’ vertical plane to the end of the duct was about 0.37 m (14.5 in.).
The measurements were conducted on vertical planes that are parallel to the light bulbs and perpendicular to the directed airflow of the air cleaner (although the air cleaner motor was not turned on during light measurements). A grid measurement method was adopted, and the vertical plane was divided into 7 × 5 grids, with each grid 0.14 × 0.12 m. During measurement, the factory-calibrated radiometer (ILT 1700 radiometer, International Light Technologies, Peabody, MA, USA) was positioned at the center of each grid. Light output at 35 points was measured for each plane, and three different distances of vertical planes 0.0762 m, 0.127 m, 0.254 m (or 3 in., 5 in., 10 in., respectively) in total. The data regarding the distance of 0.0254 m (1 in) was later disregarded due to the proximity to the light source.
The UV-C irradiance (units: W/m2 or mW/cm2) was measured using a radiometer (ILT 1700; International Light Technologies, Peabody, MA, USA) with a wavelength-specific light detector and filter (SED240 light detector, NS254 filter, both made by the same company mentioned above). The combination of the light detector and the filter measured a center wavelength of 254 nm with a range of 254–257 nm. The manufacturer has a ±6.5% transfer uncertainty to customers and a ±2.4% uncertainty from the National Institute of Standards and Technology (NIST). The confidence level of the uncertainty is 95%. Visible light (400–700 nm) was measured using the same radiometer with a different detector (SED033) and filter (Y4) combination that measures the visible wavelength spectrum (400–700 nm). The manufacturer has a ±4.3% transfer uncertainty to customers and a ±0.5% uncertainty from the National Institute of Standards and Technology (NIST), with a confidence level of 95%.
Estimation based on the line source assumption
In practical, such as germicidal or horticultural applications, the targeting area in which the light irradiated may be shorter than five times the bulb length, especially when it comes to tubular-shaped light bulbs such as common mercury and fluorescent lamps used in this research. For a tubular light bulb, it typically cannot be regarded as a point source in the near field, i.e., the distance to the light source is relatively small compared to the dimension (length) of the light source. For the convenience and accuracy of calculation, this type of light calculation can be regarded as a line source. Some studies, such as Sasges et al. (2007) and Lawal et al. (2017) have adopted the following equation (Equation 1), based on Keitz (1971) to calculate monochromatic UV (e.g., 254 nm) output power (radiant flux) in cases where the distance (d) between the light detector and the light source is at least twice the length (L) of the tubular bulb as shown in Figure 4, where d is at least equal to 2L. Also, Sasges et al. (2007) compared the goniometric measurements of lamp output across laboratories in multiple countries and found the results within 5% of the actual values.
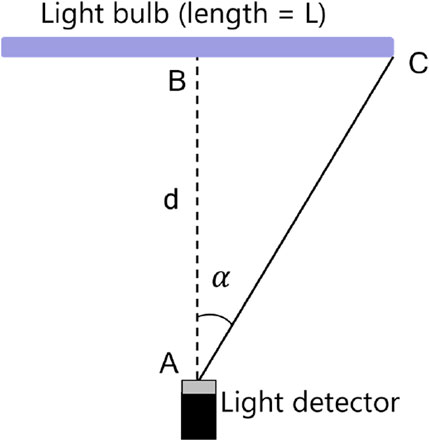
FIGURE 4. Top view of the schematic on measurement of tubular bulb output by a light detector. The measured light output has a correlation with the power output of the light bulb, as described in Eq. 1. The figure illustrates the simple measurement method. L is the length of the light bulb, d is the distance between the center of the bulb to the light detector, α is the angle (radians) between the centerline of the bulb to the line connecting the light detector and one light bulb electrode tip.
Where Φ is the total UV power of the bulb (W) or the total luminous flux of the bulb (lumen); E is the measured UV irradiance (W/m2) or light illuminance (lux); d is the distance (m) between the lamp center and the UV detector; L is the lamp arc length (m) measured from one electrode tip to another electrode tip (covered in a quartz sleeve); α is the angle (in radians) between the perpendicular line from the UV detector to the lamp and the line connecting the UV detector and one electrode tip (i.e., arctan (L/2d)).
Eq. 1 can be rewritten to Eq. 2 to estimate the irradiance when the UV power output is known (when d > 2L). Eq. 4 was also documented in Chapter 17 (pages 17.5–17.6) of the 2020 ASHRAE Handbook–HVAC Systems and Equipment (ASHRAE, 2020) but the range of applicable distances was not specified. The equation describes that the irradiance or illuminance is inversely proportional to the distance to the light source, which is different than the relationship under the point source estimation.
The limitation of Eqs 1, 2 is that it is preferred that the measurement needs to be conducted horizontally (although not exclusively) between the light bulb and the light detector (i.e., the surface of the light detector is positioned to be parallel with the light bulb). Lawal et al. (2017) suggested that the distance between the detector and the bulb needs to be at least twice the bulb length; therefore, the detector can entirely “see” the entire bulb length due to the size of the view angle or opening of the light detector. Therefore, this method is not suitable to compare estimated irradiance or illuminance with the measured irradiance or illuminance on planes parallel to the light bulb as described in Section 2.2 and relevant to this application.
In near-field applications when d < 0.5L, the irradiance can also be regarded as inversely proportional to the distance between the light detector and the light source (∼1/d), and therefore Eq. 2 can be simplified to Eq. 3, as described in the 2020 ASHRAE Handbook,
Keitz (1971) concluded that when the distances between the light source and the light detector are roughly a quarter of the light source length (d = 0.25L), the illumination is inversely proportional to the distance, as shown in Eq. 4:
Where E is illumination (lux), I1 is luminous intensity per unit length (cd/m) (Keitz, 1971) (p. 138) or the radiant intensity per unit length (W/m) along the length of the tube, d is the perpendicular distance (shortest) between point P of interest to the light source.
However, neither Eq. 3 nor Eq. 4 was documented as applicable in cases when d is between 0.5L and 2L. Therefore, a universal formula (Keitz, 1971) is needed as described in Eq. 5 for scenarios regardless of the d and L relationship. Eq. 5 incorporates the length of the light bulb, the relative position of the light bulb, and the point of target (Figure 5).
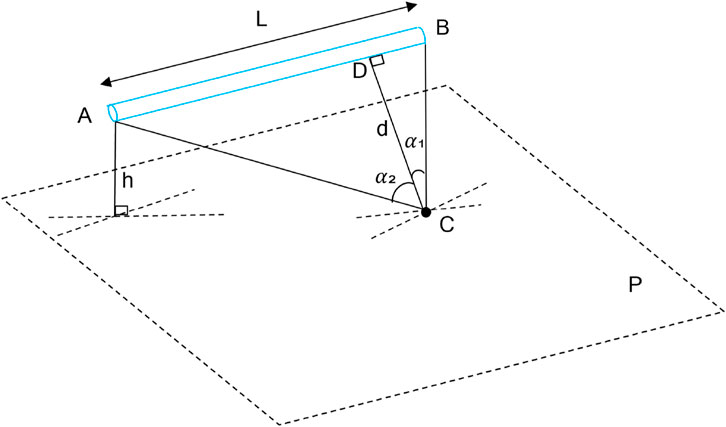
FIGURE 5. A simple schematic illustrating the use of Eq. 5. Line AB refers to an idealized linear UV bulb with a length of L. Point C is on plane P being irradiated by the UV bulb. To solve for the UV irradiance at point C, draw section CD perpendicular to AB first. Angle α₁ is between section CB and CD, while angle α₂ is between section CD and CA. Section h refers to the perpendicular (shortest) distance between AB and plane P. The figure was modified and adopted from Keitz (1971) (Fig. 73; p. 137).
Where Il is luminous intensity per unit length (cd/m) (Keitz, 1971) (p. 138) or the radiant intensity per unit length (W/m), h is the vertical distance between the light bulb to the plane of irradiation (which is the intercept on the y-axis); d is the vertical distance between the point of interest to the light bulb. α1 is the angle between h and the line connecting one end of the light bulb to the point of interest, and α2 is the angle between h and the other line connecting one end of the light bulb to the point of interest. Note that α1 and α2 should have opposite signs by convention. In Figure 5, we assumed that α2 is positive, for the convenience of calculation; therefore, α1 must be negative.
In the 1-bulb scenario, the distance d was between each of the points of investigation to the light source AB. For 4-bulb and 8-bulb, the distance d for each point of investigation was the geometric mean of the distance from the point to each of the four light fixtures.
In Eq. 5, the parameters such as h, d,
Briefly, the distance between two points such as A (x1, y1, z1) and B (x2, y2, z2) in 3-D can be calculated as Eq. 6,
In 3-D, a perpendicular distance (line segment CD) between a point C and a line segment AB can be calculated using Eq. 7,
Where d is the perpendicular distance (magnitude) between point of investigation C and line AB;
Angles
Luminous or radiant intensity per unit length of the bulb can be calculated as Eq. 9,
Where Il is the luminous intensity per unit length (cd/m) (Keitz, 1971) (p. 138) or the radiant intensity per unit length (W/m); I is the luminous intensity (cd) of radiant intensity (W).
Data analysis
The coordinates of points and distances in the 3-D coordinates were calculated using Microsoft Excel and R statistical language (version 4.2.3) via R Studio (version 2023.03.0 + 386). R Studio was also used for estimating the trendline coefficients, R-square values, standard errors, and root mean squared errors. The data collected on the first plane (0.0254 m from the light fixture plane) was removed from the analysis because the light detector was in extreme proximity to the light source, and the reading could be saturated by light irradiation.
Results
Comparison of measured and modeled irradiance and illuminance data in the near-field
Figure 6 shows the comparison of the measured UV irradiance and the line source estimated UV irradiance by Eq. 5. All three power output scenarios (1-bulb, 4-bulb, and 8-bulb) were included. Comparing among the three plots (6A–6C), higher power output yields higher UV irradiance at the same distance. For each power output scenario, modeled irradiance generally underestimated the measured irradiance.
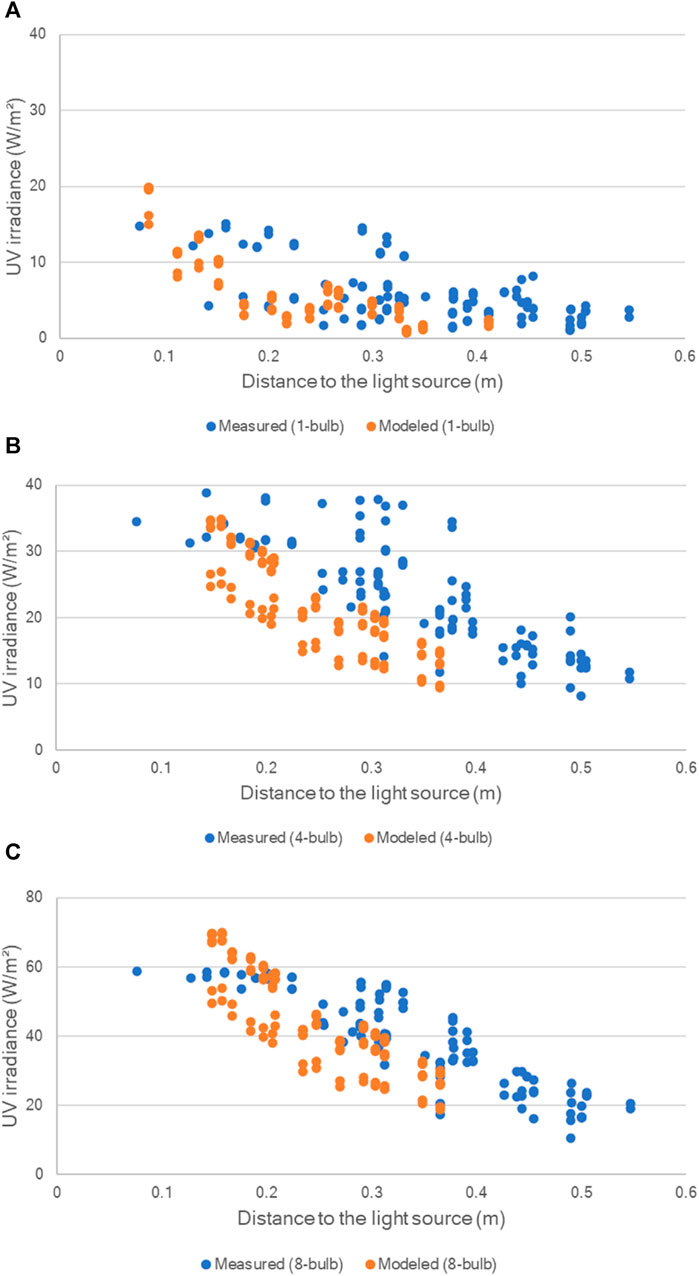
FIGURE 6. Comparison between the measured UV irradiance and the line source estimated UV irradiance with Eq. 5. (A) 1-bulb; (B) 4-bulb; (C) 8-bulb. Measured UV light irradiance (W/m2) from the G30T8 UV-C bulb on each center point of each grid of each measurement plane with all distances away from the light source plane was plotted corresponding to each of the points estimated in the coordinate system in Figure 2. Bulb length, L, = 0.9 m.
Figure 7 shows the comparison between the measured and the line-source estimated visible illuminance. Comparing among the three plots (7A–7C), higher power output yields higher UV irradiance at the same distance. For each power output scenario, modeled illuminance generally underestimated the measured illuminance.
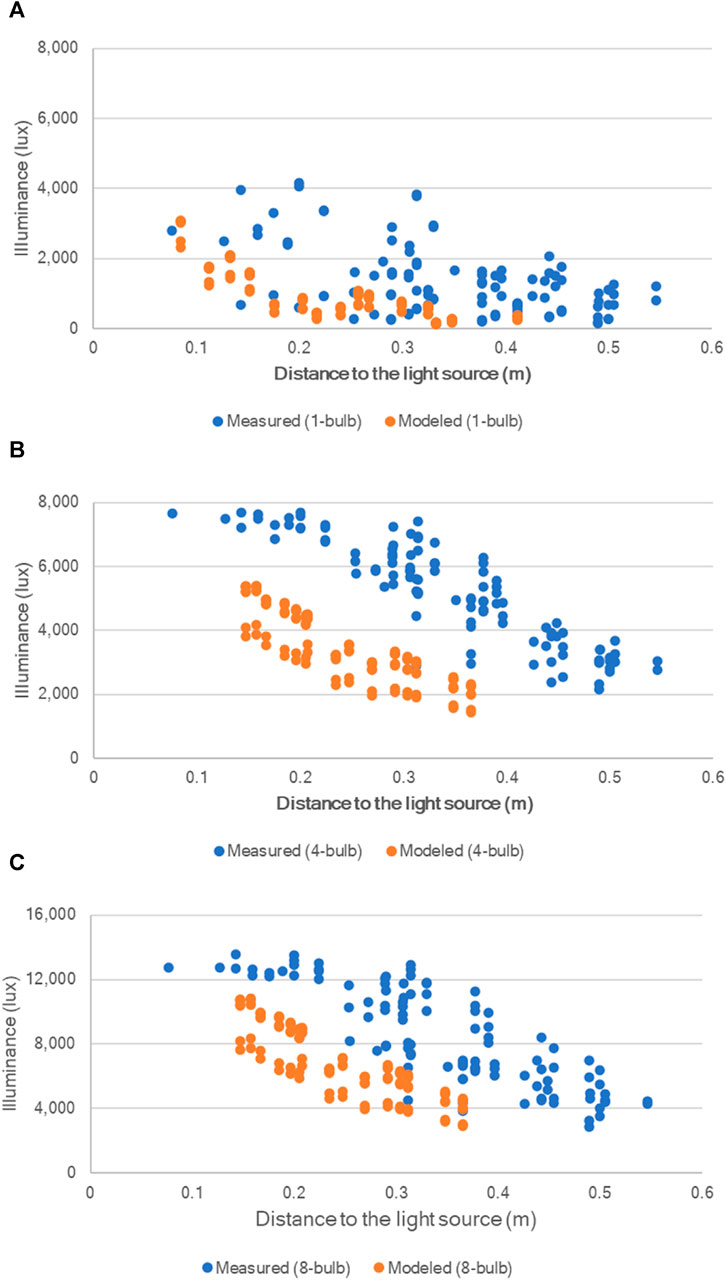
FIGURE 7. Comparison between the measured UV irradiance and the line source estimated UV irradiance by Eq. 5. (A) 1-bulb; (B) 4-bulb; (C) 8-bulb. Measured visible irradiance (W/m2) from the F30T8 fluorescent bulb on each center point of each grid of each measurement plane with all distances away from the light source plane was plotted to correspond to each of the points estimated in the coordinate system in Figure 2.
Inverse and inverse square correlation models for irradiance and illuminance in the near-field
Additional modeling was completed to determine how the measured data (Tables 1, 2) fit the 1/d and the classic 1/d2 models. The relationship between the irradiance and illuminance and the distance from the light source falls into two categories: the inverse correlation (not well described in the literature) and the inverse squared correlation (commonly known as the inverse square law). The measured and estimated light irradiance/illuminance were compared and analyzed. The data were formatted and organized to fit into the inverse correlation (∼1/d) and the inverse squared correlation (∼1/d2). The coefficients of the equation, R-squared values, standard error, and root mean squared errors (RMSE) for the ∼1/d correlation were summarized in Table 1. Similarly, Table 2 summarizes the statistical output based on the ∼1/d2 correlation.
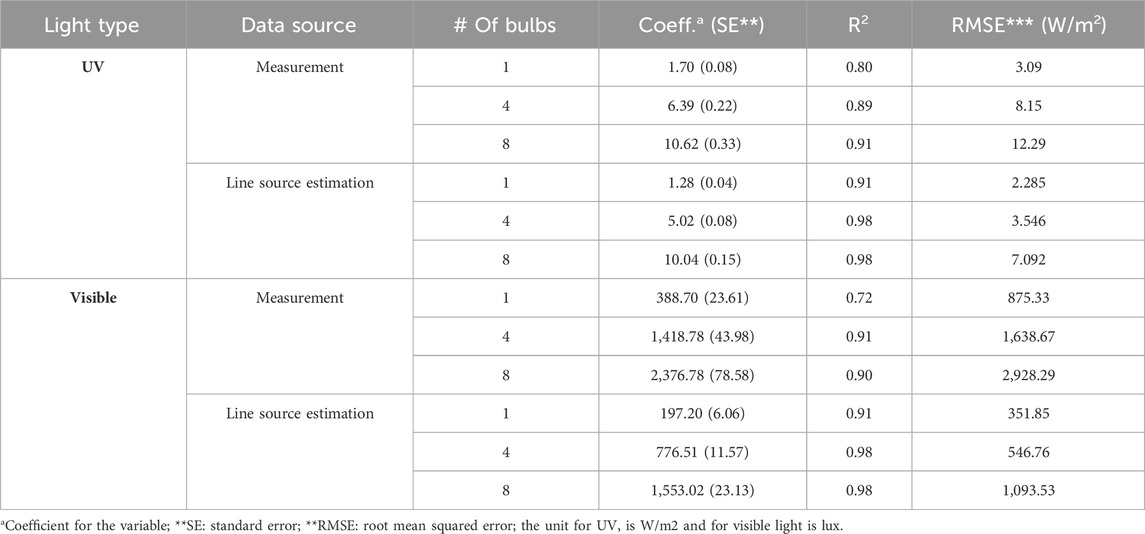
TABLE 1. Summary of the line of fit on the inverse relationship (E ∼1/d) between UV light irradiance and distance, with statistical parameters for all three power output scenarios for all distances. All trendlines are in the format of E = a/d, where E is the irradiance or illuminance,
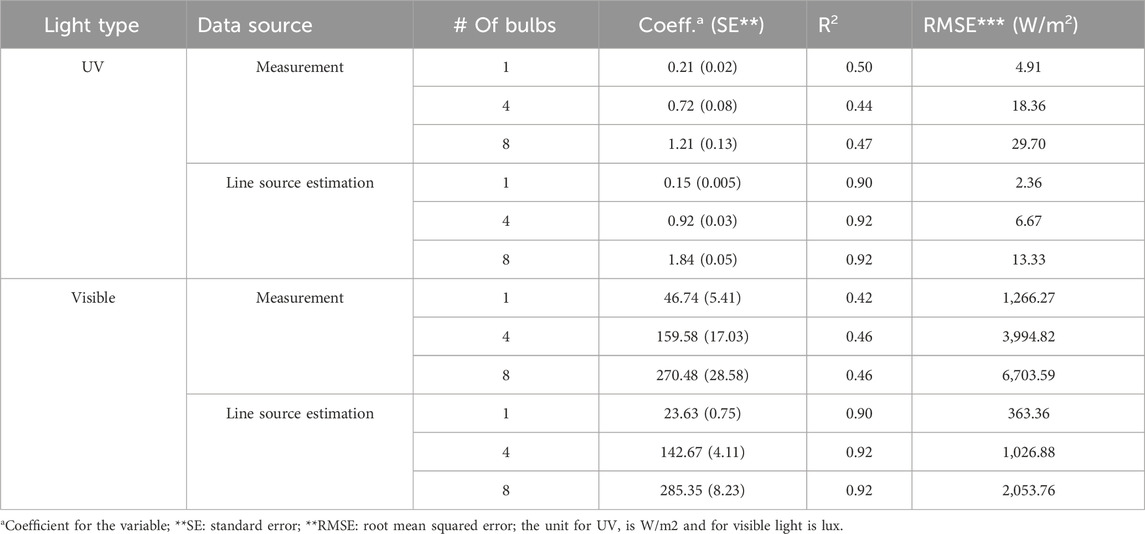
TABLE 2. Summary of the line of fit on the inverse square relationship (E ∼ 1/d2) between UV light intensity and distance, with statistical parameters for all three power intensity scenarios for all distances. All trendlines are in the format of E = a/d2, where E is the irradiance or illuminance,
The measured data fits much better with the inverse relationship (∼1/d) with higher R2 values than the inverse square relationship (∼1/d2). The data for visible light illuminance follows a similar pattern. Under the inverse relationship, the line source model underestimated the light intensity due to their smaller coefficient values compared to those of the measured data. The power output does not have a conspicuous impact on the R2.
Correlations regarding line source modeled to measured data
Correlation coefficients (between −1 and 1) were calculated for the measured versus line source modeled data and measured versus point source modeled data. The results indicate that the 1-bulb scenario had the best correlation for both UV and visible light (0.88–0.95), and 4-bulb scenario had the weakest (0.76–0.79) correlation (Table 3).
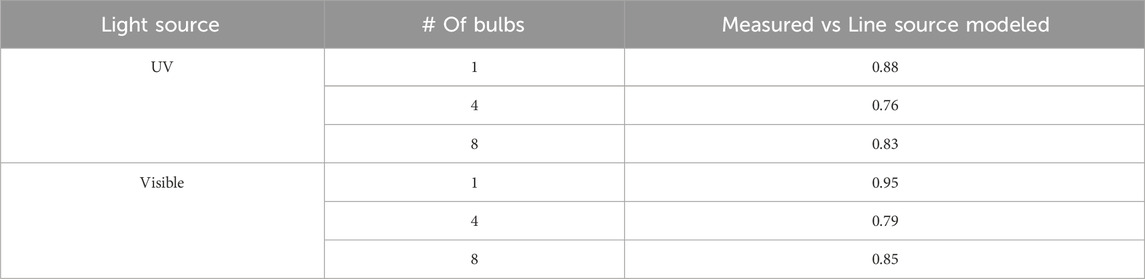
TABLE 3. Correlation coefficients (between −1 and 1) for between measured and line source modeled data.
Discussion
The bias and uncertainty in light measurements
The significant differences observed between measured and estimated UV irradiance and visible illuminance values could be due to several reasons. As mentioned in Lawal et al. (2017) and ISO Technical Committee ISO/TC 142, (2020), it is suggested that the distance between the light detector and the UV bulb is at least twice the length of the UV bulb so that the detector can fully “see” the entire arc length, due to the size of the view angle or opening of the light detector. This is a common limitation of light radiometers. Therefore, the measurement may not reflect the actual UV irradiance or visible illuminance of a particular location on the measurement plane.
Second, there are potential impactful uncertainties during the measurement. The experiment used a commercial-grade radiometer without a goniometer and a sophisticated light setting. As mentioned in Section. 2.2, the UV detector (center wavelength at 254 nm with a range of 254–257 nm) has a total of ±8.9% uncertainty when combining the uncertainty from the NIST to the manufacturer and the transfer uncertainty from the manufacturer to customers. For the visible light detector with a range of 400–700 nm, the total combined uncertainty was ±4.8%, considering manufacturer transfer uncertainty to customers and the uncertainty from NIST.
Third, the setup of UV and visible light bulbs does not perfectly match the model. For example, a UV tubular bulb may omnidirectionally irradiate UV rays in a 3-D coordinate. However, due to the installation of light fixtures right behind the UV bulbs in this experiment, that could not be achieved in the experiment apparatus in this experiment.
Light irradiance/illuminance estimation: Assumptions and simplifications
Light measurements account for all the impactful physical phenomena and environmental conditions. Reflection, refraction, emissions, absorption, etc., were not controlled and may have impacted the measured data. However, none of the source and line source models adopted in the literature were derived mathematically, with assumptions that mainly exist in idealistic environments. Typical point source or line source models cannot express the impact of environmental or physical phenomena such as emission, absorption, or light scattering (Capetillo et al., 2015).
These factors were not considered in the estimation models in this paper. Regarding light refraction, Bolton (2000) used a point source approximation method to study the significance of refraction and reflection in UV distribution through an air-quartz-water interface of a 10-mm long path. The study revealed that only a 6.5% increase in the overall fluence rate due to reflection and refraction and suggested they can be neglected under this circumstance. Since the refraction in the air-quartz-water interface was insignificant, it is assumed that in this study, the air-quartz only pathway would not be highly impacted by light refraction.
Keitz (1971) estimated that when the light detector is more than two lengths of the light bulb away (d > 2L), the inverse square law would yield acceptable results within 4% of the linear assumption calculation method. However, the current results expressed in this paper were not able to corroborate that. Many factors, including the ones mentioned above, could affect the percentage difference between the two estimation methods and would require additional research beyond the scope of a practical approach.
Also, other environmental factors that may affect its applicability in HVAC systems, including humidity, air temperature, and air speed (wind chill effect) (ASHRAE, 2020), were not studied in this paper. The light bulbs tested in this paper are new (within 10% of the life span), and therefore, lamp output loss due to aging was not considered in the modeling calculations.
Application scope
Typical bacteria and virus use DNA or RNA as genetic material. While for DNA and RNA, the peak UV absorption wavelength is 260–265 nm. Protein has a peak UV absorption wavelength of around 280 nm (Harm, 1980; Kowalski, 2009). The UV-C light bulb used in this study was a common tubular low-pressure monochromatic mercury-filled quartz bulb with a central wavelength of 253.7 nm (close to 254 nm), which is close to the peak UV absorption wavelength of DNA and RNA. The photometric nature of other types of UV lamps can be different from what was investigated in this paper. The results expressed in this study may not be applicable to light bulbs of other shapes (such as curved shape bulbs) or light of other types, such as light-emitting diode (LED) or bulbs filled with other gases (such as krypton-chloride excimer lamps), or UV light with different pressure levels (medium- or high-pressure UV lamps tend to be polychromatic with a wider spectrum of UV). Additional research could be conducted on other types of lamps regarding their light intensity.
The performance of some light bulbs is subject to environmental parameters, such as temperature, relative humidity, air velocity. For example, LED and fluorescent bulbs are usually sensitive to airflow as their output may vary, while some types of luminaires, such as incandescent bulbs, are usually not affected (ANSI/IES, 2022b).
Irazoqui et al. (1976) adopted point source, line source, and 3-D source approximation methods in estimating UV irradiance in spatial applications, with a focus on rigorous theoretical equation derivation. However, no physical light measurements were conducted to compare them with the real scenarios. Analytical models such as point source or line source models may not account for all the physical or environmental phenomena such as light reflection, refraction, absorption, emission, or the impact of media of transmission.
In addition to UV irradiation model, some researchers incorporated it with computational fluid dynamics (CFD) models to estimate the overall UV dose (fluence), which is the integration of UV irradiance over time. Capetillo et al. (2015) computed the UV doses with the addition of CFD models to determine the inactivation performance of microorganisms and compared them with published tests by the U.S. Environmental Protection Agency (EPA).
The inverse square law was first documented by German astronomer Johannes Kepler in 1,604, who suggested that the light from a point source had an inverse relationship with the distance from the light source (Gal and Chen-Morris, 2005). Later, French astronomer Ismaël Bullialdus refuted Kepler’s argument by suggesting light intensity decreased as the inverse square of the distance to the light source (Boulliau, 1645). Based on Keitz (1971) and the findings in this paper, both can be correct to some extent, as long as an appropriate application range is defined.
Practical Recommendations for UV Irradiance Estimation.
There were noticeable differences between physically measured light irradiance or illuminance versus the theoretically estimated results. Both models used in this paper generally underestimated the irradiance or illuminance compared with the measured data at the same locations. This underestimation, however, can serve as a safety factor to compensate for the risk of an unexpected light bulb failure so as to meet biosecurity requirements.
UV-C lamp aging effect and preliminary sensitivity analysis
Per ASHRAE (2020), UV lamp output decays as the operational hours increase, and at the end of their lifespan, only 50%–85% of output is available compared to new bulbs measured after 100-h burn-in hours. To simplify the estimation, a linear correlation was assumed, and the lamp output was assumed to be 50% of its original output after 8,000 h of operation. Therefore, to incorporate time as a factor in the UV power output of the bulb, Φ, can be written as Eq 10,
Where
The value of light output is usually obtained from the light manufacturer such as UV power output expressed in watts (W) and visible light output expressed in lumens (lm). However, precautions need to be taken as sometimes these values do not necessarily reflect the true light output. Therefore, measurement and verification are needed prior to actual implementation. Eq. 3 mentioned above is commonly used to measure light output.
Sensitivity analysis may be useful in determining the response of a model with respect to the changes of the input. However, in this experiment, in both line and point source estimation models, the irradiance or illuminance is proportional to the initial power output (in the case of UV) or luminance (in the case of visible light), therefore any percentage change of the light output will directly reflect on the irradiance or illuminance to the extent of same percentage.
Estimation of UV dose in realistic air treatment scenarios
For air duct applications, it is practically important to estimate the UV fluence (dose) generated based on realistic airflow rate conditions. For this air cleaner prototype, its originally designed airflow rate was estimated to be 0.5 m3/s (∼1,060 CFM) under low flow rate mode and 1.0 m3/s (∼2,120 CFM) under high flow rate mode. Table 4 summarizes the estimated UV fluence (dose) based on the designed air flow rates of reasonable ranges (Li et al., 2022). The UV dose ranges align with the doses needed for the inactivation of pathogens. The American Society of Heating, Refrigerating and Air-Conditioning Engineers (ASHRAE) recommended that to inactivate airborne SARS-CoV-2, a minimum UV-C dose of 0.61 mJ/cm2 is needed for 90% reduction, and a dose of 1.50 mJ/cm2 is needed for 99% reduction (ASHRAE, 2021). In Table 4 below, the high flow rate mode yields an estimated UV dose of 1.40 mJ/cm2, which is sufficient for 90% reduction but short for 99% reduction, while the low flow rate model has an estimated UV dose of 2.90 mJ/cm2, far exceeding the need for 99% reduction in airborne SARS-CoV-2.
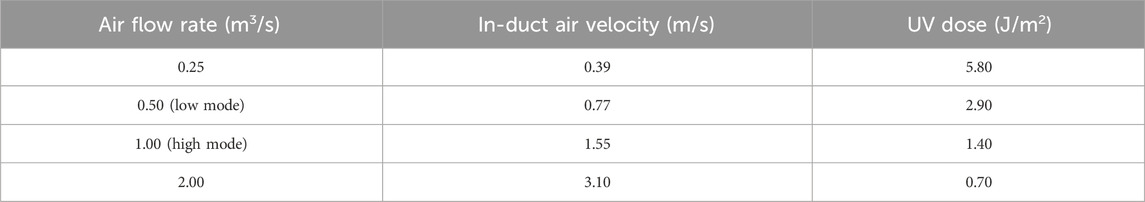
TABLE 4. Estimated UV dose based on realistic air flow rates.
Conclusion
Physical measurements on UV-C irradiance and visible illuminance were conducted near distances to address the growing need to properly quantify light intensity. The line-source analytical model was generated to compare with actual measurements. Although the differences between measurements and theory were observed, the pattern of light distribution generally follows an inverse relationship (∼1/d) with distances (d) shorter than two tubular bulb lengths (d < 2L). The data for visible light illuminance follows a similar pattern. These findings are important as the application of UV-C for air disinfection gains more popularity and practical estimation of UV irradiance is essential in determining the UV fluence (dose) and designing long, tubular UV lamp configurations in indoor air. The ∼1/d correlation is recommended for in-duct and portable UV air treatment systems.
Data availability statement
The original contributions presented in the study are included in the article/Supplementary Material, further inquiries can be directed to the corresponding author.
Author contributions
PL: Conceptualization, Data curation, Formal Analysis, Investigation, Methodology, Project administration, Resources, Software, Validation, Visualization, Writing–original draft, Writing–review and editing. JK: Conceptualization, Funding acquisition, Methodology, Project administration, Resources, Supervision, Validation, Writing–review and editing. BY: Data curation, Investigation, Writing–review and editing. RP: Formal Analysis, Software, Validation, Visualization, Writing–review and editing. WW: Data curation, Investigation, Writing–review and editing. BR: Resources, Supervision, Writing–review and editing.
Funding
The author(s) declare that financial support was received for the research, authorship, and/or publication of this article. Some material and equipment used in this research was from project (#A-2021-236) funded by Kryton Engineered Metals, Inc. (Cedar Falls, Iowa) and the Center for Industrial Research and Service (CIRAS) of Iowa State University.
Conflict of interest
The authors declare that the research was conducted in the absence of any commercial or financial relationships that could be construed as a potential conflict of interest.
Publisher’s note
All claims expressed in this article are solely those of the authors and do not necessarily represent those of their affiliated organizations, or those of the publisher, the editors and the reviewers. Any product that may be evaluated in this article, or claim that may be made by its manufacturer, is not guaranteed or endorsed by the publisher.
Supplementary material
The Supplementary Material for this article can be found online at: https://www.frontiersin.org/articles/10.3389/fbuil.2024.1325267/full#supplementary-material
References
Allen, J. G., and Ibrahim, A. M. (2021). Indoor air changes and potential implications for SARS-COV-2 transmission. JAMA 325, 2112. doi:10.1001/jama.2021.5053
ANSI/IES (2022a). Lighting science: nomenclature and definitions for illuminating engineering. LS-1-22. New York, NY: ANSI.
Ashdown, I., Fletcher, K., and Radkov, E. (2022). The use of near-field data for accurate modeling of horticultural and germicidal applications. Available at: https://www.ies.org/research/fires/the-use-of-near-field-data-for-accurate-modeling-of-horticultural-and-germicidal-applications/(Accessed March 24, 2023).
ASHRAE (2020). “Chapter 17 ultraviolet lamp systems,” in 2020 ASHRAE handbook: HVAC systems and equipment (Peachtree Corners, GA, United States: ASHRAE).
ASHRAE (2021). Filtration and disinfection. Available at: https://www.ashrae.org/file%20library/technical%20resources/covid-19/ashrae-filtration_disinfection-c19-guidance.pdf (Accessed October 16, 2023).
Bergman, R. S. (2021). Germicidal UV sources and systems. Photochem Photobiol. 97, 466–470. doi:10.1111/php.13387
Bolton, J. (2000). Calculation of ultraviolet fluence rate distributions in an annular reactor: significance of refraction and reflection. Water Res. 34, 3315–3324. doi:10.1016/s0043-1354(00)00087-7
Boulliau, I. (1645). Ismaelis bvllialdi astronomia philolaica: opvs novvm. http://diglib.hab.de/drucke/2-1-4-astron-2f-1/start.htm (accessed on October 20, 2023).
Browne, K. (2021). Brought to light: how ultraviolet disinfection can prevent the nosocomial transmission of COVID-19 and other infectious diseases. Appl. Microbiol. 1, 537–556. doi:10.3390/applmicrobiol1030035
Capetillo, A., Noakes, C. J., and Sleigh, P. A. (2015). Computational fluid dynamics analysis to assess performance variability of in-duct UV-C systems. Sci. Technol. Built Environ. 21, 45–53. doi:10.1080/10789669.2014.968512
Gal, O., and Chen-Morris, R. (2005). The Archaeology of the Inverse Square Law: (1) metaphysical images and mathematical practices. Hist. Sci. 43, 391–414. doi:10.1177/007327530504300402
Harm, W. (1980). Biological effects of ultraviolet radiation. Cambridge: Cambridge University Press.
Irazoqui, H. A., Cerdá, J., and Cassano, A. E. (1976). The radiation field for the point and line source approximations and the three-dimensional source models: applications to photoreactions. Chem. Eng. J. 11, 27–37. doi:10.1016/0300-9467(76)80004-4
ISO Technical Committee ISO/TC 142 (2020). UV-C devices—measurement of the output of a UV-C lamp. ISO 15727:2020E. Geneva, Switzerland: ISO.
Kahn, K., and Mariita, R. M. (2021). Quantifying the impact of ultraviolet subtype C in reducing airborne pathogen transmission and improving energy efficiency in healthy buildings: a kahn–mariita equivalent ventilation model. Front. Built Environ. 7, 725624. doi:10.3389/fbuil.2021.725624
Keitz, H. A. E. (1971). Light calculations and measurements. Palgrave, London: Philips Technical Library. doi:10.1007/978-3-642-01999-9_3
Kowalski, W. J., Bahnfleth, W. P., Witham, D. L., Severin, B. F., and Whittam, T. S. (2000). Mathematical modeling of ultraviolet germicidal irradiation for air disinfection. Quant. Microbiol. 2, 249–270. doi:10.1023/a:1013951313398
Lawal, O., Dussert, B., Howarth, C., Platzer, K., Sasges, M., and Muller, J. (2017). Method for the measurement of the output of monochromatic (254 nm) low-pressure UV lamps. IUVA News 19 (1), 9–16.
Li, P., Koziel, J., Paris, R., Macedo, N., Zimmerman, J., Wrzesinski, D., et al. (2023). Indoor air quality improvement with filtration and UV-C on mitigation of particulate matter and airborne bacteria: monitoring and modeling. Available at: https://papers.ssrn.com/sol3/papers.cfm?abstract_id=4388244 (Accessed October 17, 2023).
Li, P., Koziel, J. A., Macedo, N., Zimmerman, J. J., Wrzesinski, D., Sobotka, E., et al. (2022). Evaluation of an air cleaning device equipped with filtration and UV: comparison of removal efficiency on particulate matter and viable airborne bacteria in the inlet and treated air. Int. J. Environ. Res. Public Health 19, 16135. doi:10.3390/ijerph192316135
Nunayon, S. S., Mui, K.-W., and Wong, L.-T. (2023). Mapping the knowledge pattern of ultraviolet germicidal irradiation for cleaner indoor air through the lens of Bibliometrics. J. Clean. Prod. 391, 135974. doi:10.1016/j.jclepro.2023.135974
Ruston, C., Zhang, J., Scott, J., Zhang, M., Graham, K., Linhares, D., et al. (2021). Efficacy of ultraviolet C exposure for inactivating senecavirus a on experimentally contaminated surfaces commonly found on swine farms. Veterinary Microbiol. 256, 109040. doi:10.1016/j.vetmic.2021.109040
Sasges, M. R., Van der Pol, A., Voronov, A., and Robison, J. A. (2007). Proc. International congress on ozone and ultraviolet Technologies. Los Angeles, California: International Ultraviolet Association.
Keywords: air quality, airborne disinfection, light modeling, ultraviolet light, UV254, bactericidal UV-C, UVGI, line source
Citation: Li P, Koziel JA, Yedilbayev B, Paris RV, Walz WB and Ramirez BC (2024) Is line-source modeling suitable for ultraviolet light application in an air cleaner duct?. Front. Built Environ. 10:1325267. doi: 10.3389/fbuil.2024.1325267
Received: 20 October 2023; Accepted: 19 February 2024;
Published: 01 March 2024.
Edited by:
Hasim Altan, Prince Mohammad bin Fahd University, Saudi ArabiaReviewed by:
Richard M. Mariita, Crystal IS Inc., an Asahi Kasei company, United StatesRoberto Alonso González-Lezcano, CEU San Pablo University, Spain
Copyright © 2024 Li, Koziel, Yedilbayev, Paris, Walz and Ramirez. This is an open-access article distributed under the terms of the Creative Commons Attribution License (CC BY). The use, distribution or reproduction in other forums is permitted, provided the original author(s) and the copyright owner(s) are credited and that the original publication in this journal is cited, in accordance with accepted academic practice. No use, distribution or reproduction is permitted which does not comply with these terms.
*Correspondence: Jacek A. Koziel, amFjZWsua296aWVsQHVzZGEuZ292