 Yihan Du1
 Wei Han
 Bo Huang
- 1School of Architecture and Civil Engineering, Anhui Polytechnic University, Wuhu, China
- 2College of Environment and Civil Engineering, Chengdu University of Technology, Chengdu, China
Prefabricated retaining wall is in line with the development trend of greening and environmental protection of civil engineering, and has a broad application prospect. However, the seismic response of prefabricated retaining wall has not been systematically revealed. Therefore, in this study, a simple fabricated cantilever retaining wall with connecting plate was proposed, and the mechanical properties of prefabricated cantilever retaining under dynamic effect was investigated by the experimental and numerical methods. At first, the physical model experiments of prefabricated cantilever retaining with different vertical plate thicknesses were carried out. Subsequently, the mechanical properties of the prefabricated cantilever retaining were investigated. The research results show that the thickness of retaining wall significantly affects the failure pattern, the larger the thickness, the more complete the broken pattern. In addition, the connection between the vertical plate and the bottom plate is prone to cracks induced by stress concentration, eventually leading to damage. As the thickness of the vertical plate increases, the top stress of the vertical plate decreases but the bottom stress increases. The greater the embedded depth of the vertical plate, the larger the stress at bottom of the vertical plate. Furthermore, the effect of concrete strength on mechanical properties is not obvious. This study provides an idea for the dynamic response research of prefabricated retaining structure.
1 Introduction
A large number of earthquake damage indicated that the retaining structure is relatively fragile in earthquake. The destruction of retaining structures often brings huge losses to human life and property (Jamsawang et al., 2021; Ren et al., 2022). Subgrade damage, large-scale collapse, landslide and other mountain disasters in the hardest hit areas of the earthquake blocked traffic, hindered and delayed rescue operations, and became a huge obstacle to emergency highway access (Li et al., 2010; Luo, 2011). Therefore, the dynamic response of retaining wall is an urgent problem to be solved in the study of seismic performance of retaining wall.
Currently, various forms of retaining wall structures have been developed and applied, primarily through in situ fabrication. The main methods for studying seismic damage include numerical simulation and model testing. Scotto di Santolo and Evangelista, (2011) introduced a novel approach for assessing the active Earth pressure coefficients on cantilever retaining walls under seismic loads, which can be achieved by a pseudo-static stress-plastic solution. Salem et al. (2020) modelled the actual seismic events of cantilever retaining walls in order to meet the requirements of accurate assessment of seismic loads on cantilever retaining wall structures. Bo et al. (2001) employed the finite element method to study stress and displacement fields of slopes under earthquake action, the time-history changes of slope stability coefficients, and a method to determine the minimum stability coefficient of soil slopes. Upadhyay et al. (2011) utilized a finite element method to investigate the dynamic behavior of cantilever retaining walls. Considering on physical model test, Coyle and Bartoskewitz, (1976) conducted a study to measure the lateral Earth pressures acting on precast panel retaining walls. Additionally, the study involved determining the physical and engineering properties of the backfill material. Watanbe et al. (2003) analyzed seismic stability and failure modes of different types of retaining walls through seismic simulation shaking table tests. Kloukinas et al. (2014) investigated the seismic response of cantilever retaining walls through a comprehensive approach encompassing theoretical analysis and shaker tests. Wen and Yang. (2011) studied the displacement modes and variation characteristics of various types of retaining walls under Wenchuan wave earthquake by using large-scale shaking table model tests. Ren et al. (2020) conducted an investigation into the seismic performance of reinforced Earth retaining walls, specifically focusing on the combined impact of rainfall and earthquake through model-scale shaking table tests. Madabhushi and Zeng. (2007) conducted a study to explore the finite element simulation of flexible cantilever retaining walls subjected to seismic loading, with consideration for both dry and saturated backfill conditions. Yenginar and Ozkan, (2023) developed a cantilever wall design tailored to the specific conditions of the site. Veletsos and Younan, (1997) conducted a comprehensive evaluation of the response of flexible cantilever retaining walls to horizontal ground vibrations.
It can be seen that the research of fabricated retaining wall mainly focuses on assembly form, design and construction, etc., but there is little research on its dynamic response. The mechanical properties and dynamic response of fabricated retaining wall are affected by the interaction of assembled components under earthquake load, which is more complex than that of traditional retaining wall (Gupta and Sawant, 2019). In addition, the dynamic response of Earth pressure behind the wall also has great influence on retaining wall. At present, there are few structural dynamic test reports, seismic design standards and codes for fabricated retaining walls. Whether the traditional calculation theory is suitable for fabricated retaining walls under earthquake action needs further study. The fabricated retaining wall may have highly nonlinear characteristics in some extreme cases, and the traditional theoretical calculation cannot accurately evaluate its seismic performance (Lian and Su, 2017). The dynamic response of assembly structure under various earthquakes can be accurately reflected by using simulated earthquake test and numerical simulation calculation, which makes it possible to study its seismic performance (Bakr and Ahmad, 2018; Tao et al., 2019; Wu et al., 2020; Zhang et al., 2020).
Therefore, a simple fabricated cantilever retaining wall with connecting plate is proposed in this paper, and the seismic performance of fabricated cantilever retaining wall is studied (Shan et al., 2022; Li et al., 2023) based on a landslide in Fanchang county, Anhui province (Du et al., 2022). The mechanical properties of the components of the fabricated cantilever retaining wall under dynamic load are studied, and the influence of the Earth pressure behind the wall is considered. In addition, parametric analysis is carried out to study the influence of concrete strength and structural parameters on the mechanical properties of precast cantilever retaining wall.
2 Physical model test
2.1 Model preparation
To study the seismic performance, a physical model of the retaining wall for this planar sliding landslide was built. The top and bottom vibration cylinders can drive the overall vertical vibration of the model. The test device also includes an electro-hydraulic servo loading device, a monitoring device and corresponding control software (Shan et al., 2022; Zheng et al., 2021), as shown in Figure 1. The cylinders are equipped with force sensors. Considering the convenience of testing and the limitations in the size of the test instrument, the ratio of similarity between this model and the actual scenario was obtained based on similarity theory. This test mainly involved five similarity ratios; namely, geometric similarity ratio CL, gravity similarity ratio Cγ, acceleration similarity ratio Ca, stress similarity ratio Cσ, and force similarity ratio CF. Considering the equipment size and the convenience of research, the geometric similarity ratio was set as 10. The unit weight similarity ratio was preliminarily determined as 0.955. The acceleration similarity ratio was taken as 1 due to the same self-weight stress field.
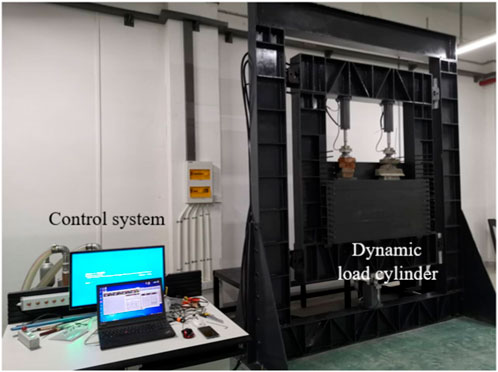
FIGURE 1. Model test device.
This test mainly involves simulating the soil layer, bedrock and fabricated retaining wall, in which the fabricated retaining wall includes a grid steel frame and shotcrete as shown in Figure 2. Prepare suitably similar materials according to the above similarity ratio. Through the proportioning test, the compressive strength of bedrock model material is 2.33 MPa, and the compressive strength of retaining wall model material is 2.98 MPa. Three prefabricated retaining walls were made for test, and the thickness of vertical plate was 150 mm, 200 mm and 300 mm, respectively. In order to minimize the influence of rigid boundary in the vibration direction on the dynamic response of the structure, 5 mm thick polystyrene foam plates were placed on the side wall and bottom of the model box to reduce the reflection of vibration waves. The amplitude is selected as 1 mm, the vibration frequency is set as 2 Hz, 4 Hz, 6 Hz, 8 Hz, 10 Hz, and the vibration times are 100 times each. The size of geometric model can be shown in Figure 2. The model before loading can be presented in Figure 3.
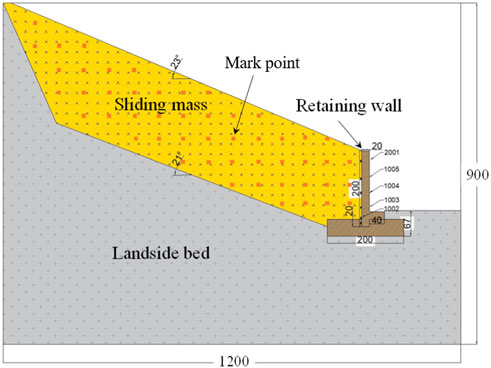
FIGURE 2. Size of geometric model (unit: mm).
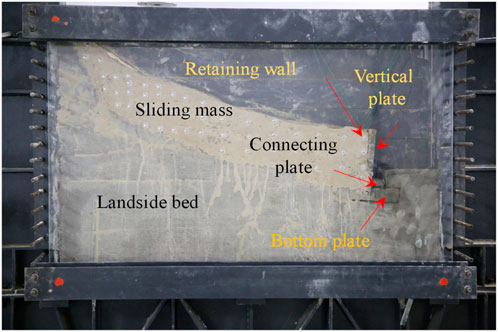
FIGURE 3. Prefabricated retaining wall in model test.
2.2 Results of model test
To investigate the dynamic behavior of retaining walls with varying thicknesses under different frequency vibration loads, this paper focuses on the damage evolution process of retaining walls with thicknesses of 150 mm, 200 mm, and 300 mm subjected to vibration frequencies of 2 Hz, 4 Hz, 6 Hz, 8 Hz, and 10 Hz, respectively. The corresponding results are depicted in Figures 4–6.
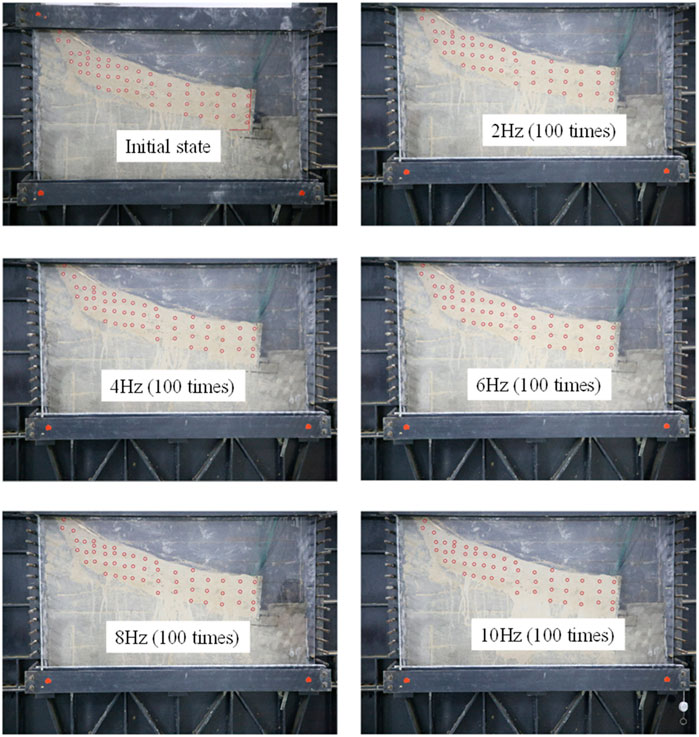
FIGURE 4. Progressive failure process of retaining wall with the thickness of 200 mm.
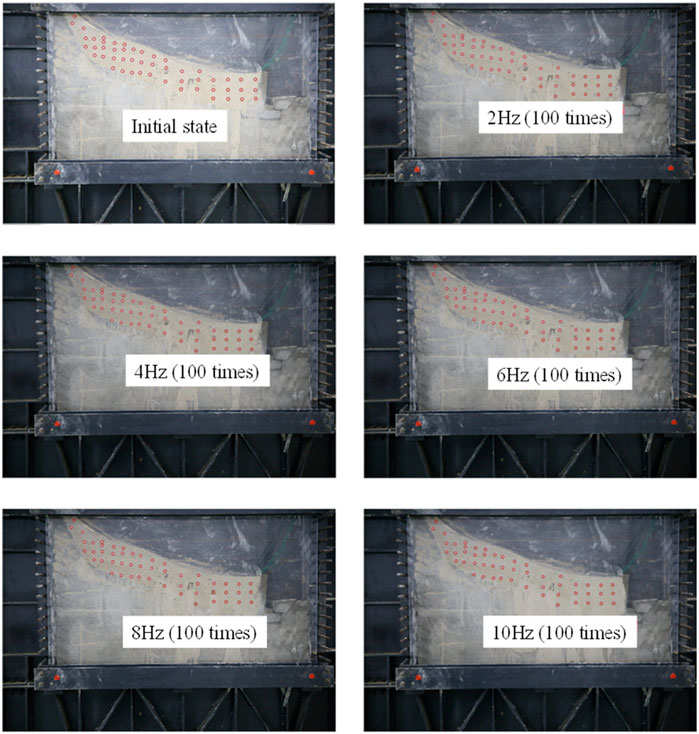
FIGURE 5. Progressive failure process of retaining wall with the thickness of 300 mm.
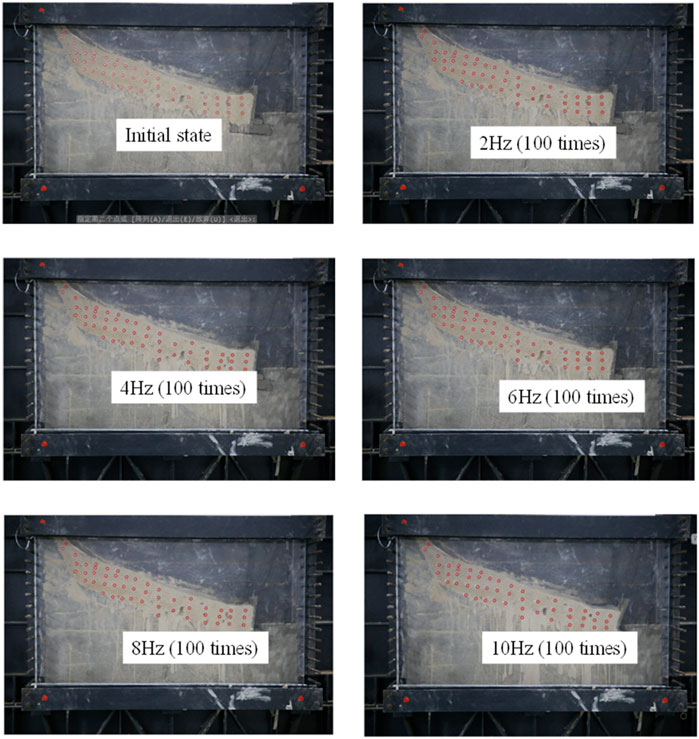
FIGURE 6. Progressive failure process of retaining wall with the thickness of 150 mm.
Figure 4 illustrates the damage evolution of the 200 mm thickness retaining wall across various loading frequencies. It is important to note that the number of vibrations at different frequencies is consistently 100 times. At very small vibration frequencies, the inclination of the vertical plate is minimal, resulting in less force applied to the retaining wall. Consequently, surface cracks are small, primarily concentrated at the bottom of the vertical plate. The impact on the backfill behind the retaining wall is negligible at these low frequencies. As the frequency increases, the backfill soil exerts gradually escalating pressure on the retaining wall, leading to a step-by-step augmentation of retaining force. Consequently, the vertical plate of the retaining wall becomes unstable due to varying forces at different positions, and cracks at the bottom of the vertical plate expand in tandem with the frequency increase. Figure 5 depicts the damage evolution of the retaining wall with a thickness of 300 mm under varying frequency loads. It is crucial to highlight that the damage characteristics of the 300 mm thick retaining wall are considerably milder in comparison to those of the 200 mm thick retaining wall. When the frequency of loading is low, the impact on the retaining wall and its backfill is small. As the frequency of loading increases, the surface shear force exerted on the retaining wall experiences a gradual augmentation, resulting in different shear action on the specimen surface. Concurrently, cracks located at the bottom of the retaining wall expand proportionally with the increase in frequency, contributing to the progressive instability of the retaining wall. Figure 6 illustrates the damage evolution of a retaining wall with a thickness of 150 mm at loading frequencies of 2 Hz, 4 Hz, 6 Hz, 8 Hz, and 10 Hz. It is crucial to highlight that the damage characteristics of the 150 mm thick retaining wall differ significantly from those of the 200 mm and 300 mm thick retaining walls. As the vibration frequency increases, the backfill exerts a progressively escalating soil pressure on the retaining wall’s surface. This results in a gradual tilting of the retaining wall and the incremental expansion of cracks at its base, ultimately pushing the retaining wall into an unstable state.
The failure characteristics of retaining wall with different vertical plate thicknesses after loading can be presented in Figure 7. It can be seen that the thickness of retaining wall significantly affects its failure pattern. Specifically, when the thickness of the retaining wall is 150 mm, a significant breaking phenomenon occurs, and the straight wall is broken very seriously. When the thickness is 200 mm, block failure occurs in the retaining wall. However, when the thickness of the retaining wall is 300 mm, the shape of the retaining wall is relatively complete, and the peeling phenomenon occurs only in the local area.
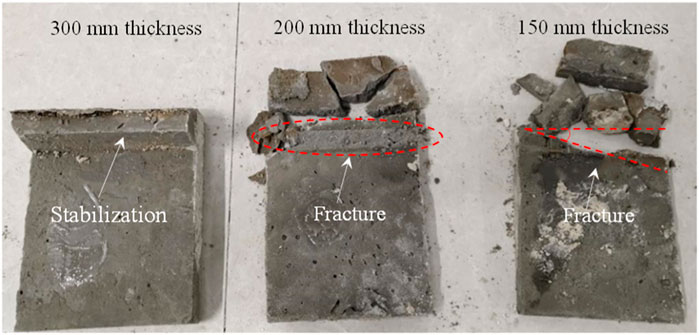
FIGURE 7. Failure characteristics of retaining wall with different thickness.
Figure 8 shows the soil pressure distribution of initial value, peak value and final value on the vertical plate. The distribution mode is with an “S” shape of peak and final value, while an “C” shape of initial value. Generally speaking, the peak stress is greater than the initial and final values. The Earth pressure at 1002 is relatively high, which is consistent with the test. The stress of the 2001 is relatively high, which may be due to nonlinear phenomena of soils and the soil–structure interface during shaking, especially for higher intensities, may also affect the dynamic Earth pressure. These recorded Earth pressures may be biased to some extent by the response of the Earth pressure cells.
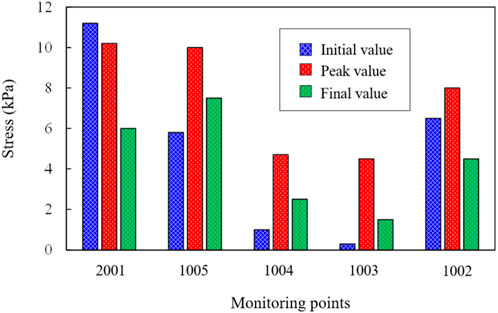
FIGURE 8. Distribution of the soil pressure on vertical plate.
3 Numerical model
3.1 Established numerical model
As the main purpose of the results of the numerical simulation was to study the dynamic response for stress, strain and displacement of the prefabricated retaining wall and not to pursue a high degree of consistency with the physical model. Therefore, the Vrancea wave can be used in the numerical simulation. The numerical model is numbered as RWS-1, which is mainly composed of prefabricated retaining wall, sliding bed and sliding body. The connecting plate of the retaining wall is designed on the front side of vertical plate. The connecting plate is equipped with bolt holes, and the bottom plate is equipped with grooves and bolt holes. The solid segment of the vertical plate is inserted into the groove of the bottom plate, and is connected to the bottom plate through the bolt hole of the connecting plate. The parameters of model are shown in Table 1. The natural slope of the landslide is about 23°, the dip angle of the sliding surface is 20°, and the longitudinal length of the model is 2 m. The retaining wall is made of concrete with strength of C30. Its density is 2.385 t/m3, elastic modulus is 30,000 MPa and Poisson’s ratio is 0.2. The density of bolts is 7.8 t/m3. The elastic modulus of the bolt is 201,000 MPa and the Poisson’s ratio is 0.3. Four-node linear tetrahedral element is adopted on the bolt. Concrete is modeled by plastic damage constitutive model. The plastic damage constitutive model is used to simulate the concrete, and the Drucker-Prager model is used to simulate the sliding body and bedrock, which are set as 8-node hexahedron linear reduction integral units. The density of sliding bed is 24.5 g/cm3, Young’s modulus is 13,770 MPa, and Poisson’s ratio is 0.25. The density of sliding body is 19.8 g/cm3, Young’s modulus is 1001.7 MPa, and Poisson’s ratio is 0.35. The sliding bed and sliding body are set as 8-node hexahedron linear reduction integral units (Ren et al., 2023). Five monitoring points (P110, P746, P841, P142, and P284) of the model RWS-1 vertical plate are selected for analysis. The model and the location diagram of monitoring point are shown in Figure 9.
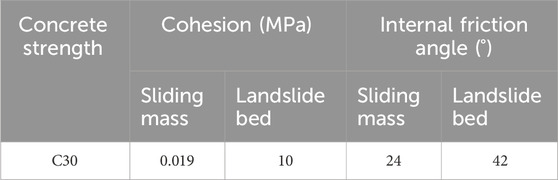
TABLE 1. The parameter lists of numerical model RWS-1.
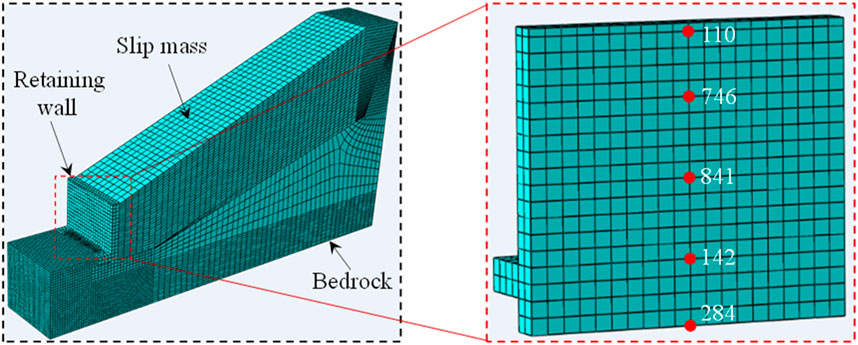
FIGURE 9. Numerical model and location of monitoring points.
3.2 Boundary conditions
The contact surface is set to Explicit, and the slip formula is finite slip. The normal of the contact surface is defined as hard contact. The tangential penalty friction formula is given to allow certain elastic slip, and the friction coefficient is 0.5. The normal of the bolt-concrete contact surface is defined as hard contact, and the friction coefficient is defined as 0.7 under the penalty contact type defined in tangential direction. To reduce the iteration and convergence problems in the calculation process, this paper uses explicit integration algorithm to define the acceleration—time amplitude curve, and input the seismic action in the form of seismic waves into the defined boundary conditions. The bottom and four sides of the slide bed are constrained by unidirectional hinge support. Vrancea seismic wave is selected in this simulation as the representative waveform. In order to save calculation time, it is compressed to 3.5 s, and the acceleration remains unchanged. The acceleration curve is shown in Figure 10. There are two analysis steps in the calculation. In the first analysis step, only gravity is applied from 0 to 0.5 s. In the second analysis step, seismic waves are applied from 0.5 to 4.0 s.
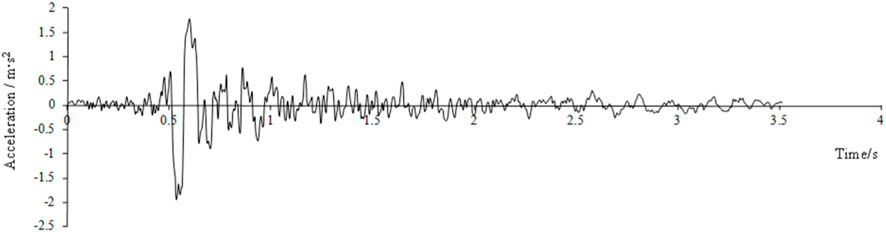
FIGURE 10. Vrancea seismic acceleration curve.
4 Simulation results of numerical model
4.1 Stress distribution
The stress contour plot of each component of model RWS-1 retaining wall at 4.0 s is shown in Figure 11. It can be seen from Figure 11A that the stress at the joint between the vertical plate and the bolt is maximum, about 3.30 MPa. The stress on both sides of the embedded section is relatively large, about 0.55–0.83 MPa. Figure 11B shows that the maximum stress of the retaining wall base is about 4.51 MPa, which is mainly distributed in the bolt hole, the connection between the vertical plate and the bottom plate, and the front side of the bottom plate. In Figure 11C, the maximum stress of the bolt is distributed in the middle of the bolt, about 54.54 MPa, and the stress at both ends of the bolt decreases gradually. Overall, the stress of the vertical plate is less than that of the bottom plate, and the stress of the bolt is much greater than that of the vertical plate and the bottom plate. It shows that under the action of earthquake, the stress concentration of this kind of precast retaining wall appears at the connection nodes. Due to the relatively large stiffness of bolts and baseplate, the connection between vertical plate and baseplate is prone to damage.
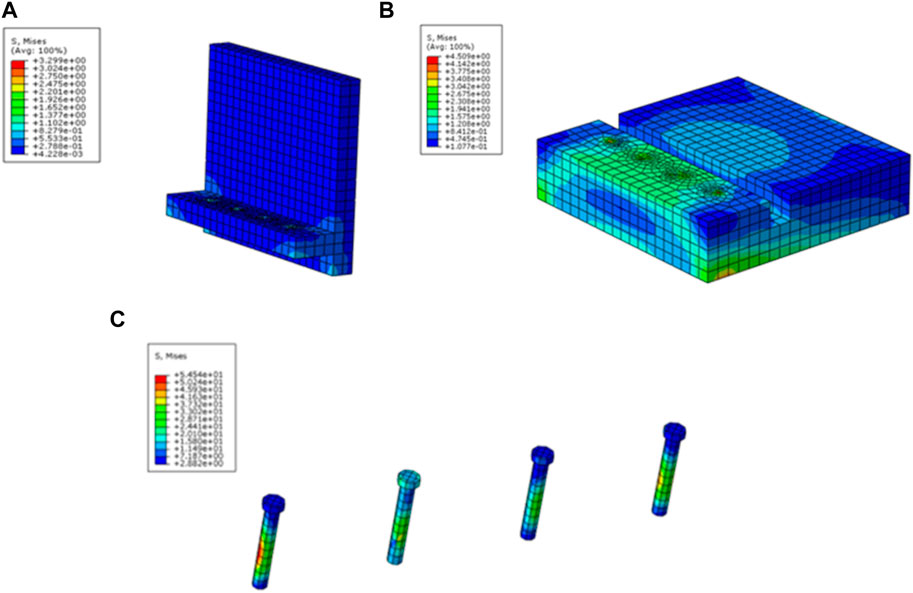
FIGURE 11. Stress contour plot of model RWS-1 retaining wall at 4.0 s for (A) vertical plate, (B) baseplate, (C) bolt.
4.2 Displacement distribution
The displacement contour of each component of the model RWS-1 retaining wall at 4.0 s is shown in Figure 12. As shown in Figure 12A, the vertical plate rotates, and the upper part moves more than the lower part. The maximum displacement of the plate is about 40 mm at the top, and the minimum displacement is about 0.4 mm at the embedded segment. As shown in Figure 12B, the minimum displacement of the baseplate is distributed in the groove, and gradually increase toward the front end and the rear end of the baseplate. As shown in Figure 12C, The displacement of bolts is small, ranging from 0.64 mm to 0.72 mm, and the maximum displacement of the bolt is located at the top part. It indicates that under the action of vibration load, the displacement of fabricated retaining wall is mainly rotation, and slight sliding.
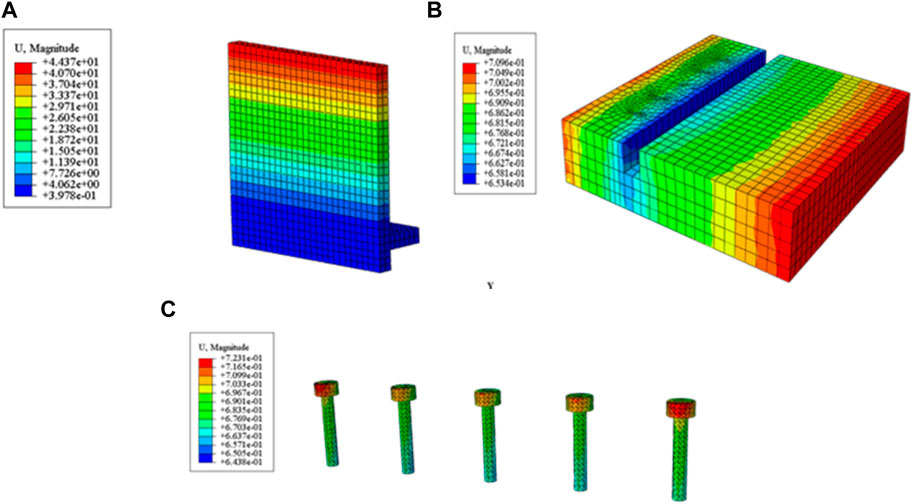
FIGURE 12. Displacement contour of model RWS-1 retaining wall at 4.0 s for (A) vertical plate, (B) baseplate, (C) bolt.
4.3 Stress-strain and stress-displacement curves
The node P142 at the assembly node of the model (Figure 13) is selected for research, and the stress-strain and stress-displacement curves are shown in Figures 13, 14. As shown in Figure 13A, the stress - strain curve of point P142 in 0–4.0 s is complicated due to the randomness of seismic action. The curve is amplified in different periods as shown in Figures 13B–D. Amplify the stress-strain curve of 0.5–1.5 s, as shown in Figure 14B, the curve is mainly in series “V” shape, and the nonlinearity and hysteresis are not obvious. As shown in Figure 14C, the curve of stress-strain is “V” -shaped stacking during 1.5–3.0 s. As shown in Figure 13D, the curve of stress-strain in the period of 3.0–4.0 s is mainly triangular, showing obvious nonlinearity and hysteresis at some moment.
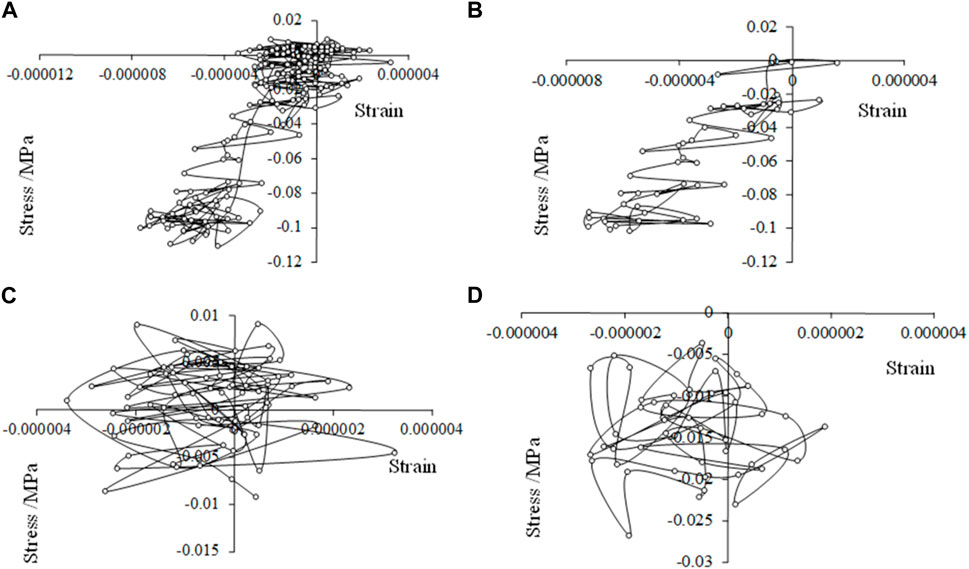
FIGURE 13. Stress-strain of point P142 in model RWS-1 at different times: (A) 0–4.0 s, (B) 0.5–1.5 s, (C) 1.5–3.0 s, and (D) 3.0–4.0 s.
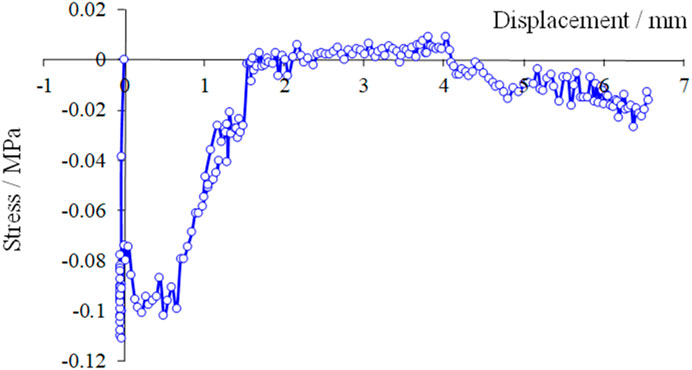
FIGURE 14. Stress-displacement of point P142 in model RWS-1.
As shown in Figure 14, the stress-displacement curve reflects the variation characteristics of point P142 under earthquake action. It can be seen that in the first 0–0.5 s, the displacement of the point is basically 0 under the action of gravity only, and the stress at this point is compressive stress due to earth pressure. From 0.5 s, the displacement gradually increases under the action of earthquake. During 0.5–1.4 s, the compressive stress decreases to 0 gradually, and the displacement is 0–1.5 mm. During 1.4–2.7 s, the stress is mainly tensile stress with small value, and the displacement is 1.5–4.0 mm. During 2.7–4.0 s, the displacement of the point is about 4.0–7.0 mm, and the stress changes into compressive stress. With the increase of seismic action time, the rate of displacement increases gradually.
4.4 Stress time history response
The stress time history curve of all the monitoring points is shown in Figure 15. As can be seen from Figure 15, points P142 and P284 are located at the assembly nodes of retaining wall. From 0 to 0.5 s, the stress of P110, P746 and P841 in the middle and upper part of the vertical slab is small, but increases slightly with the increase of depth, which is consistent with the distribution law of earth pressure. In order to balance the upper earth pressure, the compressive stress of P142 and P284 is larger during 0–0.5 s. From 0.5 s to 4.0 s, the stress changes of P110, P746, and P841 in the middle and upper parts of the vertical slab are relatively small under earthquake action. During 0.5–1.5 s, the compressive stress of P142 at the assembly joint gradually decreases, the tensile stress appears during 1.5–2.8 s, and then converts into compressive stress during 2.8–4.0 s and gradually increases. At point P284, the compressive stress first increases and then decreases during 0.5–1.5 s, the tensile stress appears during 1.5–2.5 s, and the compressive stress increases gradually during 2.5–4.0 s. The change trend of P284 is similar to that of P142, and the stress value is greater than that of P142. In summary, the closer to the assembly node, the greater the compressive stress.
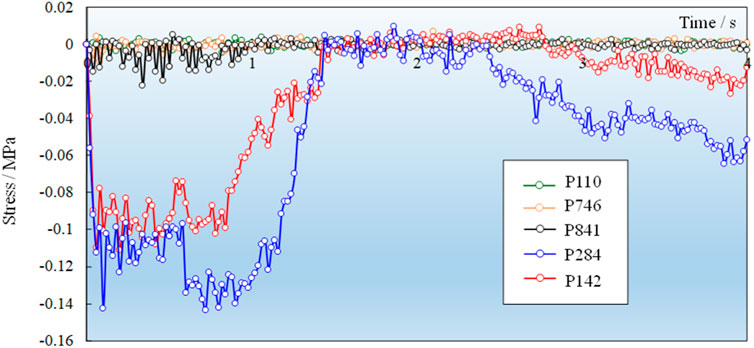
FIGURE 15. Stress—time curves of P110, P746, P841, P142, and P284 in model RWS-1.
5 Parameter analysis
Nine numerical models of fabricated cantilever retaining walls are established by changing the thickness of vertical plates, the strength of concrete and the depth of vertical plates embedded in the base. The effects of different parameters on the dynamic mechanical behavior and performance of fabricated retaining wall specimens are compared and analyzed. In order to improve the efficiency, only the wall is simulated without considering the soil behind the wall. The relevant parameters are shown in Table 2.
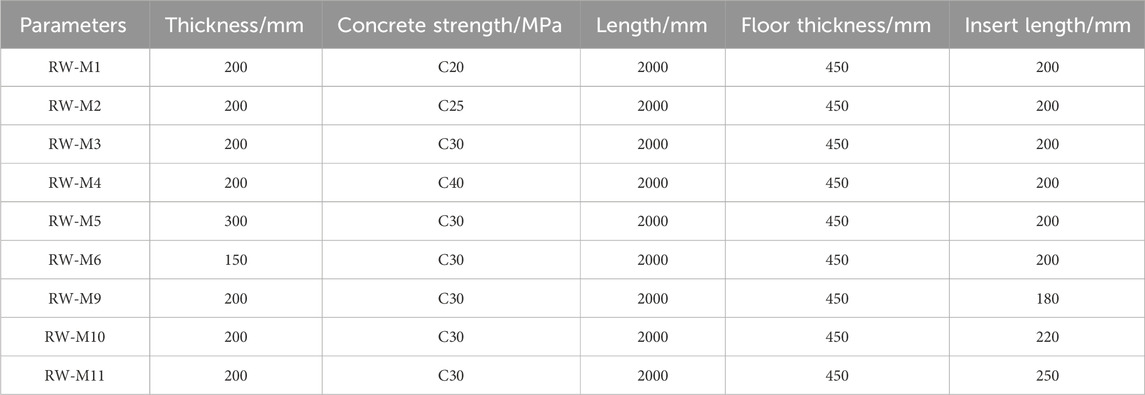
TABLE 2. Model parameters.
5.1 Concrete strength
The concrete strength grades of RW-M1, RW-M2, RW-M3, and RW-M4 are C20, C25, C30, and C40 respectively, and other parameters are the same. When Vrancea seismic wave is input, the calculation results of stress distribution of vertical slab with different concrete strength at 4.0 s are shown in Figure 16. It can be seen that the stress at the top of the vertical plate is almost zero, and the stress at the bottom is maximum. The bottom stress of vertical slab with concrete strength of C20 (RW-M1), C25 (RW-M2), C30 (RW-M3) and C40 (RW-M4) is 0.185 MPa, 0.5 MPa, 0.165 MPa, and 0.35 MPa respectively. Therefore, the strength of concrete significantly affects the stress of the vertical plate.
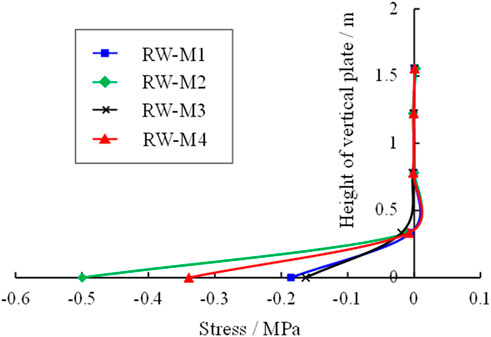
FIGURE 16. Stress of vertical slab with concrete strength of C20, C25, C30, and C40 at 4.0 s.
The displacement of vertical slabs with different concrete strength at 4.0 s is shown in Figure 17. As shown in Figure 17, it is noted that the displacement of vertical plate includes translation and rotation. The top displacement is the largest and the bottom is the smallest. The displacement distribution curve is basically straight. The displacement at the top of the vertical slab with concrete strength C25 is the largest, as well as the inclination. The displacement at the top of the vertical slab with concrete strength C30 and C40 decreases to about 0.8 mm, the inclination of the vertical slab decreases as well. Displacement of vertical plate with strength C20 is between of C25 and C30.
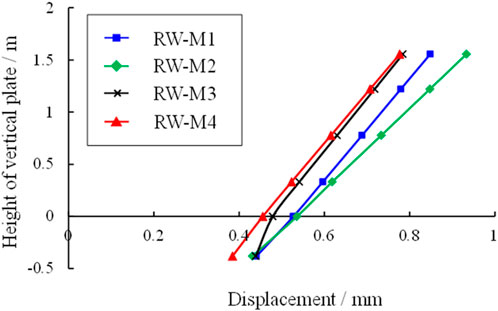
FIGURE 17. Displacement of vertical slab with concrete strength of C20, C25, C30, and C40 at 4.0 s.
5.2 Thickness of vertical plate
The vertical plate thickness of models RW-M6, RW-M3, and RW-M5 is 150 mm, 200 mm, and 300 mm respectively. The influence of thickness on plate stress, displacement and acceleration under seismic action is analyzed. The stress distribution curve of vertical plates with different thicknesses at 4.0 s is shown in Figure 18. It can be seen from the figure that the stress at the top of the vertical plate is tensile stress with small magnitude, and gradually transforms downward into compressive stress, which is relatively large. The compressive stress at the bottom vertical plate increases with the increase of the vertical plate thickness. The thicker the vertical plate is, the greater the stiffness is, and the smoother the stress distribution curve is.
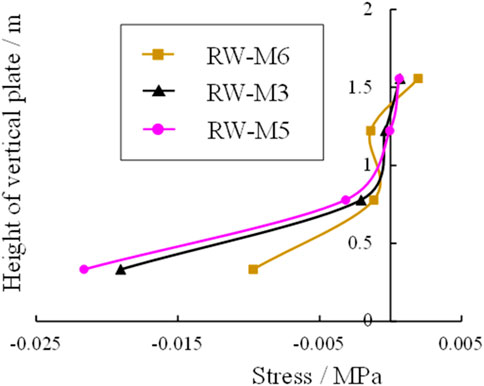
FIGURE 18. Stress of different vertical plates thickness with 150 mm, 200 mm and 300 mm at 4.0 s.
As shown in Figure 19, the overall displacement is less than 0.9 mm, and the upper displacement is larger. The greater the thickness of the vertical plate, the greater the horizontal displacement at the top. When the thickness of the vertical plate is 150 mm and 200 mm, the slope of the embedded section is smaller than that of the free section due to the limitation of the bottom plate. When the thickness of vertical plate is 300 mm, the stiffness is larger, and the slope of embedded section is the same as free section, which is greater than that of 150 mm and 200 mm.
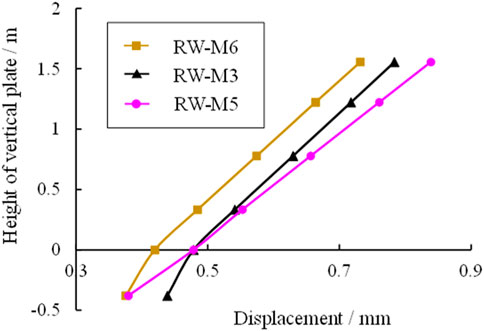
FIGURE 19. Displacement of vertical plate with thickness of 150mm, 200 mm and 300 mm at 4.0 s.
The acceleration distribution curves of vertical plates with different thicknesses at 4.0 s are shown in Figure 20. As shown in Figure 20, when the thickness of the vertical plate is 150 mm and 200 mm, the acceleration is almost zero compared with 300 mm. When the thickness of vertical plate is 150 mm, 200 mm and 300 mm, the inflection points are 4, 2, and 1 respectively. In general, with the increase of vertical plate thickness, the number of inflection point of acceleration distribution curve decreases gradually, and the acceleration of embedded section at the bottom of vertical plate increases gradually.
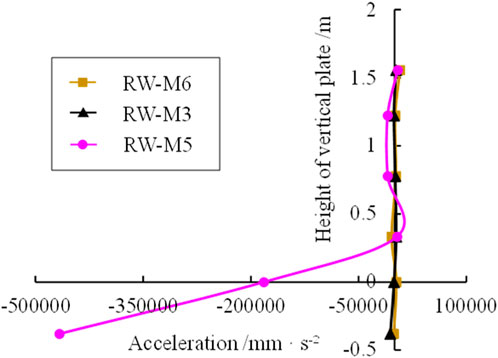
FIGURE 20. Acceleration of vertical plate with thickness of 150mm, 200 mm and 300 mm at 4.0 s.
5.3 Embedding depth of vertical plate
To study the influence of the embedded depth of vertical slab on the mechanical properties of retaining wall, models RW-M9, RW-M3, RW-M10, and RW-M11 were designed, with embedded depths of 180 mm, 200 mm, 220 mm, and 250 mm respectively. The stress distribution curves corresponding to different embedded depths of vertical plates at 4.0 s are shown in Figure 21. It can be seen from Figure 21 that the upper stress of the four models is close to zero, and the compressive stress at the bottom of the model gradually increases with the increase of the embedding depth. When the embedding depth is 250 mm, the compressive stress at the bottom increases significantly, and the tensile stress occurs at the connecting plate.
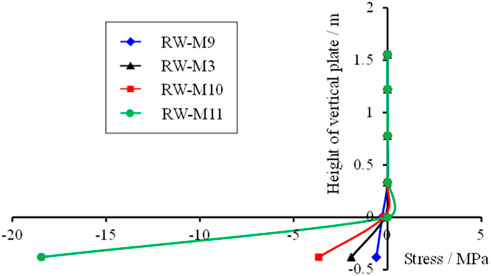
FIGURE 21. Stress of vertical plate with embedded depths of 180 mm, 200 mm, 220 mm and 250 mm at 4.0 s.
The vertical plate displacement distribution of models with different embedding depths at 4.0 s is shown in Figure 22. As shown in Figure 22, if the embedding depth of the vertical plate is small, the overall inclination of the vertical plate is large. When the embedding depth is 250 mm, the inclination direction of the embedding section is opposite to that of the free section, which is related to the tensile stress produced there, and the embedding section significantly reduces the slope of the free section.
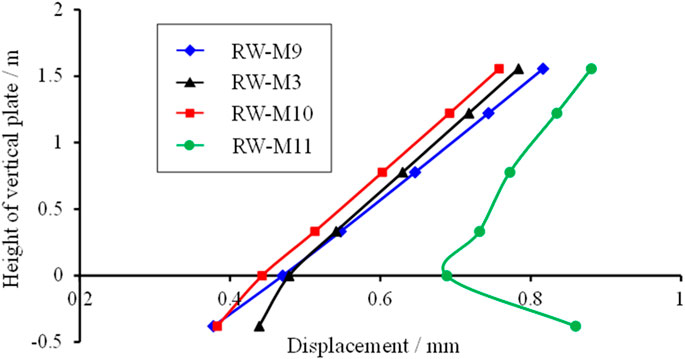
FIGURE 22. Displacement of vertical plate with embedded depths of 180 mm, 200 mm, 220 mm, and 250 mm at 4.0 s.
6 Conclusion
In this paper, the dynamic response of prefabricated cantilever retaining was investigated. The conclusions can be drawn as follows:
(1) The thickness of retaining wall significantly affects its failure pattern. The thinner the thickness, the more likely it is to occur a significant breaking phenomenon. On the contrary, When the thickness is larger, the shape of the retaining wall is more complete and the crack distribution is more limited. The vertical plate of the fabricated retaining wall deflects, and tensile cracks are formed at the assembly joints of the vertical plate and the floor.
(2) The stress of vertical slab of fabricated retaining wall is less than that of bottom slab, while the stress of bolts is much greater than that of vertical slab and bottom slab. Stress concentration occurs at the joint between the vertical plate and the base of retaining wall and around the bolt hole, which is most likely to be damaged.
(3) The displacement of vertical plate is small, and the displacement of top is the largest, which decreases gradually with the decrease of height. The maximum displacement of the base is mainly distributed near the front and rear ends. The displacement of retaining wall is mainly rotation, with slight sliding.
(4) The greater the thickness of the vertical plate, the smoother the stress distribution, the less the inflection point of the acceleration distribution, and the greater the displacement at the top of the vertical plate. The greater the embedded depth, the greater the compressive stress at the bottom.
Although some meaningful research results have been obtained in this study, there are still some shortcomings; for example, the influence of strength parameters and geometric parameters of rock and soil on dynamic response was not considered in parameter analysis; due to the limitation of test instruments, only vertical harmonics were set in model test, but transverse harmonics were not, and transverse harmonics have significant influence on the whole research system; the different loading methods used in numerical simulation and model test had certain influence on the comparison of results. In future research, the coincidence degree between numerical simulation and model test can be higher, including size and loading mode, etc. Furthermore, in parameter research, more parameters, such as rock and soil strength parameters, can be studied through simulation. In addition, displacement meters and accelerometers can be used in physical model tests.
Data availability statement
The raw data supporting the conclusion of this article will be made available by the authors, without undue reservation.
Author contributions
YD: Formal Analysis, Funding acquisition, Investigation, Visualization, Writing–original draft. XD: Investigation, Resources, Writing–review and editing. WH: Conceptualization, Funding acquisition, Methodology, Writing–review and editing. BH: Conceptualization, Validation, Writing–review and editing. SH: Data curation, Formal Analysis, Software, Writing–review and editing. PL: Data curation, Investigation, Resources, Writing–review and editing. MZ: Data curation, Investigation, Resources, Writing–review and editing.
Funding
The author(s) declare financial support was received for the research, authorship, and/or publication of this article. This study was funded by the National Natural Science Fund Pre Project of Anhui Polytechnic University (grant No. 2019yyzr08); the Start Fund of Talent Introduction of Anhui Polytechnic University (grant No. 2023YQQ016).
Conflict of interest
The authors declare that the research was conducted in the absence of any commercial or financial relationships that could be construed as a potential conflict of interest.
Publisher’s note
All claims expressed in this article are solely those of the authors and do not necessarily represent those of their affiliated organizations, or those of the publisher, the editors and the reviewers. Any product that may be evaluated in this article, or claim that may be made by its manufacturer, is not guaranteed or endorsed by the publisher.
References
Bakr, J., and Ahmad, S. M. (2018). A finite element performance-based approach to correlate movement of a rigid retaining wall with seismic earth pressure. Soil Dyn. Earthq. Eng. 114, 460–479. doi:10.1016/j.soildyn.2018.07.025
Bo, J. S., Xu, G. D., and Jing, L. P. (2001). Seismic response and dynamic stability analysis of soil slopes. Earthq. Eng. Eng. Vib. 21 (2), 116–120. doi:10.3969/j.issn.1000-1301.2001.02.020
Coyle, H. M., and Bartoskewitz, R. E. (1976). Earth pressure on precast panel retaining wall. J. Geotechnical Eng. Div. 102 (5), 441–456. doi:10.1061/ajgeb6.0000268
Du, Y. H., Pan, S. J., Fu, W. X., Jiang, M., Li, Y. S., Zhang, M., et al. (2022). Effect of continuous heavy rainfall on the earth pressure of finite soil. Sci. Technol. Eng. 22 (7), 2806–2813. doi:10.3969/j.issn.1671-1815.2022.07.034
Gupta, A., and Sawant, V. A. (2019). Seismic active earth pressure behind the inclined retaining wall for inclined c-ϕ soil backfill. J. Seismol. Earthq. Eng. 21 (1), 37–44.
Jamsawang, P., Voottipruex, P., Jongpradist, P., and Likitlersuang, S. (2021). Field and three-dimensional finite element investigations of the failure cause and rehabilitation of a composite soil-cement retaining wall. Eng. Fail. Anal. 127, 105532. doi:10.1016/j.engfailanal.2021.105532
Kloukinas, P., Penna, A., di Santolo, A. S., Bhattacharya, S., Dietz, M. S., Dihoru, L., et al. (2014). “Experimental investigation of dynamic behavior of cantilever retaining walls,” in Seismic evaluation and rehabilitation of structures. Editors A. Ilki, and M. N. Fardis (Berlin, Germany: Springer International Publishing), 477–493.
Li, G., Zhu, C., Tang, S. B., Dun, K., and Wu, C. Z. (2023). Energy balance support method in soft rock tunnel with energy absorbing anchor cable. Tunn. Undergr. Space Technol. 141, 105380. doi:10.1016/j.tust.2023.105380
Li, X., Wu, Y., and He, S. (2010). Seismic stability analysis of gravity retaining walls. Soil Dyn. Earthq. Eng. 30 (10), 875–878. doi:10.1016/j.soildyn.2010.04.005
Lian, M., and Su, M. (2017). Shake table test of Y-shaped eccentrically braced frames fabricated with high-strength steel. Earthquakes Struct. 12 (5), 501–503. doi:10.12989/eas.2017.12.5.501
Luo, H. C. (2011). Study on failure mechanism of gravity retaining wall of typical cutting slope in wenchuan earthquake-stricken area. Chengdu, China: Southwest Jiaotong University.
Madabhushi, S. P. G., and Zeng, X. (2007). Simulating seismic response of cantilever retaining walls. J. Geotechnical Geoenvironmental Eng. 133 (5), 539–549. doi:10.1061/(asce)1090-0241(2007)133:5(539)
Ren, F., Huang, Q., and Chen, J. (2022). Centrifuge modeling of geosynthetic-reinforced soil retaining walls subjected to the combined effect of earthquakes and rainfall. Geotext. Geomembranes 50 (3), 470–479. doi:10.1016/j.geotexmem.2022.01.005
Ren, F., Huang, Q., and Wang, G. (2020). Shaking table tests on reinforced soil retaining walls subjected to the combined effects of rainfall and earthquakes. Eng. Geol. 267, 105475. doi:10.1016/j.enggeo.2020.105475
Ren, S. P., Chen, X. J., Ren, Z. L., Cheng, P., and Liu, Y. (2023). Large-deformation modelling of earthquake-triggered landslides considering non-uniform soils with a stratigraphic dip. Comput. Geotechnics 159, 105492. doi:10.1016/j.compgeo.2023.105492
Salem, A. N., Ezzeldine, O. Y., and Amer, M. I. (2020). Seismic loading on cantilever retaining walls: full-scale dynamic analysis. Soil Dyn. Earthq. Eng. 130, 105962. doi:10.1016/j.soildyn.2019.105962
Scotto di Santolo, A., and Evangelista, A. (2011). Dynamic active earth pressure on cantilever retaining walls. Comput. Geotechnics 38 (8), 1041–1051. doi:10.1016/j.compgeo.2011.07.015
Shan, R. L., Li, Z. L., Wang, C. H., Meng, C., Wei, Y. H., Li, Y. Z., et al. (2022). Study on distortion energy and stability of gob floor based on stress deviator field. Energy Sci. Eng. 10 (8), 2756–2771. doi:10.1002/ese3.1165
Tao, L., Ding, P., Shi, C., Wu, X., Wu, S., and Li, S. (2019). Shaking table test on seismic response characteristics of prefabricated subway station structure. Tunn. Undergr. Space Technol. 91, 102994. doi:10.1016/j.tust.2019.102994
Upadhyay, A., Krishna, A. M., and Singh, K. D. (2011). “Behavior of cantilever retaining walls under seismic conditions,” in 5th International Conference on Earthquake Geotechnical Engineering, Santiago de Chile, Chile, January, 2011.
Veletsos, A. S., and Younan, A. H. (1997). Dynamic response of cantilever retaining walls. J. Geotechnical Geoenvironmental Eng. 123 (2), 161–172. doi:10.1061/(asce)1090-0241(1997)123:2(161)
Watanbe, K., Munaf, Y., Koseki, J., Tateyama, M., and Kojima, K. (2003). Behaviors of several types of model retaining walls subjected to irregular excitation. Soils Found. 43 (5), 13–27. doi:10.3208/sandf.43.5_13
Wen, C., and Yang, G. (2011). Large-scale shaking table tests study of seismic displacement mode of retaining structures under earthquake loading. Chin. J. Rock Mech. Eng. 30 (7), 1502–1512.
Wu, P. S., Wang, J., and Ou, J. P. (2020). Research and design of main failure modes of seismically isolated structures subjected to very-rare earthquakes. J. Disaster Prev. Mitig. Eng. 40 (3), 317–325. doi:10.13409/j.cnki.jdpme.2020.03.001
Yenginar, Y., and Özkan, İ. (2023). Local site conditions and hydromechanical effects in service life of cantilever retaining walls. Eng. Fail. Anal. 153, 107536. doi:10.1016/j.engfailanal.2023.107536
Zhang, J., Hu, X., Sun, Q., Zhang, Y., Zhu, W., and Li, L. (2020). Experimental study on seismic performance of glulam-concrete composite beam-to-column joints. Compos. Struct. 236, 111864. doi:10.1016/j.compstruct.2020.111864
Keywords: prefabricated cantilever retaining, failure pattern, mechanical properties, cracks, dynamic response
Citation: Du Y, Du X, Han W, Huang B, Huang S, Liang P and Zhang M (2024) Failure behavior and mechanical properties of prefabricated cantilever retaining under dynamic effect. Front. Built Environ. 10:1343271. doi: 10.3389/fbuil.2024.1343271
Received: 01 December 2023; Accepted: 05 February 2024;
Published: 04 March 2024.
Edited by:
Yong Tan, Tongji University, ChinaCopyright © 2024 Du, Du, Han, Huang, Huang, Liang and Zhang. This is an open-access article distributed under the terms of the Creative Commons Attribution License (CC BY). The use, distribution or reproduction in other forums is permitted, provided the original author(s) and the copyright owner(s) are credited and that the original publication in this journal is cited, in accordance with accepted academic practice. No use, distribution or reproduction is permitted which does not comply with these terms.
*Correspondence: Wei Han, aGFuMTAxN0BtYWlsLmFocHUuZWR1LmNu; Bo Huang, SHVhbmdib0BhaHB1LmVkdS5jbg==