Abstract
Lithium thionyl chloride (LiSOCl2) batteries are pivotal in enabling long-term, maintenance-free operation of smart building sensor networks due to their superior energy density, exceptional shelf life, and reliability in extreme environments. These attributes make them particularly suitable for powering a diverse array of embedded electronic devices within smart infrastructure—including wireless HVAC sensors, high-voltage direct current sensing units, low-power IoT nodes, security and occupancy detectors, structural health monitors, and adaptive lighting or ventilation controllers. This study presents an empirical evaluation of four leading LiSOCl2 battery brands—EVE, Saft, TEKCELL, and TADIRAN—to assess their real-world performance under varying discharge currents, with direct implications for power circuit design in smart building sensor networks. Despite similar datasheet specifications, our findings reveal substantial discrepancies in actual performance, capacity retention, and degradation characteristics. This highlights the need for empirical validation in battery selection, beyond nominal manufacturer ratings, especially when deployed in systems requiring sustained ultra-low power draw over multi-decade lifespans. These discrepancies found underscore the need for accurate battery characterization in energy budgeting, adaptive duty-cycling, and intelligent load management strategies. The findings also inform battery selection for hybrid systems incorporating energy harvesting, enabling sustainable, maintenance-free sensor deployment in energy-optimized building environments. By aligning real-world battery behavior with architectural design choices in sensor systems, our results support the deployment of scalable, sustainable sensor networks in smart buildings. These networks can operate autonomously for 10–40 years, reducing lifecycle maintenance costs and material waste, thereby advancing goals in energy-efficient, digitally optimized building design.
Introduction
In smart building environments, especially those relying on distributed wireless sensor networks for HVAC and air quality control, battery selection plays a pivotal role in ensuring system reliability and minimizing maintenance overhead. Many devices require short-duration high pulses for wireless data transmission and two-way communications (Guida et al., 2023; Google Scholar, 2024). LiSOCl2 batteries are the ideal choice for powering wireless sensors within smart infrastructure—including wireless HVAC sensors, high-voltage direct current (HVDC) sensing units (Islam et al., 2016), low-power IoT nodes, security and occupancy detectors, structural health monitors (Jams et al., 2022), and adaptive lighting or ventilation controllers (Gu et al., 2020). LiSOCl2 batteries exhibit exceptionally low self-discharge characteristics, which is fundamental to their suitability for long-term sensor deployments. Quality LiSOCl2 batteries typically maintain self-discharge rates of less than 1% per year (T. Batteries GmbH, 2025; Hagedorn 2020), allowing them to retain their charge for extended periods and ensuring reliable operation even after years of inactivity or intermittent use. This characteristic is particularly critical for applications where sensors may remain dormant for extended intervals or must function reliably throughout long deployment cycles (International Energy Agency, 2024).
These batteries are available in both spiral-wound and bobbin-type configurations, with the latter design achieving even lower self-discharge rates—as low as 0.7% annually—due to the beneficial passivation effect (Islam et al., 2016). However, while passivation significantly enhances shelf life, its cumulative effects combined with exposure to extreme temperatures can develop gradually over years, potentially leading to underestimated battery life in predictive models if not properly accounted for. It is crucial to recognize that battery quality varies significantly among manufacturers. Lower-grade LiSOCl2 cells may exhibit annual self-discharge rates of up to 3% —three times higher than quality variants (Ave, 2001). At this elevated self-discharge rate, batteries can lose up to 30% of their total capacity over a 10-year period (Google Scholar, 2025), making the advertised 40-year operational lifespans unrealistic and emphasizing the importance of selecting high-quality cells for critical long-term applications. Building on these considerations, this paper will shed more light in this direction by providing a detailed comparison of LiSOCl2 batteries from different manufacturers, by evaluating key performance metrics such as constant discharge rates, voltage stability, and capacity retention. Beyond their excellent charge retention, LiSOCl2 batteries demonstrate remarkable temperature tolerance, functioning effectively across extreme temperature ranges from −55°C to +85°C, with specialized variants capable of operating at temperatures up to 125°C or below −80°C (DTIC, 1991; Schlaikjer, 1985). This wide operational envelope makes them exceptionally robust against the environmental fluctuations commonly encountered in building infrastructure and HVAC systems. The batteries also provide consistent voltage output throughout most of their discharge cycle, which is essential for the stable operation of sensitive wireless sensors and ensures accurate data transmission and reliable device performance over time (Roth et al., 2025). Combined with their high energy density, these characteristics enable compact sensor designs—a crucial advantage in modern smart buildings where space constraints and aesthetic integration are paramount considerations.
Manufacturers specify battery performance under ideal conditions, but actual usage environments often differ. These batteries should have the ability to handle both low-power standby modes and occasional high-current pulses, which is ideal for long-term IoT sensor applications with wireless data transmission. The profile in Figure 1 demonstrates a real current profile, with initial low-power standby mode (5 µA), followed by a moderate activation phase (10 mA), a brief high-current pulse (100 mA), and a return to ultra-low standby current (5 µA). Such discharge behavior is crucial for devices requiring periodic data transmission, sensor activation, or wireless communication.
FIGURE 1

(a) Example of IoT wireless sensor current draw pattern under real conditions (b) Simulation profile (c) The different commercial LiSOCl2 batteries used in this study.
However, this work focuses exclusively on constant discharge currents (1 mA, 10 mA, 30 mA, and 100 mA) to ensure a controlled and repeatable evaluation of battery performance. Working with constant currents allows us to directly compare different battery brands under standardized discharge conditions, validate manufacturer specifications, and assess efficiency, capacity, and degradation trends systematically. Perhaps, once these baseline characteristics are well understood, future studies can extend the analysis to variable current profiles to simulate real-world usage more accurately and investigate dynamic load effects on battery performance, which the authors intend to present in their future works.
Existing works
Within the lithium family there are a number of primary (non-rechargeable) chemistries shown in Table 1, including iron disulfate (LiFeS2), lithium manganese dioxide (LiMnO2), lithium thionyl chloride (LiSOCl2), and lithium metal-oxide (Morrison and Marincic, 1993; Katırcı et al., 2024; Stern, 2021). Of all these choices, lithium thionyl chloride (LiSOCl2) batteries are overwhelmingly chosen for long-term deployments because they deliver the highest capacity and highest energy density of all lithium cells to support product miniaturization. LiSOCl2 batteries can be manufactured in two ways, using a spiral wound or bobbin-type construction. Spiral wound cells have a larger surface area for higher rate energy flow, while bobbin-type cells have less surface area to maximize the passivation effect (Guida et al., 2023; Google Scholar, 2024; Horn and Shao-Horn, 2003). Bobbin-type LiSOCl2 cells also feature an incredibly low self-discharge rate as low as 0.7% per year, largely due to harnessing the passivation effect, enabling certain low-power devices to work for up to 40 years on the original battery.
TABLE 1
| Characteristic | LiSOCl₂ | Li metal oxide | Alkaline | LiFeS₂ | LiMnO₂ |
|---|---|---|---|---|---|
| Energy Density (Wh/L) | 1,420 | 370 | 600 | 650 | 650 |
| Power | Low | Very High | Low | High | Moderate |
| Voltage | 3.6 V | 4.1 V | 1.5 V | 1.5 V | 3.0 V |
| Current pulse capacity | Excellent | High | Low | Moderate | Moderate |
| Passivation | High | Very Low | N/A | Fair | Moderate |
| Performance at Elevated Temp | Moderate | Moderate | Low | Moderate | Fair |
| Performance at Low Temp | Moderate | Moderate | Low | Moderate | Poor |
| Operating Life | Excellent | Excellent | Moderate | Moderate | Fair |
| Self-Discharge Rate | Very Low | Very Low | Very High | Moderate | High |
| Operating Temp | −80°C–125°C | −45°C–85°C | 0°C–60°C | −20°C–60°C | 0°C–60°C |
Table for Types of primary cells available in the market.
TABLE 2
| Specifications | EVE (ER14250) | SAFT (LS 14250) | TEKCELL (SB-AA02 (P)) | TADIRAN (SL-750) |
|---|---|---|---|---|
| Voltage | 3.6 V | 3.6 V | 3.6 V | 3.6 V |
| Max pulse discharge current | Up to 50 mA | Up to 100 mA | 80 mA | 100 mA |
| Self Discharge Rate |
Not known | >1% per year | >1% after 1 year |
>1% after 1 year |
| Operating Temp | −60°C – +85°C | −60°C – +85°C | −55°C – +85°C | −55°C – +85°C |
| Nominal Capacity | 1.2Ah | 1.2Ah | 1.2Ah | 1.1Ah |
| Max. Continuous Current | 15 mA | 35 mA | 20 mA | 50 mA |
| Weight | 10 g | 9 g | 9.0 g | 9.6 g |
Table for Battery specifications.
In recent years, a lot of research on the long-term storage of batteries has been mostly aimed at lithium-ion secondary batteries rather than primary batteries (Miles, 1997; Zabara and Ulgut, 2020; Ave, 2001), and the existing life prediction models are mostly developed based on lithium-ion secondary batteries. There are few studies (Zabara et al., 2021; Gabano, 1980) on the life prediction model of lithium primary batteries. At present, research on the anode of a LiSOCl2 battery is mainly aimed at the voltage lag phenomenon of the battery and the lithium chloride passivation film that appears on the anode lithium, which leads to the low initial discharge voltage platform of the battery (Morrison and Marincic, 1993; Katırcı et al., 2024; Stern, 2021). During the storage of the battery, lithium metal will contact SOCl2, and a redox reaction will occur, resulting in a lithium chloride passivation film insoluble in electrolytes. The transfer of electrons and the flow of electrolytes will be hindered by this passivation film (Zabara and Ulgut, 2020; Wang et al., 2023; Stern, 2021).
When an ultra-long-life power source is essential it is important to conduct thorough diligence when comparing competing battery brands. This evaluation process includes the need for all prospective battery manufacturers to provide fully documented test results, along with in-field performance data under similar loads and environmental conditions along with multiple customer references.
Among the prominent manufacturers of lithium thionyl chloride (Li-SOCl2) batteries, EVE (ER14250), SAFT (LS 14250), TEKCELL (SB-AA02), and TADIRAN (SL-750) are chosen for this study and their respective characteristics (Evemall, 2025; Saft4U, 2025; T. Batteries Gm bH, 2025; Vitzrocell, 2025) are presented in the table below. The selected batteries from EVE, SAFT, TEKCELL, and TADIRAN were chosen as they are cost effective and easily available in the European market (Wang et al., 2023; Jain, 1998). Additionally, they offer closely matched datasheet parameters, enabling a fair and controlled comparison under identical test conditions. This approach allows the authors to isolate and examine subtle yet significant performance differences that may not be apparent from manufacturer specifications alone. These brands are also widely used in real-world deployments, especially in wireless sensor networks for smart buildings (Saunders, 1998; Bryzgalov et al., 2013; Sun et al., 2021), ensuring that our findings are directly relevant to current industry practices. Additionally, by including manufacturers from different regions, the study provides a broader perspective on global battery performance standards and highlights potential quality variations across the international market.
While EVE, TEKCELL, and SAFT batteries demonstrated higher capacities (1.2 Ah) and high discharge currents (upto 100 mA), TADIRAN offered slightly lower capacity (1.1 Ah) with a maximum discharge current of 100 mA (Zabara et al., 2021).
Commercial batteries often specify their capacity and performance at standard discharge rates, such as 20 mA, 10 mA, and 1 mA. Figure 2 consists of the three graphs illustrating the voltage discharge profiles of four different LiSOCl2 batteries (EVE, SAFT, TEKCELL, and TADIRAN) under varying discharge currents. The curves demonstrate voltage stability over time, followed by a steep voltage drop near the end of battery life, characteristic of lithium primary batteries. The differences between these batteries become evident in their lifespan, discharge stability, and overall performance at different loads.
FIGURE 2
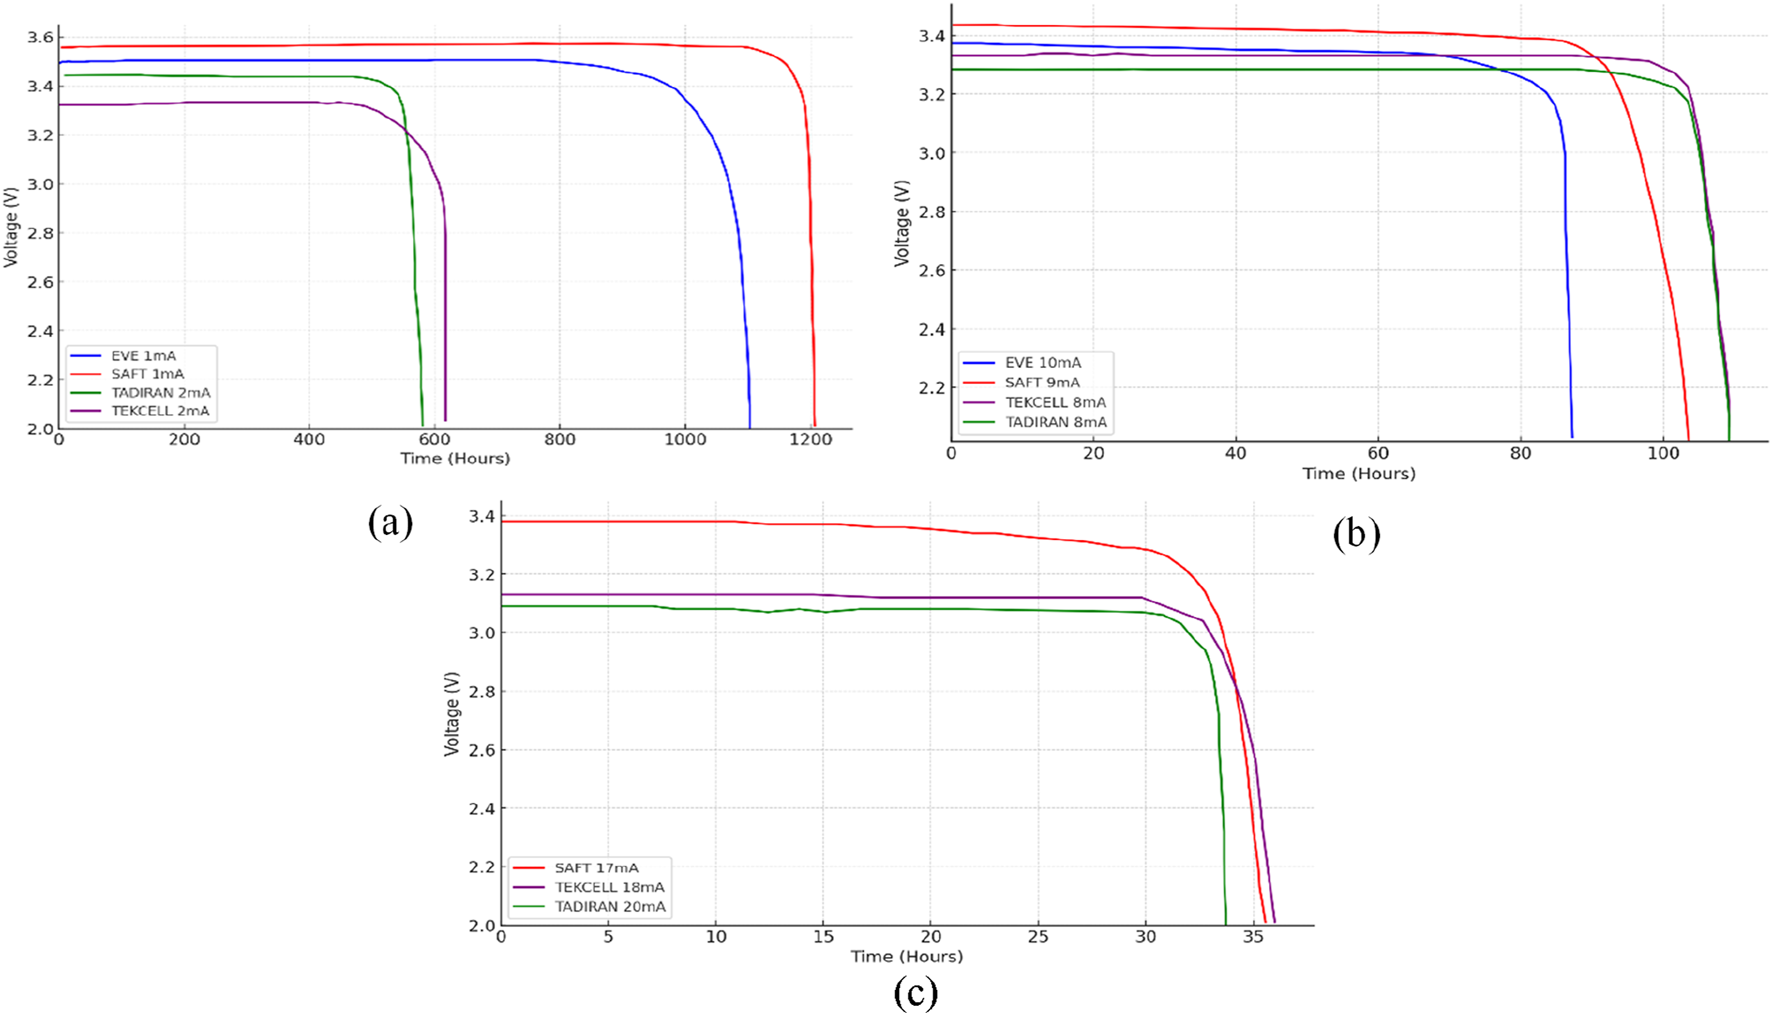
The estimated values from manufacturers for (a) low (b) moderate (c) high discharge currents.
Low discharge current (1 mA–2 mA) performance
At very low discharge currents (1 mA–2 mA), all the batteries exhibit a long, stable voltage plateau, meaning they can sustain low-power applications for extended durations. SAFT (Red) and EVE (Blue) last the longest, with voltage stability maintained beyond 1,000 h before a sharp cutoff. TEKCELL (Purple) and TADIRAN (Green) show earlier voltage drops, with TADIRAN falling first at around 600 h. SAFT has the flattest discharge curve, indicating superior long-term stability, making it the best choice for ultra-low-power IoT applications. EVE follows closely, performing slightly worse than SAFT but better than TEKCELL and TADIRAN. TEKCELL and TADIRAN depleted significantly earlier, also because their discharge current was two times higher than that of EVE and SAFT.
Moderate discharge current (8 mA–10 mA) performance
At moderate discharge currents (8 mA–10 mA), it is seen that EVE exhibits the steepest drop-off in voltage, indicating the shortest lifespan also because its discharge current (10 mA) was higher compared to the other batteries, SAFT maintains the highest voltage throughout most of the discharge cycle, followed by EVE, TEKCELLL and TADIRAN. TECKCELL and TADIRAN have similar performance, with a slightly higher voltage for TEKCELL, both having the discharge current (8 mA).
Higher discharge current (17 mA–20 mA) performance
At higher discharge currents (17 mA–20 mA), the batteries experience faster depletion, and their differences in energy retention become most apparent.
At 17 mA discharge current, SAFT maintains the highest voltage and a runtime (∼35 h), proving its superior high-current performance. TECKCELL and TADIRAN have similar performance for most of the cycle, but TADIRAN drops off slightly earlier due to its higher discharge current (20 mA). The discharge curve for EVE batteries is provided by the manufacturer only for currents up to 10 mA. As a result, higher discharge rate data is not available and, therefore, not included in the plot. Figure 2 shows the estimated voltage values from the manufacturers for low (a), moderate (b) and high (c) discharge currents.
Performing tests in lab at these rates is essential to directly compare the experimental results with the manufacturer’s specifications, to verify the accuracy of their claims, and ensure the batteries meet performance expectations under typical usage conditions. This comparison helps detect any discrepancies, ensures reliability, and supports informed decisions in battery selection and application. The manufacturers specifications will be evaluated under real discharging tests and variations will be discussed in conclusion. The following sections explain the methodology used to implement these tests and provide a discussion of the results.
There have been other studies that focused on predicting the lifetimes of Li-ion batteries (Wei and Dietrich, 2005; Weaver and Meeker, 2014; Whitmore, 1995). Ramadass et al. (2004) developed a semiempirical reliability model for predicting the capacity fading of Li-ion cells. These models provide a scientific approach to predicting the aging behavior of Li batteries, and some of them agree with experimental data. However, most degradation experiments are based on the statistic discharging process under a fixed temperature.
Methodology
In order to represent typical functional scenarios and to provide discharging curves comparable to datasheet values, four discharge currents are chosen, 100 mA and 30 mA for high-load scenarios, simulating relatively heavy usage or wireless transmission, 10 mA for medium-load scenario, representing moderate usage during active operation, and 1 mA for low-load scenario, simulating very light or idle usage but not deep sleep modes where the capacity might be as low as few µA. Also, manufacturers of these commercial batteries provide capacity value and performance characteristics at standard discharge rates, often around 20 mA, 10 mA, and 1 mA. Testing at these discharging currents values allows for direct comparison with manufacturer specifications estimated from datasheet. The experiment setup is repeated for 1 mA, 10 mA, 30 mA and 100 mA discharge current values. In order to get a credible reproducible result, five cells from each of the battery types were tested, so 25 cells were set up for every experiment. In total 100 batteries were used in this study.
Circuit assembly is done as shown in the schematic in Figure 3. Figure 3a shows the schematic used in the experiment and Figure 3b shows a photo of the experiment setup. An INA219 circuit is used to measure the current through resistor R1. The sensor is interfaced with an ESP32-S2 microcontroller for data acquisition. A MOSFET is employed to control the circuit’s operation, with its gate connected to an operational amplifier (op-amp) for signal amplification and driving. Resistors R3(27 kΩ) and R4 (62 kΩ) form a voltage divider to stabilize the voltage at the op-amp input to define discharging current. The circuit powers the op-amp with a 5 V source and the ESP32-S2 with a 3.3 V supply.
FIGURE 3

(a) The schematic used for battery discharge (b) Photo of battery discharging setup.
In the given circuit, the operational amplifier (op-amp) is configured to maintain a constant voltage of 1 V over the R2 resistor. This is typically achieved using a feedback loop where the op-amp adjusts the output to ensure the voltage at the inverting input remains at 1 V. If a known resistance R2 is used, maintaining 1 V across R2 allows for precise current control using Ohm’s Law. The regulated discharging current is calculated using the following Equation 1.
The specific required discharging current is set by the value of resistor R2. The specific R2 values for each discharging currents are given in Table 3 below. The precise value of the current is measured by voltage over shunt resistor R1 by INA219. The values of R1 and R2 are tabulated below.
TABLE 3
| No | Discharge current (mA) | R1 (Ω) | R2 (Ω) |
|---|---|---|---|
| 1 | 1 | 10 | 1,000 |
| 2 | 10 | 1 | 100 |
| 3 | 30 | 1 | 33 |
| 4 | 100 | 1 | 10 |
Table for R1 R2 and discharging current.
Multiple identical circuits (as shown in the experimental photo in Figure 3b) were replicated on breadboards for testing. Each breadboard setup included the same components to ensure consistency across measurements. The ESP32-S2 microcontroller is programmed to communicate with the INA219 circuit via I2C, a code is written to log current and voltage data, which is crucial for evaluating battery performance and circuit behavior. The circuit configuration allows for real-time monitoring of battery discharge characteristics, including current capacity and voltage drops.
Since these batteries have a relatively flat discharge profile, their voltage drops sharply after 2.5 V, making operation below 2 V unreliable. This 2 V cut-off voltage for LiSOCl2 batteries as a chosen threshold also aligns with manufacturer specifications and ensures compatibility with embedded systems and industrial applications. Additionally, setting 2 V as the limit prevents power instability, avoids unexpected shutdowns, and maintains safety. These configurations ensured accurate current regulation corresponding to each discharge rate.
Results
The first discharging test is done for 1 mA which lasted for about 1,200 h. The second test is done for 10 mA constant current discharge, which needed around 90 h to discharge until cutoff voltage is reached, the third test with 30 mA lasted for 26 h duration and the last test with 100 mA lasted for 3 h duration. Figure 4 shows EVE, SAFT, TEKCELL, and TADIRAN—at four different discharge currents: 1 mA (plot a), 10 mA (plot b), 30 mA (plot c), and 100 mA (plot d).
FIGURE 4
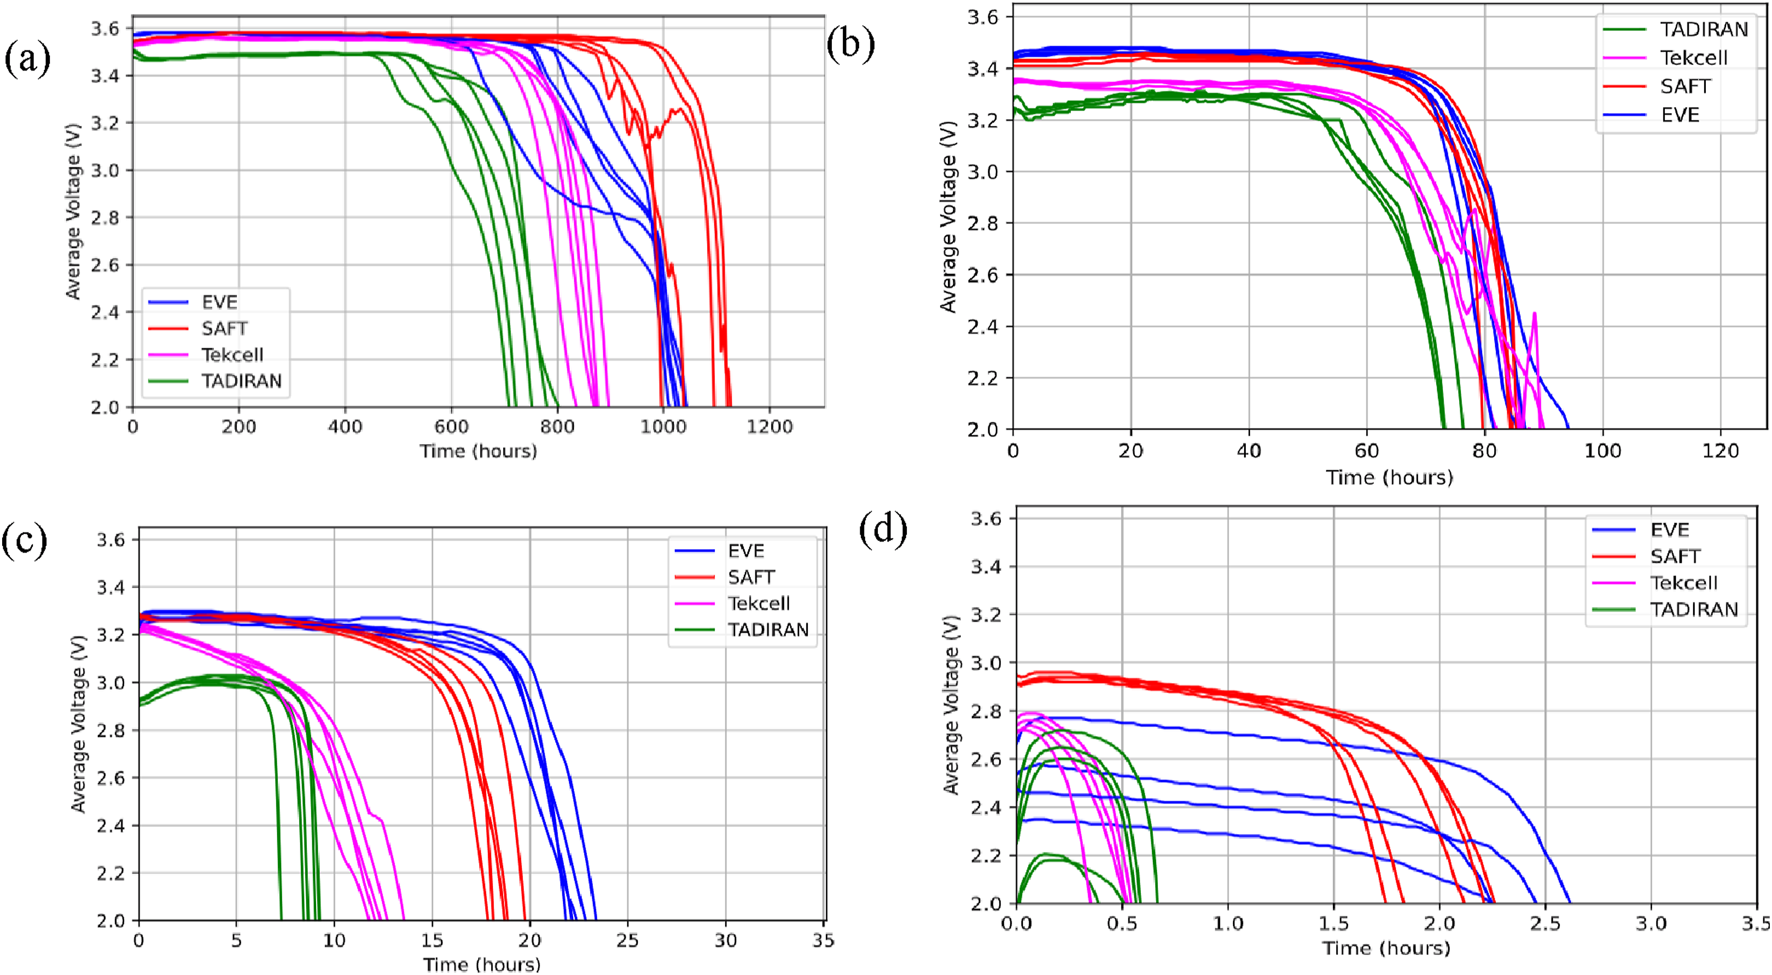
Voltage verses time plots for (a) 1 mA (b) 10 mA (c) 30 mA and (d) 100 mA discharge current.
Low discharge current (1–2 mA)
As seen in Figure 4a at 1 mA, the batteries show a long, stable voltage plateau with a gradual drop near the end. EVE and SAFT exhibit the longest lifespan, lasting well beyond 1,000 h. TADIRAN has a steeper drop-off compared to the others. TEKCELL discharges faster than EVE and SAFT, making it less ideal for ultra-long-term, low-current applications.
Moderate discharge current (10 mA)
The discharge duration decreases significantly compared to 1 mA, with SAFT and EVE showing the best longevity. TEKCELL and TADIRAN reach their cutoff voltage faster, meaning they are less efficient at 10 mA loads. SAFT maintains a very stable voltage profile for most of the discharge, making it highly reliable for medium-power IoT applications.
The initial rise in voltage observed in the TADIRAN battery is most likely due to the breakdown of the passivation layer, reduction in internal resistance, and warming-up effects. When the discharging starts, the passivation layer initially resists electron flow, causing a slightly lower voltage. As current continues to flow, the passivation layer starts to break down, reducing resistance and allowing the voltage to increase temporarily before stabilizing. This effect is particularly stronger in TADIRAN batteries as seen in Figures 4b–d. This layer prevents self-discharge but also increases internal resistance (Gabano, 1980), (Jauch, 2024).
High discharge current (30 mA)
The initial voltages for all battery types start above 3.2 V except for TADIRAN, but differences in early behavior indicate variations in internal resistance, passivation layers, and chemistry stability.
The initial voltage rise in TADIRAN and TEKCELL is due to passivation breakdown and reduction in internal resistance. SAFT and EVE show a more stable discharge, indicating better chemistry control and lower internal resistance. EVE performs the best in terms of sustained voltage and overall runtime. TADIRAN and TEKCELL batteries deplete faster, suggesting lower capacity.
Very high discharge current (100 mA)
TADIRAN and TEKCELL struggle with high-drain applications due to passivation resistance and lower capacity. SAFT and EVE maintain better voltage stability and last longer under high load, showing superior energy density and internal resistance control. All batteries experience a significantly faster voltage drop due to the high current discharge, leading to shorter runtimes. EVE outperforms the rest, making it more suitable for high-current applications, but however all the voltages are under 3 V which in some applications can be a problem.
Capacity measurement analysis
After conducting extensive experiments and collecting data on the battery capacity under different conditions, box-whiskers plot for comparison of different capacities of selected types of batteries is plotted. Figure 5 visually represents the total energy capacity (in Wh) of four battery types (EVE, SAFT, TEKCELL, and TADIRAN) at different discharge currents: 1 mA, 10 mA, 30 mA, and 100 mA.
FIGURE 5
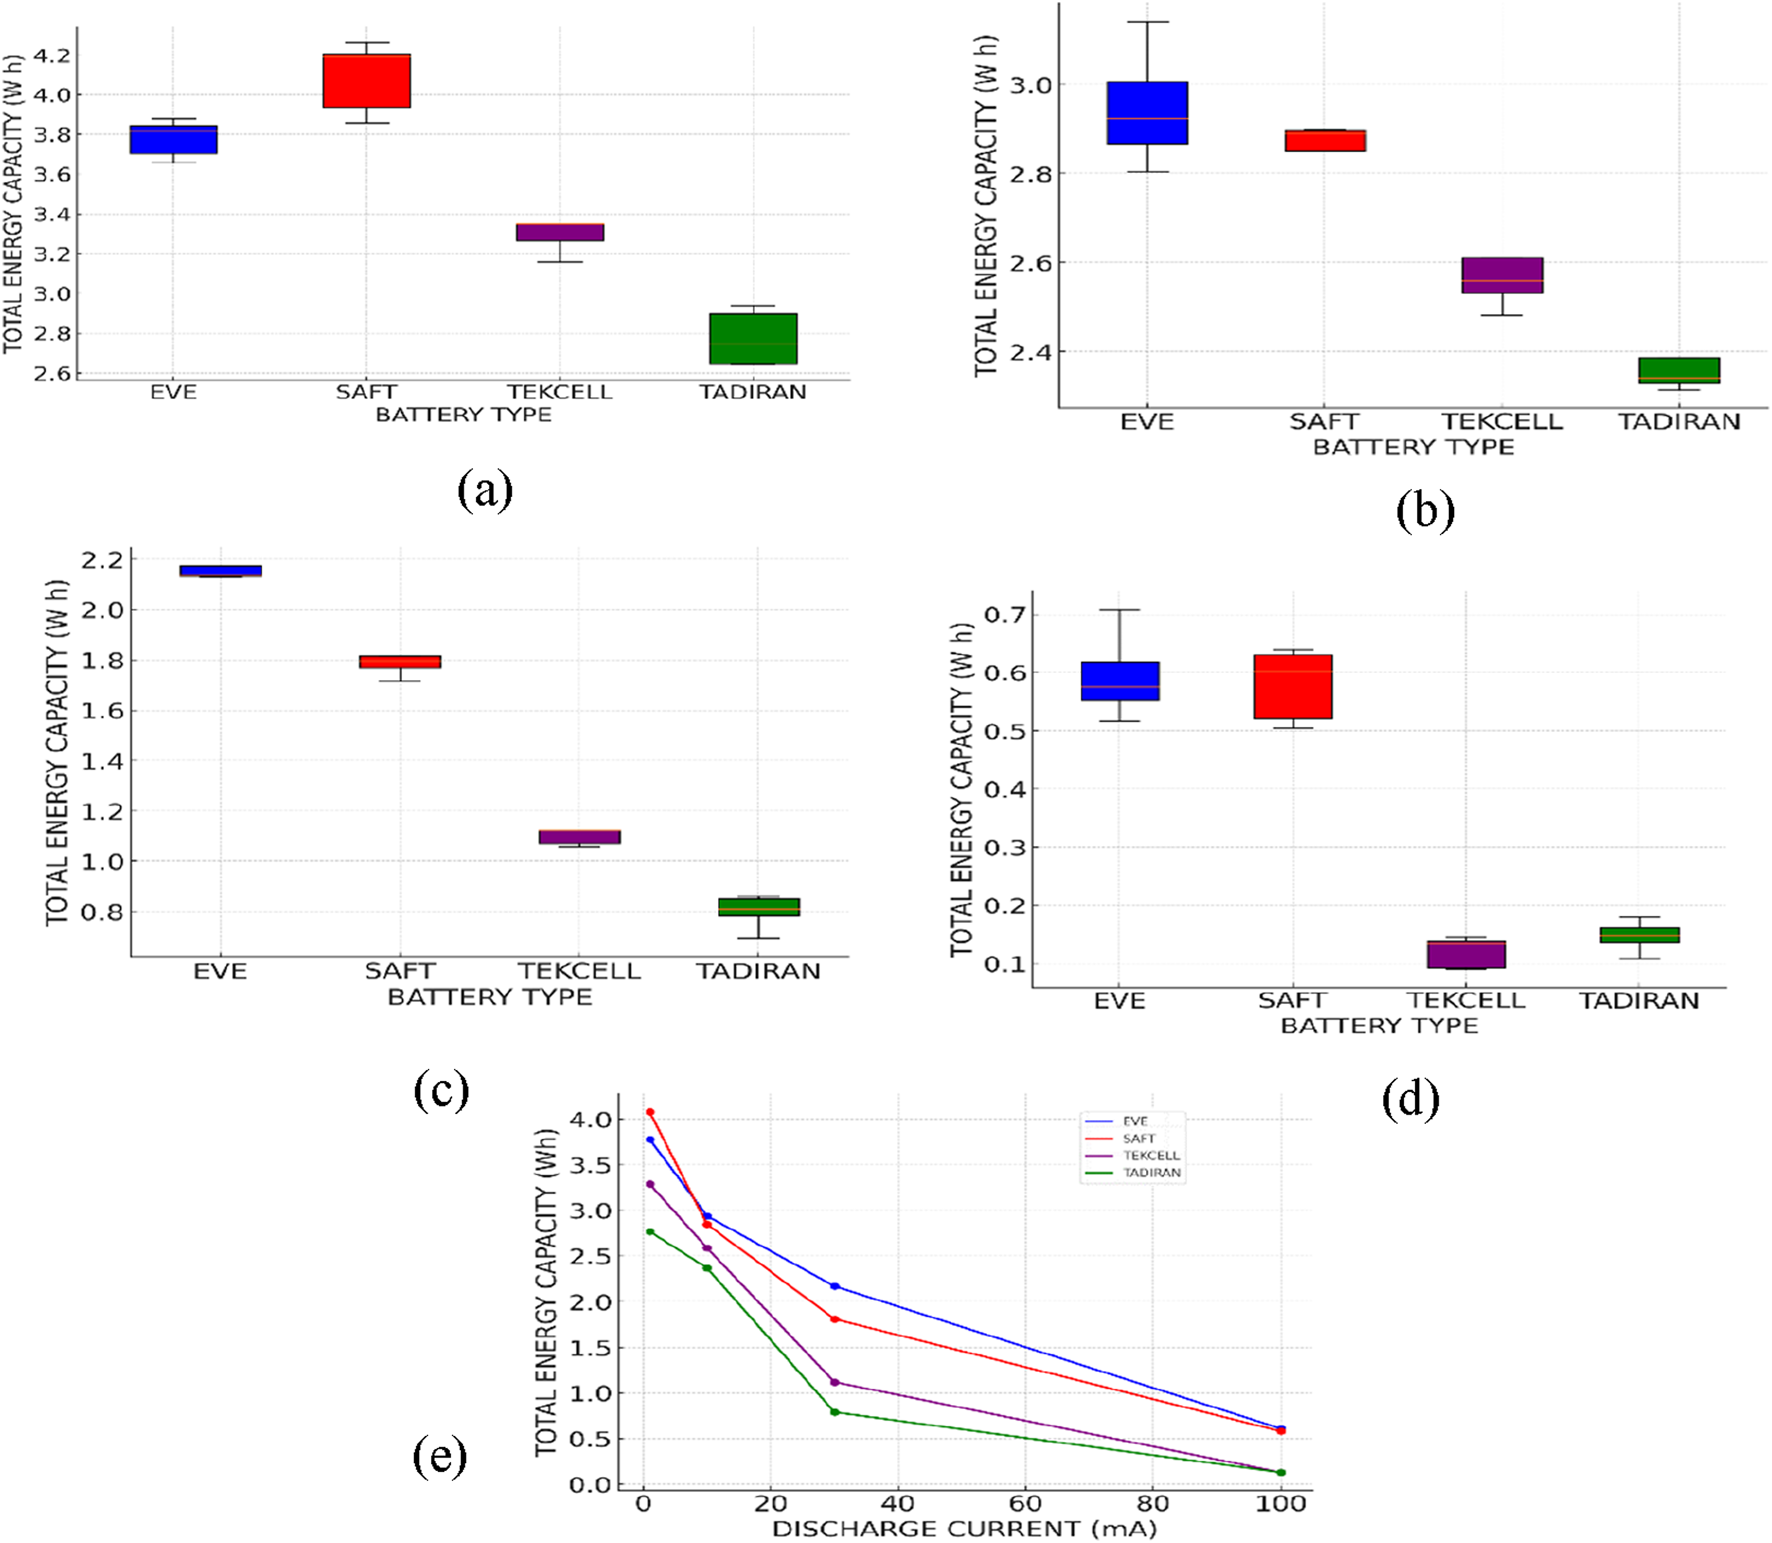
Box-whiskers plot for comparison of Total energy consumed for selected types of batteries (a) 1 mA (b) 10 mA (c) 30 mA and (d) 100 mA discharge current (e) Energy capacity verses discharge current.
1 mA discharge current
As seen in Figure 5a at discharge current of 1 mA, the Saft battery demonstrates the highest total energy capacity, averaging around 4.1 Wh, with minor variability. This suggests that it is the most efficient and long-lasting option under low-drain conditions. The EVE battery follows closely behind, with a slightly lower median energy capacity of 3.8 Wh, making it a strong alternative while maintaining relatively stable performance. TEKCELL, on the other hand, shows a noticeable drop in capacity, averaging around 3.3 Wh, which indicates a moderate performance level but still lower than Saft and EVE. Finally, TADIRAN performs the worst, with a median energy capacity of 2.8 Wh, highlighting its inefficiency compared to the other three. This suggests that for applications requiring prolonged energy output at low discharge currents, Saft is the best choice, followed by EVE, while TEKCELL and TADIRAN may not be ideal for long-duration usage.
10 mA discharge current
At a discharge current of 10 mA, the EVE battery continues to demonstrate the highest total energy capacity, averaging around 2.9 Wh, although it exhibits some variability, indicating fluctuations in performance, see Figure 5b. The Saft battery follows closely, with a slightly lower energy capacity of approximately 2.8 Wh, but it remains more stable due to its narrow boxplot range. TEKCELL, however, shows a significant drop, with its median energy capacity around 2.5 Wh, suggesting that its efficiency declines more notably under this higher discharge current. TADIRAN performs the worst, with an energy capacity just above 2.3 Wh, making it the least reliable option at 10 mA discharge.
30 mA discharge current
At a discharge current of 30 mA, the EVE battery maintains the highest total energy capacity, with a median value around 2.1 Wh. Unlike previous discharge currents, EVE shows minimal variability, indicating a stable performance even under higher loads, see Figure 5c. The Saft battery follows with a median energy capacity of approximately 1.8 Wh, showing a moderate decline but still performing significantly better than the other two options. TEKCELL experiences a major drop in energy capacity, with its median value at around 1.1 Wh, indicating that it struggles to maintain efficiency under such high discharge rates. TADIRAN once again, has the lowest energy capacity at just under 0.9 Wh.
100 mA discharge current
EVE and Saft are still leading the pack, but their capacities have dropped significantly as seen in Figure 5d. EVE holds on to the highest total energy capacity, hovering around 0.6 Wh, showing some variation but maintaining a decent performance. Saft follows closely, with a slightly lower but more stable capacity in the 0.55–0.65 Wh range. Meanwhile, TEKCELL and TADIRAN struggle at this current. TEKCELL barely holds above 0.1–0.2 Wh, showing that it quickly loses efficiency under high loads. Tadiran, though marginally better than TEKCELL, remains in the 0.15–0.2 Wh range.
Energy capacity verses discharge current
The graph in Figure 5e illustrates the relationship between discharge current and total energy capacity for all the battery brands. EVE and SAFT exhibit higher total energy retention across all discharge currents, with SAFT maintaining slightly better performance at lower currents. TEKCELL and TADIRAN show significant energy losses at higher currents, with TADIRAN performing the worst overall.
Statistical evaluation
Further statistical evaluation is conducted and summarized in Table 4 to help in understanding the different battery types exhibiting unique characteristics in terms of their energy capacity and stability under different loads. By analyzing the mean, standard deviation, sample variance, and other key statistical metrics, we can determine which battery is the most efficient and reliable.
TABLE 4
| EVE | SAFT | TEKCELL | TADIRAN | |||||||||||||||||
|---|---|---|---|---|---|---|---|---|---|---|---|---|---|---|---|---|---|---|---|---|
| Discharge current | 1 mA | 10 mA | 30 mA | 100 mA | Avg | 1 mA | 10 mA | 30 mA | 100 mA | Avg | 1 mA | 10 mA | 30 mA | 100 mA | Avg | 1 mA | 10 mA | 30 mA | 100 mA | Avg |
| Mean (Wh) | 3.78 | 2.94 | 2.17 | 0.61 | 2.38 | 4.08 | 2.85 | 1.81 | 0.58 | 2.33 | 3.29 | 2.59 | 1.12 | 0.13 | 1.78 | 2.77 | 2.37 | 0.79 | 0.13 | 1.52 |
| Standard error | 0.04 | 0.07 | 0.03 | 0.04 | 0.05 | 0.08 | 0.04 | 0.03 | 0.03 | 0.05 | 0.04 | 0.05 | 0.03 | 0.01 | 0.03 | 0.06 | 0.04 | 0.03 | 0.01 | 0.04 |
| Median (Wh) | 3.81 | 2.92 | 2.14 | 0.58 | 2.36 | 4.19 | 2.89 | 1.80 | 0.60 | 2.37 | 3.35 | 2.56 | 1.12 | 0.13 | 1.79 | 2.75 | 2.34 | 0.81 | 0.15 | 1.51 |
| Standard deviation (Wh) | 0.09 | 0.14 | 0.07 | 0.08 | 0.10 | 0.18 | 0.07 | 0.07 | 0.06 | 0.10 | 0.08 | 0.12 | 0.07 | 0.03 | 0.08 | 0.14 | 0.08 | 0.07 | 0.03 | 0.08 |
| Sample Variance (W2ℎ2) | 0.01 | 0.02 | 0.00 | 0.01 | 0.01 | 0.03 | 0.01 | 0.01 | 0.00 | 0.01 | 0.01 | 0.01 | 0.00 | 0.00 | 0.01 | 0.02 | 0.01 | 0.00 | 0.00 | 0.01 |
| Range % of Mean | 5.92 | 11.48 | 7.11 | 32.21 | 14.18 | 9.81 | 5.31 | 11.08 | 23.27 | 12.37 | 5.89 | 11.62 | 15.61 | 46.14 | 19.82 | 10.74 | 3.80 | 20.78 | 48.54 | 20.97 |
| Range (Wh) | 0.22 | 0.34 | 0.15 | 0.19 | 0.23 | 0.40 | 0.15 | 0.20 | 0.13 | 0.22 | 0.19 | 0.30 | 0.18 | 0.06 | 0.18 | 0.30 | 0.18 | 0.17 | 0.07 | 0.18 |
| Min (Wh) | 3.66 | 2.80 | 2.13 | 0.52 | 2.28 | 3.86 | 2.75 | 1.72 | 0.51 | 2.21 | 3.16 | 2.48 | 1.06 | 0.09 | 1.70 | 2.64 | 2.32 | 0.69 | 0.11 | 1.44 |
| Max (Wh) | 3.88 | 3.14 | 2.28 | 0.71 | 2.50 | 4.26 | 2.90 | 1.92 | 0.64 | 2.43 | 3.35 | 2.78 | 1.23 | 0.15 | 1.88 | 2.94 | 2.50 | 0.86 | 0.18 | 1.62 |
Evaluation of the battery types.
Mean energy capacity comparison
The mean energy capacity values highlight the overall efficiency of each battery. Overall, without considering a specific discharge current, in general EVE leads the rankings with an average capacity of 2.38 Wh, showing that it maintains higher efficiency across different current levels. Saft closely follows with a mean of 2.33 Wh, making it a competitive alternative. However, TEKCELL (1.78 Wh) and TADIRAN (1.52 Wh) show a noticeable drop, implying that these two batteries struggle under increasing discharge currents.
Median performance and stability
The median values indicate the middle point of energy capacity across all discharge currents. EVE has a median capacity of 2.36 Wh, confirming its steady performance. Saft’s median capacity is 2.37 Wh, aligning with its mean and proving its consistent behavior. TEKCELL (1.79 Wh) and TADIRAN (1.51 Wh) continue to show lower median values, demonstrating that their energy retention is weaker compared to EVE and Saft.
Performance consistency: standard deviation and variance
Saft and TADIRAN has the highest standard deviation (0.14 Wh), meaning it experiences the largest performance fluctuations. TEKCEL (0.08 Wh) and EVE (0.08 Wh) also show moderate fluctuations, but EVE remains more reliable due to its higher overall capacity. TEKCELL has the lowest variance, but this is due to its consistently poor performance rather than true stability. The high sample variance values in all batteries (ranging from 0 to 0.03 W2h2) indicate that energy capacity varies significantly as discharge current increases.
Efficiency relative to maximum capacity (mean percentage)
The range percentage of mean values varies significantly across different battery brands and discharge currents. For the EVE battery, the highest variation occurs at 100 mA (32.21%), while 1 mA (5.92%) and 30 mA (7.11%) exhibit lower fluctuations, resulting in an overall average range of 14.18%, indicating moderate stability. The SAFT battery shows its highest variation at 100 mA (23.27%), while 10 mA (5.31%) is the most stable, leading to an average range of 12.37%, which is slightly lower than EVE. The TEKCELL battery has its highest fluctuation at 100 mA (46.14%), suggesting instability under high discharge conditions, while 1 mA (5.89%) shows the least variation, with an overall average of 19.82%, indicating higher fluctuations compared to EVE and SAFT. Lastly, the TADIRAN battery exhibits the most significant variation at 100 mA (48.54%), the highest among all brands, while 10 mA (3.80%) is the most stable, resulting in an average range of 20.97%, highlighting substantial performance fluctuations.
Minimum and maximum values
Saft has the highest recorded peak capacity at 4.26 Wh, followed by EVE at 3.88 Wh. TEKCELL (3.35 Wh) and TADIRAN (2.96 Wh) fall short, confirming their weaker energy retention. At high discharge rates, TEKCELL and TADIRAN drop drastically to a minimum of 0.09 Wh and 0.11 Wh respectively, making them unreliable for high-drain applications.
Range of performance (difference between max and min)
EVE (0.23 Wh) has the widest range, indicating significant fluctuations across discharge currents. SAFT (0.22 Wh) is more stable while maintaining a high capacity. TEKCELL (0.18 Wh) and TADIRAN (0.18 Wh) also have wide ranges, but their low performance values make them unsuitable for consistent use.
Comparison of measured and estimated energy consumption
This analysis demonstrates that the experimental values often diverge considerably from the manufacturer’s stated values, indicating variations in performance under actual operating conditions as seen in Table 5. Total energy capacity is calculated for each curve from manufacturer data and is given by the following Equations 2, 3.
TABLE 5
| Sl. No | EVE | SAFT | TEKCELL | TADIRAN | ||||||
|---|---|---|---|---|---|---|---|---|---|---|
| Manufacturer Data |
Actual energy | Diff % | Manufacturer Data |
Actual energy | Diff % | Manufacturer Data |
Actual energy | Manufacturer Data |
Actual energy | |
| 1 | 3.8 Wh @ 1 mA | 3.78 Wh @ 1 mA | 0.53 | 4.27 Wh@ 1 mA | 4.08 Wh @1 mA | 4.44 | 4.07 Wh @ 2 mA |
3.29 Wh @1 mA | 3.91 Wh @ 2 mA | 2.77 Wh @1 mA |
| 2 | 2.90 Wh @ 10 mA | 2.94 Wh @10 mA | 1.38 | 3.11 Wh @ 9 mA | 2.85 Wh @10 mA | 3.55 Wh @ 8 mA | 2.59 Wh @10 mA | 2.84 Wh @ 8 mA | 2.37 Wh@10 mA | |
| 3 | - | 2.17 Wh @30 mA | 1.99 Wh @ 17 mA | 1.81 Wh @30 mA | 2.4 Wh @ 18 mA | 1.12 Wh @30 mA | 1.98 Wh @ 20 mA | 0.79 Wh@30 mA | ||
| 4 | - | 0.61 Wh @100 mA | - | - | 0.58 Wh@100 mA | - | - | 0.13 Wh@100 mA | - | 0.13 Wh@100 mA |
Comparison of estimated and measured energy consumption.
Since
Where V is the voltage at each time step and I is 0.1, 0.03, 0.010 and 0.001 A respectively, the total energy can be approximated numerically as shown in the Equation 4 given below.
Once the total energy is found, then the average is calculated among the batteries of the same type and is tabulated in the table given below.
Table 5 compares the four batteries at different discharge currents, evaluating their actual energy output and percentage difference from the manufacturer’s claimed values.
Performance at low discharge current (1 mA)
At 1 mA, the batteries operate close to their manufacturer’s rated capacity, with only slight deviations. EVE delivers 3.78 Wh against a claimed 3.8 Wh, showing a minor 0.53% deviation—making it highly efficient. Saft shows a larger deviation of 4.44%, producing 4.08 Wh instead of 4.27 Wh. TEKCELL drops significantly from its claimed 4.07 Wh to an actual 3.29 Wh, indicating a considerable performance gap. TADIRAN performs the worst, providing 2.77 Wh against a claimed 3.91 Wh, suggesting that it struggles even at low discharge rates.
Medium-low discharge current (10 mA) – first signs of degradation
At 10 mA, the energy capacity begins to decline across all batteries:
EVE performs slightly better than expected (2.94 Wh vs 2.90 Wh), showing a small 1.38% positive deviation. Saft sees a drop from 3.11 Wh to 2.85 Wh, indicating some early efficiency loss. TEKCELL again shows a major drop, from 3.55 Wh to 2.59 Wh, reinforcing its inefficiency at moderate loads. TADIRAN struggles with another steep decline from 2.84 Wh to 2.37 Wh, further confirming its lower energy retention.
Medium discharge current (30 mA) – significant drop in performance
At 30 mA, the efficiency loss becomes more pronounced. EVE provides 2.17 Wh, indicating that it retains a relatively higher energy output under moderate loads. Saft drops to 1.81 Wh, a substantial decrease from its manufacturer’s expected 1.99 Wh. TEKCELL shows 1.12 Wh @ 30 mA and the manufacturer value is expected at 2.4 Wh @ 18 mA. TADIRAN performs at just 0.79 Wh @ 30 mA while the rated value was 1.98 Wh @ 20 mA.
High discharge current (100 mA) – severe efficiency loss
At 100 mA, EVE still holds up relatively well at 0.61 Wh, showing that it can sustain high discharge rates better than competitors. Saft follows closely at 0.58 Wh, maintaining similar performance to EVE. TEKCELL and TADIRAN become completely inefficient, both dropping to 0.13 Wh, making them unsuitable for high-drain applications.
Discussion
The comparison of four leading LiSOCl2 battery brands—EVE, Saft, TEKCELL, and TADIRAN—reveals critical insights for optimizing power circuit design in sensor networks within smart building environments. Notably, we observed significant discrepancies between manufacturer specifications and actual performance under real-world conditions, particularly at varying discharge currents. These deviations directly impact the reliability and efficiency of energy budgeting, necessitating a shift toward empirically informed design choices for sustainable building automation systems.
Performance at Low Discharge Current (1 mA): At a discharge current of 1 mA, the batteries operate close to their manufacturer’s rated capacity, with only slight deviations. EVE delivers 3.78 Wh against a claimed 3.8 Wh, showing a minor 0.53% deviation—making it highly efficient. Saft shows a larger deviation of 4.44%, producing 4.08 Wh instead of 4.27 Wh. TEKCELL drops significantly from its claimed 4.07 Wh to an actual 3.29 Wh, indicating a considerable performance gap. TADIRAN performs the worst, providing 2.77 Wh against a claimed 3.91 Wh, suggesting that it struggles even at low discharge rates. This alignment, especially in the case of EVE, indicates that the methodologies employed by both the manufacturer and our research are highly consistent, validating the accuracy and reliability of our testing approach. The close match between empirical results and manufacturer specifications (Evemall, 2025) confirms that our experimental design effectively mirrors real-world operating conditions and manufacturer testing protocols.
Design Considerations for Minimizing Power Peaks: To reduce energy consumption and extend operational life, it is important to focus on minimizing power peaks (Lallart and Guyomar, 2008), (Kaushalya et al., 2024) and decoupling battery management circuit design from transient current surges (Zhang et al., 2017). By targeting the root causes of these peaks within the power circuit, engineers can mitigate the stress on batteries, thereby enhancing overall system stability and lifespan. This approach is particularly effective when combined with low-current duty-cycling schemes that maintain discharge levels below manufacturer testing thresholds.
Medium-Low Discharge Current (10 mA): At 10 mA, the energy capacity begins to decline across all batteries. EVE performs slightly better than expected (2.94 Wh vs 2.90 Wh), showing a small 1.38% positive deviation. Saft sees a drop from 3.11 Wh to 2.85 Wh, indicating some early efficiency loss. TEKCELL again shows a major drop, from 3.55 Wh to 2.59 Wh, reinforcing its inefficiency at moderate loads. TADIRAN struggles with another steep decline from 2.84 Wh to 2.37 Wh, further confirming its lower energy retention. These observations highlight the importance of designing power circuits that can handle moderate loads efficiently, as even slight increases in discharge current can lead to noticeable capacity reductions.
Informed Battery Selection and Power Management Architecture: The observed variances in discharge capacity across different brands and current levels provide a robust dataset for guiding battery selection tailored to specific application needs. For ultra-low-power scenarios typical in smart buildings (Bhat and Sudharshana, 2024), such as occupancy detection and indoor air quality monitoring (Bhaskar et al., 2025), selecting batteries with strong performance at sub-milliampere discharge currents is essential. This selection process supports the development of robust power management architectures (Zhang et al., 2017) that go beyond idealized assumptions, offering real-world reliability.
Medium Discharge Current (30 mA): At 30 mA, the efficiency loss becomes more pronounced. EVE provides 2.17 Wh, indicating that it retains a relatively higher energy output under moderate loads. Saft drops to 1.81 Wh, a substantial decrease from its manufacturer’s expected 1.99 Wh. TEKCELL shows 1.12 Wh at 30 mA, with the manufacturer value expected at 2.4 Wh at 18 mA. TADIRAN performs at just 0.79 Wh at 30 mA, while the rated value was 1.98 Wh at 20 mA. These findings highlight the necessity for engineers to consider the specific discharge profiles of batteries when designing power management systems (Niharika, 2025), ensuring that the selected batteries can sustain the required loads without significant efficiency losses.
Integration with Energy Harvesting Systems: The superior low-current performance of specific LiSOCl2 brands positions them as ideal components in hybrid energy systems (Malele et al., 2025), where primary batteries are supplemented by ambient energy sources such as light, vibration, or thermal gradients. In such configurations, these batteries act as reliable energy reservoirs during periods when harvesting conditions are unfavorable.
High Discharge Current (100 mA): At 100 mA, EVE still holds up relatively well at 0.61 Wh, showing that it can sustain high discharge rates better than competitors. Saft follows closely at 0.58 Wh, maintaining similar performance to EVE. TEKCELL and TADIRAN become completely inefficient, both dropping to 0.13 Wh, making them unsuitable for high-drain applications. This data is crucial for designing circuits capable of dynamically adjusting sampling rates and transmission intervals based on real-time energy availability, which is vital for predictive energy management strategies that extend network lifetime without compromising data quality.
Advancing Sustainable Building Design: The deployment of maintenance-free, long-lasting power sources within sensor networks aligns directly with the principles of sustainable building design. By enabling sensor nodes to operate autonomously for decades, our approach reduces both material waste and the operational burden of maintenance—particularly in hard-to-access infrastructure locations. These sensor systems enable real-time adaptive control of HVAC, lighting, and other building systems, resulting in measurable reductions in energy usage.
Conclusion
The paper provides a comprehensive comparative study of Lithium thionyl chloride (LiSOCl2) batteries under controlled discharge conditions (1 mA, 10 mA, 30 mA, and 100 mA). The results presented from the tests show big differences among the batteries from different manufacturers, which would result in different service life if inbuilt in the same IoT device. Also, in the case of TEKCELL and TADIRAN batteries the tests show difference between manufacturers datasheet values and real discharging curves in terms of overall energy.
When comparing measured vs manufacturer data, across all currents, there are noticeable deviations between manufacturer-specified values and experimental results. SAFT and EVE maintain closer alignment with rated capacities, while TEKCELL and TADIRAN show significant discrepancies. TADIRAN consistently exhibits the lowest total energy consumption, with greater variation at lower currents. This aligns with the manufacturer’s specification, which states that TADIRAN has a lower total energy capacity of just 1.1 Ah compared to other batteries that have 1.2 Ah.
In the statistical evaluation EVE leads in terms of mean energy capacity (2.38 Wh), followed by SAFT (2.33 Wh). SAFT has the highest standard deviation (1.49 Wh), indicating more variability in performance. TEKCELL and TADIRAN exhibit lower efficiency and higher energy dissipation under load. The results underscore that SAFT and EVE are superior choices for high-drain applications, while TEKCELL and TADIRAN may be more suitable for low-drain, intermittent use.
Our findings directly support the development of smarter energy storage strategies and improved energy management design in the following ways:
• Informed Battery Selection: By empirically comparing four leading LiSOCl2 battery brands under controlled conditions, we provide actionable data for selecting batteries that deliver optimal performance and longevity in real-world smart building applications.
• Enhanced Energy Modeling: The comparison between measured and manufacturer-stated energy capacities at various discharge currents enables more accurate energy budgeting and lifetime prediction for battery-powered sensor networks.
• Optimized Power Management: The observed degradation and efficiency trends at different loads inform the design of power management architectures that maximize sensor uptime and minimize maintenance.
• Support for Scalable, Reliable Systems: These insights facilitate the deployment of large-scale, maintenance-free sensor networks, directly contributing to energy-aware building operation and improved indoor environmental quality.
• These findings highlight potential reliability concerns in manufacturer claims, highlighting the importance of independent experimental verification for energy storage applications.
• The methodologies employed by both the manufacturer and our research are highly consistent, validating the accuracy and reliability of our testing approach. The close match between results and manufacturer specifications confirms that our experimental design effectively mirrors real-world operating conditions and manufacturer testing protocols.
• Some deviations observed between manufacturers and the experimental results could be attributed to variations in discharge conditions, aging effects, or slight differences in measurement methodologies., Further research into the standardization of energy rating methodologies is recommended to ensure consumers and industries make informed decisions when selecting battery technologies.
Statements
Data availability statement
The original contributions presented in the study are included in the article/supplementary material, further inquiries can be directed to the corresponding author.
Author contributions
CR: Writing – review and editing, Visualization, Writing – original draft, Formal Analysis, Validation. JnV: Supervision, Writing – review and editing, Funding acquisition, Project administration. MF: Resources, Writing – review and editing, Methodology, Investigation. JkV: Validation, Writing – review and editing, Data curation, Software. VM: Writing – review and editing, Supervision.
Funding
The author(s) declare that financial support was received for the research and/or publication of this article. This work is part of the project “Advanced design methods for key elements of multi-storey timber buildings”, LUC23080, supported by the Ministry of Education, Youth and Sports of the Czech Republic, through the program INTER-EXCELLENCE II.
Conflict of interest
The authors declare that the research was conducted in the absence of any commercial or financial relationships that could be construed as a potential conflict of interest.
Generative AI statement
The author(s) declare that no Generative AI was used in the creation of this manuscript.
Publisher’s note
All claims expressed in this article are solely those of the authors and do not necessarily represent those of their affiliated organizations, or those of the publisher, the editors and the reviewers. Any product that may be evaluated in this article, or claim that may be made by its manufacturer, is not guaranteed or endorsed by the publisher.
References
1
Ave M. (2001). Understanding the passivation effect. 125e Suite, and L. Success.
2
Bhaskar P. Mahendra Chingale V. (2025). A review on power management techniques prof. PC bhaskar. Available online at: https://sahridya.com/wp-content/uploads/2024/09/4-SJ-3.pdf (Accessed: June 15, 2025).
3
Bhat S. Sudharshana (2024). “Battery management system for electrical devices: a review,” in 2024 5th International Conference on Image Processing and Capsule Networks (ICIPCN), Dhulikhel, Nepal, 03-04 July 2024, 881–886.
4
Bryzgalov A. A. Soloboev S. V. Kozlov A. S. Zykov A. A. (2013). Method of determining the remaining life of A primary lithium-thionyl chloride battery.
5
DTIC (1991). A review of the calcium thionyl chloride electrochemical system. Available online at: https://apps.dtic.mil/sti/citations/ADA261321 (Accessed: August 22, 2024).
6
Evemall (2025). EVE ER14250 lithium 3.6V disposable Li - SOCl2 battery - EVE energy. Available online at: https://www.evemall.eu/goods/ER14250-1 (Accessed March 05, 2025).
7
Gabano J. (1980). Lithium passivation in liquid cathode battery systems. Available online at: https://books.google.com/books?hl=en&lr=&id=iRltAAAAIAAJ&oi=fnd&pg=PA98&dq=Passivation+for+liquid+cathode+systems+such+as+lithium+thionyl+chloride+&ots=h-j4awZTH-&sig=KDvcB1YgFtgGAO_p-1UBpLAUN1Q (Accessed: August 22, 2024).
8
Google Scholar (2024). bobbin-type cells have less surface area to maximize. Available online at: https://scholar.google.com/scholar?hl=en&as_sdt=0%2C5&q=bobbin-type+cells+have+less+surface+area+to+maximize+the+passivation+effect&btnG= (Accessed August 22, 2024).
9
Google Scholar (2025). Thionyl chloride battery. Available online at: https://scholar.google.com/scholar?hl=en&as_sdt=0%2C5&as_ylo=2024&as_rr=1&q=thionyl+chloride+battery&btnG= (Accessed June 11, 2025).
10
Gu X. Hemour S. Wu K. (2020). “Wireless powered sensors for battery-free IoT through multi-stage rectifier,” in Proc. 33rd Gen. Assem. Sci. Symp. Int. Union Radio Sci., Rome, Italy, 29 August 2020 - 05 September 2020, 1–4.
11
Guida D. Stavola A. Chuang A. C. Okasinski J. S. Wendling M. T. Chadderdon X. H. et al (2023). Methods for tomographic segmentation in pseudo-cylindrical coordinates for bobbin-type batteries. ACS Meas. Sci. Au3, 344–354. 10.1021/acsmeasuresciau.3c00015
12
Hagedorn J. (2020). How to extend operating time of a LiSOCl 2 powered system. Available online at: https://www.ti.com/lit.
13
Horn Q. Shao-Horn Y. (2003). Morphology and spatial distribution of ZnO formed in discharged alkaline Zn/MnO[sub 2] AA cells. J. Electrochem. Soc.150, A652. 10.1149/1.1566014
14
International Energy Agency (2024). Batteries and secure energy transitions. Available online at: https://www.iea.org/reports/batteries-and-secure-energy-transitions.
15
Islam T. Mukhopadhyay S. C. Suryadevara N. K. (2016). Smart sensors and internet of things: a postgraduate paper. IEEE Sensors J.17, 577–584. 10.1109/JSEN.2016.2630124
16
Jain M. (1998). Analysis of lithium/thionyl chloride batteries. Available online at: https://search.proquest.com/openview/919aa13725c0c5d7846d8bce791fcad5/1?pq-origsite=gscholar&cbl=18750&diss=y (Accessed August 22, 2024).
17
Jamshed M. Ali K. Abbasi Q. Imran M. A. Ur-Rehman M. (2022). Challenges, applications, and future of wireless sensors in Internet of Things: a review. IEEE Sensors J.22, 5482–5494. 10.1109/JSEN.2022.3148128
18
Jauch (2024). Passivation of lithium thionyl chloride batteries – jauch blog. Available online at: https://www.jauch.com/blog/en/passivation-lithium-thionyl-chloride-batteries/(Accessed August 21, 2024).
19
Katırcı G. Civan F. E. Zabara M. A. Ülgüt B. (2024). Observing the effect of architecture on spiral and bobbin lithium thionyl chloride (Li/SOCl2) batteries with temperature-dependent electrochemical impedance spectroscopy (EIS). J. Electrochem. Soc.171, 070509. 10.1149/1945-7111/ad5d20
20
Kaushalya T. Littow M. Virta E. Ruotsalainen T. Juuti J. Bai Y. (2024). A system-level study of indoor light energy harvesting integrating commercially available power management circuitry. Energy Harvest. Syst.11 (1). 10.1515/ehs-2023-0164
21
Lallart M. Guyomar D. (2008). An optimized self-powered switching circuit for non-linear energy harvesting with low voltage output. Smart Mater Struct.17 (3), 035030. 10.1088/0964-1726/17/3/035030
22
Malele R. Mendu B. Monchusi B. B. (2025). Microcontroller-driven battery management in hybrid energy systems: a systematic review of applications, control strategies, and emerging trends. IEEE Access13, 29341–29360. 10.1109/ACCESS.2025.3539929
23
Miles M. H. (1997). “The effect of passivating films involving the lithium anode in thionyl chloride, bromine trifluoride, molten nitrates and molten perchlorates,” in IECEC-97 Proceedings of the Thirty-Second Intersociety Energy Conversion Engineering Conference (Cat. No.97CH6203), Honolulu, HI, USA, 27 July 1997 - 01 August 1997.
24
Morrison M. Marincic N. (1993). Studies in lithium oxyhalide cells for downhole instrumentation use of lithium tetrachlorogallate electrolyte in Li/SOCl2 cells. J. Power Sources45, 343–352. 10.1016/0378-7753(93)80023-I
25
Niharika P. (2025). Examination of current developments in ev battery power management techniques. Available online at: https://search.ebscohost.com/login.aspx?direct=true&profile=ehost&scope=site&authtype=crawler&jrnl=23217499&AN=185456771&h=937TY9R%2BEjwzVpwNZp9O5pDt96G6DcovHjBQBXwif55cMGDcMbeMO6nUYESxYaVn2BVZnF11NAeHUpCgrenahA%3D%3D&crl=c (Accessed: June 15, 2025).
26
Ramadass P. Haran B. Gomadam P. White R. Popov B. (2004). Development of first principles capacity fade model for li-ion cells. J. Electrochem. Soc.151 (2), A196–A203. 10.1149/1.1634273
27
Roth S. Wesolowski D. Schrock D. Schorr N. Chabi S. (2025). Estimating the state of charge in lithium primary batteries: recent advances and critical insights. Adv. Energy Sustain. Res.6. 10.1002/aesr.202400407
28
Saft4U (2025). LS, LSH, LSP. Available online at: https://saft4u.saft.com/en/product/ls-lsh-lsp (Accessed March 05, 2025).
29
Saunders T. (1998). The performance evaluation of lithium thionyl chloride batteries for long-life meter applications. Available online at: https://repository.lboro.ac.uk/articles/thesis/The_performance_evaluation_of_lithium_thionyl_chloride_batteries_for_long-life_meter_applications/9397106 (Accessed: August 22, 2024).
30
Schlaikjer C. R. (1985). Liquid cathode primary batteries. J. Power Sources14, 111–122. 10.1016/0378-7753(85)88020-4
31
Stern A. (2021). Revolutionize remote wireless monitoring: with AI and high-energy lithium batteries. Available online at: https://go.gale.com/ps/i.do?id=GALE%7CA678667556&sid=googleScholar&v=2.1&it=r&linkaccess=abs&issn=00134872&p=AONE&sw=w (Accessed: August 22, 2024).
32
Sun Q. Ye X. Li H. Li W. Yuan R. Zhai G. (2021). “Life prediction of lithium thionyl chloride battery based on pulse load test and accelerated degradation test,” in Proceedings - 2021 3rd international conference on system reliability and safety engineering, SRSE 2021 (Harbin, China: Institute of Electrical and Electronics Engineers Inc.), 174–180. 10.1109/SRSE54209.2021.00037
33
T. Batteries GmbH (2025). Tadiran lithium batteries product data catalogue. Available online at: www.tadiranbatteries.de (Accessed March 13, 2025).
34
T. Batteries GmbH (2025). Tadiran lithium batteries technical brochure LTC-batteries.
35
Vitzrocell (2025). SB-AA02. Available online at: https://vitzrocell.ru/images/dsh_Tekcell/SB-AA02-EN.pdf (Accessed March 13, 2025).
36
Wang S. Hou X. Wang Y. Chen Y. Xu D. Liu C. et al (2023). Design and validation of lifetime prediction model for lithium-thiocarbonyl chloride batteries based on accelerated aging experiments. Met. (Basel)13 (9), 1579. 10.3390/met13091579
37
Weaver B. P. Meeker W. Q. (2014). Methods for planning repeated measures accelerated degradation tests. Appl. Stoch. Models Bus. Ind.30, 658–671. 10.1002/asmb.2061
38
Wei H. Dietrich D. L. (2005). An alternative degradation reliability modeling approach using maximum likelihood estimation. IEEE Trans. Reliab.54 (2), 310–317. 10.1109/tr.2005.845965
39
Whitmore G. A. (1995). Estimating degradation by a wiener diffusion process subject to measurement error. Lifetime Data Anal.1, 307–319. 10.1007/bf00985762
40
Zabara M. Göçmez H. Karabatak A. Ulgut B. (2021). Characterization of different electrolyte composition lithium thionyl chloride reserve battery by electrochemical impedance spectroscopy. J. Electrochem. Soc.168, 050529. 10.1149/1945-7111/abff61
41
Zabara M. Ulgut B. (2020). Electrochemical impedance spectroscopy based voltage modeling of lithium thionyl chloride (Li∖SOCl2) primary battery at arbitrary discharge. Electrochimica Acta334, 135584. 10.1016/j.electacta.2019.135584
42
Zhang A. Song S. Wang C. Zhang J. Wang K. Li L. (2017). “Research of battery management system for integrated power supply,” in 2017 Chinese Automation Congress (CAC), Jinan, China, 20-22 October 2017, 3178–3181.
Summary
Keywords
LiSOCl2, battery discharge performance, power circuit design, empirical battery evaluation, smart building sensor network, sustainable battery for IoT devices
Citation
Ravikumar C, Vcelak J, Faltus M, Vanek J and Markevičius V (2025) Optimizing power sources for smart building sensors: a comparative study of LiSOCL2 batteries under controlled discharge profiles. Front. Built Environ. 11:1607382. doi: 10.3389/fbuil.2025.1607382
Received
07 April 2025
Accepted
01 July 2025
Published
15 July 2025
Volume
11 - 2025
Edited by
Wei-Wei Wang, Yangtze University, China
Reviewed by
Roberto Alonso González-Lezcano, CEU San Pablo University, Spain
Haowei Yao, Zhengzhou University of Light Industry, China
Updates
Copyright
© 2025 Ravikumar, Vcelak, Faltus, Vanek and Markevičius.
This is an open-access article distributed under the terms of the Creative Commons Attribution License (CC BY). The use, distribution or reproduction in other forums is permitted, provided the original author(s) and the copyright owner(s) are credited and that the original publication in this journal is cited, in accordance with accepted academic practice. No use, distribution or reproduction is permitted which does not comply with these terms.
*Correspondence: Chandana Ravikumar, chandana.ravikumar@cvut.cz
Disclaimer
All claims expressed in this article are solely those of the authors and do not necessarily represent those of their affiliated organizations, or those of the publisher, the editors and the reviewers. Any product that may be evaluated in this article or claim that may be made by its manufacturer is not guaranteed or endorsed by the publisher.