 Johannes Tiefenthaler
 Marco Mazzotti*
- Separation Processes Laboratory, Department of Mechanical and Process Engineering, Institute of Energy and Process Engineering, ETH Zurich, Zurich, Switzerland
To stop global warming well below 2°C, a rapid decarbonization of our economy, including the industrial sector is required—reaching net-zero GHG emissions in 2050. CO2 mineralization processes, capturing CO2 from industrial point sources and trapping it as carbonate minerals, have the potential to store climate-relevant amounts of CO2. To get there, the potential processes have to be designed and developed, with the help of a process model that can support the process scale-up and optimization. In this work, a process model describing a gas-liquid-solid continuous cristallizer for CO2 absorption into an aqueous ammonium nitrate solution and CaCO3 precipitation has been developed. It consists of the relevant material balances, of a speciation model, and a population balance equation. While several of the model parameters can be obtained from the literature, a few have been estimated by fitting a comprehensive set of experimental data presented earlier. In particular, the process quantities used for parameter estimation are the CO2 mass transfer rate, the calcium carbonate crystallization rate, and the average particle size of the CaCO3 product crystals. The accuracy of the model, particularly in reproducing mass transfer rates and average particle sizes, has been assessed. Interestingly, it has been shown that the dominating mechanism for crystal formation is primary rather than secondary nucleation. The validated model has been used to explore the effect of the different operating conditions on various key performance indicators so as to gain a deeper insight into the process performance and potential. It has been shown that the CO2 absorption efficiency is mainly affected by the feed stoichiometry and the gas feed rate, whereas the CO2 capture and precipitation efficiency are controlled by the liquid phase composition and the residence time; increasing the calcium concentration in the feed is obviously one way to improve the efficiency. Moreover, we could show that the particle size tends to increase with calcium concentration and to decrease with liquid feed rate and supersaturation of the solution.
1 Introduction
Climate change is a major threat since it sets at risk both ecosystems directly (through global warming, sea level rise, loss of biodiversity…) and human society indirectly (through health effects, socio-economic impact, geo-political instability…) (IPCC, 2019). There is scientific evidence (IPCC, 2014) and political agreement (Nations, 2015) that climate change is caused by the accumulation of green house gases (GHG) in the atmosphere, caused by the human activities that involve the use of fossil carbon for energy generation and the release of geogenic carbon for construction materials. Hence, GHG emissions are generated across all sectors, and the related activities have been increasing the level of GHG present in the atmosphere, biosphere and oceans continuously since the industrial revolution.
Climate action requires a collaborative effort of all entities, both individuals and collectives, that cause CO2 emissions, since local emissions have global impacts. In Paris, this collaborative strategy was framed into an agreement (Nations, 2015), with the aim to stop global warming well below 2°C. This aim implies the reduction of GHG emissions to net-zero; the economy has to undergo a rapid and complete decarbonisation in the years until 2050 (IPCC, 2018).
CO2 is the GHG responsible for 80% of global warming (Janssens-Maenhout et al., 2017) and 20% of its total emissions are caused by the industry (IPCC, 2018). Such CO2 emissions are often inherent to the manufacturing process—and therefore hard to avoid with conventional technologies. Moreover, they produce indispensable goods like cement, steel and chemicals. CO2 capture, transportation, and storage (CCS) is a system of technologies, or in others words a value chain, that is designed to decarbonize industrial processes that represent large CO2 point sources (IPCC, 2005). For the three main steps of the value chain, i.e., CO2 capture, transportation and storage, solutions proven over many years are commercially available. The first full scale CCS chain started its operation in 1996 in Sleipner, Norway, where about 1 Mt of CO2 per year have been captured and stored in deep saline aquifers ever since (Furre et al., 2017).
Despite the technology has been proven to operate in a robust and safe manner and the urgent need to decarbonize emission intensive industrial processes such as cement and steel manufacturing, progress in implementing CCS has been less than expected (Institute, 2019).
Implementing CCS value chains is complex, since it requires the development of policies, business models, CO2 capture and transport infrastructure, as well as storage hubs, social acceptance, and all these elements in parallel. Thus, many stakeholders need to take a significant share of the risk—while their success is endangered if only a single element in the chain faces problems. At the same time, one element not being ready makes the chain incomplete and impossible to operate. This risk, coupled with political and business-related uncertainties delays investment decisions, which would affect the companies business model for twenty and more years to come.
As a result, the main hindering aspect of CCS is a missing business case for most locations. Unlike other technologies, CCS only avoids CO2 emissions and does not generate any other associated value in today’s market, with the exception of enhanced oil recovery, which is however in contrast not climate positive; in fact after oil is produced and utilized a larger amount of CO2 is emitted than it is ultimately stored in the depleted reservoir. Therefore, the emission avoidance approach based on CCS does not translate into economic value as long as there is no credible carbon policy in place (Durmaz, 2018; Gardarsdottir et al., 2019).
Utilizing CO2 to manufacture added value products can generate this required economic value. To qualify as a climate change mitigation technology, the CO2 has to be stored for a long period of time, unless it comes either directly or indirectly (e.g. via biomass growth followed by combustion) from the atmosphere. Thus, long lived products can offer the benefit of permanent storage. However, critics argue, that the scale at which CCS deployment is required is orders of magnitudes larger than the storage potential in such products. Therefore, CO2 capture, and utilization (CCU) might be more of a distraction rather than a viable option to mitigate climate change (Mac Dowell et al., 2017). This holds especially true for energy intensive CCU processes, e.g., the production of synthetic fuels, which require large amounts of carbon-free electricity (Abanades et al., 2017; Sutter et al., 2019; Becattini et al., 2021).
In the construction sector, CCU is especially promising, because climate relevant amounts of CO2 can be stored permanently as carbonate minerals (Initiative, 2016). Furthermore, carbonate minerals are the thermodynamically most stable form of CO2, hence the reaction of CO2 to carbonate minerals is exothermic and thus generates energy instead of consuming it. Scientists have identified significant potential for CCU in the cement sector; the resulting minerals do not only store CO2, but they can partially replace an energy and emission intensive material, i.e., clinker (Ostovari et al., 2020; Tiefenthaler, 2021).
Among the most abundant minerals used in industrial applications is calcium carbonate. Clinker and cement (Anantharaman and David, 2017), concrete (IEA, 2018), iron and steel making, pulp and paper and fillers for daily home care products require large amounts of it.
Conventionally, calcium carbonate is extracted in quarries, ground, used and incinerated or recycled (e.g., concrete recycling). Applications, which require specific properties with respect to purity, particle size and morphology use precipitated calcium carbonate (PCC), which is manufactured by calcining limestone and then re-carbonating it and precipitating it again (Mattila et al., 2014).
We envision, that PCC will in the future be produced in a GHG neutral manner. One pathway is the substitution of the calcium source limestone with industrial mineral wastes, such as slags, ashes and demolition concrete. This can mitigate feedstock related emissions. If used for construction materials, PCC can become a carbon sink. Else, if used in products, it is usually incinerated and thus can become in the best case carbon neutral. Plenty of research has been conducted in this space to develop viable processes (Sanna et al., 2014). Most promising are pH swing technologies operating with an aqueous solvent containing an ammonia salt (Mattila and Zevenhoven, 2014a). In step one, calcium is extracted from the mineral waste stream, the solid residue material is removed by filtration. In step two, the calcium rich aqueous solution is carbonated with gaseous CO2, and PCC precipitates.
Plenty of experimental work in batch and continuous mode (Mattila and Zevenhoven, 2014b; Tiefenthaler and Mazzotti, 2021) has been conducted. To the best knowledge of the authors, comprehensive models for mineral carbonation processes, which consider the kinetics of CO2 absorption and of PCC precipitation are rare. Vučak (2002) provides a detailed model; however, their solvent system is considerably different than the one used here (monoethanolamine instead of an ammonium salt).
This work presents for the first time a kinetic model for CO2 absorption into an aqueous ammonium nitrate solution, where calcium ions are present, and the ensuing precipitation of calcium carbonate, in a continuous reactive crystallization configuration. In practical applications of this process, the aforementioned solution would be prepared by contacting an ammonium nitrate solution (prepared ad hoc) with industrial mineral wastes, such as slags, ashes, and demolition concrete. The acid character of the ammonium nitrate solution enables the leaching of calcium ions from the mineral wastes. In the context of the overall process (not discussed here), the ammonium nitrate solution is recycled in a closed loop within the process itself. The relevant kinetic parameters of the system are estimated making use of experimental results obtained in a previous study (Tiefenthaler and Mazzotti, 2021).
This type of models are necessary to understand the system and to design, optimize and scale-up a process for the precipitation of PCC from waste materials. First, the thermodynamics of the system is described, upon which the kinetic model of the process is built. Afterwards, a number of empirical kinetic parameters are estimated based on experimental results, and the accuracy of the model is assessed. Finally, the model is used to gain new insights, going beyond the experimental learnings, which are presented and discussed in the Section 4.
2 Thermodynamic Modeling
The system investigated is a crystallizer that acts as carbonation reactor and consists of a gas, a liquid and a solid phase. The gas phase contains N2, CO2 and moisture [NH3 volatility at such temperatures and pH conditions can be neglected (Said et al., 2016)]; the liquid phase is an aqueous ammonium nitrate solution rich in calcium, in which CO2 absorbs and speciates; finally the solid phase consists of the mineral CaCO3 only under the conditions explored here.
A CO2 molecule enters the system through the inlet gas stream; it is first absorbed by the aqueous solution, then it undergoes speciation reactions to form amongst others the CO32− ion, which either precipitates with a Ca2+ ion to form the solid CaCO3 or exits from the reactor as ion dissolved i within the mother liquor. The physical and chemical equilibria relevant for this system are as follows (Thomsen and Rasmussen, 1999; Vu č ak, 2002; Wolery, 2002; Puxty et al., 2010):
2.1 Vapor-Liquid Equilibrium
2.2 Liquid Speciation
2.3 Solid-Liquid Equilibrium
The geochemical equilibrium package EQ3/6 was used to identify the relevant speciation reactions; reactions which result in ionic species at very low concentrations have been neglected.
The following assumptions have been made:
• N2 is assumed to be insoluble, and thus it does not absorb in the aqueous solution.
• The liquid water is in equilibrium with the water vapor in the gas phase.
• NH3 is assumed to be non-volatile, since the absorption of CO2 shifts the equilibrium towards NH4+. This assumption has been tested in independent experiments which confirmed that ammonia is below the detection limit, which is in line with literature (Said et al., 2016).
• The gas and liquid phase are well mixed, i.e., both phases and its relevant intensive properties, i.e., temperature, pressure, and composition, are homogeneous in the reactor.
• CO2 is not at equilibrium between gas and solution hence its absorption is mass transfer limited and can be described by the two film theory.
• The reaction of CO2,aq with NH3 in the liquid film is considered as the rate determining step of CO2 uptake. Consequently, all reactions in the aqueous solution can be considered to be instantaneous hence at equilibrium (Puxty et al., 2010). Moreover, evaluating the Hatta number for various operating conditions confirmed, that the reaction of CO2,aq with NH3 is in the pseudo-first-order and fast reaction regime while the reaction of CO2,aq with OH− lies in the very-slow to slow reaction regime. Since both occur in parallel, the reaction with NH3 is rate determining.
• The precipitation of CaCO3 is not instantaneous hence it is governed by the principles of crystallization, whereby the amount of solid mass and the crystal size distribution are controlled by the interplay between nucleation and growth, whose rates depend on the relevant driving force (agglomeration of primary particles and crystal breakage are neglected for the sake of simplicity) (Davey, 2000; Wolthers et al., 2012).
• In this work we assume representative product removal, namely that the particle size distribution of the suspension withdrawn is the same as that of the suspension in the crystallizer. We believe that this is a reasonable assumption considering that the experiments on which this modeling work is based (Tiefenthaler and Mazzotti, 2021) yielded very small particles that should yield a homogeneous suspension. A study of this particular aspect should be considered in follow up studies.
2.4 Modelling of the Liquid Speciation
The reactions in the bulk liquid (Eqs 2-3–2-11) are considered to be instantaneous hence they can be assumed to be at equilibrium. The corresponding chemical equilibrium conditions must be fulfilled, which can be written as:
In addition, the electro neutrality condition has to be met:
where the sum extends on all the ionic (charged) species and
The system of equilibrium reactions is solved by making use of the geochemical equilibrium software package EQ3/6, v8.0a (Wolery, 2002). EQ3/6 is a software package for modeling geochemical interactions between aqueous solutions, solids, and gases, following principles of chemical thermodynamics and chemical kinetics, which is maintained and kept updated at the Lawrence Livermore National Laboratory1, and has been used in earlier mineral carbonation studies (Hariharan and Mazzotti, 2017a; Hariharan and Mazzotti, 2017b; Hariharan et al., 2016; Hariharan, 2017; Werner et al., 2014a; Werner et al., 2014b). The equilibrium constant for Eq. 2-3 is provided by Thomsen and Rasmussen (1999).
The equations above involve the concentrations of the 14 molecules and ionic species in solution:
3 Reactor Modelling
The reactor, as shown in Figure 1, is a continuous crystallizer, that has certain similarities to a classical MSMPR, of a total volume,
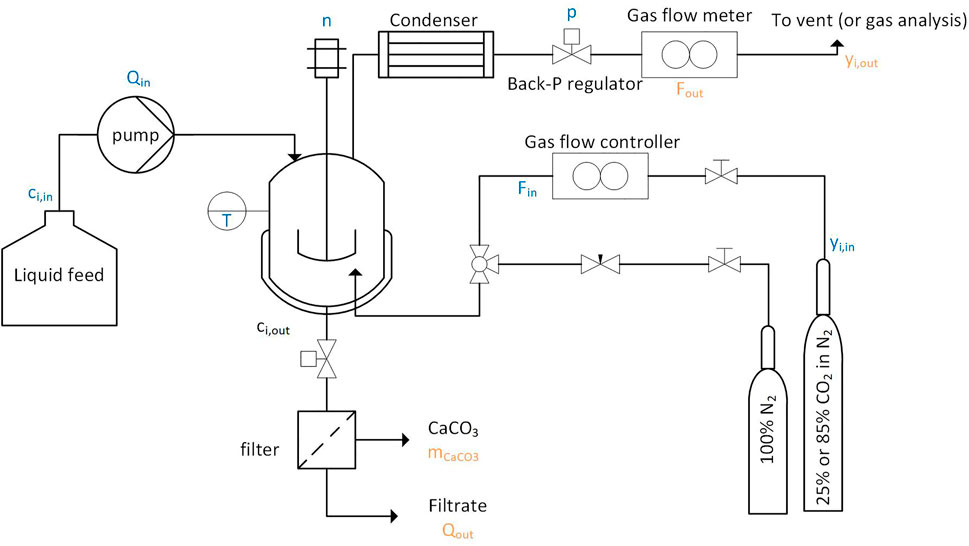
FIGURE 1. A schematic drawing of the crystallizer modeled in the scope of this project is shown. The experimental setup is described to a greater detail in a previous publication (Tiefenthaler and Mazzotti, 2021).
3.1 Aqueous Solution
The material balance for water in the reactor can be written as:
The product of the liquid phase volume
The initial conditions for the system have to be assigned accordingly in case the calculation of the transient between start up and steady state is needed; they are not necessary for steady state simulations. The quantity
3.2 Gas Phase
The gas phase mass balance is
The total number of moles of gas in the reactor’s overhead space,
The quantity
3.3 Solid Phase
The solid phase mass balance is
where
3.4 CO2 Mass Transfer Model
A model for the gas-liquid mass transfer rate of CO2 is adopted, which is based on the two-film theory. The rate of gaseous CO2 absorbed by the liquid phase can be written as Levenspiel (1999a):
3.4.1 Enhancement Factor
The reaction of carbon dioxide with ammonia and hydroxyl ions in the liquid film enhances the CO2 absorption. The liquid phase mass transfer coefficient has to account for this effect, hence the physical mass transfer coefficient
The functional form of the enhancement factor depends on the reaction regime. The reaction regime is specified by the value of the Hatta number
The Hatta number compares the rate of reaction of Eqs 2-3, 2-4 within the liquid film with the rate of CO2 mass transfer through the liquid film, whereby
And the upper bound of the rate constant was determined as follows (Puxty et al., 2010).
The average between the maximum and the minimum values of
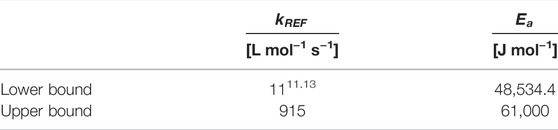
TABLE 1. Parameters for the upper and lower bound of
One way to identify, which of the two reactions considered enhances CO2 mass transfer, is to compute the Hatta number and the enhancement factor for a range of operating conditions. At a CO2 partial pressure of 0.25 bars, 25°C, kL of 2 * 10−4 m s−1 (Last and Stichlmair, 2002) and a NH3 concentration of 0.02–1 mol per kg water, the reaction regimes for both reactions were determined (not shown here). While the reaction of CO2,aq with OH− ions can be found to be between the very slow and the slow reaction regime, the reaction of CO2,aq with NH3 is between the fast reaction of pseudo first order and the fast reaction regime. As a result, only the presence of NH3 enhances the CO2 mass transfer through the gas-liquid interface. Thus, the effect of the OH− ions on the mass transfer enhancement is neglected.
3.5 CaCO3 Precipitation Model
A kinetic expression for the precipitation of CaCO3 is developed. Calcium carbonate can precipitate in three main anhydrous forms: calcite, aragonite and vaterite, listed here by decreasing stability (Flaten et al., 2009). The two dominant mechanisms during precipitation are nucleation and crystal growth. In the case of the continuous process modeled here, nucleation is described according to the classic nucleation theory. To model the precipitation process of CaCO3, we assume that the suspension is well mixed and that nucleation and growth are the dominant precipitation mechanisms, i.e., we have decided for the sake of simplicity to neglect the effect of agglomeration and breakage. The corresponding population balance equation can be written as (Davey, 2000; Ramkrishna, 2000; Alvarez et al., 2011):
where
Since the system operates at steady state, and the feed is free of particles, Eq. 3-21 can be simplified to:
With the boundary condition:
where
The nucleation rate is given by the classical nucleation theory relationship (Jun et al., 2016; Reis et al., 2018):
where
One can see, that as the characteristic length of the particle approaches the size of the smallest particle (L = 0), the corresponding boundary condition is fulfilled. Moreover, the regularity condition is fulfilled, since the value of f(L) becomes zero as the characteristic length approaches infinity (Ramkrishna, 2000).
The growth rate was assumed to be continuous in the entire range of calcite saturation values, meaning that the energy required to integrate a molecule to the solid lattice is low and that every growth unit arriving finds a site in the lattice (Davey, 2000). Thus, the growth rate can be expressed as:
where
where
They estimated
Finally, the jth moment of the crystal size distribution
Using Eq. 3-26 the integral can explicitly be calculated in the case of interest as:
Thus, the moments of the crystal size distribution are function of the residence time and of the composition of the solution, through the values of J and G that depend in turn on the supersaturation
It is worth noting that the quantity
3.6 Key Operating Parameters and Key Performance Indicators
In the following, the KOPs and the KPIs, which have been developed in the scope of a previous experimental study (Tiefenthaler and Mazzotti, 2021) will be introduced as they are used in the Section 4 of the manuscript, particularly for the comparison between simulations and experiments. The stoichiometric ratio in the feed to the reactor,
The CO2 absorption efficiency
The product of the feed stoichiometry
The efficiency of the precipitation of CO2 from the aqueous solution,
Finally, the CO2 mineralization efficiency of the process with respect to CO2,
whilst the overall efficiency of the process with respect to calcium,
Note that
4 Results and Discussion
The experimental campaign published previously (Tiefenthaler and Mazzotti, 2021) provided insights about the effect of feed conditions on process efficiencies, but also particle related properties such as particle size and polymorph. Only experimental points at steady state have been considered for the parameter estimation. We want to assess whether the model presented in the previous sections captures the experimental trends qualitatively and/or quantitatively. If this is the case, one can use the model to develop a deeper understanding of the process, which goes beyond what observed experimentally. For this reason, this section is structured as follows. First, the system specific, empirical parameters
4.1 Estimation of Model Parameters
The process model consists of a thermodynamic model, for the speciation, of material balances and of a population balance equation, as well as of kinetics constitutive equations for mass transfer and for nucleation and growth in the crystallization process. By solving the model equations, the key quantities
where
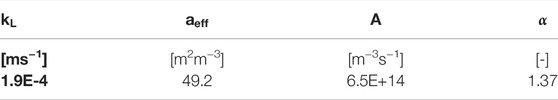
TABLE 2. The four estimated model parameters are listed below.
The two mass transfer related parameters,
Parity plots, shown in Figure 2, are used to illustrate the quantitative agreement between modelling and experimental results. They illustrate the experimental values (x-axis) of
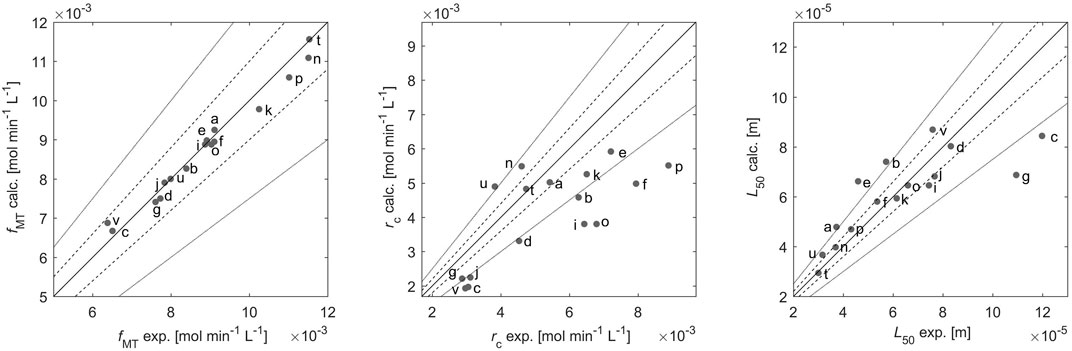
FIGURE 2. The experimental values und the modelling results of the CO2 absorption rate
The experimental and modelling results for
From an experimental viewpoint, the rate of CO2 absorption is the quantity exhibiting the highest accuracy, since it is measured directly online with a previously calibrated mass spectrometer. The empirical parameters
Moreover, Figure 2B shows that the model tends to underestimate the precipitation rate in many cases by 25% or more, possibly due to the fact that the model describes growth and nucleation in a rather empirical way, for instance without accounting for the effect of the solution composition on the growth rate; these effects might be important, as described in literature (Jung et al., 2000). Despite its relative simplicity the model manages to give a quantitative description of the precipitation rate, at least of the right order of magnitude.
The third quantity, which is measured independently, i.e.,
The values of MRD obtained for each measured variable support the observations made based on Figure 2. The quantitative agreement between experimental and modelling results is the highest for
It is worth noting that we have achieved a good accuracy between simulations and experiments using a primary nucleation rate expression. This might appear to be in contradiction with the fact that the model describes a continuous crystallization process, where new CaCO3 crystals are formed in the presence of already existing CaCO3 crystals, i.e., under conditions where secondary nucleation should be favored. We have tried to describe the experimental results using a secondary nucleation rate equation, with the specific feature that the nucleation rate is proportional to a moment of the crystal size distribution [the third moment, as in a recent paper (Chen et al., 1997)], but we have failed, i.e., always obtaining a worse fit than what shown in Figure 2 (results not presented here for brevity). We have rationalized this outcome by considering that primary particles are very small, thus making secondary nucleation by attrition, i.e., the dominant mechanism, unlikely, and that supersaturation is very high, thus favoring primary nucleation.
4.2 Model-Based Process Analysis
The model allows to compute process performance for any set of operating conditions, and thus helps to gain additional insights, far beyond the experimental evidence. For this reason the model was evaluated in hundreds of operating points (about 400), covering calcium concentrations from 0.2 to 0.35 molal, liquid feed rates from 9 to 36 g per minute and gas feed rates from 12.9 to 24 mmol per minute. The temperature, the CO2 inlet concentration, and the NH4NO3 concentration in the feed solution were kept constant at 25 °C, 25% CO2 and 0.7 molal, respectively.
4.2.1 Effect of Stoichiometric Feed Ratio
The stoichiometric feed ratio
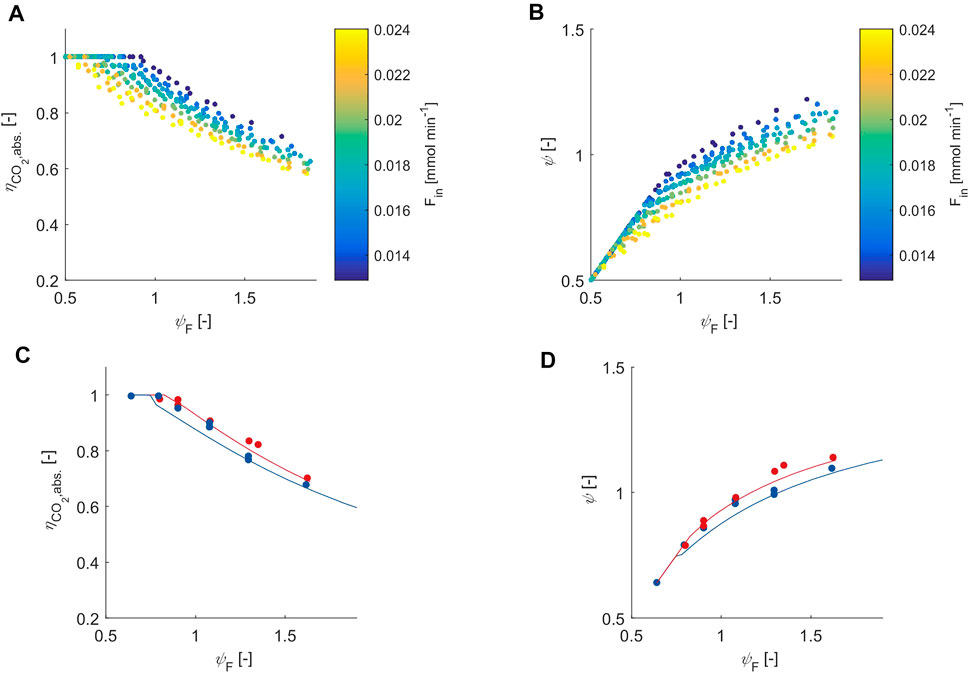
FIGURE 3. The
4.2.2 Efficiency of CaCO3 Precipitation Reaction
As CO2 is absorbed, it speciates into bicarbonate and carbonate ions first, and either exits the reactor with the mother liquer or it reacts with calcium and precipitates as calcium carbonate. Figure 4 visualizes the calculated values of
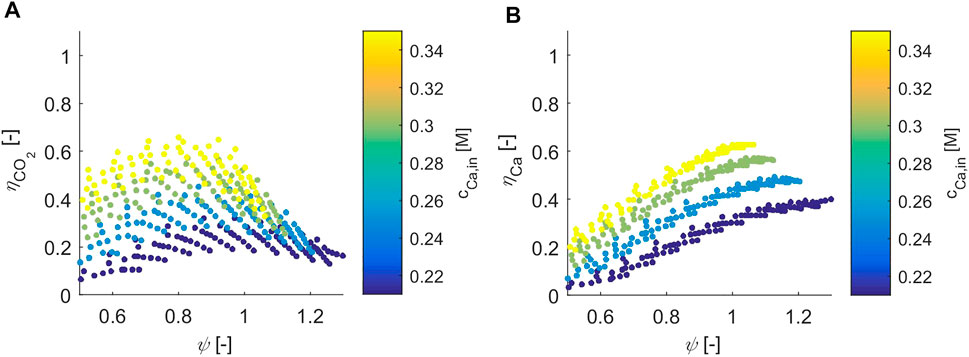
FIGURE 4. The CO2 capture efficiency (subplot (A)) and the calcium precipitation efficiency (subplot (B)) are plotted as a function of
4.2.3 Liquid Speciation: Supersaturation and pH
So far, the effect of the gas flow rate and of the stoichiometry of the feed on the CO2 absorption efficiency as well as the effect of the calcium concentration on the CO2 capture and precipitation efficiency have been investigated. The model also allows to compute quantities that are not accessible experimentally, or at least not easily accessible, hence that have not been measured in the experimental campaign, e.g. the supersaturation of the solution, S, and the pH. In this scope, S is studied since it is the driving force for crystal nucleation and growth (it is worth reminding that S is calculated with respect to the solubility of calcite, and that the formation of different polymorphs is not described by the model for the sake of simplicity). Moreover, the pH is an important indicator of key features of the speciation, e.g., the alkalinity of the solution which gives an immediate indication whether the bicarbonate ion or the carbonate ion is dominating.
Figure 5A visualizes the supersaturation as a function of
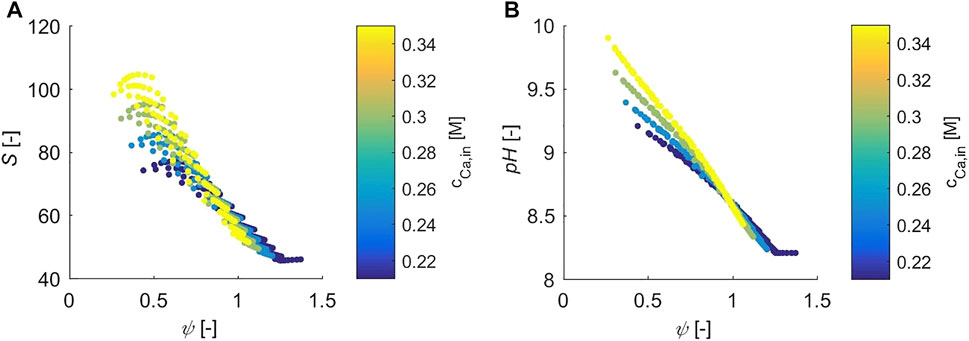
FIGURE 5. S and the pH are plotted as a function of
Figure 5B shows the pH of the aqueous solution as a function of
4.2.4 Particle Size
Figures 6A,B visualize the average particle size
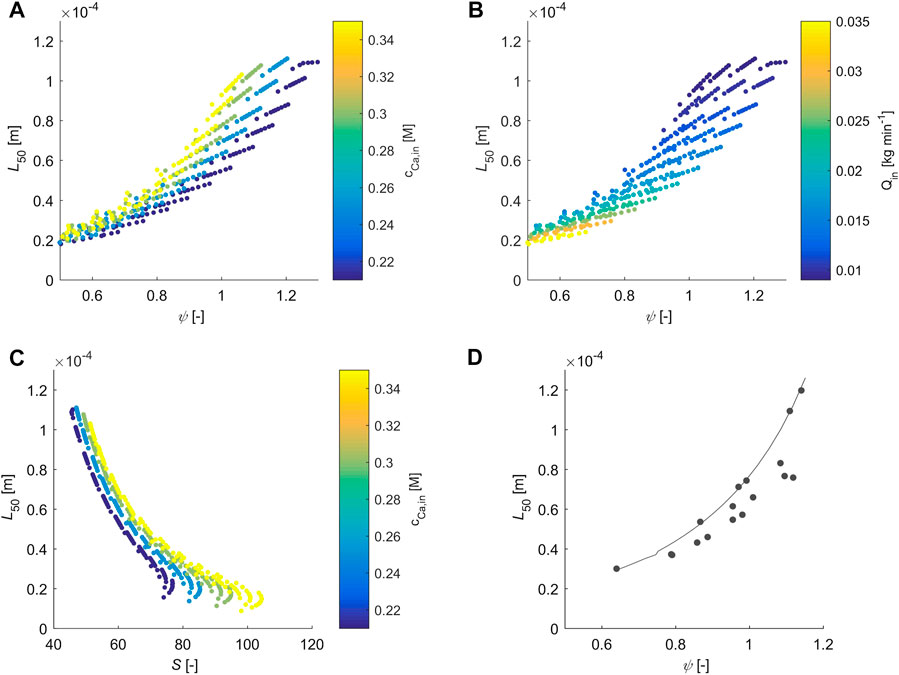
FIGURE 6. L50 is plotted over Ψ and S. The filled cirles in subplot a-c correspond to simulated points, whereas the color represents the quantity specified in the with the color bar. Subplot d shows experimental results (grey circles) and modelling results (solid line), which was obtained by fixing the gas inlet flow rate to 18.5 mmol min-1, the calcium concentration of the feed to 0.3 molal and by varying the liquid feed rate.
Finally, Figure 6C visualizes
5 Concluding Remarks
In this publication, we have developed a reactor model of a continuous crystallizer for the precipitation of calcium carbonate. The product, solid calcium carbonate, is the product of the reaction of a calcium ion with a carbonate ion followed by its transfer to the solid phase at supersaturated conditions. While the calcium is fed with the aqueous solution, CO2 is fed as a gas to the reactor, absorbs to the solution, speciates into various ions and reacts with calcium. In order to obtain a precise description of this three-phase system, the model has to consider the thermodynamics of the system and the mechanisms of the kinetic steps of the process. The core of the model is represented by a thermodynamic description of the aqueous solution, considering the dominant reactions, as well as kinetic expressions for the rate of CO2 mass transfer and the rate of solid formation. These expressions are embedded into material balances for the gas, liquid and solid phase—obtaining a system of equations which can be solved numerically.
In a next step, system specific empirical parameters, which are an integral part of the kinetic rate expressions, have been estimated making use of experimental data obtained in previously published experiments. In specific, the rate of CO2 mass transfer, the rate of solid formation and the volume weighted average particle size have been used for the parameter estimation. The experimentally and simulated rate of CO2 mass transfer show a very high quantitative agreement, while the simulated results of the rate of solid formation show a reasonal agreement with experimental results. Surprisingly, and despite its empirical nature and its relative simplicity, the model manages to describe the particle size rather well—although certain mechanism which conventionally affect the particle size, such as particle agglomeration, are not considered by the model. Furthermore, we identified with the help of the model that primary nucleation is dominant over secondary nucleation. This may sound counter intuitive, however the combined effect of the formation of small primary particles and of the occurrence of high supersaturation levels makes such conclusion plausible.
The model was used to compute many potential operating points in order to obtain an in-depth insight into the mechanisms of the process. Results show, that while the CO2 absorption efficiency is mainly effected by the feed stoichiometry and the gas feed rate, the CO2 capture and Ca precipitation efficiency exhibit the highest sensitivity towards the calcium concentration of the feed and the ratio of reactants in the aqueous solution. As expected, the liquid feed rate, indirectly proportional to the residence time of the suspension in the aqueous solution, is indirectly proportional to the particle size. Moreover, there is a strong dependency between the particle size and the supersaturation in solution, where a higher supersaturation yields smaller particles, and vice versa.
The obtained results—a good description of the rates as well as of the particle properties—is very encouraging, not the least because relatively simple empirical expressions manage to describe a highly complex process. Our work did not stop with the development of the presented model. At the time being, there is an Innosuisse supported and a Horizon 2020 project, which have the aim to advance the maturity of the technology towards TRL 7. In the scope of this projects, concrete fines as well as other alkaline industrial minerals will serve as a source for calcium. The use of such a model helps to design and conduct targeted experimental campaigns, which contribute to enhance the maturity and the potential of the process. Moreover, the reactor model will be an integral part of an overall process model—which is currently under development—describing a novel pH swing process circulating an aqueous solution between a dissolution and a precipitation reactor and accomplishing the so called indirect carbonation of a Ca-bearing precursor, e.g., powder obtained from recycled concrete. The model will be used to conduct a techno-economic and environmental assessment of the new technology.
Novelty—Contribution to Scientific Literature
- Advanced model of a continuous carbonation reactor with a gas-liquid and solid rate.
- Comparison of primary and secondary nucleation in the space of CO2 mineralization.
- Combining both CO2 absorption and crystal growth knowhow for developing a carbonation reactor model.
Data Availability Statement
The original contributions presented in the study are included in the article/Supplementary Material, further inquiries can be directed to the corresponding author.
Author Contributions
JT conducted the work presented and wrote the manuscript. MM was involve in many detailed discussions about the content of the manuscript, reviewing and editing it.
Funding
This research was partially funded by the Swiss Competence Centre for Energy Research—Efficiency Industrial Processes and partially by ETH Zurich.
Conflict of Interest
JT: PhD student in the Separation Processes Laboratory at ETH Zurich and Co-founder, member of the board and shareholder of the ETH-Spinoff neustark, which aims at scaling up and commercializing the presented technology. MM: Professor of the Separation Processes Laboratory at ETH Zurich and member of the advisory board of the ETH-Spinoff neustark.
Publisher’s Note
All claims expressed in this article are solely those of the authors and do not necessarily represent those of their affiliated organizations, or those of the publisher, the editors and the reviewers. Any product that may be evaluated in this article, or claim that may be made by its manufacturer, is not guaranteed or endorsed by the publisher.
Acknowledgments
The authors would like to acknowledge the Swiss Competence Centre for Energy Research—efficiency industrial processes for founding the research activities on this topic. Besides that, we want to thank the ETH Zurich and thus the Swiss Federation for enabling such a research environment without limits. Beyond that, I want to thank Daniel Trottmann for his advice and hands-on support in constructing the setup, Sarah Kienast and Markus Huber for supporting me with the analytics and my predecessors Mischa Repmann and Subrahmaniam Hariharan for preparing the ground for these research activities. Furthermore, I want to thank Jose Francisco Perez Calvo giving me a hand in developing the CO2 absorption model.
Supplementary Material
The Supplementary Material for this article can be found online at: https://www.frontiersin.org/articles/10.3389/fceng.2022.849988/full#supplementary-material
Footnotes
1https://www-gs.llnl.gov/energy-homeland-security/geochemistry
References
Abanades, J. C., Rubin, E. S., Mazzotti, M., and Herzog, H. J. (2017). On the Climate Change Mitigation Potential of CO2 Conversion to Fuels. Energy Environ. Sci. 10 (12), 2491–2499. doi:10.1039/c7ee02819a
Alvarez, A. J., Singh, A., and Myerson, A. S. (2011). Crystallization of Cyclosporine in a Multistage Continuous MSMPR Crystallizer. Cryst. growth & Des. 11 (10), 4392–4400. doi:10.1021/cg200546g
Anantharaman, R. B., and David, B. (2017). CEMCAP Framework for Comparative Techno-Economic Analysis of CO2 Capture from Cement Plants.
Becattini, V., Gabrielli, P., and Mazzotti, M. (2021). Role of Carbon Capture, Storage, and Utilization to Enable a Net-Zero-CO2-Emissions Aviation Sector. Ind. Eng. Chem. Res. 60 (18), 6848–6862. doi:10.1021/acs.iecr.0c05392
Brečević, L. (2007). On Calcium Carbonates: From Fundamental Research to Application. Zagreb, Croatia: CROATICA CHEMICA ACTA.
Chang, R., Choi, D., Kim, M. H., and Park, Y. (2017). Tuning Crystal Polymorphisms and Structural Investigation of Precipitated Calcium Carbonates for CO2 Mineralization. ACS Sustain. Chem. Eng. 5 (2), 1659–1667. doi:10.1021/acssuschemeng.6b02411
Chen, P.-C., Tai, C. Y., and Lee, K. (1997). Morphology and Growth Rate of Calcium Carbonate Crystals in a Gas-Liquid-Solid Reactive Crystallizer. Chem. Eng. Sci. 52 (21-22), 4171–4177. doi:10.1016/s0009-2509(97)00259-5
Darde, V., van Well, W. J. M., Fosboel, P. L., Stenby, E. H., and Thomsen, K. (2011). Experimental Measurement and Modeling of the Rate of Absorption of Carbon Dioxide by Aqueous Ammonia. Int. J. Greenh. Gas Control 5 (5), 1149–1162. doi:10.1016/j.ijggc.2011.07.008
Durmaz, T. (2018). The Economics of CCS: Why Have CCS Technologies Not Had an International Breakthrough? Renew. Sustain. Energy Rev. 95, 328–340. doi:10.1016/j.rser.2018.07.007
Flaten, E. M., Seiersten, M., and Andreassen, J.-P. (2009). Polymorphism and Morphology of Calcium Carbonate Precipitated in Mixed Solvents of Ethylene Glycol and Water. J. Cryst. Growth 311 (13), 3533–3538. doi:10.1016/j.jcrysgro.2009.04.014
Furre, A.-K., Eiken, O., Alnes, H., Vevatne, J. N., and Kiær, A. F. (2017). 20 Years of Monitoring CO2-injection at Sleipner. Energy procedia 114, 3916–3926. doi:10.1016/j.egypro.2017.03.1523
Gardarsdottir, S., De Lena, E., Romano, M., Roussanaly, S., Voldsund, M., Pérez-Calvo, J.-F., et al. (2019). Comparison of Technologies for CO2 Capture from Cement Production-Part 2: Cost Analysis. Energies 12 (3), 542. doi:10.3390/en12030542
Hariharan, S. B. (2017). The Kinetics of CO2 Mineralization Processes Using Thermally Activated Serpentine. Diss. ETH No. 24211.
Hariharan, S., and Mazzotti, M. (2017). Growth Kinetics of Synthetic Hydromagnesite at 90 °C. Cryst. Growth & Des. 17 (1), 317–327. doi:10.1021/acs.cgd.6b01546
Hariharan, S., and Mazzotti, M. (2017). Kinetics of Flue Gas CO2 mineralization Processes Using Partially Dehydroxylated Lizardite. Chem. Eng. J. 324, 397–413. doi:10.1016/j.cej.2017.05.040
Hariharan, S., Repmann-Werner, M., and Mazzotti, M. (2016). Dissolution of Dehydroxylated Lizardite at Flue Gas Conditions: III. Near-Equilibrium Kinetics. Chem. Eng. J. 298, 44–54. doi:10.1016/j.cej.2016.03.144
Initiative, G. C. (2016). Global Roadmap for Implementing CO2 Utilization. USA: University of Michigan.
IPCC (2019). Summary for Policymakers. in: Climate Change and Land: An IPCC Special Report on Climate Change, Desertification, Land Degradation, Sustainable Land Management, Food Security, and Greenhouse Gas Fluxes interrestrial Ecosystems.
Janssens-Maenhout, G., Crippa, M., Guizzardi, D., Muntean, M., Schaaf, E., Dentener, F., et al. (2017). Global Atlas of the Three Major Greenhouse Gas Emissions for the Period 1970-2012. Earth System Science Data. essd-2017-79.
Jun, Y.-S., Kim, D., and Neil, C. W. (2016). Heterogeneous Nucleation and Growth of Nanoparticles at Environmental Interfaces. Acc. Chem. Res. 49 (9), 1681–1690. doi:10.1021/acs.accounts.6b00208
Jung, W. M., Kang, S. H., Kim, W.-S., and Choi, C. K. (2000). Particle Morphology of Calcium Carbonate Precipitated by Gas-Liquid Reaction in a Couette-Taylor Reactor. Chem. Eng. Sci. 55 (4), 733–747. doi:10.1016/s0009-2509(99)00395-4
Kazmierczak, T. F., Tomson, M. B., and Nancollas, G. H. (1982). Crystal Growth of Calcium Carbonate. A Controlled Composition Kinetic Study. J. Phys. Chem. 86 (1), 103–107. doi:10.1021/j100390a020
Laakkonen, M. (2005). Local Bubble Size Distributions, Gas–Liquid Interfacial Areas and Gas Holdups in a Stirred Vessel with Particle Image Velocimetry. Chem. Eng. J. 109 (1-3), 37–47. doi:10.1016/j.cej.2005.03.002
Last, W., and Stichlmair, J. (2002). Determination of Mass Transfer Parameters by Means of Chemical Absorption. Chem. Eng. Technol. 25 (4), 385–391. doi:10.1002/1521-4125(200204)25:4<385::aid-ceat385>3.0.co;2-l
Levenspiel, O. (1999). Chemical Reaction Engineering. Ind. Eng. Chem. Res. 38 (11), 4140–4143. doi:10.1021/ie990488g
Mac Dowell, N., Fennell, P. S., Shah, N., and Maitland, G. C. (2017). The Role of CO2 Capture and Utilization in Mitigating Climate Change. Nat. Clim. Change 7 (4), 243–249. doi:10.1038/nclimate3231
Maeda, M., and Kato, K. (1995). Dissociation Constants of Ammonium Ion and Activity Coefficients of Ammonia in Ammonium Nitrate Solutions. J. Chem. Eng. Data 40 (1), 253–256. doi:10.1021/je00017a054
Mattila, H.-P., Hudd, H., and Zevenhoven, R. (2014). Cradle-to-gate Life Cycle Assessment of Precipitated Calcium Carbonate Production from Steel Converter Slag. J. Clean. Prod. 84, 611–618. doi:10.1016/j.jclepro.2014.05.064
Mattila, H.-P., and Zevenhoven, R. (2014). Design of a Continuous Process Setup for Precipitated Calcium Carbonate Production from Steel Converter Slag. ChemSusChem 7 (3), 903–913. doi:10.1002/cssc.201300516
Mattila, H.-P., and Zevenhoven, R. (2014). “Production of Precipitated Calcium Carbonate from Steel Converter Slag and Other Calcium-Containing Industrial Wastes and Residues,” in Advances in Inorganic Chemistry (Elsevier), 347–384. doi:10.1016/b978-0-12-420221-4.00010-x
Nancollas, G. H., and Reddy, M. M. (1971). The Crystallization of Calcium Carbonate. II. Calcite Growth Mechanism. J. colloid interface Sci. 37 (4), 824–830. doi:10.1016/0021-9797(71)90363-8
Nehrke, G., Reichart, G. J., Van Cappellen, P., Meile, C., and Bijma, J. (2007). Dependence of Calcite Growth Rate and Sr Partitioning on Solution Stoichiometry: Non-kossel Crystal Growth. Geochimica Cosmochimica Acta 71 (9), 2240–2249. doi:10.1016/j.gca.2007.02.002
Ostovari, H., Sternberg, A., and Bardow, A. (2020). Rock ‘n’use of CO 2: Carbon Footprint of Carbon Capture and Utilization by Mineralization. Achen: Sustainable Energy & Fuels.
Pinsent, B. R. W., Pearson, L., and Roughton, F. J. W. (1956). The Kinetics of Combination of Carbon Dioxide with Ammonia. Trans. Faraday Soc. 52, 1594–1598. doi:10.1039/tf9565201594
Pohorecki, R., and Moniuk, W. (1988). Kinetics of Reaction between Carbon Dioxide and Hydroxyl Ions in Aqueous Electrolyte Solutions. Chem. Eng. Sci. 43 (7), 1677–1684. doi:10.1016/0009-2509(88)85159-5
Puxty, G., Rowland, R., and Attalla, M. (2010). Comparison of the Rate of CO2 Absorption into Aqueous Ammonia and Monoethanolamine. Chem. Eng. Sci. 65 (2), 915–922. doi:10.1016/j.ces.2009.09.042
Ramkrishna, D. (2000). Population Balances: Theory and Applications to Particulate Systems in Engineering. Elsevier.
Reis, M. C., Sousa, M. F. B., Alobaid, F., Bertran, C. A., and Wang, Y. (2018). A Two-Fluid Model for Calcium Carbonate Precipitation in Highly Supersaturated Solutions. Adv. Powder Technol. 29 (7), 1571–1581. doi:10.1016/j.apt.2018.03.022
Said, A., Laukkanen, T., and Järvinen, M. (2016). Pilot-scale Experimental Work on Carbon Dioxide Sequestration Using Steelmaking Slag. Appl. energy 177, 602–611. doi:10.1016/j.apenergy.2016.05.136
Sanna, A., Uibu, M., Caramanna, G., Kuusik, R., and Maroto-Valer, M. M. (2014). A Review of Mineral Carbonation Technologies to Sequester CO2. Chem. Soc. Rev. 43 (23), 8049–8080. doi:10.1039/c4cs00035h
Sutter, D., Van der Spek, M., and Mazzotti, M. (2019). 110th Anniversary: Evaluation of CO2-based and CO2-free Synthetic Fuel Systems Using a net-zero-CO2-emission Framework. Ind. Eng. Chem. Res. 58 (43), 19958–19972. doi:10.1021/acs.iecr.9b00880
Thomsen, K., and Rasmussen, P. (1999). Modeling of Vapor-Liquid-Solid Equilibrium in Gas-Aqueous Electrolyte Systems. Chem. Eng. Sci. 54 (12), 1787–1802. doi:10.1016/s0009-2509(99)00019-6
Tiefenthaler, J., and Mazzotti, M. (2021). Frontiers in Chemical Engineering. submitted.Experimental Investigation of a Continuous Carbonation Reactor for CaCO3 Precipitation
Tiefenthaler, J. (2021). Technological Demonstration and Life Cycle Assessment of a Negative Emission Value Chain in the Swiss Concrete Sector. Front. Clim. 3 (128). doi:10.3389/fclim.2021.729259
Versteeg, G. F., and Van Swaaij, W. P. M. (1988). Solubility and Diffusivity of Acid Gases (Carbon Dioxide, Nitrous Oxide) in Aqueous Alkanolamine Solutions. J. Chem. Eng. Data 33 (1), 29–34. doi:10.1021/je00051a011
Vučak, M. (2002). A Study of Carbon Dioxide Absorption into Aqueous Monoethanolamine Solution Containing Calcium Nitrate in the Gas–Liquid Reactive Precipitation of Calcium Carbonate. Chem. Eng. J. 87 (2), 171–179.
Werner, M., Hariharan, S., Zingaretti, D., Baciocchi, R., and Mazzotti, M. (2014). Dissolution of Dehydroxylated Lizardite at Flue Gas Conditions: I. Experimental Study. Chem. Eng. J. 241, 301–313. doi:10.1016/j.cej.2013.12.057
Werner, M., Hariharan, S., and Mazzotti, M. (2014). Flue Gas CO2 Mineralization Using Thermally Activated Serpentine: from Single- to Double-step Carbonation. Phys. Chem. Chem. Phys. 16 (45), 24978–24993. doi:10.1039/c4cp02786h
Wolery, T. (2002). EQ3/6 - Software for Geochemical Modeling Version 8.0, UCRL-CODE-2003-009. Livermore, California: Lawrence Livermore National Laboratory.
Wolthers, M., Nehrke, G., Gustafsson, J. P., and Van Cappellen, P. (2012). Calcite Growth Kinetics: Modeling the Effect of Solution Stoichiometry. Geochimica Cosmochimica Acta 77, 121–134. doi:10.1016/j.gca.2011.11.003
Zeng, Q., Guo, Y., Niu, Z., and Lin, W. (2011). Mass Transfer Coefficients for CO2 Absorption into Aqueous Ammonia Solution Using a Packed Column. Ind. Eng. Chem. Res. 50 (17), 10168–10175. doi:10.1021/ie101821b
Nomenclature
A pre exponential factor of the nucleation rate (1/m3/s)
b number of experiments (-)
n stirring rate
T temperature of the aqueous solution (K)
τ residence time of the aqueous solution (s)
Ρ density of the solution (kg H2O/m3)
ρc density of calcite (kg/m3)
Keywords: CO2 mineralization, kinetic modelling, calcium carbonate precipitation, carbon capture and storage (CCS), precipitated calcium carbonate (PCC), CO2 absorption
Citation: Tiefenthaler J and Mazzotti M (2022) Modeling of a Continuous Carbonation Reactor for CaCO3 Precipitation. Front. Chem. Eng. 4:849988. doi: 10.3389/fceng.2022.849988
Received: 06 January 2022; Accepted: 06 May 2022;
Published: 27 June 2022.
Edited by:
Gyorgy Szekely, King Abdullah University of Science and Technology, Saudi ArabiaReviewed by:
Carlos A. Grande, King Abdullah University of Science and Technology (KAUST), Saudi ArabiaMatthias Kind, Karlsruhe Institute of Technology (KIT), Germany
Copyright © 2022 Tiefenthaler and Mazzotti. This is an open-access article distributed under the terms of the Creative Commons Attribution License (CC BY). The use, distribution or reproduction in other forums is permitted, provided the original author(s) and the copyright owner(s) are credited and that the original publication in this journal is cited, in accordance with accepted academic practice. No use, distribution or reproduction is permitted which does not comply with these terms.
*Correspondence: Marco Mazzotti, marco.mazzotti@ipe.mavt.ethz.ch