 Aurélie C. Shapiro1,2*
 Katie P. Bernhard3,4
 Stefano Zenobi5
 Daniel Müller1,6,7
 Naikoa Aguilar-Amuchastegui8
 Rémi d'Annunzio2
- 1Geography Department, Humboldt-Universität zu Berlin, Berlin, Germany
- 2Forestry Division, Food and Agricultural Organization, Rome, Italy
- 3United Nations Development Programme - Uganda, Kampala, Uganda
- 4Department of Recreation, Park, and Tourism Management, College of Health and Human Development, Pennsylvania State University, State College, PA, United States
- 5World Wide Fund for Nature - Greater Mekong, Bangkok, Thailand
- 6Leibniz Institute of Agricultural Development in Transition Economies (IAMO), Halle, Germany
- 7Integrative Research Institute on Transformations of Human-Environment Systems (IRI THESys), Humboldt-Universität zu Berlin, Berlin, Germany
- 8World Wildlife Fund, Washington, DC, United States
Forest degradation, generally defined as a reduction in the delivery of forest ecosystem services, can have long-term impacts on biodiversity, climate, and local livelihoods. The quantification of forest degradation, its dynamics and proximate causes can help prompt early action to mitigate carbon emissions and inform relevant land use policies. The Democratic Republic of the Congo is largely forested with a relatively low deforestation rate, but anthropogenic degradation has been increasing in recent years. We assess the impact of eight independent variables related to land cover, land use, infrastructure, armed conflicts, and accessibility on forest degradation, measured by the Forest Condition (FC) index, a measure of forest degradation based on biomass history and fragmentation that ranges from 0 (completely deforested) to 100 (intact). We employ spatial panel models with fixed effects using regular 25 × 25 km units over five 3-year intervals from 2002 to 2016. The regression results suggest that the presence of swamp ecosystems, low access (defined by high travel time), and forest concessions are associated with lower forest degradation, while built up area, fire frequency, armed conflicts result in greater forest degradation. The impact of neighboring units on FC shows that all variables within the 50 km spatial neighborhood have a greater effect on FC than the on-site spatial determinants, indicating the greater influence of drivers beyond the 25 km2 unit. In the case of protected areas, we unexpectedly find that protection in neighboring locations leads to higher forest degradation, suggesting a potential leakage effect, while protected areas in the local vicinity have a positive influence on FC. The Mann-Kendall trend statistic of occurrences of fires and conflicts over the time period and until 2020 show that significant increases in conflicts and fires are spatially divergent. Overall, our results highlight how assessing the proximate causes of forest degradation with spatiotemporal analysis can support targeted interventions and policies to reduce forest degradation but spillover effects of proximal drivers in neighboring areas need to be considered.
Introduction
The degradation of natural forests is a serious problem with resonating impacts around the world, from significantly contributing to greenhouse gas emissions (Simula and Mansur, 2011), biodiversity loss (Foley et al., 2007), reductions in water regulation (Lele, 2009), and ultimately reducing the ability of forests to provide ecosystem services linked to food and goods which sustain local livelihoods (Lambin and Meyfroidt, 2011). Successful implementation of actions to reduce forest degradation, such as climate-relevant policies for emissions reduction and nature-based solutions requires prompt, well-informed, and appropriate actions (Griscom et al., 2017). The policy decisions based on available information, resources, socioeconomic conditions, and economic risk play important roles in how humans manage forests (Angelsen and Kaimowitz, 1999). A thorough understanding and quantification of the proximate causes and spatial determinants of the degradation, their magnitude, and spatial extent are needed to prevent degradation from eventually turning into deforestation (Griscom et al., 2020).
Deforestation is the result of forest loss or conversion to alternative land use, while degradation can fundamentally alter a forest without reducing its area or definition as a forest (Vásquez-Grandón et al., 2018). The identification of the proximate causes and spatial determinants of degradation is complicated by varied temporal time scales, dynamics, extent, definitions, and perceptions. Although deforestation and degradation can be closely correlated (Defourny et al., 2011), they differ fundamentally in terms of definition and impacts on ecosystem services. The quantification of drivers of deforestation and degradation is not only important for targeting national strategies to reduce the emissions from deforestation and degradation (REDD+), but have wide applications to sustainable development initiatives supporting local economies as well as conservation efforts seeking to reverse or slow the significant downward trends in forest cover and quality (Bernhard et al., 2020). A proper understanding of the proximate causes and determinants of degradation is essential for aligning policies with the appropriate actors (Tegegne et al., 2016), but available quantitative information on degradation drivers and how they interact at various scales is still quite limited. Degradation is often a precursor to deforestation in tropical areas (Gerwing, 2002; Vancutsem et al., 2021). This means that timely and accurate assessment of degradation risk is of utmost importance to prevent deforestation before it happens, and to improve and target mitigation activities.
The causes of forest disturbance are driven by multiple synergistic factors acting together, rather than single variables alone (Geist and Lambin, 2002; Megevand, 2013), meaning that policies and responses need to address a variety of factors and their interactions. In this study we use spatial panel regressions to assess the impact of multiple proximate causes and spatial determinants of forest degradation over time and space in the Democratic Republic of the Congo (DRC) using a novel forest condition (FC) metric which estimates a relative index of degradation from 0 (deforested) to 100 (intact; Shapiro et al., 2021). Spatial panel models are often used in the field of spatial econometrics, and assess data in spatial units over multiple time periods (Elhorst, 2010). We evaluate these patterns in the DRC, which holds the largest intact tract of tropical forest in Africa, hosting a wealth of biodiversity in a globally important carbon sink to mitigate climate change, while also supporting the livelihoods of millions of people (Molua, 2019). National rates of deforestation are relatively low, but in the last 10 years has nearly doubled to about 0.5% per year (FAO, 2020); this trend could continue with an increasing population dependent on natural resources, unregulated timber and mineral exploitation, and conflicts over these resources (Kengoum Djiegni et al., 2020). The DRC is vast, with large variations in the rates of forest loss, which are due to different demographics, threats, political frameworks, that require tailored policies and management. Unfortunately, the extent of forest degradation is still poorly understood in the DRC but can potentially result in more emissions than deforestation (Pearson et al., 2014, 2017), particularly under the high prevalence of resource-based livelihood activities, such as harvesting for fuelwood, unsustainable bushmeat hunting which affects natural forest regeneration (Harrison, 2011), and expansion of small-scale agricultural activities. The lack of understanding of the causes and determinants of forest degradation in the DRC is relevant because nearly 30% of total loss of primary forest between 2000 and 2015 was degraded before being deforested (Shapiro et al., 2016).
Direct or proximate causes of degradation have been identified as occupying five main themes: the expansion of commercial and subsistence agriculture, mining and infrastructure development, and urban expansion (Hosonuma et al., 2012). A major indirect cause of forest disturbance in the DRC is extreme poverty, which affects a majority of the population (World Bank, 2020), is closely linked to forest dependent behaviors, and is an additional contributing factor to forest degradation (Nerfa et al., 2020). This situation is compounded by political instability and an ongoing humanitarian crisis due to decades of armed conflict that pushes human activities deeper into the forests (Nackoney et al., 2014; Butsic et al., 2015; OCHA, 2021). The DRC's population is predominantly rural, with a strong reliance on the informal agricultural sector, which mostly comprises of informal slash and burn practices (Tyukavina et al., 2018; Molinario et al., 2020) associated with increased fire frequency on managed lands, new clearings and forest edges (Morton et al., 2008; Jiang et al., 2020). The high reliance on natural resources will likely increase further due to the rapidly growing population along with urbanization; the overall population of the DRC is expected to exceed 100 million by 2035 (Tchatchou et al., 2015). We select eight variables to represent the five major direct drivers, and approximate the human impacts on DRC forests using covariates on built-up area, fire frequency, accessibility, land use, and presence of armed conflicts. We specifically choose these variables because they can be monitored over time with readily available, spatially explicit, consistent, measurable and repeatable indicators, whereas underlying variables such as the impacts of policies, socio-economic variables or underlying market forces are neither spatial in nature nor readily collected with standard approaches.
As forest degradation is dynamic, so must be the proximate causes and spatial determinants to capture the variations in time and space. Spatial econometrics techniques and their application to conservation and development enable research controlling spatial and temporal components via spatial panel data, which are a spatial cross-section of observation repeated over time (Baylis et al., 2011; Bernhard et al., 2020). The observations in a spatial panel can be correlated in time (repeated observations that may be dependent on a previous date) but also in space (neighborhood interaction; (Molinario et al., 2020). Here, we assess eight independent covariates over time within a grid of square of 25 × 25 km units. We control for fixed individual site differences and capture both time variant and time-invariant factors at unit level to isolate site-specific trends from neighboring or national trends, hence controlling for characteristics which might be auto-correlated in space and time. We evaluate the spatial panel models from 2002 to 2016 with the overall aim to provide a key understanding of the dynamic proximate causes and spatial determinants of forest disturbance to inform conservation, spatial planning, and climate mitigation initiatives. We answer two major research questions:
1. What are the spatial determinants of changes in forest condition?
2. How do these determinants interact and change over time?
Methodology
Study Area
This study assesses proximal causes of degradation in the Democratic Republic of the Congo (DRC), the largest country in the Congo Basin (Figure 1), which is characterized by having high forest area and low deforestation (da Fonseca et al., 2007; de Wasseige et al., 2015), with 60% forest cover and a deforestation rate of about 0.5% since 2010 (FAO, 2020). The known distribution of forest biomass and its potential carbon sinks support new economic opportunities for sustainable development under REDD+ (Xu et al., 2017). While deforestation is generally low, degradation however has been estimated to affect large areas (Shapiro et al., 2016) which are increasing over time (Figure 2; Shapiro et al., 2021). The forest transition model (Mather, 1992) shows that as countries develop, the related economic and population growth will likely elevate pressure on forest resources, notably intensification of agriculture and urbanization resulting in the increased threat of accelerating deforestation and forest degradation (DeFries et al., 2004; Hosonuma et al., 2012).
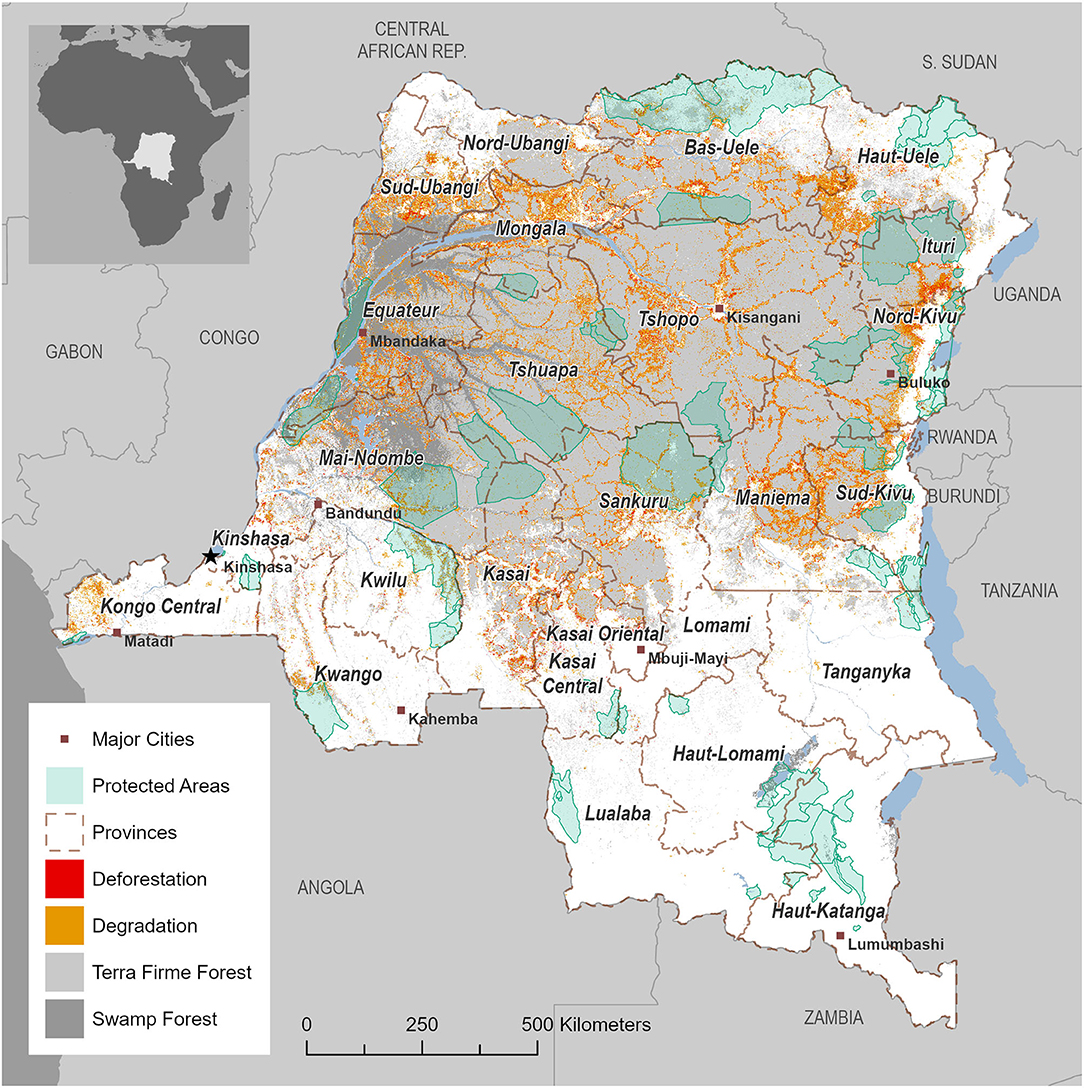
Figure 1. The Democratic Republic of the Congo (DRC), with the capital Kinshasa, divided into 26 provinces, possesses over 100 million ha of tropical forest, of which about 11 million are swamp forest. Deforestation and degradation is from Shapiro et al. (2016).
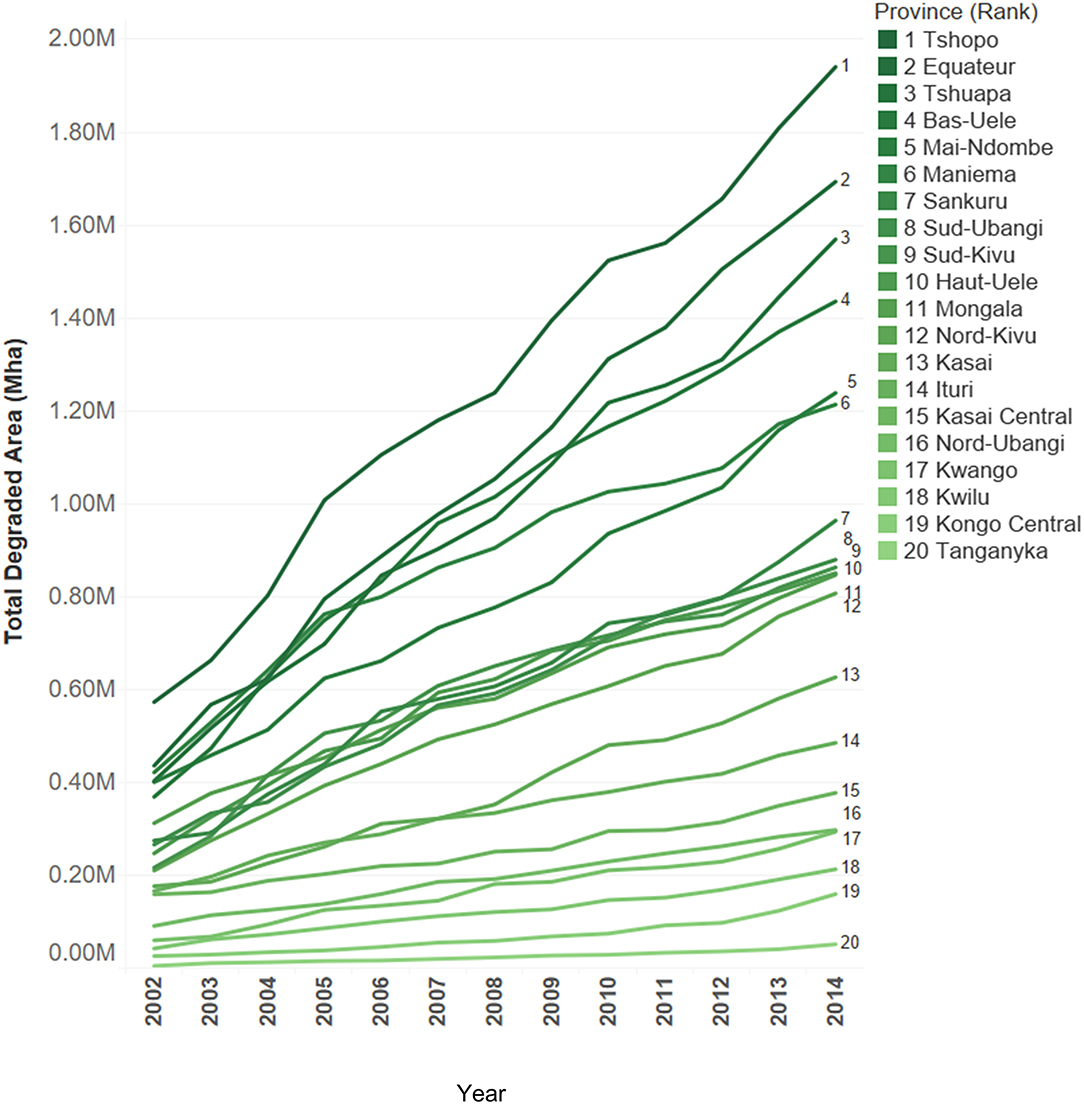
Figure 2. Total degraded forest area of the 20 provinces with highest degradation rates [data from Shapiro et al. (2021)].
Data Sources
To quantify and understand human impacts on forests and the associated determinants of degradation, context and location is important. The literature regarding deforestation and forest degradation are often addressed together, citing slash-and-burn agriculture, collection of charcoal, mining and forest exploitation, infrastructure development and civil unrest, conflicts as key proximate causes in DRC (Defourny et al., 2011; Nackoney et al., 2014; Butsic et al., 2015; Tchatchou et al., 2015). In the following section, we discuss these key proximate causes of forest degradation addressed in this study which were selected to represent the major drivers of degradation via readily available data sources (Table 1). These are evaluated for each grid unit for each time period, which is a 3- year interval between 2002 and 2016. We then apply spatial panel regression techniques to identify the correlates for degradation and build on the concepts in published literature (Bernhard et al., 2021).
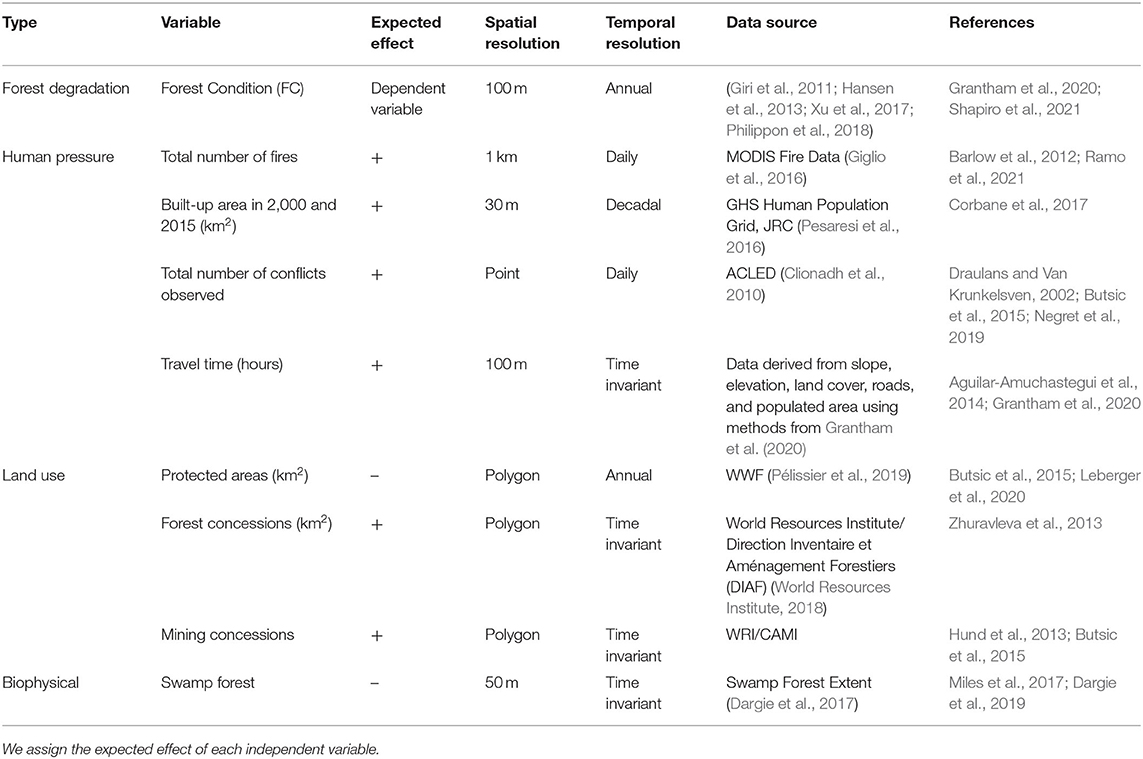
Table 1. Variables evaluated for each forest grid and relevant literature.
Forest Condition
Forest condition (FC; from Shapiro et al., 2021) is estimated as a relative index of forest degradation based on a gain/loss approach to above ground biomass (AGB). To create the FC index we used morphological pattern analysis (Vogt et al., 2007) on a forest extent maps to identify core, inner and outer edge and patch forests using an edge distance of 300 m. Using different forest cover maps over time we re-assess the fragmentation class of each forest ecosystem type into stable and change classes (Shapiro et al., 2016). Using the mean AGB of each fragmentation strata of each forest ecosystem type, we determine the proportion of remaining AGB of that strata and ecosystem type, where core, inner intact, and connected forest areas have an FC of 100; deforested areas have an FC = 0, and degraded or fragmented forests in between have an FC proportional to the total potential above ground biomass of intact forest. FC of all tropical dense forest area is used as the dependent variable to assess the proximate causes and spatial determinants of degradation over time. The FC metric was assessed for all dense tropical forests of the Congo Basin by Shapiro et al. (2021), and do not include the extensive dry forests. It was derived according to the unique forest ecosystem types described in Shapiro et al. (2021), from which we extract for our study area. It is estimated that there are about 27 million ha of degraded forests in DRC, with the total degraded area increasing over time (Figure 2).
Fire
Fires are typically infrequent in tropical forests, and most observations outside of any typical fire season have a human cause (Morton et al., 2008; Bowman et al., 2011). Anthropogenic fires occur more often in forest edges (Cochrane, 2001; Benali et al., 2017) and are a major cause of forest degradation and deforestation in tropical biomes, which are not adapted to fire regimes and as a result experience reduced ecosystem resilience, with higher impacts on biodiversity as well as large greenhouse gas emissions (Juárez-Orozco et al., 2017; Ramo et al., 2021). These impacts can potentially increase with warming, drier climate (Siegert et al., 2001; Malhi et al., 2009). Fires, and especially multiple burns per year, are associated with agricultural expansion, especially slash and burn cultivation, which is cited as the greatest cause of forest disturbance in DRC (Tyukavina et al., 2018; Molinario et al., 2020), and is also increasing (Cochrane, 2001; Lewis et al., 2015). Fires, more importantly their frequency are therefore a crucial variable for degradation monitoring and emissions reduction interventions (Barlow et al., 2012). We use the latest Fire Information for Resource Management System (FIRMS; Giglio et al., 2016) dataset, which is the near real time active fire location product derived from the Moderate Resolution Imaging Spectrometer (MODIS) sensor thermal anomalies. We use Google Earth Engine (Gorelick et al., 2017) to sum all fire detections in each 3-year time interval. We select all fire detections with a confidence flag >30 at a resolution of 1 km. Fires are summed over all grid cells in the time interval.
Accessibility and Infrastructure
Physical access by humans into forests ecosystems is also an important driver of forest disturbance (Ferretti-Gallon and Busch, 2014). In the DRC, the means of access include both roads and rivers used to access forest areas for bushmeat, logging, and fuelwood collection, the latter being an essential resource for local communities and large cities alike and a significant cause of forest degradation (Chidumayo and Gumbo, 2013). An estimated 90% of wood harvested in the Congo Basin is destined for fuelwood, a trend exacerbated by poverty, population growth, and urbanization (Marien, 2009). Meanwhile, the extirpation of wild species by unsustainable hunting practices results in forests devoid of keystone, seed dispersing wildlife which can affect natural regeneration and resilience while also having significant social consequences to local human populations (Harrison, 2011; Nasi et al., 2011). We developed a travel time dataset, which is the output of a cost surface model in ArcGIS Pro version 2.7 (ESRI, 2020) derived from a source layer and a cost layer. The latter is derived from land cover, roads, rivers, elevation, and slope, and impedance as described in the development of the forest pressure index (FPI) in Grantham et al. (2020). The source layer was created from the human settlements obtained from the Global Human Settlement BUILT dataset for the year 2000 (Corbane et al., 2018), The cost surface estimates driving speed over roads and walking speed over various land cover surfaces, which are decreased with increasing slope and elevation; a navigation speed approximates travel on waterways as a function of their flow. As no temporally explicit data are available for road infrastructure, we can only develop accessibility for a single reference period of 2000, deriving the mean travel time in hours for all grid units. The BUILT dataset was also used to define the extent of built-up area per grid unit, using data for 2000 for the first four time steps and 2015 for the final time step.
Conflicts
Another determinant of degradation is armed conflict, which can have far-reaching ecological impacts (Machlis and Hanson, 2008). Violent conflicts can result in significant deforestation and degradation due to movements of refugees and internally displaced people (IDPs) into forests to escape violence (McNeely, 2003) and also adversely affects wildlife (Daskin and Pringle, 2018). Furthermore, conflicts in the region tend to be in areas of rich natural resources, such as minerals or forest; these areas are often inhabited by indigenous groups, which can result in further conflicts over land rights and acquisitions for resource extraction (Humphreys et al., 2007). The total number of conflicts recorded in DRC has been increasing in recent years, notably the violence against civilians (Figure 3). Conflicts in DRC are persistent in transboundary regions, which overlap with heavily forested and protected areas. For example, in the eastern DRC, conflicts have been a constant issue, especially in the Greater Virunga Landscape (GVL), which covers a network of 13 protected areas between DRC, Rwanda, and Uganda. The GVL has seen protracted conflicts, with periodic spikes over the last three decades, including ongoing armed rebel group activity based out of forests and remote areas.
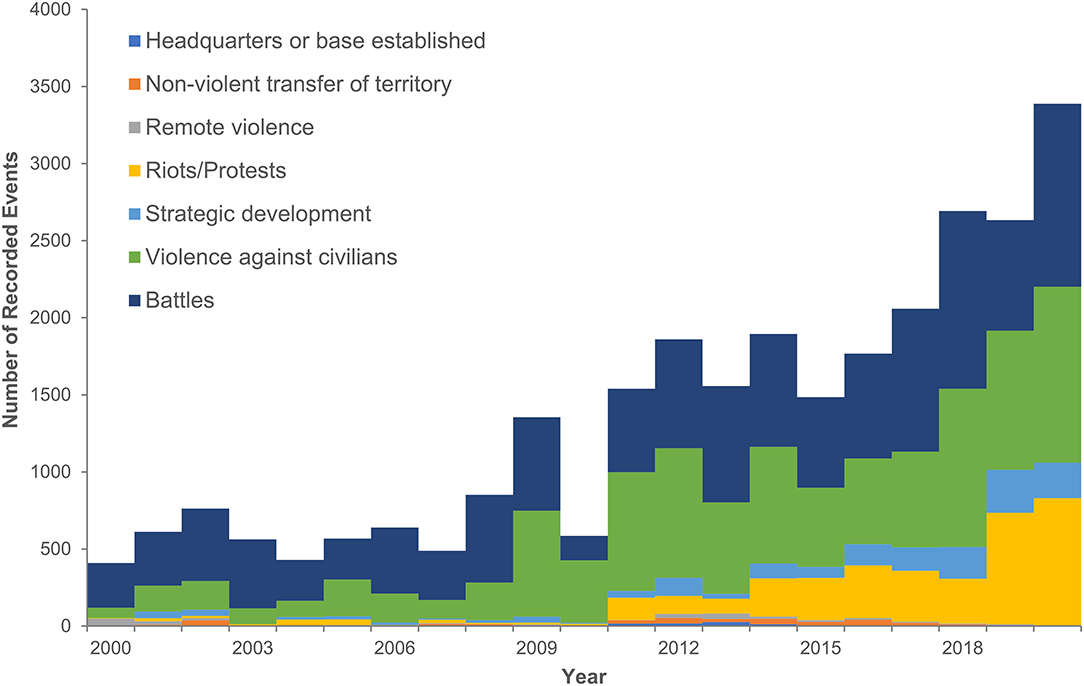
Figure 3. Recorded conflict events in DRC, broken down by event type (Source: Clionadh et al., 2010).
We calculated the conflict variable using the Armed Conflict Location & Event Data Project (ACLED) database (Clionadh et al., 2010) which is a collection of real-time data on the locations, dates, actors, fatalities, and types of reported political violence and protest events across the world. We use the total sum of conflicts in each grid unit as our variable, and do not discern between the number of fatalities or types of conflicts, as even non-fatal activities can have the effect of terrorizing and destabilizing local communities and their livelihood activities (Draulans and Van Krunkelsven, 2002) and the presence of protests can indicate civil unrest or political conflicts. Various rebel and armed groups use systematic and strategic sexual violence as a weapon of war (van Wieringen, 2020), increasing pressure on local resources through non-lethal threats and terror, as they depend on local communities, raid villages and fields, and force local residents to provide food, payments, or other income to armed groups (Laudati, 2013). On the other hand, some studies show that conflict could reduce or prevent deforestation by, at least temporarily, limiting private sector or extractives sector activity (Burgess et al., 2015). The armed conflicts caused by the long-term unrest in eastern DRC are therefore an important variable to consider in the assessment of the causes and determinants of forest degradation.
Land Use
The attribution of land use and its change over time is directly affecting activities on land. We use available data on protected areas, legal mining and forest concessions to assess the potential impacts from attributed land use management. The DRC is extremely rich in minerals, and efforts to extract these are exerting increasing pressure on unprotected forest and savanna ecosystems (Edwards et al., 2014). However, recent studies show the impacts on forests from industrial logging is relatively low (de Wasseige et al., 2012; Tyukavina et al., 2018). Although there has been a moratorium on forest concessions and a legal conversion process in 2002, the impact has been questionable, with extractive activities occurring regardless (Lawson, 2014). For this reason, we do not incorporate temporal information into the forest concessions as data can also be unreliable and may not be correlated with actual forestry activities. We assess total area attributed to logging concession regardless of status for each grid unit.
We source mining data directly from the DRC mining cadaster. While date information is available for some mining concessions, the information was also incomplete for many, or considered to be unreliable due to differences between different official and commercial data sources. Additionally, the timing of a particular type of legal mining license might not preclude illegal or artisanal activities, which may occur before or after the establishment or end of a legal permissions. Therefore, we do not account for temporal information of the mining concessions. We calculate total area (hectares) attributed to mining for each grid unit for this variable over the entire study period.
We incorporate protected areas, which were recently re-evaluated in DRC and include the year of establishment (Pélissier et al., 2019). Several new protected areas were established during the study period which allows us to assess their potential impacts (Figure 4). Protected areas downgrading, downsizing, and degazettement (PADDD) is present, but occurred mostly in the late 1950s, prior to our analysis (Forrest et al., 2014). We calculate total protected area in hectares for each grid unit and time interval.
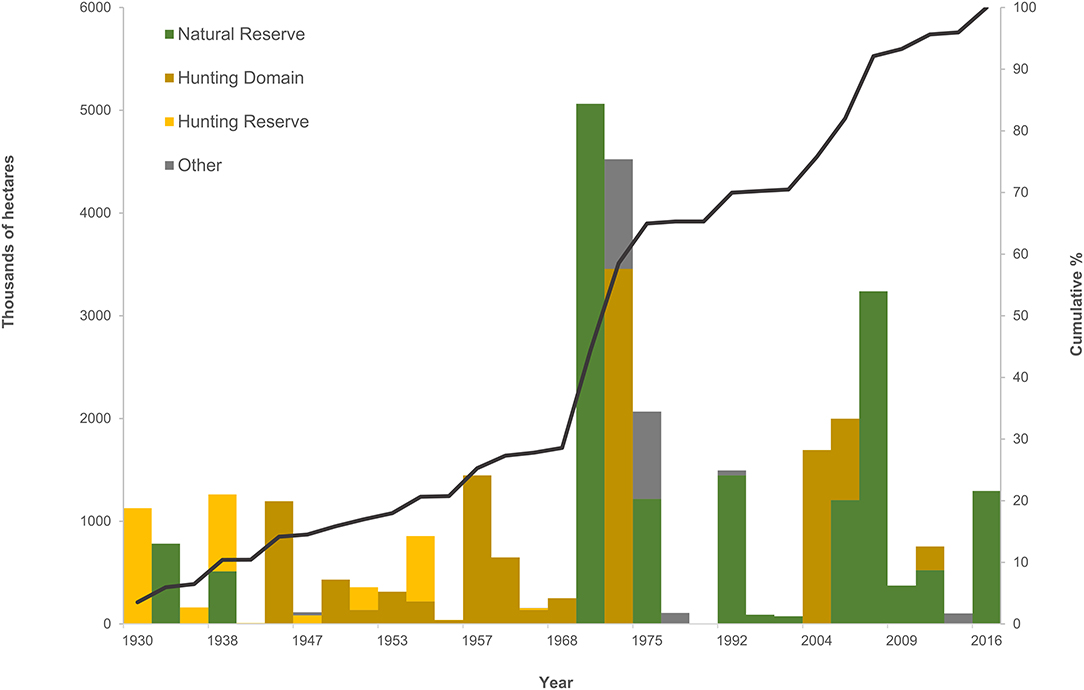
Figure 4. Protected areas in DRC have been established since the 1930s, which significant increases in the 70s and early 2000s (Pélissier et al., 2019). Most protected areas are hunting reserves and domains (names are translated to English). Other category includes scientific, zoological and forestry reserves, as well as annexes.
Spatial Statistics
We estimated spatial panel regressions for the period from 2002 to 2016, separated into 3-year intervals to evaluate the impact of drivers in affecting degradation over time, spatial panel regression models were developed for the study period of 2002–2016, divided into five intervals of 3 years. Panel datasets effectively have two dimensions: a spatial dimension, with multiple temporal panels to assess effects over time (Vijayamohanan, 2016). The summary statistics of all variables is presented in Table 2.
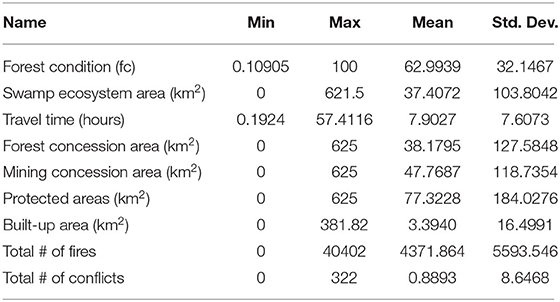
Table 2. Summary of variables.
The areal units were selected within the primary dense forested area of DRC, which was divided into 25 × 25 km grid squares (Figure 5), with data assessed over all 3-year time intervals between 2002 and 2016, resulting in 2,996 observations in each panel for a total of 14,980 observations. The decision to use equal-size grid cells as opposed to administrative boundaries was due to several reasons. First, some of the administrative boundaries changed substantially over time, in part due to instability and inconsistency in governance at both central and local government levels throughout DRC. This can adversely affect a panel model with the same units over time and, furthermore, these changes could be associated with deforestation (Alesina et al., 2019). Additionally, the availability of forest resources (timber products, bushmeat) is directly related to the amount of available forest to degrade, therefore different sized units cannot be adequately accounted for simply by normalizing area. A consistent grid avoids these pitfalls, but may lessen any potential impacts in differing governance or power structures, and therefore addresses the patterns independent of small administrative units. Given the small size of the grid in relation to other variables related to land use larger polygons such as forest concessions or protected areas are likely to cross neighbor boundaries, which could result in a source of endogeneity between units.
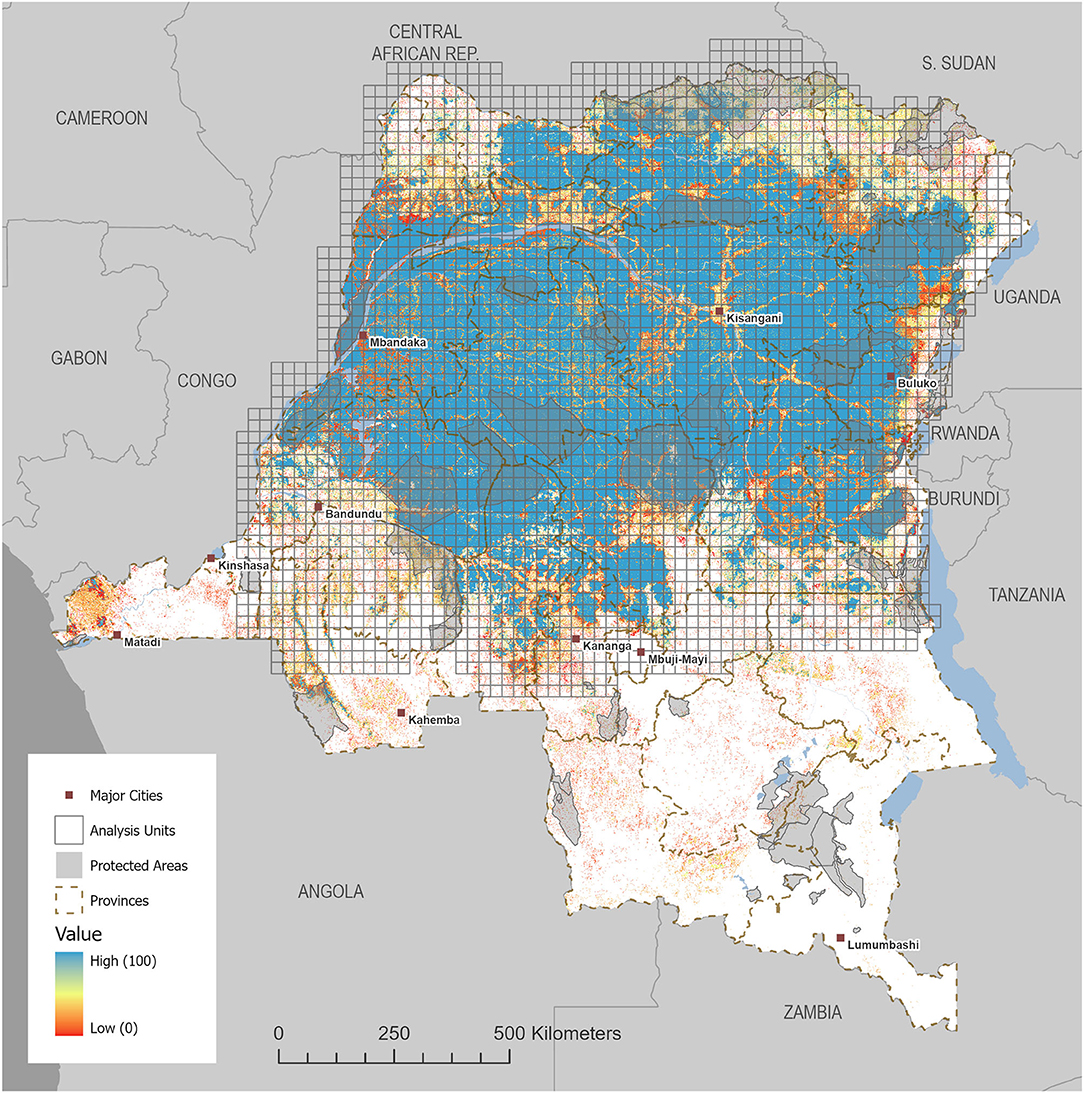
Figure 5. The analysis units shown over forest condition (FC) from Shapiro et al. (2021). About 70% of DRC forests remain intact, with an FC of 100.
For each grid cell, the dependent variable, mean FC, and all independent variables (Table 1) were estimated for each 3-year time interval. We used zonal statistics to calculate the mean value for continuous variables, such as accessibility; for area estimates, such as mining concession area, protected area, forest concession area, built-up area, and swamp ecosystem area, we calculated the percent of the grid cell occupied by the respective variable. All temporally explicit data, such as protected area and built-up area, were calculated for the relevant time interval. A Pearson correlation matrix was assessed for all independent variables to identify multicollinearity. We assess significance at the 0.005 level using a correlation threshold of 0.5 to identify correlated variables.
Spatial Panel Regression
We evaluate spatial autocorrelation of the dependent variable through a non-parametric spatial correlogram of Moran's I using GeoDa version 1.18 (Anselin et al., 2005), where a local regression is used to evaluate correlations for all pairs of observations as a function of the distance between them (Bjørnstad and Falck, 2001). This provided the information to select the appropriate structure of the spatial neighborhood that has an influence on each observation. The spatial weights matrix is defined as a N × N matrix that identifies spatial dependence among the observations (i.e., the grid cells) across the study area.
The availability of repeated observations on the same units of a panel model allows the capture of individual-specific, time-invariant factors affecting the dependent variable in addition to unobserved effects (Baltagi, 2005). The rationale behind random effects models is that static differences across entities are presumed to have influence on the dependent variable. The random effects (RE) model therefore assumes that the unobserved time-invariant components of the model are unrelated (random) to the regressors therefore allowing the estimation of time-invariant explanatory variables (Greene, 2019). However, the assumption of no correlation between an unobserved component and the regressors is often unrealistic. This assumption is relaxed in fixed effects (FE) models that allow the unobserved random component to be related to the regressors, which causes all time-invariant explanatory variables to drop out of the analysis (Wooldridge, 2012). Both models can apply in certain situations. FEs are preferred when the interest is in assessing the impact of variables that change over time and not over observations, such as the number of conflicts and fire occurrences in our analysis. The RE models are valuable in situations where key explanatory variables are constant over time, such as bio- and geophysical variables described in our approach. We therefore apply both FE and RE models.
We apply spatial considerations to these models by adding using spatially lagged independent variables to our models. These spatial lags are the average of the neighborhood according to the spatial weights matrix without the central cell, in order to evaluate the local grid and the effect of its neighbors separately (Anselin and Rey, 2014).
We explored the different model specifications based on data constraint considerations (e.g., some spatial variables having only one reference period) and also in an effort (1) to illustrate the robustness of results to different model specifications; and (2) to provide complementary results where one model type has weaknesses. For example, fixed effects regression cannot include spatial variables without temporal variation (four out of eight independent variables). Therefore, we use the random effects to evaluate time and time invariant variables together. We describe each of the three model types through Equations 1, 2.
Random effects models incorporate parameters, which are random and uncorrelated (Equation 1).
Where yit is the dependent variable of entity i at time t. β1 is the coefficient of variable x, the vector of independent variables, αi is the individual specific effect potentially correlated with the independent variables, uit is the between entity error term, and εit is the within entity error term. Random effects models are typically fitted using generalized least squares (GLS) which is efficient and unbiased for situations with heterogeneous variance (Baltagi, 2005). Fixed effects models fix variables across observations rather than time, as some variables do not vary over time, or only have few time periods (Equation 2).
Where yit is the dependent variable of entity i at time t, αi(i = 1…n) is the unknown intercept for each entity (n entity-specific intercepts), xit represents one independent variable, and βit is the coefficient for independent variable x.
We evaluate the random and fixed effects model with and without spatial lags. All regression analyses were executed in Stata (StataCorp, 2019). We assess all four models via their coefficients and significance, overall, R2, and estimation of rho, the ratio of individual specific error variance in relation the entire error variance. We employ the Hausman statistic to select the preferred model, random effects or fixed effects.
Trend Analysis of Time Variant Drivers
Based on the outputs of the random effects panel model, we enrich the analysis by evaluating fires and conflicts over time, key dynamic determinants with high temporal resolution to highlight their impacts on forest condition in space and time. We provide two analyses to demonstrate approaches to support management efforts such as targeting fire suppression activities or where resources could be allocated to reduce armed conflicts.
We assess trends over time using the Mann Kendall trend (M-K test) statistic (Mann, 1945; Kendall, 1975) to identify areas where frequency of fires and conflicts are significantly increasing or decreasing. We apply the space-time modeling tools available within ArcGIS Pro 2.7 (ESRI, 2020) using the same units as the panel data. For the case of fires, we use daily data acquired from 2002 to 2020 from FIRMS, summarized within each unit over 4 month time bins, and assess trend using the M-K test statistic. We perform the same analysis with the ACLED database of conflict locations from 2000 to 2020, applying the same temporal window of 4 months (which is selected automatically by the software based on the distribution of data in time) and using the 25 km2 grid unit.
Results
The spatial correlogram indicated that spatial autocorrelation of the dependent variable approaches zero at ~50 km. Thus, we settled on the second order rook contiguity neighborhood as the structure for the spatial weights matrix (in analogy to a chess board, all grid cells that share a common border are considered neighbors, as well as the neighbors of the neighbors). Models using queen contiguity (common borders and common vertices) case did not significantly change model outputs. We did not detect substantial multicollinearity with all Pearson correlations below 0.4 (Table 3).
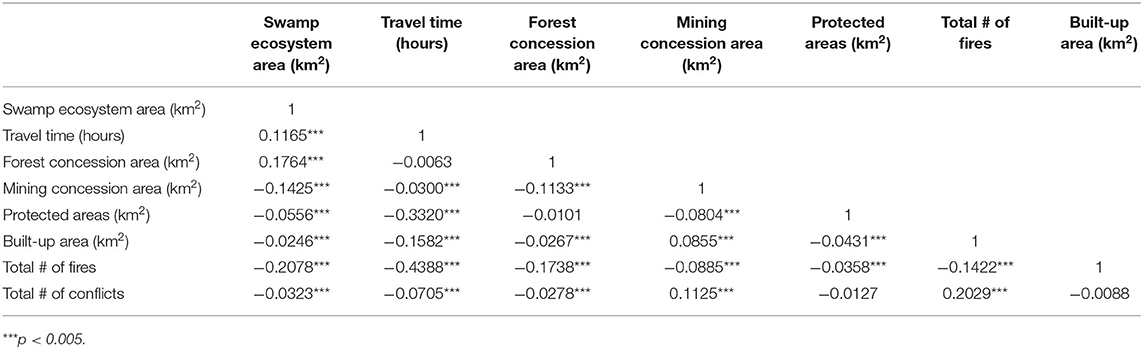
Table 3. Pearson correlation matrix of independent variables.
The results of the random and fixed effects models without and with spatial lags are presented in Table 4. Because we use a linear model with no interactions and FC is measured in percentage, the coefficients can effectively be interpreted as margins, meaning that for a unit increase in the independent variable, the coefficient informs the associated %change in mean FC of the unit. In all models the estimate for rho approaches one, meaning that nearly all the variance is described by differences across time, the highest rho is observed in the fixed effects model with spatial lags. The coefficient directions are mostly consistent between models, with the exception of protected areas and mining, which have opposite coefficients in the models with spatial lags. R2 are higher for random effects models than fixed effects.
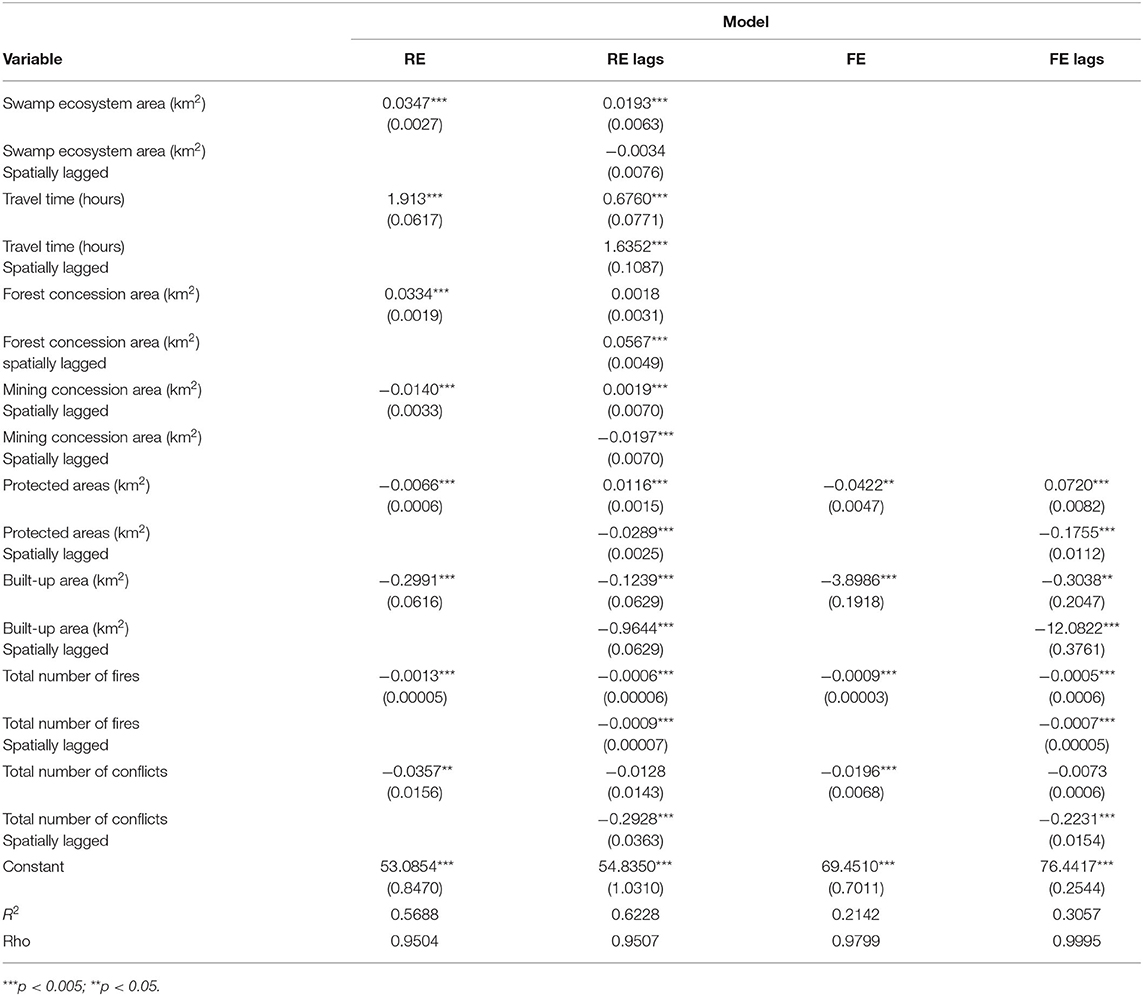
Table 4. Results of random effects (RE), RE with lags, and fixed effects (FE), FE with lags.
In the random effects models, a greater presence of swamp forest, higher travel time (lower accessibility) and greater coverage of forest concessions are associated with increases in mean FC. Mining concessions are negatively correlated when assessed without its spatial lag; when the lag is included the coefficient is positive, and the lag has a larger, negative coefficient indicating that mining concessions in the neighboring areas are reducing FC more than those in the local neighborhood. Protected areas have an unexpected negative effect on mean FC in models without include spatial lags, however when the spatial lag is present the locally estimated variable is positively correlated with FC while the effect of the neighborhood is negative, indicating potential displacement of disturbances. The increase in built-up area, number of fires, and conflicts all are associated with lower forest condition, along with their spatial lags which all have higher impact on FC. The % built-up variable is associated with the largest per unit decrease in FC.
For the fixed effects models, all variable coefficients are significant at the 0.05% significance level. Once again the protected variable has an opposite sign as expected, and a reverse coefficient when the spatial lag is considered. Built-up area, fires and conflicts have significant negative correlation with mean FC and built-up area has the highest per area unit effect. With the inclusion of the spatial lag, the coefficient for conflicts lower, while conflicts in the neighboring area have a stronger negative effect on FC. In the model with spatial lags, an increase in fires results in lower FC, and neighboring cells have a smaller relative impact. The total conflicts in the neighborhood have a greater influence on FC than the non-spatially lagged variable, indicating that an increase in conflicts has a further reaching effect in neighboring areas.
The Hausman test was significant at the 0.005 level, therefore we reject the null hypothesis and use the fixed effects model including spatial lags with higher goodness of fit measures for our major assessments and conclusions.
Temporal Trends of Fire and Conflict
Having addressed the importance of spatially and temporally variant determinants vs. static ones, we use the high temporal resolution of two dynamic variables to determine where they are changing over time to demonstrate the importance of time variant variables and the resulting policy implications. Conflicts and fires are the variables with the highest temporal resolution, and we determine where the greatest increases in fires and conflicts are occurring. The trends of these variables appear to be clearly spatially divergent (Figure 6).
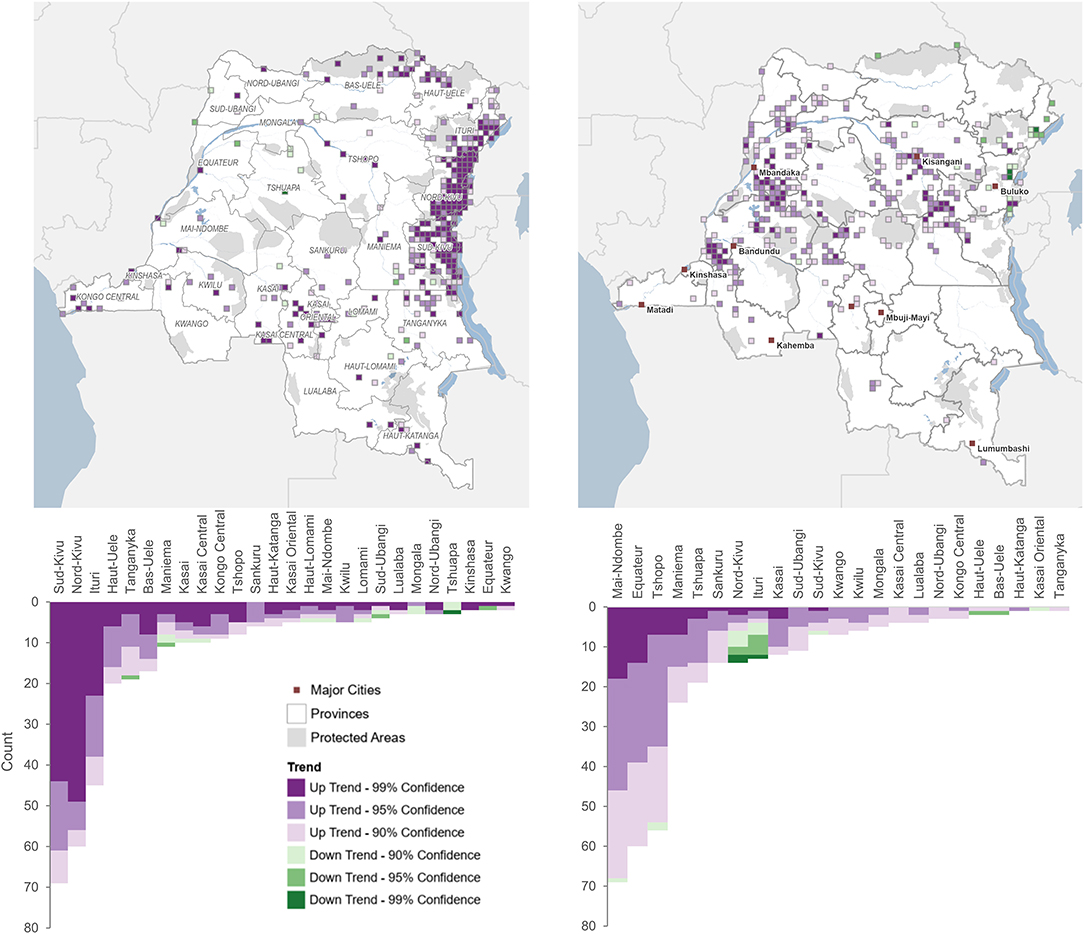
Figure 6. Trends in conflicts (left) and fires (right) assessed by Mann-Kendall trend analysis.
Whereas, conflicts and fires were both shown to be negatively correlated with FC, we note that these variables are increasing in opposite regions of the country. Conflicts are notably present in the eastern DRC and have been increasing in the last two decades, most importantly in North and South Kivu and Ituri province overlapping with protected areas in the eastern region. We note a different pattern of changes in fire frequency, which is decreasing in these three eastern provinces, but increasing in Tshopo in the central cuvette, and Mai-Ndombe and Equateur in the western regions. Future research could explore a potential interaction between these variables, where a greater number of conflicts could be causing a reduction in fires.
Discussion
The proximate causes and spatial determinants of forest disturbance and degradation have been often identified in the literature but are rarely quantitatively assessed. We provide a spatial panel analysis of drivers of FC, an index of forest degradation in the DRC using both time variant and time invariant variables to assess their relative impacts in time and space. We also assess the synergistic effects of variables and in concert with the spatial neighborhood to determine the potential impacts of neighbors. This provides important insight into the patterns and direct causes of forest disturbance, including the further reaching impacts of some drivers, the potential leakage or displacement of impacts by direct threats or land uses, and informs interventions or policies related to proximal drivers.
A greater area of swamp ecosystem could effectively be serving as a natural barrier to anthropogenic disturbance locally. However, an increased swamp area in neighboring areas may be displacing these threats. The Congo Basin peatland system is the most extensive swamp system in the world and largely forested and by nature difficult to penetrate due to peat depth (Dargie et al., 2017). There are few inhabitants directly in swamp forests. Forest clearing activities are more cost effective in terra firme forests, meaning most impacts in swamp ecosystems are currently limited to small scale sustainable uses (Dargie et al., 2019). Therefore, human activities are expected to be more present in areas neighboring swamp ecosystems. The addition of the spatially lagged swamp area variable to our models indicate that the natural protection of swamps is local, displaying pressure on forests in areas neighboring to swamp ecosystems. This concept of protection might not be permanent, as the effects of climate change are expected to increase accessibility and pave the way for more logging to feed increasing demand for resources. The presence of large oil and gas concessions and some forest concessions in these peatlands are raising alarms within the conservation community as these are directly threatening vast carbon reserves and extraordinary biodiversity, although these remain at the moment mostly inactive (Miles et al., 2017). A portion of these swamp forests were placed under formal protection in 2011 (Pélissier et al., 2019), which could prevent them from being exploited.
While swamp forests might afford natural protection, the assessment of formally established protected areas as a spatial determinant of FC is not as clear. Without considering the effect of the spatial neighborhood, the presence of protected areas is unexpectedly negatively correlated with FC. This could be explained by the context of protected areas in DRC. First, the establishment of protected areas in DRC were implemented to represent different ecotypes and protect major faunal population (Inogwabini et al., 2005), which means they often are located in intact, inaccessible locations, as demonstrated by the positive correlation (Pearson correlation coefficient: −0.33) of protected areas with travel time (Table 3). Although we have temporal data for protected areas, and several new protected areas were established in the middle of the study period (Figure 4) the positive effects of protection could take many more years to materialize into increased FC. Protected areas in DRC also face a difficult history, where in some locations, implementation with support of local and indigenous communities and increased militarization has limited their acceptance and effectiveness (Duffy et al., 2019). Additionally, protected areas can be targets for rebel and armed groups who seek to profit from natural resources or poaching activities and illegal trade of ivory (Draulans and Van Krunkelsven, 2002). The Virungas National Park for example is one of the oldest parks in Africa, and remains at the center of one of the longest armed conflicts on the continent and throughout recent years has served as a base and hub for a variety of rebel groups. All of these issues are exacerbated by critical underfunding, which can significantly reduce effectiveness (Inogwabini et al., 2005). With the inclusion of the spatial neighborhood, we find a weak positive impact of protected area, with a greater negative effect from surrounding protected area. This could show that in the context of a larger area, protected areas might displace disturbances to 25–50 km beyond their borders, where they can attract development and similar activities when local communities benefit from protected areas, or use its resources, indicating a potential leakage effect (Sabuhoro et al., 2017; Bernhard et al., 2020).
Many forests remain unexploited inside forest concessions (for example swamp as described above), therefore the positive impact of timber concessions on FC is not entirely illogical. While industrial timber extraction remains a major threat to forests around the world, this pressure is actually lower in Africa (Kissinger et al., 2012; Megevand, 2013). The DRC has the lowest timber production of all Congo Basin nations, despite having the largest forest area (de Wasseige et al., 2012) which is a result of conflicts, political instability, and lack of access and transport (Tchatchou et al., 2015). There are few large clear-cutting activities, logging is primarily selective, and damage is limited to areas around logging roads which can often quickly regenerate (Zhuravleva et al., 2013). It is suggested that most logging activities in DRC are illegal (Lawson, 2014), and could therefore be outside of identified concessions, several of which are in defiance of a 2002 moratorium on new forest concessions to re-assess their legality, a factor compounded by major weaknesses in governance.
We find mining concessions to negatively correlate with FC, but when considered along with its spatial lags, the reverse correlation exists where the area of local mining concessions is positively correlated with a decrease in FC, while the spatial neighborhood is positively correlated. In the context of all forest changes observed in the region, mining is considered a rare forest disturbance driver (Tyukavina et al., 2018). Large-scale mining operations tend to be older and resulted in deforestation before the time period addressed in this study. This suggests that current mining activities are less actively causing deforestation or degradation (Putzel et al., 2011). Larger established mining concessions also tend to be associated with higher security (Hönke, 2009), which can displace artisanal or illegal extractive activities into the spatial neighborhood of our analysis. It should also be noted that this variable does not include artisanal mining, or activities which might be pushed outside concession boundaries. Unfortunately, the only available datasets for artisanal mining are not based on consistent remote sensing and are biased in terms of location and time of detection.
Most of the forest disturbance in DRC is due to small scale agricultural activities dominated by shifting cultivation, which can be difficult to discern in satellite imagery (Tyukavina et al., 2018). The travel time, built-up, and fire variables support the assessment of human activities related to agriculture as these are associated with repeated fire and ease of access (Morton et al., 2008). Our data supports the results of Molinario et al. (2020) which determine that shifting cultivation is the major cause of primary forest loss in the DRC via slash and burn activities, with strong effects of proximity to industrial activities. We identify this via the presence of larger built-up areas (roads, paths, settlements) which are associated with expansion of the rural complex, and is quantified here by reduced FC in the 25 × 25 km area. Built-up areas are indicative of greater population presence, which incurs greater demand on local resources – and per square kilometer of developed area has the largest impact on FC. However, population density plays a role, and potentially at a greater scale than the local neighborhood assessed here, although few reliable recent census data exist for DRC. For large cities, the relative influence of the large capital city is difficult to quantify, but Kinshasa, with its large population is still reliant on charcoal for energy, coupled with a large appetite for bushmeat that can impact forests well-beyond the area of our estimated spatial neighborhood, especially as more roads facilitate wider access (Behrendt et al., 2013). Larger cities might be located closer to forests that are already degraded, and easier to further disturb, while smaller urban centers could be feeding both local demand and larger urban centers (Molinario et al., 2015). The lack of detailed population data make the evaluation of human density difficult to untangle. The model results suggest that the impact of developing one square kilometer of area for human use on FC (−0.12) is 10 times larger than protecting the same area (0.01).
The presence of conflicts can affect forests in several ways, notably through higher pressure on forests for energy resources such as charcoal, increased illegal logging, mining and hunting (de Merode et al., 2007). Similar to Butsic et al. (2015), we find conflicts to be associated with forest disturbances resulting in lower FC, and the spatial neighborhood has an effect as well. This result is expected and can be explained by internal displacement of citizens fleeing unrest and threats, as is often the case in the Kivu provinces. The number of IDPs in the DRC is estimated to be over 5 million (UNHCR, 2020), and many more are known to seek refuge from armed groups in forests, resulting in increased wildlife poaching and deforestation as a result of this insecurity (Draulans and Van Krunkelsven, 2002; Nackoney et al., 2014). Peaks in violent events with increased violence against civilians occurred between 2009 and 2014 (Figure 3). Refugee influxes to neighboring Uganda and Rwanda also spiked in 2016/17, which correlates with the significant upward trend in conflicts in Nord Kivu (UNHCR, 2020). Unfortunately, the effects of conflicts can be long lasting on forests, whether via disturbance or the long-term effects of reduced faunal populations from overhunting of bushmeat which affect natural regeneration (Harrison, 2011; Nasi et al., 2011; Nackoney et al., 2014). The presence of armed conflicts in and around protected areas can affect their effectiveness, which is a result of the complex impact of institutions, and lack of resources (de Merode et al., 2007), indicating another potential interaction explored by Butsic et al. (2015).
Including spatially lagged elements to our models provides additional perspective on the far-reaching effects of some determinants. Higher travel time or lower accessibility of neighboring areas indicates a potential functional protection - whereby forests are protected simply by their inaccessibility by road, waterway, and land cover type. For example, an increase of 1 h of accessibility increases mean forest condition by more than 1.5%. This could speak to engaging the responsibility of forest concessionaires to limit access to newly opened logging roads, which can be more effective in limiting access than protected areas (Sheil et al., 2010) but at the same time could increase conflicts with local populations and therefore should be addressed with caution. Limited accessibility in the neighborhood might also imply that the target cell is less connected to larger cities or markets. The spatial lags of mining concessions and protected areas were shown to have the opposite impacts of the target cell. In the case of protected areas, the negative correlation, which is explained above, with a low positive coefficient of neighboring areas could bring some good news for the wider reaching impacts of protected areas.
The influence of the neighborhood is key in identifying appropriate policies or interventions and this relationship can be complex, as local decisions depend on the characteristics and processes of neighboring areas, and policies themselves can have positive or negative spillover effects (Robalino and Pfaff, 2012; Delacote et al., 2016). Considering the predominant subsistence agriculture, land-use decisions that result in forest degradation are often made at the household or community levels. Payments for ecosystem services (PES) can provide successful means to reduce impacts on forests through economic incentives, however this needs to be compatible with prevailing land tenure situations and promote participation, inclusion and compatibility with local livelihood structures (Barbier and Tesfaw, 2012). Leakage, or the spatial displacement of activities due to implementation of policies can affect overall policy success. Our study shows a strong impact of neighboring areas on local forest condition, indicating the need to consider local interactions for the strategic establishment of policies or activities (Robalino and Pfaff, 2012).
Our study period pre-dates most of the PES efforts and mitigations in DRC, notably via REDD+ projects, which enables us to establish a historical assessment of drivers and an understanding of the proximal causes and means to detect forest degradation. We cannot address every possible proximate or underlying driver, but specifically those that can be monitored over time in order to enable prediction or indicators of upcoming forest disturbance. If we consider the proposal by Combes Motel et al. (2009) to compensate countries for their deforestation efforts, while separating structural factors (essentially exogenous variables such as market forces) from enacted policies, our approach is complementary, in that it allows to determine the impact of these policies. For example, if a forest conservation activity is established, we can determine whether that activity is associated with increased forest condition, reduced development, while controlling for spillovers from neighboring areas. Yet, many of these so-called structural economic variables are difficult to measure consistently for the DRC, and there are clear elements which can potentially blur the effective establishment of PES schemes. Examples include corruption, lack of participation, leakage, political instability, de-centralized political structures and lack of adequate reporting – which are difficult to subjectively evaluate. In order for PES to be successful there needs to be a robust assessment on the quality of policies, for example, that ensure transparency, social safeguards of these institutions (Chhatre et al., 2012), and a clear evaluation of whether the policies are effective in slowing the course of deforestation. There also needs to be a clear understanding of context and current trends and the establishment of accurate reference levels (Angelsen and Wertz-Kanounnikoff, 2008).
Applying both the random and fixed models demonstrates the importance of integrating time variant variables in our assessment. The proximate causes and spatial determinants of forest disturbance are not stable in time but change along with other exogenous influences including climate, politics, or pandemics. Kengoum Djiegni et al. (2020) lament the fact that an up-to-date drivers analysis, potentially including relative impacts and spatial pattern was missing from the development of the national forest reference emissions level (FREL) in 2018. This spatial panel approach and in particular the comparison of both random and fixed effects model provides a useful mechanism to assess the relative impacts of drivers, combining both time variant and invariant datasets to assess the risk of forest degradation, which can be updated over time as new data become available. This is important to determine where specific interventions should be put in place, and prioritize the best use of limited funds.
To properly inform land use policies or interventions and to target resources we need to evaluate the covariates individually over time and space, which is particularly important in a vast country such as the DRC. We assess the trends of fires and conflicts over a time period extending beyond the statistical modeling and note that these two variables diverge spatially - there is an increased risk of forest degradation related to armed conflicts in the east, where fires are decreasing. Meanwhile fire frequency is increasing in the central cuvette and western portion of the country, potentially threatening emissions reductions programs and swamp forest ecosystems. This speaks directly to the importance of contextual information to guide use policies to drive change and spatially targeted approaches and interventions (Tegegne et al., 2016). In the example of REDD+ interventions, reduction of fires in the context of agricultural practices are a critical factor to be addressed to secure and manage forest carbon (Barlow et al., 2012). The information provided here can be used to design emissions reduction interventions related to fire that focus on high-risk areas (Holdsworth and Uhl, 1997) by promoting fire reduction or sustainable, managed or improved charcoal or biofuels for local energy needs (Megevand, 2013; Schure et al., 2014).
A number of uncertainties limit our analysis. The FC metric is dependent on accurate forest and biomass maps, which surely have a level of inherent error. The global tree cover change product used to identify loss at edges focuses on identifying tree cover loss but does not consider natural and anthropogenic regeneration, which could be occurring. New available datasets such as the Tropical Moist Forests (TMF) product from Vancutsem et al. (2021) which include both deforestation and degradation could provide opportunities for additional evaluation. Due to the nature of the tree cover loss product, the forest condition metric also includes naturally caused forest changes, although from a remote sensing perspective the causes of forest disturbance are practically impossible to separate. The increase in observed conflicts over time could also be influenced by the increase in social media and connectivity, which increases the potential information shared and reported on conflicts in recent years, more than in earlier years. We have demonstrated the importance of spatial neighborhood, but our models effectively end at the international border. Clearly, activities and varying threats in neighboring countries are going to influence Congolese forests, and these are only touched upon here. Our approach is transferable and scalable with readily available data for these identified proximate drivers and allows to contrast the impacts of land use policies: protected areas, forest concessions or development in neighboring countries or regions.
We did not include climate factors due to the coarseness of available datasets, although differences in rainfall and temperature could drive different types and trends of agricultural expansion. Next, the size of the grid unit might influence the outputs of the model. The size we selected, resulting in nearly 3,000 units, is well below the scale of the smallest administrative unit. Finally, additional variables could improve the model, including an evaluation of the threat of bushmeat hunting. The presence of certain crop types, or socio-economic variables are unfortunately difficult to spatially quantify at this scale of analysis. Spatially explicit information on poverty indices, reliance on natural energy sources, information related to diets or the structure of local economies would be very valuable to assess the impacts on forests, but is only mostly available at national scale (Bawa and Dayanandan, 1997). This could be assessed in more depth via future studies using recently-implemented national household survey approaches.
Conclusions
The proximate causes and spatial determinants of forest disturbance vary greatly in time and space, particularly in a diverse and vast country like the DRC. Therefore, to successfully safeguard forests and the people who depend on them, we need spatially targeted interventions that are informed by sub-national context. Especially considering limited financial resources for conservation, land management activities and interventions need to be implemented where they can be most successful. The increase in fire frequency in the central and western parts of the country, which are also heavily forested, should indicate the need to change where fire suppression activities are targeted. This can support the implementation of renewable energy for households or programs that reduce dependence on charcoal.
The importance of spatial neighborhoods for many spatial determinants are not only important at the local level, but also inform transboundary considerations. Multi-lateral agreements between neighboring countries to improve coordination and diplomacy, particularly in the face of moving threats is essential. Though once again, context varies. While some regions in Africa are successfully addressed by “Peace Parks,” which employ protected areas as a form of peacebuilding, their location and historical context remains important. While peace tourism might be fruitful in some areas, the realities in the eastern DRC are more complicated and currently muddled by increased militarization to protect tourists (Trogisch and Fletcher, 2020). Before we achieve both forest conservation and socioeconomic development goals for forest adjacent communities, a drastic reduction in conflicts and better security is needed. While complicated, conservation peace-building should not be rules out. This spatio-temporal approach can be replicated at various scales or extents for transboundary decision support systems to the support the implementation of these kinds of interventions.
Finally, it is clear that forest disturbances change in dynamic fashion. The COVID-19 pandemic has demonstrated that all populations, especially those on the margins of poverty, are vulnerable to global events. The trends observed in DRC show little sign of relenting, exacerbated by increases in violent events. It is increasingly clear that humans rely on nature for survival and basic needs, it is important to provide intact and resilient ecosystems to allow communities, including the impoverished to overcome more future climate and economic perturbations.
Data Availability Statement
The original contributions presented in the study are included in the article/Supplementary Material, further inquiries can be directed to the corresponding author.
Author Contributions
AS: conceptualization, data curation, methodology, formal analysis, writing original draft, writing review and editing, and visualization. KB: conceptualization, methodology, writing original draft, and writing review and editing. SZ and DM: methodology and writing review and editing. Rd'A: writing review and editing. NA-A: conceptualization and writing review and editing. All authors contributed to the article and approved the submitted version.
Conflict of Interest
The authors declare that the research was conducted in the absence of any commercial or financial relationships that could be construed as a potential conflict of interest.
Supplementary Material
The Supplementary Material for this article can be found online at: https://www.frontiersin.org/articles/10.3389/fcosc.2021.690562/full#supplementary-material
References
Aguilar-Amuchastegui, N., Riveros, J. C., and Forrest, J. L. (2014). Identifying areas of deforestation risk for REDD+ using a species modeling tool. Carbon Balance Manage. 9:10. doi: 10.1186/s13021-014-0010-5
Alesina, A., Gennaioli, C., and Lovo, S. (2019). Public goods and ethnic diversity: evidence from deforestation in Indonesia. Economica 86, 32–66. doi: 10.1111/ecca.12285
Angelsen, A., and Kaimowitz, D. (1999). Rethinking the causes of deforestation: lessons from economic models. World Bank Res. Obs. 14, 73–98. doi: 10.1093/wbro/14.1.73
Angelsen, A., and Wertz-Kanounnikoff, S. (2008). What are the key design issues for REDD and the criteria for assessing options? Center for International Forestry Research. Available online at: https://www.jstor.org/stable/resrep02104.8 (accessed June 1, 2021).
Anselin, L., and Rey, S. J. (2014). Modern Spatial Econometrics in Practice: A Guide to Geoda, Geodaspace and Pysal. Chicago, IL: GeoDa Press.
Anselin, L., Syabri, I., and Kho, Y. (2005). GeoDa: An Introduction to Spatial Data Analysis. Available online at: https://onlinelibrary.wiley.com/doi/full/10.1111/j.0016-7363.2005.00671.x (accessed March 13, 2021).
Baltagi, B. H. (2005). Econometric Analysis of Panel Data. 3rd Edn. Chichester; Hoboken, NJ: J. Wiley and Sons.
Barbier, E. B., and Tesfaw, A. T. (2012). Can REDD+ save the forest? The role of payments and tenure. Forests 3, 881–895. doi: 10.3390/f3040881
Barlow, J., Parry, L., Gardner, T. A., Ferreira, J., Aragão, L. E. O. C., Carmenta, R., et al. (2012). The critical importance of considering fire in REDD+ programs. Biol. Conserv. 154, 1–8. doi: 10.1016/j.biocon.2012.03.034
Bawa, K., and Dayanandan, S. (1997). Socioeconomic factors and tropical deforestation. Nature 386, 562–563. doi: 10.1038/386562a0
Baylis, K., Paulson, N. D., and Piras, G. (2011). Spatial approaches to panel data in agricultural economics: a climate change application. J. Agric. Appl. Econ. 43, 325–338. doi: 10.1017/S1074070800004326
Behrendt, H., Megevand, C., and Sander, K. (2013). Deforestation Trends in the Congo Basin: Reconciling Economic Growth and Forest Protection - Wood-based Biomass Energy. Africa Region, The World Bank. doi: 10.1596/978-0-8213-9742-8
Benali, A., Mota, B., Carvalhais, N., Oom, D., Miller, L., Campagnolo, M., et al. (2017). Bimodal fire regimes unveil a global-scale anthropogenic fingerprint. Glob. Ecol. Biogeography 26, 799–811. doi: 10.1111/geb.12586
Bernhard, K. P., Smith, T. E. L., Sabuhoro, E., Nyandwi, E., and Munanura, I. E. (2020). Effects of integrated conservation–development projects on unauthorized resource use in Volcanoes National Park, Rwanda: a mixed-methods spatio-temporal approach. Oryx 1, 1–12. doi: 10.1017/S0030605319000735
Bernhard, K. P., Zenobi, S., and Shapiro, A. C. (2021). Understanding and predicting socioeconomic determinants of deforestation in Vietnam's Central Annamites Landscape (CAL): pilot study implementing a spatial econometric approach. bioRxiv [Preprint]. doi: 10.1101/2021.03.18.436032
Bjørnstad, O. N., and Falck, W. (2001). Nonparametric spatial covariance functions: estimation and testing. Environ. Ecol. Stat. 8, 53–70. doi: 10.1023/A:1009601932481
Bowman, D. M. J. S., Balch, J., Artaxo, P., Bond, W. J., Cochrane, M. A., D'Antonio, C. M., et al. (2011). The human dimension of fire regimes on Earth. J. Biogeogr. 38, 2223–2236. doi: 10.1111/j.1365-2699.2011.02595.x
Burgess, R., Miguel, E., and Stanton, C. (2015). War and deforestation in Sierra Leone. Environ. Res. Lett. 10:095014. doi: 10.1088/1748-9326/10/9/095014
Butsic, V., Baumann, M., Shortland, A., Walker, S., and Kuemmerle, T. (2015). Conservation and conflict in the Democratic Republic of Congo: the impacts of warfare, mining, and protected areas on deforestation. Biol. Conserv. 191, 266–273. doi: 10.1016/j.biocon.2015.06.037
Chhatre, A., Lakhanpal, S., Larson, A. M., Nelson, F., Ojha, H., and Rao, J. (2012). Social safeguards and co-benefits in REDD+: a review of the adjacent possible. Curr. Opin. Environ. Sustain. 4, 654–660. doi: 10.1016/j.cosust.2012.08.006
Chidumayo, E. N., and Gumbo, D. J. (2013). The environmental impacts of charcoal production in tropical ecosystems of the world: a synthesis. Energy Sustain. Dev.17, 86–94. doi: 10.1016/j.esd.2012.07.004
Clionadh, R., Linke, A., Hegre, H., and Karlsen, J. (2010). Armed conflict location and event data project (ACLED) Codebook Version 8 (2017). J. Peace Res. 47, 651–660. doi: 10.1177/0022343310378914
Cochrane, M. A. (2001). Synergistic interactions between habitat fragmentation and fire in evergreen tropical forests. Conserv. Biol. 15, 1515–1521. doi: 10.1046/j.1523-1739.2001.01091.x
Combes Motel, P., Pirard, R., and Combes, J.-L. (2009). A methodology to estimate impacts of domestic policies on deforestation: compensated successful efforts for “avoided deforestation” (REDD). Ecol. Econ. 68, 680–691. doi: 10.1016/j.ecolecon.2008.06.001
Corbane, C., Florczyk, A., Pesaresi, M., Politis, P., and Syrris, V. (2018). GHS-BUILT R2018A - GHS built-up grid, derived from Landsat, multitemporal (1975-1990-2000-2014). Joint Research Centre, European Commission.
Corbane, C., Pesaresi, M., Politis, P., Syrris, V., Florczyk, A. J., Soille, P., et al. (2017). Big earth data analytics on Sentinel-1 and Landsat imagery in support to global human settlements mapping. Big Earth Data 1, 118–144. doi: 10.1080/20964471.2017.1397899
da Fonseca, G. A. B., Rodriguez, C. M., Midgley, G., Busch, J., Hannah, L., and Mittermeier, R. A. (2007). No forest left behind. PLoS Biol. 5:e216. doi: 10.1371/journal.pbio.0050216
Dargie, G. C., Lawson, I. T., Rayden, T. J., Miles, L., Mitchard, E. T. A., Page, S. E., et al. (2019). Congo Basin peatlands: threats and conservation priorities. Mitig. Adapt. Strat. Glob. Change 24, 669–686. doi: 10.1007/s11027-017-9774-8
Dargie, G. C., Lewis, S. L., Lawson, I. T., Mitchard, E. T. A., Page, S. E., Bocko, Y. E., et al. (2017). Age, extent and carbon storage of the central Congo Basin peatland complex. Nature 542, 86–90. doi: 10.1038/nature21048
Daskin, J. H., and Pringle, R. M. (2018). Warfare and wildlife declines in Africa's protected areas. Nature 553, 328–332. doi: 10.1038/nature25194
de Merode, E., Smith, K. H., Homewood, K., Pettifor, R., Rowcliffe, M., and Cowlishaw, G. (2007). The impact of armed conflict on protected-area efficacy in Central Africa. Biol. Lett. 3, 299–301. doi: 10.1098/rsbl.2007.0010
de Wasseige, C., Marcken, P., Bayol, N., Hiol, F., Mayaux, P., Desclée, B., et al. (2012). The Forests of the Congo Basin – State of the Forest 2010. Publication Office of the European Union.
de Wasseige, C., Tadoum, M., Eba'a Atyi, R., and Doumenge, C. (2015). Forests of the Congo Basin: forests and climate change. Belgium: Weyrich.
Defourny, P., Delhage, C., and Lubamba, J.-P. K. (2011). Analyse quantitative des causes de la deforestation et de la degradation des forêts en RDC. Louvain-la-Neuve: Université catholique de Louvain.
DeFries, R. S., Foley, J. A., and Asner, G. P. (2004). Land-use choices: balancing human needs and ecosystem function. Front. Ecol. Environ. 2, 249–257. doi: 10.1890/1540-9295(2004)002[0249:LCBHNA]2.0.CO;2
Delacote, P., Robinson, E. J. Z., and Roussel, S. (2016). Deforestation, leakage and avoided deforestation policies: a spatial analysis. Resour. Energy Econ. 45, 192–210. doi: 10.1016/j.reseneeco.2016.06.006
Draulans, D., and Van Krunkelsven, E. (2002). The impact of war on forest areas in the Democratic Republic of Congo. Oryx 36, 35–40. doi: 10.1017/S0030605302000066
Duffy, R., Massé, F., Smidt, E., Marijnen, E., Büscher, B., Verweijen, J., et al. (2019). Why we must question the militarisation of conservation. Biol. Conserv. 232, 66–73. doi: 10.1016/j.biocon.2019.01.013
Edwards, D. P., Sloan, S., Weng, L., Dirks, P., Sayer, J., and Laurance, W. F. (2014). Mining and the African environment. Conserv. Lett. 7, 302–311. doi: 10.1111/conl.12076
Elhorst, J. (2010). “Spatial panel data models,” in Handbook of Applied Spatial Analysis, eds M. M. Fischer and A. Getis (Berlin, Heidelberg: Springer), 377–407. doi: 10.1007/978-3-642-03647-7_19
FAO (2020). Global Forest Resources Assessment 2020. Rome: Food and Agricultural Organization of the United Nations.
Ferretti-Gallon, K., and Busch, J. (2014). What drives deforestation and what stops it? A meta-analysis of spatially explicit econometric studies. SSRN Electr. J. 11:2458040. doi: 10.2139/ssrn.2458040
Foley, J., Asner, G. P., Costa, M. H., Coe, M. T., Gibbs, H. K., Howard, E., et al. (2007). Amazonia revealed : forest degradation and the loss of ecosystem goods and services in the Amazon Basin. Front. Ecol. Environ. 5, 25–32. doi: 10.1890/1540-9295(2007)5[25:ARFDAL]2.0.CO;2
Forrest, J., Mascia, M., Pailler, S., Abidin, S., Araujo, M., Krithivasan, R., et al. (2014). Tropical deforestation and carbon emissions from protected area downgrading, downsizing, and degazettement (PADDD). Conserv. Lett. 8:12144. doi: 10.1111/conl.12144
Geist, H., and Lambin, E. (2002). Proximate causes and underlying driving forces of tropical deforestation. Bioscience 52, 143–150. doi: 10.1641/0006-3568(2002)052[0143:PCAUDF]2.0.CO;2
Gerwing, J. J. (2002). Degradation of forests through logging and fire in the eastern Brazilian Amazon. For. Ecol. Manage. 157, 131–141. doi: 10.1016/S0378-1127(00)00644-7
Giglio, L., Schroeder, W., and Justice, C. O. (2016). The collection 6 MODIS active fire detection algorithm and fire products. Remote Sens. Environ. 178, 31–41. doi: 10.1016/j.rse.2016.02.054
Giri, C., Ochieng, E., Tieszen, L. L., Zhu, Z., Singh, A., Loveland, T., et al. (2011). Status and distribution of mangrove forests of the world using earth observation satellite data. Glob. Ecol. Biogeography 20, 154–159. doi: 10.1111/j.1466-8238.2010.00584.x
Gorelick, N., Hancher, M., Dixon, M., Ilyushchenko, S., Thau, D., and Moore, R. (2017). Google Earth Engine: planetary-scale geospatial analysis for everyone. Remote Sens. Environ. 202, 18–27. doi: 10.1016/j.rse.2017.06.031
Grantham, H. S., Shapiro, A., Bonfils, D., Gond, V., Goldman, E., Maisels, F., et al. (2020). Spatial priorities for conserving the most intact biodiverse forests within Central Africa. Environ. Res. Lett. 15:0940b095. doi: 10.1088/1748-9326/ab9fae
Griscom, B. W., Adams, J., Ellis, P. W., Houghton, R. A., Lomax, G., Miteva, D. A., et al. (2017). Natural climate solutions. Proc. Natl. Acad. Sci. U. S. A. 114, 11645–11650. doi: 10.1073/pnas.1710465114
Griscom, B. W., Busch, J., Cook-Patton, S. C., Ellis, P. W., Funk, J., Leavitt, S. M., et al. (2020). National mitigation potential from natural climate solutions in the tropics. Phil. Trans. R. Soc. B 375:20190126. doi: 10.1098/rstb.2019.0126
Hansen, M. C., Potapov, P. V., Moore, R., Hancher, M., Turubanova, S. A., Tyukavina, A., et al. (2013). High-resolution global maps of 21st-century forest cover change. Science 342, 850–853. doi: 10.1126/science.1244693
Harrison, R. D. (2011). Emptying the forest: hunting and the extirpation of wildlife from tropical nature reserves. Bioscience 61, 919–924. doi: 10.1525/bio.2011.61.11.11
Holdsworth, A. R., and Uhl, C. (1997). Fire in Amazonian selectively logged rain forest and the potential for fire reduction. Ecol. Appl. 7, 713–725. doi: 10.1890/1051-0761(1997)007[0713:FIASLR]2.0.CO;2
Hönke, J. (2009). Transnational pockets of territoriality. Governing the security of extraction in Katanga (DRC). Universität Leipzig Working Paper Series 2, 28.
Hosonuma, N., Herold, M., De Sy, V., De Fries, R. S., Brockhaus, M., Verchot, L., et al. (2012). An assessment of deforestation and forest degradation drivers in developing countries. Environ. Res. Lett. 7, 044009–044031. doi: 10.1088/1748-9326/7/4/044009
Humphreys, M., Sachs, J., and Stiglitz, J. E. (2007). Escaping the resource curse. Columbia University Press. Available online at: https://www.jstor.org/stable/10.7312/hump14196 (accessed July 4, 2018).
Hund, K., Megevand, C., Preira Gomes, E., Miranda, M., and Reed, E. (2013). Deforestation Trends in the Congo Basin. Working Paper: Mining. Africa Region, The World Bank.
Inogwabini, B.-I., Ilambu, O., and Gbanzi, M. A. (2005). Protected areas of the Democratic Republic of Congo. Conserv. Biol. 19, 15–22. doi: 10.1111/j.1523-1739.2005.00181.x
Jiang, Y., Zhou, L., and Raghavendra, A. (2020). Observed changes in fire patterns and possible drivers over Central Africa. Environ. Res. Lett. 15:0940b098. doi: 10.1088/1748-9326/ab9db2
Juárez-Orozco, S. M., Siebe, C., and Fernández y Fernández, D. (2017). Causes and effects of forest fires in tropical rainforests: a bibliometric approach. Trop. Conserv. Sci. 10:194008291773720. doi: 10.1177/1940082917737207
Kengoum Djiegni, F., Thuy, P., Moeliono, M., Dwisatrio, B., and Sonwa, D. (2020). The Context of REDD+ in the Democratic Republic of Congo Drivers, Agents and Institutions. 2nd Edn. Bogor: CIFOR.
Kissinger, G., Herold, M., and De Sy, V. (2012). Drivers of Deforestation and Forest Degradation: A Synthesis Report for REDD+ Policymakers. Vancouver: Lexeme Consulting.
Lambin, E. F., and Meyfroidt, P. (2011). Global land use change, economic globalization, and the looming land scarcity. Proc. Natl. Acad. Sci. U. S. A. 108, 3465–3472. doi: 10.1073/pnas.1100480108
Laudati, A. (2013). Beyond minerals: broadening ‘economies of violence' in eastern Democratic Republic of Congo. Rev. Afr. Polit. Econ. 40, 32–50. doi: 10.1080/03056244.2012.760446
Lawson, S. (2014). Illegal Logging in the Democratic Republic of the Congo. London: Chatham House 29.
Leberger, R., Rosa, I. M. D., Guerra, C. A., Wolf, F., and Pereira, H. M. (2020). Global patterns of forest loss across IUCN categories of protected areas. Biol. Conserv. 241:108299. doi: 10.1016/j.biocon.2019.108299
Lele, S. (2009). Watershed services of tropical forests: from hydrology to economic valuation to integrated analysis. Curr. Opin. Environ. Sustain. 1, 148–155. doi: 10.1016/j.cosust.2009.10.007
Lewis, S. L., Edwards, D. P., and Galbraith, D. (2015). Increasing human dominance of tropical forests. Science 349, 827–832. doi: 10.1126/science.aaa9932
Machlis, G. E., and Hanson, T. (2008). Warfare ecology. Bioscience 58, 729–736. doi: 10.1641/B580809
Malhi, Y., Aragao, L. E. O. C., Galbraith, D., Huntingford, C., Fisher, R., Zelazowski, P., et al. (2009). Exploring the likelihood and mechanism of a climate-change-induced dieback of the Amazon rainforest. Proc. Natl. Acad. Sci. U. S. A. 106, 20610–20615. doi: 10.1073/pnas.0804619106
Mann, H. B. (1945). Nonparametric tests against trend. Econometrica 13, 245–259. doi: 10.2307/1907187
Marien, J. N. (2009). “Peri-urban forests and wood energy: what are the perspectives for Central Africa,” in The Forests of the Congo Basin—State of the Forest 2008, eds C. de Wasseige, P. de Marcken, N. Bayol, F. Hiol Hiol, Ph. Mayaux, B. Desclée, et al. (Luxembourg: Publications Office of the European Union), 209–221.
McNeely, J. A. (2003). Conserving forest biodiversity in times of violent conflict. Oryx 37, 142–152. doi: 10.1017/S0030605303000334
Megevand, C. (2013). Deforestation Trends in the Congo Basin: Reconciling Economic Growth and Forest Protection. Washington, DC: The World Bank.
Miles, L., Ravilious, C., García-Rangel, S., de Lamo, X., Dargie, G., and Lewis, S. (2017). Carbon, biodiversity and land-use in the Central Congo Basin Peatlands. Cambridge: UNEP-WCMC.
Molinario, G., Hansen, M., Potapov, P., Tyukavina, A., and Stehman, S. (2020). Contextualizing Landscape-Scale Forest Cover Loss in the Democratic Republic of Congo (DRC) between 2000 and 2015. Land 9:23. doi: 10.3390/land9010023
Molinario, G., Hansen, M. C., and Potapov, P. V. (2015). Forest cover dynamics of shifting cultivation in the Democratic Republic of Congo: a remote sensing-based assessment for 2000-2010. Environ. Res. Lett. 12:15. doi: 10.1088/1748-9326/10/9/094009
Molua, E. (2019). “Global warming and carbon sequestration in Africa's forests: potential rewards for new policy directions in the Congo Basin,” in New Frontiers in Natural Resources Management in Africa. Natural Resource Management and Policy, Vol 53, eds E. Ayuk and N. Unuigbe (Cham: Springer), 59–77. doi: 10.1007/978-3-030-11857-0_5
Morton, D. C., Defries, R. S., Randerson, J. T., Giglio, L., Schroeder, W., and van der Werf, G. R. (2008). Agricultural intensification increases deforestation fire activity in Amazonia. Glob. Chang. Biol. 14, 2262–2275. doi: 10.1111/j.1365-2486.2008.01652.x
Nackoney, J., Molinario, G., Potapov, P., Turubanova, S., Hansen, M. C., and Furuichi, T. (2014). Impacts of civil conflict on primary forest habitat in northern Democratic Republic of the Congo, 1990-2010. Biol. Conserv. 170, 321–328. doi: 10.1016/j.biocon.2013.12.033
Nasi, R., Taber, A., and Van Vliet, N. (2011). Empty forests, empty stomachs? Bushmeat and livelihoods in the Congo and Amazon Basins. Int. Forest. Rev. 13, 355–368. doi: 10.1505/146554811798293872
Negret, P. J., Sonter, L., Watson, J. E. M., Possingham, H. P., Jones, K. R., Suarez, C., et al. (2019). Emerging evidence that armed conflict and coca cultivation influence deforestation patterns. Biol. Conserv. 239:108176. doi: 10.1016/j.biocon.2019.07.021
Nerfa, L., Rhemtulla, J. M., and Zerriffi, H. (2020). Forest dependence is more than forest income: development of a new index of forest product collection and livelihood resources. World Dev. 125:104689. doi: 10.1016/j.worlddev.2019.104689
OCHA (2021). République démocratique du Congo : Aperçu des besoins humanitaires 2021 (décembre 2020) - Democratic Republic of the Congo. ReliefWeb. Available online at: https://reliefweb.int/report/democratic-republic-congo/r-publique-d-mocratique-du-congo-aper-u-des-besoins-humanitaires-2 (accessed March 11, 2021).
Pearson, T. R. H., Brown, S., and Casarim, F. M. (2014). Carbon emissions from tropical forest degradation caused by logging. Environ. Res. Lett. 11:034017. doi: 10.1088/1748-9326/9/3/034017
Pearson, T. R. H., Brown, S., Murray, L., and Sidman, G. (2017). Greenhouse gas emissions from tropical forest degradation: an underestimated source. Carbon Balance Manage. 12, 1–11. doi: 10.1186/s13021-017-0072-2
Pélissier, C., de Marcken, P., Cherel, E., and Mapilanga, J. (2019). Le réseau des aires protégées de la République démocratique du Congo : Évaluation pour sa consolidation et son extension. WWF and ICCN ICCN, WWF.
Pesaresi, M., Ehrlich, D., Ferri, S., Florczyk, A. J., Freire, S., Halkia, M., et al. (2016). Operating procedure for the production of the Global Human Settlement Layer from Landsat data of the epochs 1975, 1990, 2000, and 2014. Publications Office of the EU.
Philippon, N., Cornu, G., Monteil, L., Gond, V., Moron, V., Pergaud, J., et al. (2018). The light-deficient climates of western Central African evergreen forests. Environ. Res. Lett. doi: 10.1088/1748-9326/aaf5d8
Putzel, L., Assembe-Mvondo, S., Ndong, L. B. B., Banioguila, R. P., Cerrutti, P. O., Tieguhong, J. C., et al. (2011). Chinese trade and investment and the forests of the Congo Basin: Synthesis of scoping studies in Cameroon, Democratic Republic of Congo and Gabon. Center for International Forestry Research (CIFOR), Bogor, Indonesia
Ramo, R., Roteta, E., Bistinas, I., Wees, D., van Bastarrika, A., Chuvieco, E., et al. (2021). African burned area and fire carbon emissions are strongly impacted by small fires undetected by coarse resolution satellite data. PNAS 118:e2011160118. doi: 10.1073/pnas.2011160118
Robalino, J. A., and Pfaff, A. (2012). Contagious development: neighbor interactions in deforestation. J. Dev. Econ. 97, 427–436. doi: 10.1016/j.jdeveco.2011.06.003
Sabuhoro, E., Wright, B., Munanura, I. E., Nyakabwa, I. N., and Nibigira, C. (2017). The potential of ecotourism opportunities to generate support for mountain gorilla conservation among local communities neighboring Volcanoes National Park in Rwanda. J. Ecotour. 20, 1–17. doi: 10.1080/14724049.2017.1280043
Schure, J., Levang, P., and Wiersum, K. F. (2014). Producing woodfuel for urban centers in the Democratic Republic of Congo: a path out of poverty for rural households? World Dev. 64, S80–S90. doi: 10.1016/j.worlddev.2014.03.013
Shapiro, A. C., Aguilar-Amuchastegui, N., Hostert, P., and Bastin, J. F. J.-F. (2016). Using fragmentation to assess degradation of forest edges in Democratic Republic of Congo. Carbon Balance Manage. 11:11. doi: 10.1186/s13021-016-0054-9
Shapiro, A. C., Grantham, H. S., Aguilar-Amuchastegui, N., Murray, N. J., Gond, V., Bonfils, D., et al. (2021). Forest condition in the Congo Basin for the assessment of ecosystem conservation status. Ecol. Indic. 122:107268. doi: 10.1016/j.ecolind.2020.107268
Sheil, D., Putz, F. E., and Zagt, R. (2010). Biodiversity Conservation in Certified Forests. Wageningen: Tropenbos International. Available online at: https://issuu.com/oalibrary/docs/etfrn_51_biodiversity_conservation_ (accessed March 27, 2021).
Siegert, F., Ruecker, G., Hinrichs, A., and Hoffmann, A. A. (2001). Increased damage from fires in logged forests during droughts caused by El Niño. Nature 414, 437–440. doi: 10.1038/35106547
Simula, M., and Mansur, E. (2011). A global challenge needing local response. Unasylva 62, 3–7. Available online at: http://www.ardot.fi/Documents_2/Unasylva%20Simula%20Mansur.pdf
Tchatchou, B., Sonwa, D. J., Anne, S. I., and Tiani, M. (2015). Deforestation and forest degradation in the Congo Basin: state of knowledge, current causes and perspectives. Bogor, Indonesia: CIFOR.
Tegegne, Y. T., Lindner, M., Fobissie, K., and Kanninen, M. (2016). Evolution of drivers of deforestation and forest degradation in the Congo Basin forests: exploring possible policy options to address forest loss. Land Use Policy 51, 312–324. doi: 10.1016/j.landusepol.2015.11.024
Trogisch, L., and Fletcher, R. (2020). Fortress tourism: exploring dynamics of tourism, security and peace around the Virunga transboundary conservation area. J. Sustain. Tour. 1–21. doi: 10.1080/09669582.2020.1857767
Tyukavina, A., Hansen, M. C., Potapov, P., Parker, D., Okpa, C., Stehman, S. V., et al. (2018). Congo Basin forest loss dominated by increasing smallholder clearing. Sci. Adv. 4:eaat2993. doi: 10.1126/sciadv.aat2993
UNHCR (2020). UNHCR appalled at rising violence against displaced in eastern DRC. UNHCR. Available online at: https://www.unhcr.org/en-in/news/briefing/2020/6/5efaeefb4/unhcr-appalled-rising-violence-against-displaced-eastern-drc.html (accessed February 28 2021).
van Wieringen, K. (2020). To counter the rationality of sexual violence: existing and potential policies against the genocidal use of rape as a weapon of war in the Democratic Republic of Congo. Int. J. Humanitarian Action 5:8. doi: 10.1186/s41018-020-00074-4
Vancutsem, C., Achard, F., Pekel, J.-F., Vieilledent, G., Carboni, S., Simonetti, D., et al. (2021). Long-term (1990–2019) monitoring of forest cover changes in the humid tropics. Sci. Adv. 7:eabe1603. doi: 10.1126/sciadv.abe1603
Vásquez-Grandón, A., Donoso, P. J., and Gerding, V. (2018). Forest degradation: when is a forest degraded? Forests 9:726. doi: 10.3390/f9110726
Vijayamohanan, P. (2016). Panel Data Analysis with Stata Part 1 Fixed Effects and Random Effects Models. Munich. Available online at: https://mpra.ub.uni-muenchen.de/76869/ (accessed March 13, 2021).
Vogt, P., Riitters, K., Estreguil, C., Kozak, J., Wade, T., and Wickham, J. D. (2007). Mapping spatial patterns with morphological image processing. Landsc. Ecol. 22, 171–177. doi: 10.1007/s10980-006-9013-2
Wooldridge, J. M. (2012). Econometric Analysis of Cross Section and Panel Data, 2nd Edition. Cambridge, MA: The MIT Press.
World Bank (2020). World Bank in DRC Overview. World Bank. Available online at: https://www.worldbank.org/en/country/drc/overview (accessed February 28, 2021).
World Resources Institute (2018). Atlas forestier de la République Démocratique du Congo. Available online at: https://cod.forest-atlas.org/ (accessed March 13, 2021).
Xu, L., Saatchi, S. S., Shapiro, A., Meyer, V., Ferraz, A., Yang, Y., et al. (2017). Spatial distribution of carbon stored in forests of the Democratic Republic of Congo. Sci. Rep. 7:15030. doi: 10.1038/s41598-017-15050-z
Keywords: forest degradation drivers, panel model, conservation, spatial statistics, forest condition, forest disturbance, conservation planning
Citation: Shapiro AC, Bernhard KP, Zenobi S, Müller D, Aguilar-Amuchastegui N and d'Annunzio R (2021) Proximate Causes of Forest Degradation in the Democratic Republic of the Congo Vary in Space and Time. Front. Conserv. Sci. 2:690562. doi: 10.3389/fcosc.2021.690562
Received: 03 April 2021; Accepted: 11 June 2021;
Published: 15 July 2021.
Edited by:
Christos Mammides, Guangxi University, ChinaReviewed by:
Glenn R. Moncrieff, South African Environmental Observation Network (SAEON), South AfricaMinerva Singh, Imperial College London, United Kingdom
Sébastien Roussel, Université Paul Valéry, Montpellier III, France
Yan Gao, Universidad Nacional Autonoma de Mexico, Mexico
Copyright © 2021 Shapiro, Bernhard, Zenobi, Müller, Aguilar-Amuchastegui and d'Annunzio. This is an open-access article distributed under the terms of the Creative Commons Attribution License (CC BY). The use, distribution or reproduction in other forums is permitted, provided the original author(s) and the copyright owner(s) are credited and that the original publication in this journal is cited, in accordance with accepted academic practice. No use, distribution or reproduction is permitted which does not comply with these terms.
*Correspondence: Aurélie C. Shapiro, YXVyZWxpZUBoZXJlLXRoZXJlLW1hcHBpbmcuY29t; YXVyZWxpZS5zaGFwaXJvQGZhby5vcmc=; c2hhcGlyb2FAaHViZXJsaW4uZGU=