 Mia Maor-Cohen
 Shirli Bar-David
 Amit Dolev2
 Oded Berger-Tal
 David Saltz
- 1Mitrani Department of Desert Ecology, Jacob Blaustein Institutes for Desert Research, Ben-Gurion University of the Negev, Sede Boqer Campus, Midreshet Ben-Gurion, Israel
- 2Science Division, Nature and Parks Authority, Jerusalem, Israel
- 3School of Zoology, George S. Wise Faculty of Life Sciences, Tel Aviv University, Tel Aviv, Israel
Translocated animals typically find themselves in a novel environment in which they must establish a home range in a manner that will maximize their fitness. We hypothesized that the initial establishment of a home range is followed by adjustments expressed as home range shifting, and occurs as familiarity with the landscape increases, until the home range is stabilized. We studied the process of home range shifting in 42 female Persian fallow deer (Dama mesopotamica) reintroduced into the Galilee, Israel over a period of 2–5 years. We used changes in the degree of home range overlap between consecutive years as an indicator of stabilization. We then compared how the mean percent cover of the key vegetation types (woodland, scrubland and open pastures) differed between the areas abandoned in the first year's home range and the areas added to the last year's home range relative to the first (using a weighted paired t-test). We also compared the distribution (using χ2 test of independence and Levene's test for homogeneity of variance) of %cover of the 3 vegetation types between the first and last year's home range. The average home range overlap increased over the 5 years following the first release. During the first-year post release, deer avoided open pastures and preferred woodland. In later years deer increase in the % open pastures (weighted t-test: p < 0.001) and decreased the % woodland cover (weighted t-test: p = 0.07) by abandoning areas with little open pasture and steeper terrain and moving into areas with more open pasture and moderate terrain. Variance of the cover types across individuals increased with time. We conclude that the home ranges of the reintroduced deer stabilized with time. The changes in vegetation and slope are driven by time-dependent changing needs reflecting a tradeoff between safety (refuge) and foraging. Our findings suggest that using the initially established home range to determine species preferences can create a misleading picture of what the optimal home range of the species really is. Individual variation in term of preferences can take a few years to be expressed due to the initial high-risk perceived by individuals in a novel environment.
Introduction
Throughout much of their life, most vertebrates restrict their movements and activities to a given area in space, commonly termed home range (Burt, 1943; Powell and Mitchell, 2012). Under certain conditions, however, animals may find themselves in a completely novel environment in which they must search for an area in order to form a new home range (HR) that will maximize their relative fitness (Yiu et al., 2019). Encountering a novel environment most often occurs as a part of post-natal dispersal (Haughland and Larsen, 2004; Selonen and Hanski, 2006), but occasionally may happen because of forced abandonment of an existing HR due to natural or anthropogenically initiated disasters such as bush fires (Mao et al., 2005) or due to translocation by humans as part of management and conservation procedures. The formation of a HR in a novel environment is an important component of fitness, enabling familiarity with the landscape, so more time can be devoted to exploiting resources safely and efficiently (Berger-Tal et al., 2014). We consider this process to have two distinct phases: the search phase where an animal explores the landscape and selects a general area to settle in, followed by an establishment phase in which the newly formed home range is “fine-tuned” to best fit the animal's needs (McNicol et al., 2020). Both phases are heuristic and may take an extended amount of time (Dolev et al., 2002; Preatoni et al., 2005; Sarkar et al., 2016). In this paper we focus on the dynamics of the establishment phase.
The expected high costs of exploration for a new HR, in terms of time, risk and resource acquisition in an unfamiliar environment (Yoder et al., 2004) compared to the potential benefits of finding a better area, suggest that once established, animals are not expected to voluntarily abandon their HR (Ranc et al., 2020). Thus, the decision when to stop exploring and select an area in which to settle is a critical one which will have a long-lasting effect on the animal's fitness. However, since the exploration stage can be very costly (Berger-Tal et al., 2014), it is safe to assume that the decision to stop searching and form a HR is made before the animal is fully familiar with the landscape, its attributes, and dynamics (Saltz and Getz, under review). Thus, following the initial HR establishment, as familiarity with the HR and its surroundings increases, spatial adjustments (as opposed to complete abandonment) are expected to be made in response to the increased familiarity with the availability of resources (Ranc et al., 2020). In this context, HR establishment should not be viewed as a single event, but rather as a process that begins with the initial formation of a HR to minimize exploration costs, followed by fine-scale adjustments to perfect the HR based on increased familiarity with it and its surroundings.
The fine-scaled adjustments to a newly established HR have received little attention and may harbor important information regarding the behavioral processes in a novel environment that can contribute to enhancing translocation success (Yiu et al., 2017). These adjustments should be evident as shifts in the HR that constitute abandonment of areas that are perceived as less beneficial (or no longer beneficial/necessary) and expansion into neighboring areas that are perceived as offering relatively better opportunities (Ranc et al., 2020). Accordingly, the comparison between the landscape attributes in the newly occupied areas and those in the abandoned sections should be informative in terms of the process of HR establishment in general, and the animal's preferences, risk perceptions, and how these change over time.
Toward this end we have investigated the process of HR adjustments by Persian fallow deer (Dama mesopotamica) reintroduced into the Galilee, Israel, after the initial HR was formed. The reintroduction consisted of multiple releases carried out from 1996 to 2011 and was successful in establishing a wild, expanding self-sustaining population (Maor-Cohen et al., 2020). In this study we revisit a movement data set collected with long-lasting VHF platforms during the first 5 years of the reintroduction program, when tracking focused on low-resolution and long-term sampling (of up to 5 years per individual). In recent years the focus in the fallow deer project has shifted toward advanced GPS technology and fine-scale high resolution data which often limits battery life to 1–2 years of tracking (Seigle-Ferrand et al., 2021), making it less suitable for questions regarding HR establishment across years, as done here. We studied the shifting patterns of HRs from the time of the initial establishment over a period of 2–5 years. Specifically, we were interested in determining how long it took deer to stabilize their HR; the magnitude of the annual shifts in HR location; and in identifying how habitat usage changes with these shifts. We deducted the latter based on the changes that occurred in the habitat composition following the shift. We hypothesized that the establishment process will result in overall diminishing shifts in annual home ranges and that the shifts will reflect specific habitat needs.
Methods
Study Site, Study Species and Release Protocol
The deer were reintroduced to Nahal Kziv Nature Reserve (35023′ S, 33033′E) in the western Galilee, northern Israel. The study area is dominated by Mediterranean vegetation, consisting of a mosaic of Mediterranean woodland characterized by dense common oak (Quercus calliprinos) (encompassing 30% of study area), scrubland characterized by spaced out common oak and spiny broom (Calycotome villosa) shrubs (encompassing 35% of study area), and open pastures containing grasses and low shrubland (encompassing 16% of study area) (Perelberg et al., 2003). The center of the reserve is a deep ravine with steep slopes in which the Kziv stream flows year-round. The surrounding landscape is dominated by moderately rolling hills.
Persian fallow deer (IUCN red list status: EN) is a medium/large sized deer of the genus Dama (Zidon et al., 2009). A detailed analysis of the foraging habit conducted on the European fallow deer (Dama dama) showed they forage predominately on grasses (encompassing 70% of their diet), sedges and rushes (Putman et al., 1993). The Persian fallow deer was considered extinct until rediscovered in Iran in the 1950's (Saltz, 2013). Captive bred populations were established from the Iranian population including in Hai Bar Carmel breeding core in Israel. In 1996 reintroductions in Israel began in Nahal Kziv Nature Reserve and continued for over a decade following procedures described by Saltz (1998).
For the first 5 years the releases were conducted semiannually and in each 6–12 individuals were released from a 11-ha habituation enclosure (Dolev et al., 2002) after spending up to three months in acclimation. Throughout the first 5 years of the study 53 individuals were released. Of these, 42 were females that were fitted with either a 1 kg (life expectancy of 5 years) or 0.5 kg (life expectancy of 2–3 years) VHF radio-collar (MOD 400 and 500 transmitters; Telonics, Mesa, Arizona, USA). The radio tracking was conducted two to three times a week with one location per animal retrieved per sampling day. Occasionally (<5%) 2 location/day were obtained and if separated by more than 6 h both were included in the database as independent measurements following the procedure detailed in Dolev et al. (2002) and the criteria provided by White and Garrott (1990). Tracking was conducted using Yagi antenna with a frequency scanning receiver. To locate the animals, the observer used triangulation from two known locations. The bearing was determined using a prismatic compass with 1° resolution. Sampling error due to animal movement was minimized by defining an ad-hoc minimum angle between bearing of 20° (White and Garrott, 1990), and maximum time between two bearings of 30 mins for each animal (Harris et al., 1990; Saltz, 1994; Perelberg et al., 2003). Mean triangulation error, which was calculated by randomly placing transmitters in locations unknown to the observer, was found to be 284 m (Perelberg et al., 2003) and well within the average patch size of the three habitat types relevant to this study (Bar-David et al., 2005, Figure 1A).
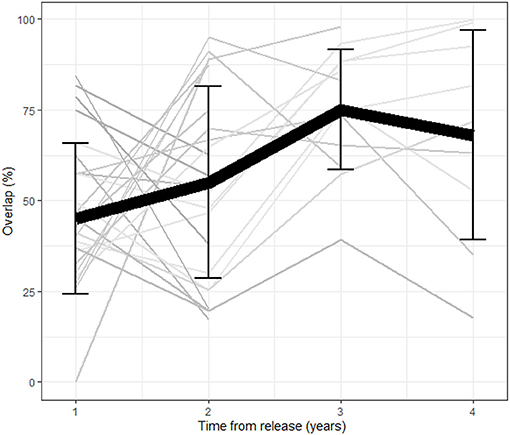
Figure 1. Average overlap between consecutive year home ranges as a function of time from release (in years) per individual (n = 34). The black line represents the population mean and error bars represent the standard deviation per year. The overall overlap increases as a function of time from release reflecting a stabilization process.
Land Cover Estimations
Land cover estimations were done using an ortho-photos map for the upper Galilee region (produced by OFEK ltd.) with a scale of 1:3,500, pixel size of 100 × 100 m, and the software ArcView. Vegetation was classified into one of six categories: open pastures, scrubland, dense woodland, riparian habitat, cultivated orchards, and other cultivated agricultural fields. Of these the riparian habitats constitute a small fraction of the area and the cultivated lands are typically fenced and not accessible to the deer. The vegetation cover images were coupled with a roads landscape image and a built-up areas image to generate a land cover types map (Bar-David et al., 2005, Figure 1A). This map was exported using GIS programs [Idrisi32 (Clark Labs, Worcester, Massachusetts, USA)] and converted to a raster layer containing pixels of the different land covers where each pixel represented only one land cover type. Using ArcGIS pro each annual home range was overlayed with the land cover layer which allowed for the calculation of the total area of each vegetation type within each home range. Deer avoided built areas and roads and these were not a substantial part of any of the home ranges used in this study. Thus, although included in the landcover layer, these categories are not relevant to this study.
The elevations within the study site were translated into a contour map (using triangulation method) and from it, using the software “Idrisi,” to a map of slopes across the surface (in degrees). This layer was crossed with the annual home ranges of each individual. For each individual we obtained an analysis of the home range in terms of topographical slope: the distribution of slopes in degrees, the mean and standard deviation.
Home Range Estimation
We calculated annual home range size and spatial orientation using the 90 and 50% isopleth of the Adaptive Kernel technique (Worton, 1989) within the Home Range Extension for ArcView (Rodgers and Carr, 1998) for each year following initial release. The reintroduced fallow deer formed a home range within 6 months (Dolev et al., 2002), thus we excluded the first 6 months of data for the home range analysis and analyzed annual home ranges following this initial establishment. Using overlaying methods in GIS, we derived from each annual home range its average topographical slope and its vegetation cover composition. In this study we were mostly interested in the dominant types of vegetation cover important to the deer (which encompassed >85% of the landscapes within the home ranges): woodlands which provide better refuge, open pastures that provide the preferred forage (grasses), and scrublands that are intermediate in both respects.
Home Range Shifting and Changes in Home Range Attributes
We characterized the temporal and spatial dynamics of HR shifting by evaluating the annual change in the spatial orientation of an individual's HR, i.e., the first-year's HR overlap with the second-year's HR, the second year's with the third and so on. The degree of overlap was calculated as the percentage of the overlapping area in the home range between two consecutive years out of the total area of home range in the second year.
We had two working hypotheses:
1. HRs stabilize over time since reintroduction. If HRs stabilize over time, we predict the degree of overlap between two consecutive years is expected to be positively correlated with time since release. We assessed whether the HRs were becoming stabilized over time by regressing the amount of overlap between consecutive years on the number of years since each individual's reintroduction. Because the increase in overlap may be due to the increase in density with time since the onset of the project, we used the release cycle as a second predictor as a proxy for the number of animals in the study site (representing the increase in density due to the releases as well as recruitment). We tested all possible models (after testing for possible collinearity between the two predictors) and compared between them using multi-model inference and Akaiki's Information Criteria corrected for small sample size (AICc).
2. The shift in the HR reflects specific habitat needs and is an attempt to maximize fitness by modifying its spatial arrangement. The shift itself is therefore a proxy of the actual interests of the animal and is a complex outcome of the conditions/resources in the current HR and those available in the nearby landscape and how they are distributed. However, the extent of the shift in an environment that is typically patchy and irregular, is expected to poorly reflect the actual needs of the animal. Specifically, preferred or unwanted habitats are intertwined in infinite shapes and forms across the landscape, initial HR characteristics may vary between individuals, and the landscape characteristics in the neighboring areas may vary. Thus, the magnitude of the shift is the outcome of many parameters and may include large unwanted areas necessary to maintain continuity in the new HR while encompassing certain key attributes that may have a small footprint. Our attempt to explain the magnitude of the shift based on spatial and temporal changes in the landscape characteristics using multi-model inference resulted in the intercept-only being one of the leading models. Thus, while the magnitude of the shift is the key gage of the HR stabilization process, our focal interest for this hypothesis is not what determines the magnitude of the shift, but rather what is achieved by the shift. Specifically, how habitat composition has changed. Consequently, we adopted a parsimonious approach that addresses the changes in the key characteristics of the landscape known to be important to mid-sized deer: the vegetation cover and the steepness of the terrain (Nicholson et al., 1997).
For the three dominant vegetation cover types in the study area that are expected to be of value (open pastures, scrubland, dense woodland) we compared between the first and last annual HR calculated for each individual. We used the last HR because, based on our working hypothesis, later HRs are expected to be closer to what the animal is attempting to achieve. We did so by using two approaches:
(a) Looking at the distribution across all animals of the proportions of each vegetation type within the first and last HR. We determined how vegetation cover is distributed between the individual HRs by calculating the % cover of each vegetation type for each animal and counting the number of animals that fell within a certain range of cover using 10% increments as categories. We then tested for differences using a χ2 test of independence. Categories with an expected value <5 were merged with neighboring categories.
(b) Assessing how the average cover of each vegetation type changes between the first and last HR. We accentuated this comparison by contrasting between the area abandoned in the first HR relative to the last and the area added to the last HR relative to the first (i.e., we excluded the common area). We then tested for differences using a paired t-test on the arcsine transformed value weighted by the number of years that elapsed between the first and last HR. Although the woodland, scrubland, and open pasture constitute only 3 of the 6 vegetation types, these are the ones dominant within the deer home range and are therefore expected to be colinear. However, because we carried the analyses separately, errors due to zero degrees of freedom or high collinearity do not occur, yet it is important to realize that an increase in one vegetation type is directly associated with a decrease in at least one of the other two, so the findings are not independent. In both cases we carried out the comparison for both the 90 and 50% isopleths.
In addition, we performed a Levene's test for homogeneity of variance on the standard deviations of all percent vegetation cover types to examine whether there was a reduction in variance as a function of time from release. We expected that if individuals reach optimal HR characteristics by shifting their HR, variation in the populations should decrease as a function of time from release.
We recognize that other factors may affect changes in habitat preferences over time, including annual precipitation, location of water sources and presence of conspecifics. However, the area is Mediterranean with a rather constant annual precipitation in the years of the study (900–1,200 mm), rather consistent primary productivity, and moderate weather in general. We therefore consider annual variations in the environment to be relatively minor. In terms of water availability, Nahal Kziv is the main natural water source in the study area. However, cattle troughs and leaking water pipes found in agricultural fields probably supply the majority of drinking water which the deer rely on. Since we cannot quantify the availability and spatial arrangement of this resource it was not included in the analysis. In terms of conspecifics, because of collar failure as well as recruitment, our knowledge on the spatial arrangement of a significant part of the population is missing. Persian fallow deer, however, are not territorial and have loose social ties, and given that the study was carried out in the first years of the reintroduction, density dependent effects should be minor and social effects would mostly impact the rapidity of home range establishment (Sjoasen, 1997; Dolev et al., 2002).
All statistical analyses were conducted using R packages “adehabitat,” “ggplot2,” and “weight” for weighted t-test.
Results
Home Range Overlap
A total of 42 females were tracked for 2–5 years between the years 1997 and 2001. The average HR overlap increased over the 5 years and was 45% ± 20.8 (error here and throughout represents the standard deviation) between the first and second year, 55% ± 26.5 between the second and third year, 75% ± 16.6 between the third and fourth year and 68% ± 28.8 between the fourth and fifth year (Figure 1). Collinearity between the two predictors of overlap (number of years the animals were in the wild and the release cycle) was weak (R = −0.41, Pearsons Correlation Test). The level of overlap increased with the number of years the animals were in the wild and decreased with release cycle, with the full model having the lowest AICc and all other models trailing by delta-AICc of 6.5 or more, including the intercept only (DF = 72, coefficients: year from release = 8.5, release cycle = −1.5, year from release*release cycle = 0.5, adjusted R2 = 0.14). Twenty-five females had shifted their home range over 50% at least once during the first 3 years post release. Interestingly, we found a negative correlation between the percent shift during the first and second year showing that individuals that shifted little in the first year compensated for it in the second (linear regression: p = 0.02, Figure 2).
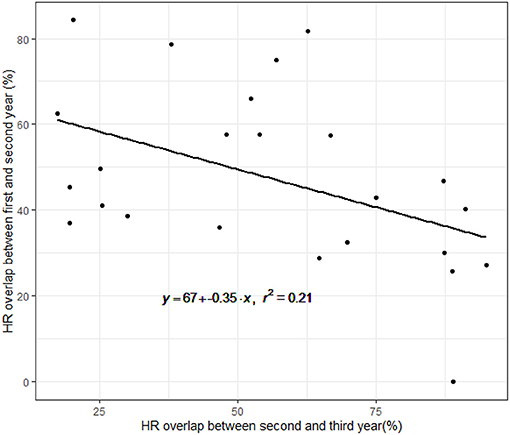
Figure 2. Correlation between home range overlap during the first and second year, and the home range overlap between the second and third year. The black line is the expected linear relationship. The negative relationship indicates that individuals that shifted little between the first and second year, exhibited larger shifts between the second and third year.
Home Range Attributes
During the first-year post release deer clearly selected woodland cover which made up most of their HR, both in the core and full HR (50 and 90% isopleth, Figure 3). The average woodland cover available in the study site is 30% and the population average of woodland cover in the HRs was 53% ±18 in the core and 51% ± 6.7 in the full HR. The deer avoided having open pastures during the first year both within the core of their HR and in the 90% isopleth, with populations average open pastures being 0.5% ± 0.8 in the core and 3.7% ± 3.5 in the full HR, even though open pastures make up 16% of the available vegetation cover within the study site (Figure 3). A comparison of the difference in the percentage of vegetation cover between the first and last year of tracking per female revealed an increase in the open pastures both in the core and full HR (weighted t-test: p < 0.001 for both), and a slight decrease in the woodland cover in the full home range (weighted t-test: p = 0.07). The differences in other vegetation types were not significant.
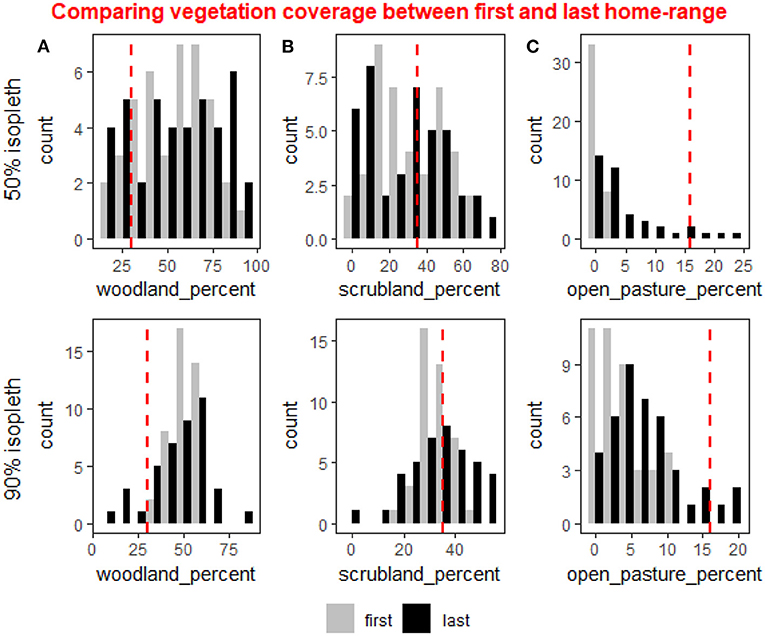
Figure 3. The distribution of the percent coverage in individuals home ranges of three types of vegetation cover: woodland (A), scrubland (B), and open pasture (C) shown for the 50% isopleth (core of the home range, upper row) and the 90% isopleth (entire home range, lower row) in the first year after reintroduction (gray bars) and last year of tracking (black bars). In the 90% isopleth average percent woodland was reduced slightly (weighted t-test: p = 0.07) between the first and last year but the distribution was significantly wider during the last year (χ2: p = 0.049). In the 50% isopleth both the average percent woodland and the distribution did not vary between the first and last year. (B) In the 90% isopleth average percent scrubland did not change between the first and last year but the distribution was significantly wider during the first year (χ2: p = 0.005). In the 50% isopleth the average percent scrubland did not change but the distribution varied between the first and last year (χ2: p = 0.04). (C) In the 90% isopleth and in the 50% isopleth the deer avoided open pastures during the first and last year, but in the 90% isopleth the deer increased the amount of open pasture between the first and last year (weighted t-test: p < 0.001) and the distribution was significantly wider (χ2: p = 0.02). In the 50% isopleth both the average percent open pasture and the distribution differed significantly between the first and last year (weighted t-test: p < 0.001, χ2: p < 0.001).
While the difference in mean percent cover was found to be significant only for open pastures, the distribution of the three cover types varied considerably, except for the woodland in the core (50% isopleth). Specifically, in the core, the distribution of percent scrubland and open pasture was different between the first and last year (χ2 test of independence: p = 0.04 and p < 0.001 respectively). In the full HR, the distribution of all vegetation types was significantly different during the first year compared to the last year (χ2: woodland: p = 0.049, open pasture: p = 0.02, scrubland: p = 0.005).
Our results show that in the 90% isopleth, the variation in the population was lower in the distribution of woodland and scrubland cover (Levene's test: p = 0.001 and p < 0.001 respectively) during the first-year post release compared to the last-year HR. In the core (50% isopleth) of the HR however, there was significantly lower variation in the population in distribution of open pasture (Levene's test: p < 0.001) and marginally significant differences in woodland cover (Levene's test: p = 0.06) between the first and last year.
When comparing the areas occupied during the first year and abandoned, to the areas added in the last year relative to the first, we found significant differences in the amount of open pastures added both in the core and the full HR (50% isopleth, weighted t-test: p < 0.001, 90% isopleth, weighted t-test: p < 0.001, Figure 4) suggesting deer abandoned areas with very low open pasture cover both within the core and their full HR and added more open areas to their HR in later years. Other tests performed on this data set came out non-significant.
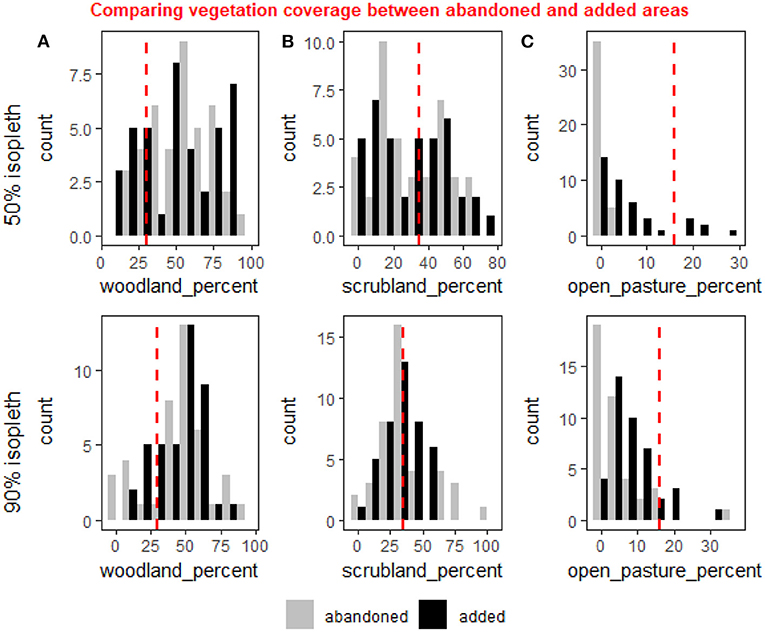
Figure 4. A comparison of the distribution of coverage the three vegetation cover types—woodland (A), scrubland (B) and open pasture (C)—between area of the first year's home range that were abandoned relative to the last (gray), and the areas added to the last year's home range relative to the first (black). The comparison is for the 50% isopleth (core of the home range—upper row) and the 90% isopleth (entire home range—lower row). The red line represents the average coverage in the study area. Percent open pasture was significantly higher in the added areas compared to the abandoned ones for both the 50 and 90% isopleths (weighted t-test: p < 0.001 for both). There were no significant changes in the woodland and scrubland, but the increase in open pastures appear to be on account of a minor (albeit non-significant) decline in the scrubland.
Deer adjusted the slopes in the HR and selected more moderate terrain as a function of time from release. The mean slope during the first year was 15.7% ± 3.3 and during the last year 12.7% ± 3.7 a difference we found to be statistically significant (weighted t-test: p < 0.0001, Figure 5).
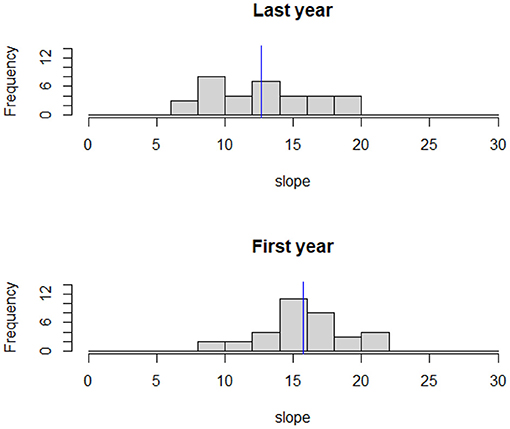
Figure 5. The distribution of the average slope (in degrees) for the 90% isopleth of individual home ranges. The blue line represents the study area mean slope. Mean slope was significantly lower during the last year of tracking compared to the first (weighted t-test: p < 0.001).
Discussion
Animals exhibit flexibility of space use within their HR and its surroundings, suggesting that they make decisions based on exploration even in a well-established HR (Creel et al., 2005; Tuqa et al., 2014). Thus, knowledge of the spatio-temporal dynamics of home ranges can further our understanding of the link between home range behavior, ecological or evolutionary processes, and their conservation-related consequences (Börger et al., 2008).
The establishment of a HR in the reintroduced Persian fallow deer population in the Kziv Reserve, Israel, appears to be a long-term process over which the HR becomes more stable. The process spans several years and is driven by instinctual behavior and time-dependent changing needs. Specifically, refuge appears to be key, but the landscape of fear (Laundré et al., 2009) evidently changes over time as a function of familiarity. The genus Dama tends to be more grass/roughage eaters than browsers (Hofmann, 1989), with scrub and mixed plantations being the most beneficial for their diet during the spring and summer and open pastures during the fall and winter (Focardi et al., 1995). However, open grasslands and scrublands offer less refuge and are, therefore, riskier. Thus, fallow deer that perceive a higher risk tend to forage closer to the wooded habitat which provides cover (Pecorella et al., 2016). Familiarity is a key component of risk reduction (Gehr et al., 2020), so the perceived risk in newly translocated animals is inherently higher. The spatial behavior of the Persian fallow deer, being a prey species, is expected to be highly affected by presence of predators and/or by their perception of risk (Nicholson et al., 1997; Maor-Cohen et al., 2020). While we did not test perceived risk or predator presence directly, animals in their first-year post release are expected to be motivated by lack of knowledge and the need for safety should be prioritized. This explains the observed pattern of our deer preferring woodlands over the open and scrubland when the HR was initially established, and shifting the HR to include more open pastures over time as familiarity with the landscape increased. Predation is a key factor affecting reintroduction success (Berger-Tal et al., 2020) and in our study system, wolves are the only potential predator for the deer (Maor-Cohen et al., 2020). However, at the time of this study wolves were not present in the study area (Mendelssohn, 1983), if they were, the shift into open pasture may not have occurred.
Interestingly, a significant change in the total amount of habitat between the area added and the area abandoned as part of the shifting process was found only for the open pasture habitat, although a reciprocal process should have occurred in either the woodland, scrubland or both. This is probably due to the overall area of the open pasture being relatively small so the significance of observed decline in the woodlands would be overwhelmed by its variance. The χ2 tests demonstrate that the changes that do occur in the woodland are mostly in the outer boundaries (90% isopleth) of the home range, and such changes are also evident in the two other habitat types. Specifically, while the distribution of woodland and scrubland varied considerably among individuals and remained unchanged over time in the 50% isopleth, in the 90% isopleth there was a stronger central tendency (lower variance) in the first year that weakened later (Figure 2).
The preference of the deer to wooded areas in the early stages of translocation reflects an elevated state of stress which is linked to the translocation procedure and the novel landscape (Zidon et al., 2009). This carries two costs: reduced foraging efficiency due to reduced availability of grasses and forbs within the woodland, and the catabolic effect of the stress itself (Saltz et al., 1995). The combination of these may be the proximate factors driving reduced reproductive success that was observed post release (Bar-David et al., 2005). Thus, our results highlight the importance of ample refuge (i.e., in higher quantities than what is expected to be preferred based on any previous knowledge of the released species) in the release site.
The fine-scale details of the extent and direction of the shift are difficult to evaluate. It is safe to assume that there is a landscape perimeter surrounding the original HR which the deer are familiar with and which the deer can evaluate as potential areas for incorporation into the exiting HR. The width of this perimeter is unknown. The complexity of the landscape, namely the types of available habitat, their spatial pattern, and the characteristics of the specific patches, as well as the effects of other variables which we could not account for in our analysis (e.g., neighboring conspecifics) dictate that the decision as to which new area to incorporate into the HR and which area to abandon is a complex one, hampering our ability to provide detailed predictions as to the direction and extent of the shift.
The HR shift analysis described herein bares similarity to resource selection functions in that it is indicative of the animal's habitat preferences or needs. However, it is distinct in that resource selection functions consider the probability of use of a resource by an animal relative to current availability within the animal's HR (Boyce and McDonald, 1999; Manly et al., 2007). The HR shift analysis is a more objective measure of animal preference because it is not limited to the choices offered by the HR alone, the boundaries of which may be ‘forced' upon the animal by competing neighboring conspecifics. Thus, translocations offer a unique opportunity to study animal behavior when competition is lax or absent (Sarrazin and Barbault, 1996).
Reintroduced species are often rare and threatened species for which we have limited knowledge about their specific HR requirements. Typically, one of the categories for success in the early phases of a reintroduction is the formation of a HR (Flanagan et al., 2016). Our results show that determining the preferred HR characteristics based on the first established HR can create a misleading picture of what the optimal HR of the species is. This is especially so given that some individuals performed significant shifts only in the second year after HR establishment. If the fallow deer home range preferences would have been determined based on first-year home range characteristics, it would have seemed that they do not require open pastures within the core of their home range which would disagree with the ecophysiology of the species (Hofmann, 1989). This emphasizes the importance of long-term monitoring of translocated animals, even when this monitoring is of low temporal resolution.
Initially, we suspected that the HR shifting pattern we identified was indicative of the existence of an optimal species HR structure. We predicted it takes a few years for the animals to be able to perfect their home range's composition in a way that will express the optimal HR for the species. Our results however suggest that the opposite might be true. While there are some general HR characteristics preferred by the species (i.e., woodland for safety and open pasture for foraging) we found that as time goes by, the variation within the population in terms of HR specifications increases rather than decreases. Thus, while there might be minimal HR characteristics required for the species, there is great individual variation in term of HR preferences which can take a few years to be expressed within the population due to the initial high-risk perceived by all individuals. In the first year after the initial HR was formed, individuals behaved similarly (i.e., there was lower variation in distributions) in that they all preferred refuge, while later when the animals became more familiar with their surroundings, individual variation in preferences regarding HR characteristics became more evident. That being said, it is noteworthy that while there might be a general optimal HR for the species, the animals cannot always achieve it because they are limited by what is available to them in the vicinity of the HR and that the initial formation of a HR is the outcome of a heuristic process. Thus, although a species optimum may exist, it is in most cases not attainable or detectable due the variability of the landscape and individual animal variance, respectively.
The presence of conspecifics can have a great impact on the spatial behavior of HR establishments and shifts (Seigle-Ferrand et al., 2021). Multi model inference on the overall shifting trend showed that the interaction between the time passed since release and the overall number of releases (our best proxy for density/number of individuals in the area) explained our observed pattern the best. Thus, while the time the animal spends in the environment is negatively correlated with the shifting of the HR, the density of conspecifics has an effect as well. Deer are a semi social animal which can be attracted by the presence of conspecifics (Fletcher, 2007). Thus even as density increases in the early years following reintroduction onset, it is expected that newly released females will establish a home range with little intraspecific agonistic pressures and may in fact stabilize the HR faster (by using the presence of other conspecifics as a cue) but further away due to a smaller number of available sites (Dolev et al., 2002; McNicol et al., 2020). As densities near the release site approach saturation newly released individuals will be pushed further away and will establish a HR at the edge of the newly formed population's range (Sjoasen, 1997), in an area where competition is lax enabling them a similar flexibility in HR adjustments as previously released conspecifics.
Conclusions
Newly formed home ranges of reintroduced Persian fallow deer tend to be dynamic and continue shift for several years after initial establishment. These shifts are toward the inclusion of better foraging habitat such as open pastures in lieu of the safer woodlands. As the need for safety due to lack of familiarity of the landscape declines with time, individual variation in HR structure increases. These findings point to the importance of refuge in areas selected for reintroduction of prey species and agrees with the notion that predation is a serious obstacle to translocation success (Berger-Tal et al., 2020). The process of home range shifting provides an important insight into the interaction between translocated animals and the new landscape they confront and can help guide adaptive management protocols and conservation decision making.
Data Availability Statement
The raw data supporting the conclusions of this article will be made available by the authors, without undue reservation.
Ethics Statement
Ethical review and approval was not required for the animal study because All reintroduced animals were handled by the Israeli Nature and Parks Authority.
Author Contributions
SB-D and AD collected the field data. MM-C analyzed the data with inputs from SB-D, OB-T, DS, and OS. MM-C led the writing together with DS and OS. All authors contributed to further drafts and approved the final version.
Funding
The reintroduction programs in Israel are run and funded by the Israeli Nature and Parks Authority.
Conflict of Interest
The authors declare that the research was conducted in the absence of any commercial or financial relationships that could be construed as a potential conflict of interest.
Publisher's Note
All claims expressed in this article are solely those of the authors and do not necessarily represent those of their affiliated organizations, or those of the publisher, the editors and the reviewers. Any product that may be evaluated in this article, or claim that may be made by its manufacturer, is not guaranteed or endorsed by the publisher.
Acknowledgments
We would like to give a special thank you to Arnon Tsairi for his invaluable help with the analysis in ArcGIS. We would also like to thank Andrew Sussman, Amir Perelberg, and Roni King for their help and support in this project.
References
Bar-David, S., Saltz, D., and Dayan, T. (2005). Predicting the spatial dynamics of a reintroduced population: the Persian fallow deer. Ecol. Appl. 15, 1833–1846. doi: 10.1890/04-0798
Berger-Tal, O., Blumstein, D. T., and Swaisgood, R. R. (2020). Conservation translocations: a review of common difficulties and promising directions. Anim. Conserv. 23, 121–131. doi: 10.1111/acv.12534
Berger-Tal, O., Nathan, J., Meron, E., and Saltz, D. (2014). The exploration-exploitation dilemma: a multidisciplinary framework. PLoS ONE 9:e95693. doi: 10.1371/journal.pone.0095693
Börger, L., Dalziel, B. D., and Fryxell, J. M. (2008). Are there general mechanisms of animal home range behaviour? a review and prospects for future research. Ecol. Lett. 11, 637–650. doi: 10.1111/j.1461-0248.2008.01182.x
Boyce, M. S., and McDonald, L. L. (1999). Relating populations to habitats using resource selection functions. Trends Ecol. Evol. 14, 268–272. doi: 10.1016/S0169-5347(99)01593-1
Burt, W. H. (1943). Territoriality and home range concepts as applied to mammals. J. Mammal. 24, 346–352. doi: 10.2307/1374834
Creel, S., Winnie, J., Maxwell, B., Hamlin, K., and Creel, M. (2005). Elk alter habitat selection as an antipredator response to wolves. Ecology 86, 3387–3397. doi: 10.1890/05-0032
Dolev, A., Saltz, D., Bar-David, S., and Yom-Tov, Y. (2002). Impact of repeated releases on space-use patterns of persian fallow deer. J. Wildlife Manag. 2002, 737–746. doi: 10.2307/3803139
Flanagan, E.S, Brown, M. B., Fennessy, J., and Bolger, D. T. (2016). Use of home range behaviour to assess establishment in translocated giraffes. Afric. J. Ecol. 54, 365–374. doi: 10.1111/aje.12299
Fletcher, R. J. (2007). Species interactions and population density mediate the use of social cues for habitat selection. J. Anim. Ecol. 76, 598–606. doi: 10.1111/j.1365-2656.2007.01230.x
Focardi, S., Poli, B. M., and Tinelli, A. (1995). The nutritional carrying capacity of four mediterranean habitats for fallow deer (Dama dama). Revue Ecol. La Terre et la Vie. 50, 97–107.
Gehr, B., Bonnot, N. C., Heurich, M., Cagnacci, F., Ciuti, S., Hewison, A. M., et al. (2020). Stay home, stay safe—site familiarity reduces predation risk in a large herbivore in two contrasting study sites. J. Anim. Ecol. 89, 1329–1339. doi: 10.1111/1365-2656.13202
Harris, S., Cresswell, W. J., Forde, P. G., Trewhella, W. J., Woollard, T., and Wray, S. (1990). Home-range analysis using radio-tracking data—a review of problems and techniques particularly as applied to the study of mammals. Mammal Rev. 20, 97–123. doi: 10.1111/j.1365-2907.1990.tb00106.x
Haughland, D. L., and Larsen, K. W. (2004). Exploration correlates with settlement: red squirrel dispersal in contrasting habitats. J. Anim. Ecol. 73, 1024–1034. doi: 10.1111/j.0021-8790.2004.00884.x
Hofmann, R. R. (1989). Evolutionary steps of ecophysiological adaptation and diversification of ruminants: a comparative view of their digestive system. Oecologia. 78, 443–457.
Laundré, J. W., Calderas, J. M. M., and Hernández, L. (2009). Foraging in the landscape of fear, the predator's dilemma: where should i hunt? Open Ecol. J. 2, 1–6. doi: 10.2174/1874213000902010001
Manly, B. F., McDonald, L., Thomas, D. L., McDonald, T. L., and Erickson, W. P. (2007). Resource Selection by Animals: Statistical Design and Analysis for Field Studies. Berlin: Springer Science and Business Media.
Mao, J. S., Boyce, M. S., Smith, D. W., Singer, F. J., Vales, D. J., Vore, J. M., et al. (2005). Habitat selection by elk before and after wolf reintroduction in Yellowstone National Park. J. Wildlife Manag. 69, 1691–1707. doi: 10.2193/0022-541X(2005)691691:HSBEBA2.0.CO;2
Maor-Cohen, M., Shamon, H., Dolev, A., Reichman, A., Bar-David, S., and Saltz, D. (2020). Long-term reevaluation of spatially explicit models as a means for adaptive wildlife management. Ecol. Appl. 30:e02088. doi: 10.1002/eap.2088
McNicol, C. M., Bavin, D., Bearhop, S., Bridges, J., Croose, E., Gill, R., et al. (2020). Postrelease movement and habitat selection of translocated pine martens martes martes. Ecol. Evol. 10, 5106–5118. doi: 10.1002/ece3.6265
Mendelssohn, H. (1983). Status of the Wolf in the Middle East. Acta Zoologica Fennica. Available online at: http://agris.fao.org/agris-search/search.do?recordID=US201302550972.
Nicholson, M. C., Bowyer, R. J. T., and Kie, G. (1997). Habitat selection and survival of mule deer: tradeoffs associated with migration. J. Mammal. 78, 483–504. doi: 10.2307/1382900
Pecorella, I., Ferretti, F., Sforzi, A., Macchi, E., Pecorella, I., Ferretti, F., et al. (2016). Effects of culling on vigilance behaviour and endogenous stress response of female fallow deer. Wildlife Res. 43, 189–196. doi: 10.1071/WR15118
Perelberg, A., Saltz, D., Bar-David, S., Dolev, A., and Yom-Tov, Y. (2003). Seasonal and circadian changes in the home ranges of reintroduced persian fallow deer. J. Wildlife Manag. 485–492. doi: 10.2307/3802706
Powell, R. A., and Mitchell, M. S. (2012). What is a home range? J. Mammal. 93, 948–958. doi: 10.1644/11-MAMM-S-177.1
Preatoni, D., Mustoni, A., Martinoli, A., Carlini, E., Chiarenzi, B., Chiozzini, S., et al. (2005). Conservation of brown bear in the alps: space use and settlement behavior of reintroduced bears. Acta Oecol. 28, 189–197. doi: 10.1016/j.actao.2005.04.002
Putman, R. J., Culpin, S., and Thirgood, S. J. (1993). Dietary differences between male and female fallow deer in sympatry and in allopatry. J. Zool. 229, 267–275. doi: 10.1111/j.1469-7998.1993.tb02635.x
Ranc, N., Moorcroft, P. R., Hansen, K. W., Ossi, F., Sforna, T., Ferraro, E., et al. (2020). Preference and familiarity mediate spatial responses of a large herbivore to experimental manipulation of resource availability. Sci. Rep. 10:11946. doi: 10.1038/s41598-020-68046-7
Rodgers, A. R., and Carr, A. P. (1998). HRE: The Home Range Extension for ArcViewy. Thunder Bay, ON: Centre for Northern Forest Ecosystem Research, Ontario Ministry of Natural Resources.
Saltz, D. (1994). Reporting error measures in radio location by triangulation: a review. J. Wildlife Manag. 58, 181–184. doi: 10.2307/3809567
Saltz, D. (1998). A long-term systematic approach to planning reintroductions: the Persian fallow deer and the arabian oryx in Israel. Animal Conservation Forum 1, 245–252. doi: 10.1111/j.1469-1795.1998.tb00035.x
Saltz, D., White, G. C., Bartmann, R. M., DelGiudice, G. D., Riggs, M. R., Mech, L. D., et al. (1995). Assessing animal condition, nutrition, and stress from urine in snow. Wildlife Soc. Bull. (1973–2006) 23, 694–704.
Sarkar, M. S., Ramesh, K., Johnson, J. A., Sen, S., Nigam, P., Gupta, S. K., et al. (2016). Movement and home range characteristics of reintroduced tiger (Panthera Tigris) population in Panna Tiger Reserve, Central India. Eur. J. Wildlife Res. 62, 537–547. doi: 10.1007/s10344-016-1026-9
Sarrazin, F., and Barbault, R. (1996). Reintroduction: challenges and lessons for basic ecology. Trends Ecol. Evol. 11, 474–478. doi: 10.1016/0169-5347(96)20092-8
Seigle-Ferrand, J., Atmeh, K., Gaillard, J., Ronget, V., Morellet, N., Garel, M., et al. (2021). A systematic review of within-population variation in the size of home range across ungulates: what do we know after 50 years of telemetry studies? Front. Ecol. Evol. 8:555429. doi: 10.3389/fevo.2020.555429
Selonen, V., and Hanski, I. K. (2006). Habitat exploration and use in dispersing juvenile flying squirrels. J. Anim. Ecol. 75, 1440–1449. doi: 10.1111/j.1365-2656.2006.01168.x
Sjoasen, T. (1997). Movements and establishment of reintroduced european otters lutra lutra. J. Appl. Ecol. 34, 1070–1080. doi: 10.2307/2405295
Tuqa, J. H., Funston, P., Musyoki, C., Ojwang, G. O., Gichuki, N. N., Bauer, H., et al. (2014). Impact of severe climate variability on lion home range and movement patterns in the amboseli ecosystem, Kenya. Glob. Ecol. Conserv. 2, 1–10. doi: 10.1016/j.gecco.2014.07.006
White, G. C., and Garrott, R. A. (1990). Analysis of Wildlife Radio-Telemetry Data. San Diego, CA: Academic Press.
Worton, B. J. (1989). Kernel methods for estimating the utilization distribution in home-range studies. Ecology 70, 164–168. doi: 10.2307/1938423
Yiu, S. W., Karczmarski, L., Parrini, F., and Keith, M. (2019). Resource selection in reintroduced lions and the influence of intergroup interactions. J. Zool. 307, 111–124. doi: 10.1111/jzo.12620
Yiu, S. W., Parrini, F., Karczmarski, L., and Keith, M. (2017). Home range establishment and utilization by reintroduced lions (Panthera Leo) in a Small South African Wildlife Reserve. Integr. Zool. 12, 318–332. doi: 10.1111/1749-4877.12243
Yoder, J. M., Marschall, E. A., and Swanson, D. A. (2004). The cost of dispersal: predation as a function of movement and site familiarity in ruffed grouse. Behav. Ecol. 15, 469–476. doi: 10.1093/beheco/arh037
Keywords: translocation, shift, stabilization, novel environment, habitat preference
Citation: Maor-Cohen M, Bar-David S, Dolev A, Berger-Tal O, Saltz D and Spiegel O (2021) Settling in: Reintroduced Persian Fallow Deer Adjust the Borders and Habitats of Their Home-Range During the First 5 Years Post Release. Front. Conserv. Sci. 2:733703. doi: 10.3389/fcosc.2021.733703
Received: 30 June 2021; Accepted: 26 August 2021;
Published: 12 October 2021.
Edited by:
William J. McShea, Smithsonian Conservation Biology Institute (SI), United StatesReviewed by:
Francesca Parrini, University of the Witwatersrand, South AfricaGuangshun Jiang, Northeast Forestry University, China
Copyright © 2021 Maor-Cohen, Bar-David, Dolev, Berger-Tal, Saltz and Spiegel. This is an open-access article distributed under the terms of the Creative Commons Attribution License (CC BY). The use, distribution or reproduction in other forums is permitted, provided the original author(s) and the copyright owner(s) are credited and that the original publication in this journal is cited, in accordance with accepted academic practice. No use, distribution or reproduction is permitted which does not comply with these terms.
*Correspondence: Mia Maor-Cohen, TWlhbWFvcjg5QGdtYWlsLmNvbQ==