Abstract
Deforestation contributes to global greenhouse gas emissions and must be reduced if the 1.5°C limit to global warming is to be realized. Protected areas represent one intervention for decreasing forest loss and aiding conservation efforts, yet there is intense human pressure on at least one-third of protected areas globally. There have been numerous studies addressing the extent and identifying drivers of deforestation at the local, regional, and global level. Yet few have focused on drivers of deforestation in protected areas in high thematic detail. Here we use a new crowdsourced data set on drivers of tropical forest loss for the period 2008–2019, which has been collected using the Geo-Wiki crowdsourcing application for visual interpretation of very high-resolution imagery by volunteers. Extending on the published data on tree cover and forest loss from the Global Forest Change initiative, we investigate the dominant drivers of deforestation in tropical protected areas situated within 30° north and south of the equator. We find the deforestation rate in protected areas to be lower than the continental average for the Latin Americas (3.4% in protected areas compared to 5.4%) and Africa (3.3% compared to 3.9%), but it exceeds that of unprotected land in Asia (8.5% compared to 8.1%). Consistent with findings from foregoing studies, we also find that pastures and other subsistence agriculture are the dominant deforestation driver in the Latin Americas, while forest management, oil palm, shifting cultivation and other subsistence agriculture dominate in Asia, and shifting cultivation and other subsistence agriculture is the main driver in Africa. However, we find contrasting results in relation to the degree of protection, which indicate that the rate of deforestation in Latin America and Africa in strictly protected areas might even exceed that of areas with no strict protection. This crucial finding highlights the need for further studies based on a bottom up crowdsourced, data collection approach, to investigate drivers of deforestation both inside and outside protected areas.
Introduction
Curbing deforestation in tropical areas continues to be a key environmental challenge, with global implications for climate change and biodiversity loss (Betts et al., 2017; Popkin, 2019). One proven intervention for decreasing the amount of forest loss and promoting conservation is the establishment of protected areas (Watson et al., 2014). Therefore, Aichi target 11.1 of the Convention on Biodiversity called for 17% of the world's terrestrial surface to be protected by 2020 (and 10% of marine areas), which has now been reportedly achieved globally (Secretariat of the CBD, 2020). However, recent studies showed that within 196 of the globally contracting parties, almost 55% of countries are showing no or little progress in many biodiversity indicators (Buchanan et al., 2020), and area-based protection targets have therefore been criticized as focusing on the amount rather than the quality of protected areas (Adams et al., 2021; Starnes et al., 2021). In line with this, a recent Remote Sensing Survey undertaken by the UN Food and Agriculture Organization (FAO) as part of their Forest Research Assessment (FRA) showed that between 2000 and 2018, despite a slowdown at the global scale, most deforestation occurred in tropical biomes (FAO, 2021). Although some commitments have been made through the Glasgow Leaders' Declaration on Forests and Land Use to reverse forest loss and land degradation by 2030 (Glasgow Leaders CoP26, 2021), we still need more effective monitoring tools in place to ensure that commitments are fully implemented. To achieve this goal, a better understanding of the regional drivers of forest loss and which interventions are most effective in a certain region would be needed for a better targeting of committed funding efforts.
Synthesizing the main drivers of deforestation across multiple geographical locations, meta-analysis of published studies on deforestation causes have found complex patterns involving multiple drivers of deforestation across the globe (Geist and Lambin, 2002; Busch and Ferretti-Gallon, 2017; Scullion et al., 2019). However, the underlying drivers of deforestation do not only differ by geographical location, as has been shown for Brazil, the Congo Basin and Indonesia (Seymour and Harris, 2019), but they have also changed over time due to the complexity of local socio-economic and political conditions in the target regions. For instance, in Brazil, the main drivers have traditionally been cattle ranching and commercial soy production, but this has shifted to small-scale clearing more recently (Tyukavina et al., 2017; Lovejoy and Nobre, 2018). The Congo Basin has experienced forest loss due to subsistence agriculture, but selective logging and industrial agriculture have become key drivers in recent decades (Tyukavina et al., 2018). For Indonesia, the situation is changing from selective logging and oil palm plantations to greater pressures from small-scale farming (Gaveau et al., 2016; Austin et al., 2019). With the opening up of the Landsat archive in 2010 and advances in storage and processing of remote sensing data, the high-resolution Global Forest Change (GFC) data sets produced by Hansen et al. (2013) have allowed for more comprehensive investigations into the causal drivers of forest loss in protected areas and hence, in assessing their effectiveness for sustaining crucial ecosystem functions. For the period 2001–2012, Heino et al. (2015) found that global forest loss was 5% compared to a loss of 3% in protected forests, but there was large variation geographically; protected areas prevented loss of forests in some countries in South America and Southeast Asia while deforestation was higher than 5% in Australia and Oceania, and North America. Furthermore, a recent study by Wade et al. (2020) covering the period 2001–2018 showed a considerable increase in global tree loss of 12.2% compared to 4.1% in protected areas, with 32% of the tree loss occurring in South and Central America followed by North America, Eastern Europe, Africa and the Middle East. Hence, these findings confirm that the amount of forest loss would have been much greater if the protected areas had not been designated. In accordance, Shah et al. (2021) estimated that on a global scale, protected areas that were established between 2000 and 2012 helped to avoid 72% of deforestation in these areas (around 86K km2), increasing to 81% for protected areas designated as strictly protected. For tropical forest protected areas, a global analysis of deforestation found that although as much as 73% of protected areas experienced deforestation, 41% showed a reduction in tree loss in a 1 km buffer zone around protected areas, which further highlights the efficacy of this management intervention, however, with substantial opportunities for improvement, particularly for protected areas in Asia (Spracklen et al., 2015). Most strikingly, a global study quantifying how well countries' forests are protected found that although deforestation was drastically reduced and lowest in small reserves with low background deforestation rates, only 6.5 of the 17% foreseen by the Aichi Convention on Biodiversity target were effectively protected, which highlights that global targets for protected areas should include quantitative measures of effectiveness in addition to pure spatial extent (Wolf et al., 2021).
More recently, a semi-quantitative approach has been developed, which allows gathering data on the drivers of deforestation using crowdsourcing and Geo-Wiki (Laso Bayas et al., 2021). Outsourcing labeling tasks to the crowd (Howe, 2006) can result in large volumes of data collected, beyond what is possible using scientific resources alone. Geo-Wiki is an online crowdsourcing application for the visual interpretation of very high-resolution satellite imagery (Fritz et al., 2012; See et al., 2015). It has been used in several crowdsourcing campaigns, e.g., to validate a map of land availability for biomass (Fritz et al., 2013), to quantify field size globally (Fritz et al., 2015; Lesiv et al., 2019) and to collect data on cropland (Laso Bayas et al., 2017), respectively. The last campaign undertaken with Geo-Wiki was the “Drivers of Tropical Loss” in which a large sample drawn from an area 30° north and south of the equator was visually interpreted to extract the dominant driver of deforestation covering the period 2008–2019 (Laso Bayas et al., 2021). Here we present an update to the map developed by Curtis et al. (2018) (with regard to the spatial resolution and based on a much larger sample size), which we use to determine the effectiveness of protected areas in curbing tropical deforestation by continent.
Materials and Methods
Drivers of Forest Loss Layer
Curtis et al. (2018) produced the first spatially explicit map of the drivers of deforestation at a 10 km2 resolution for the period 2001–2015. From the GFC data set, they sampled 5,000 locations of forest loss that were then visually interpreted using imagery from Google Earth. Using a classification model and other input data sets such as population, MODIS data on fires, and land cover, they then allocated the dominant drivers of deforestation to areas of forest loss globally.
To produce an updated version of this layer for the period 2008–2019, a crowdsourcing campaign was run using Geo-Wiki. A random sample of 150K locations within an area bounded by 30° north and south latitude, covering the tropics as well as some sub-tropical regions, was selected using the global forest tree loss layer of Hansen et al. (2013) aggregated to 100 m resolution to choose locations where deforestation had occurred. The sample was generated using GIS software. This sample set was then randomly provided to volunteers for classification using the Geo-Wiki application on a first come first served basis. This means that a volunteer could potentially interpret a location from any geographical area within the area of interest. Shown in Figure 1A, each sample location is shown as a 1 × 1 km blue box, overlaid on top of very-high resolution imagery from Google Maps and Microsoft Bing Maps. Hansen's global forest tree loss layer is shown in red and indicates tree loss detection at any point between 2008 and 2019. We then asked volunteers to identify the dominant tree loss driver from a list of nine possible choices (Figure 1B and described in Table 1), visible in areas indicated by Hansen's tree loss pixels. Each sample location was classified a minimum of three times by different volunteers for quality control while 2K sample locations were classified by experts; the latter were used during the campaign to award or deduct points to ensure quality remained high. Once the sample was fully interpreted by the volunteers, the campaign was completed. More details of the campaign as well as the data set collected are available from Laso Bayas et al. (In review).
Figure 1
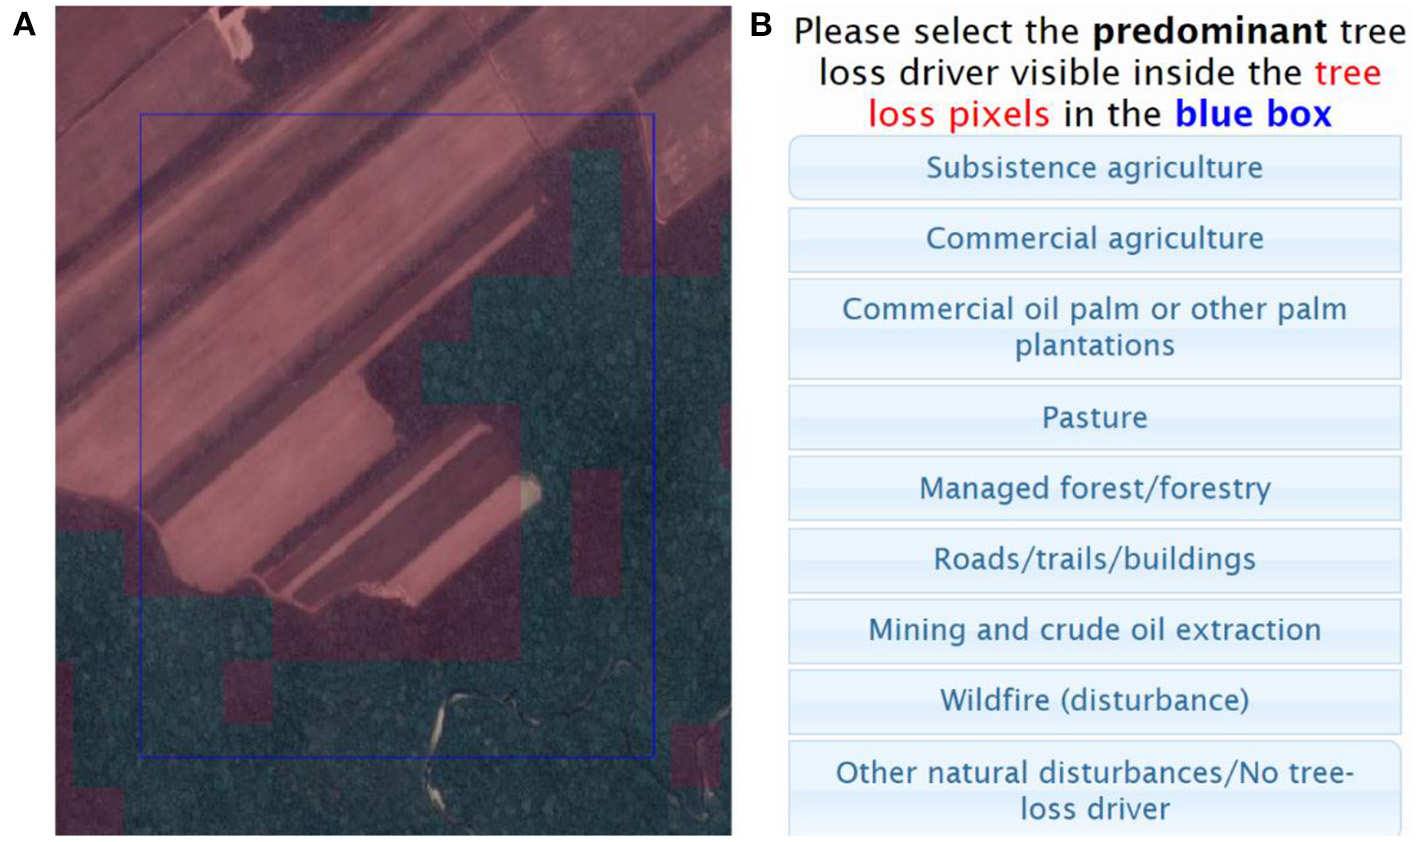
Parts of the Geo-Wiki interface for the “Drivers of Tropical Forest Loss” crowdsourcing campaign showing (A) the 1 km blue box for interpretation with Hansen's global forest loss layer shown in red (Source: Google Maps, n.d.) and (B) the set of drivers for volunteers to select as predominant driver. For this sample location, the dominant driver is “commercial agriculture”.
Table 1
| Dominant tree loss driver | Description |
|---|---|
| Subsistence agriculture | Relatively small fields (typically less than a quarter of the blue box), sometimes without defined borders. Includes agroforestry (combined trees and annual crops) in small fields, shifting cultivation (e.g., abandoned or burnt fields, fallow, bushes). Also includes mixed systems, where small crop fields, small scale pastures, and cattle, small patches of palms might be seen, e.g., in some countries in Africa. Remote sensing time-series were utilized to aid identification. |
| Commercial agriculture | Uniform/monoculture, large fields (typically larger than one quarter of the blue box). Sometimes they can be several small fields together or close by, all with the same land use. Includes permanent (tree-crops/fruit trees) or annual crops, e.g., citrus plantations, olive trees, vineyards, cereals, soybean, sugar cane, banana, and cacao plantations. It also includes commercial aquaculture. Excludes oil palm plantations. |
| Commercial oil palm and other palm plantation | Includes oil palm and other palms such as coconut plantations in large sized fields or several small fields together. |
| Pasture | Managed grasslands typically with signs of cattle around. May include sparse trees. Ponds of water with roads leading to or crossing trails may be signs of pasture. No obvious agricultural management visible. |
| Managed forest/forestry | Includes logging, timber plantations, managed forest, and replanted forest. This class also includes rubber plantations. |
| Roads/trails/buildings | Includes any built-up areas and infrastructure, as well as big and small roads or trails that may show human impact or urban expansion. |
| Mining and crude oil extraction | Includes open mining, small regular oil extraction platforms, and dams. |
| Wildfire | A large (typically larger than the blue box) burnt area with irregular borders. |
| Other natural disturbances/No tree loss driver | Drought, windthrow (trees uprooted by wind), flooding, or no tree loss driver present |
The dominant tree loss drivers in the Geo-Wiki “Drivers of Tropical Forest Loss” crowdsourcing campaign.
The 1 km sample pixels were used as centroids to generate Voronoi polygons. The 100 m aggregated pixels of tree loss from the GFC layer of Hansen that fell within these polygons were then used to assign the tree loss driver to each 1 km grid square within the area 30° north and south of the equator. The map by Curtis et al. (2018) did not differentiate between shifting cultivation and other types of subsistence agriculture, which are quite different underlying drivers. Here we extracted the shifting cultivation class from other subsistence agriculture using the map produced by Heinimann et al. (2017), where the classes of very low, low, medium and high were included in a conservative definition of shifting cultivation and the class none (meaning no cultivation) was categorized as other subsistence agriculture where it overlapped with subsistence agriculture in our driver data set.
As a check of the validity of our driver data set, we compared the amount of commodity-driven agricultural deforestation found in Curtis et al. (2018) with that obtained here. Curtis et al. (2018) found that 27 ± 5% of forest loss between 2001 and 2015 was due to commodity-driven agriculture. If we use the definitions of Curtis et al. (2018) to construct the commodity layer by aggregating the commercial agriculture, commercial oil palm, pasture, and mining classes, we find 22% of forest loss pixels allocated to commodity-driven deforestation. If we add areas with agriculture where no shifting cultivation has ever existed or has disappeared decades ago according to Heinimann et al. (2017), then the commodity-driven forest loss in our data set increases to 34%. Hence, we obtain values that are similar in magnitude to that of Curtis et al. (2018).
World Database on Protected Areas (WDPA)
Updated on a monthly basis, the location of protected areas is available as a vector file from the World Database on Protected Areas (WDPA) (IUCN and UNEP-WCMC, 2021). Developed and curated by the UN Environment Program, the International Union for Conservation of Nature (IUCN) and the World Conservation Monitoring Center (UNEP-WCMC), the data are provided by government agencies and other authoritative organizations. Protected areas are classified by the degree of protection using an IUCN categorization. For our analysis, we use the terms “strictly protected” to include categories I-IV, “not strictly protected” to mean categories IV and V, and “unknown status” to denote protected areas that are not reported with a category yet are still recognized by national governments or have an unknown category. From the version of the WDPA dated 21 August 2021, we extracted those protected areas that contain more than 10,000 ha of tree cover.
Tree Cover
We used the GFC tree cover layer of Hansen (for the year 2000) and calculated the deforestation at a resolution of approximately 1 km for the years 2008–2019. This layer was derived by setting a 10% tree cover threshold for each 30 m pixel and then aggregating the overall forest area to a 1 km percentage tree cover layer. It should be noted that when calculating tree cover using a 10% threshold, very small patches of trees will be included as tree cover, which differs from the forest cover definition of FAO, which defines forest as: Land with tree crown cover (or equivalent stocking level) of more than 10% and area of more than 0.5 hectares (ha). The trees should be able to reach a minimum height of 5 meters (m) at maturity in situ (FAO, 1998).
Analysis of Drivers
This analysis is limited to the 30° north and south of the equator, thus it focuses on tropical deforestation but also includes some sub-tropical areas. We overlaid the 1 km driver data on the protected areas that contain substantial amounts of tree cover (i.e., more than 10K ha) to extract the primary driver for each protected area; this was calculated as the most frequent driver occurring in the 1 km driver data set. We then calculated the overall area deforested by one of the 10 identified drivers for areas in the Americas, Africa and Asia that fall within the area 30° north and south of the equator. Finally, we computed statistics of drivers within protected areas for each continent and by different categories of protected areas, considering the protection levels as strict, non-strict and unknown following the categorization outlined in Section World Database on Protected Areas (WDPA) and proposed by Wolf et al. (2021). We note that this analysis is one of average deforestation reduction per continent, and it does not make use of auxiliary information on locational biases of protected areas within countries (Joppa and Pfaff, 2009). The percent reduction in deforestation by driver, x, and continent, y, was calculated using the following formula for protected areas (i):
Results
Dominant Drivers of Deforestation in Protected Areas
Figure 2 provides an overview of the data sets compiled in this analysis. The protected areas overlaid on tree cover for the year 2000 and the GFC layer of tree loss between 2008 and 2019 (Hansen et al., 2013) are shown in Figures 2A,B, respectively. Figure 2C presents the dominant driver of deforestation for the three continents, with zoomed in areas shown in Brazil, the Democratic Republic of Congo, Indonesia, and China. The more detailed zoomed in areas show the variability and presence of very diverse drivers (i.e., commercial agriculture in Brazil; shifting cultivation and other subsistence agriculture as well as natural disturbances, roads and commercial agriculture in the Democratic Republic of Congo; other subsistence agriculture, shifting cultivation, commercial oil palm and commercial agriculture in Indonesia; and mainly managed forests in China. Overall, we found that 5.6% of the overall forest area was deforested during the period 2008–2019 in the area 30° north and south of the equator. Figure 2D shows the primary driver within protected areas that have significant tree cover (i.e., >10,000 ha). The total amount of forest in the area 30 degrees north and south of the equator is 2,755 million ha. This is higher than the 1,800 million ha of forest in tropical areas (FAO, 2021) since we cover a greater area than the tropics. The amount of forest in protected areas is calculated as 1,135 million ha.
Figure 2
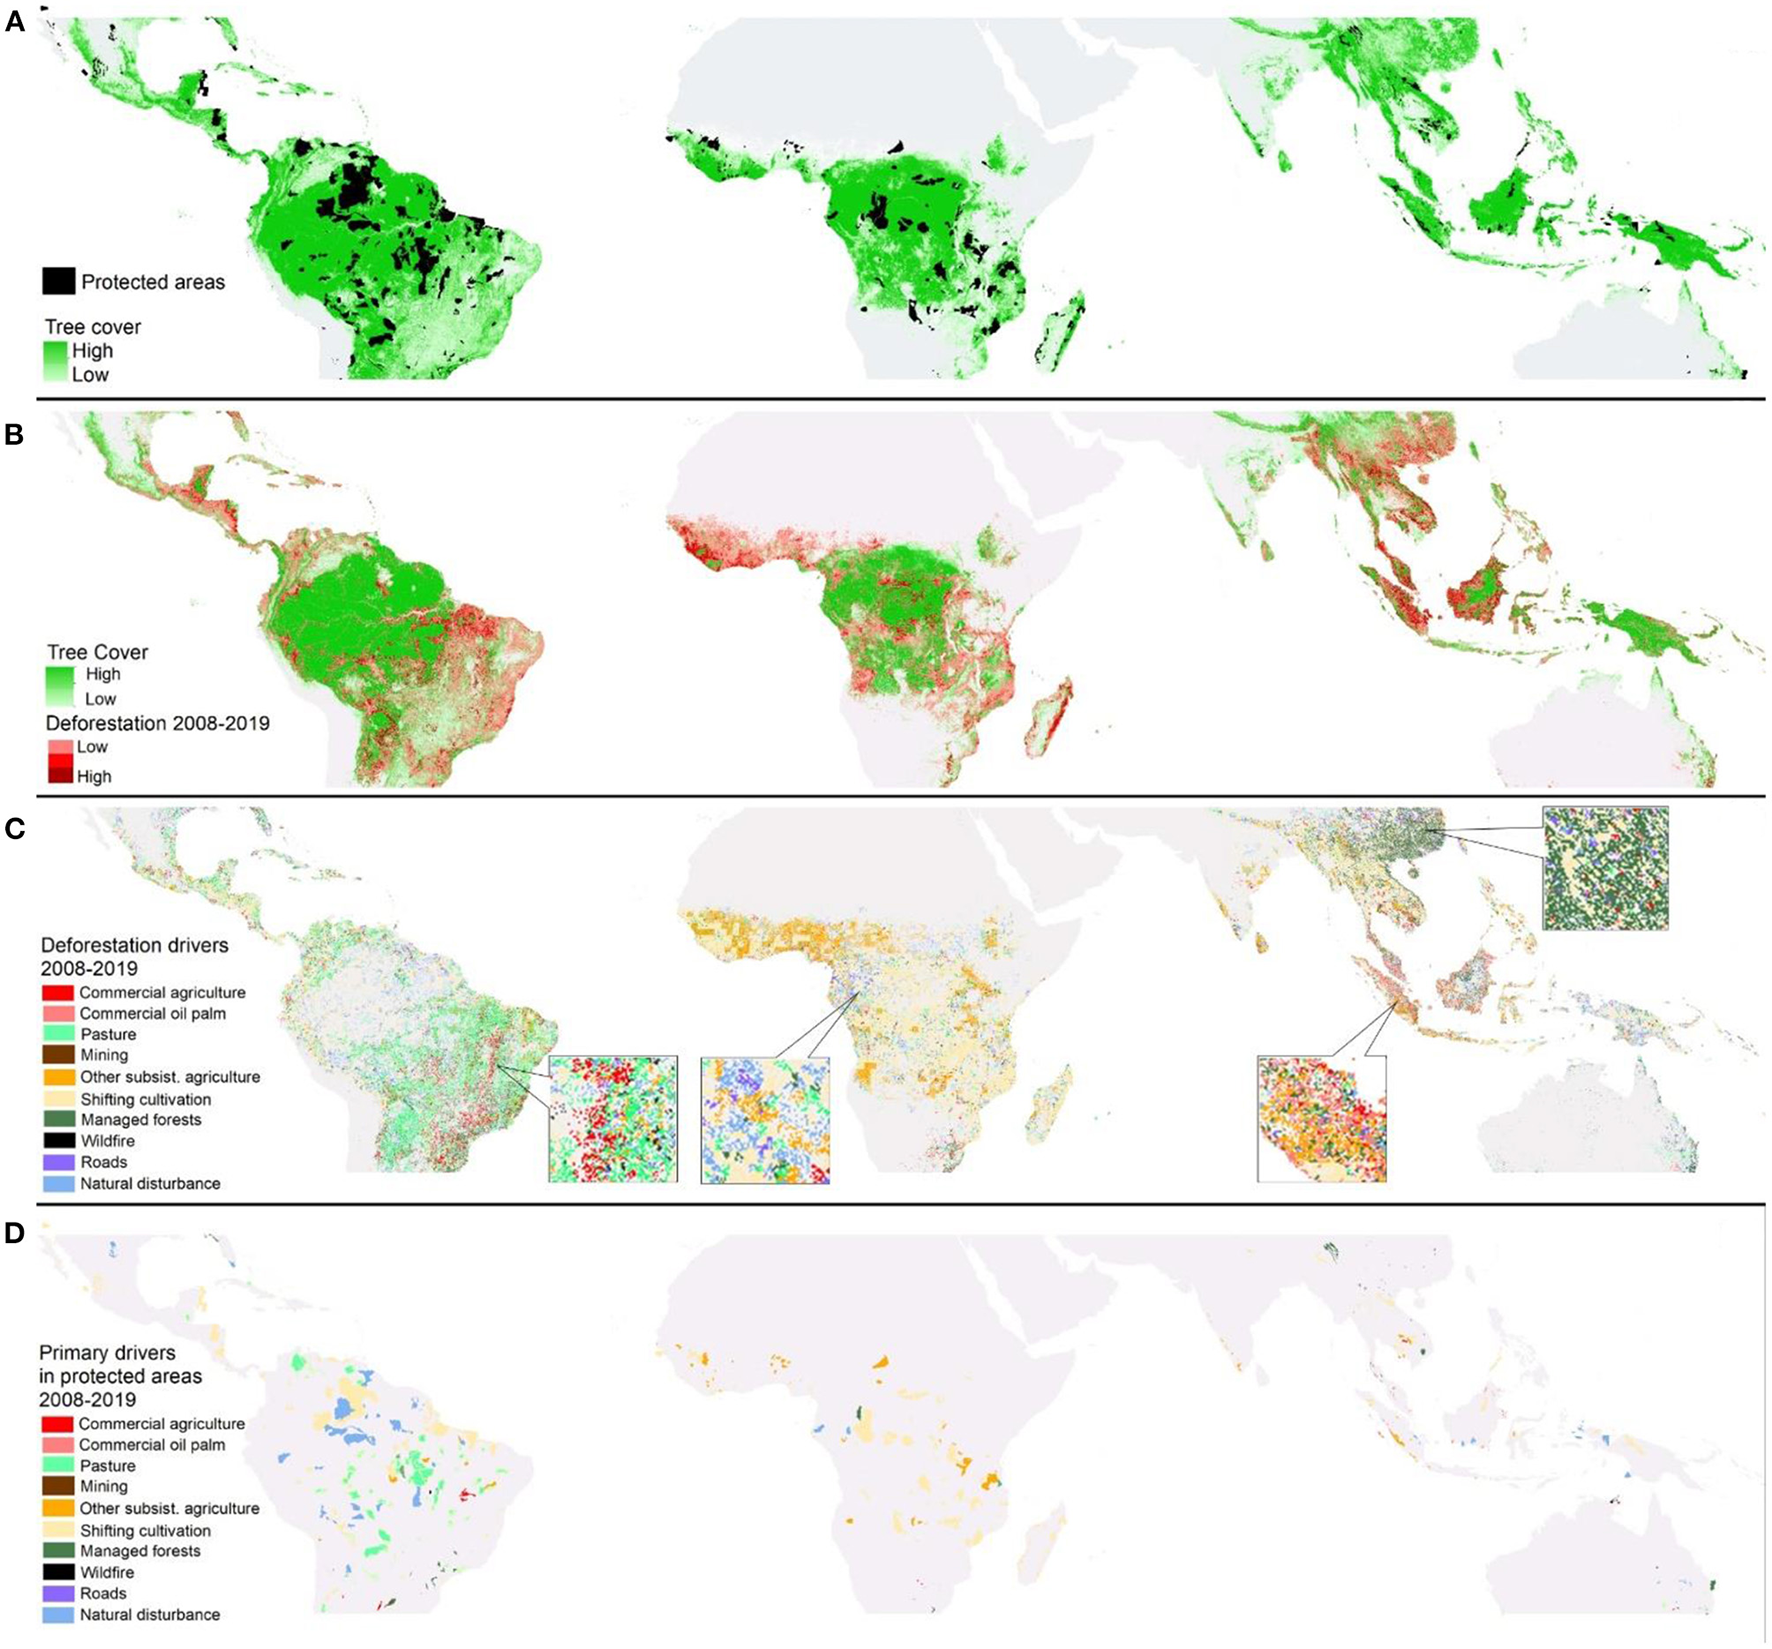
(A) Protected areas and percentage tree cover in 2000; (B) Deforestation between 2008 and 2019 and tree cover in 2000; (C) The primary drivers of deforestation (2008–2019) in tropical areas; and (D) in protected areas with forest cover >10,000 ha. Source: World Database of Protected Areas; Global Forest Change data sets (Laso Bayas et al., 2021).
Drivers of Deforestation in the Latin Americas, Africa, and Asia (30° N and S of the Equator) for the Period 2008–2019
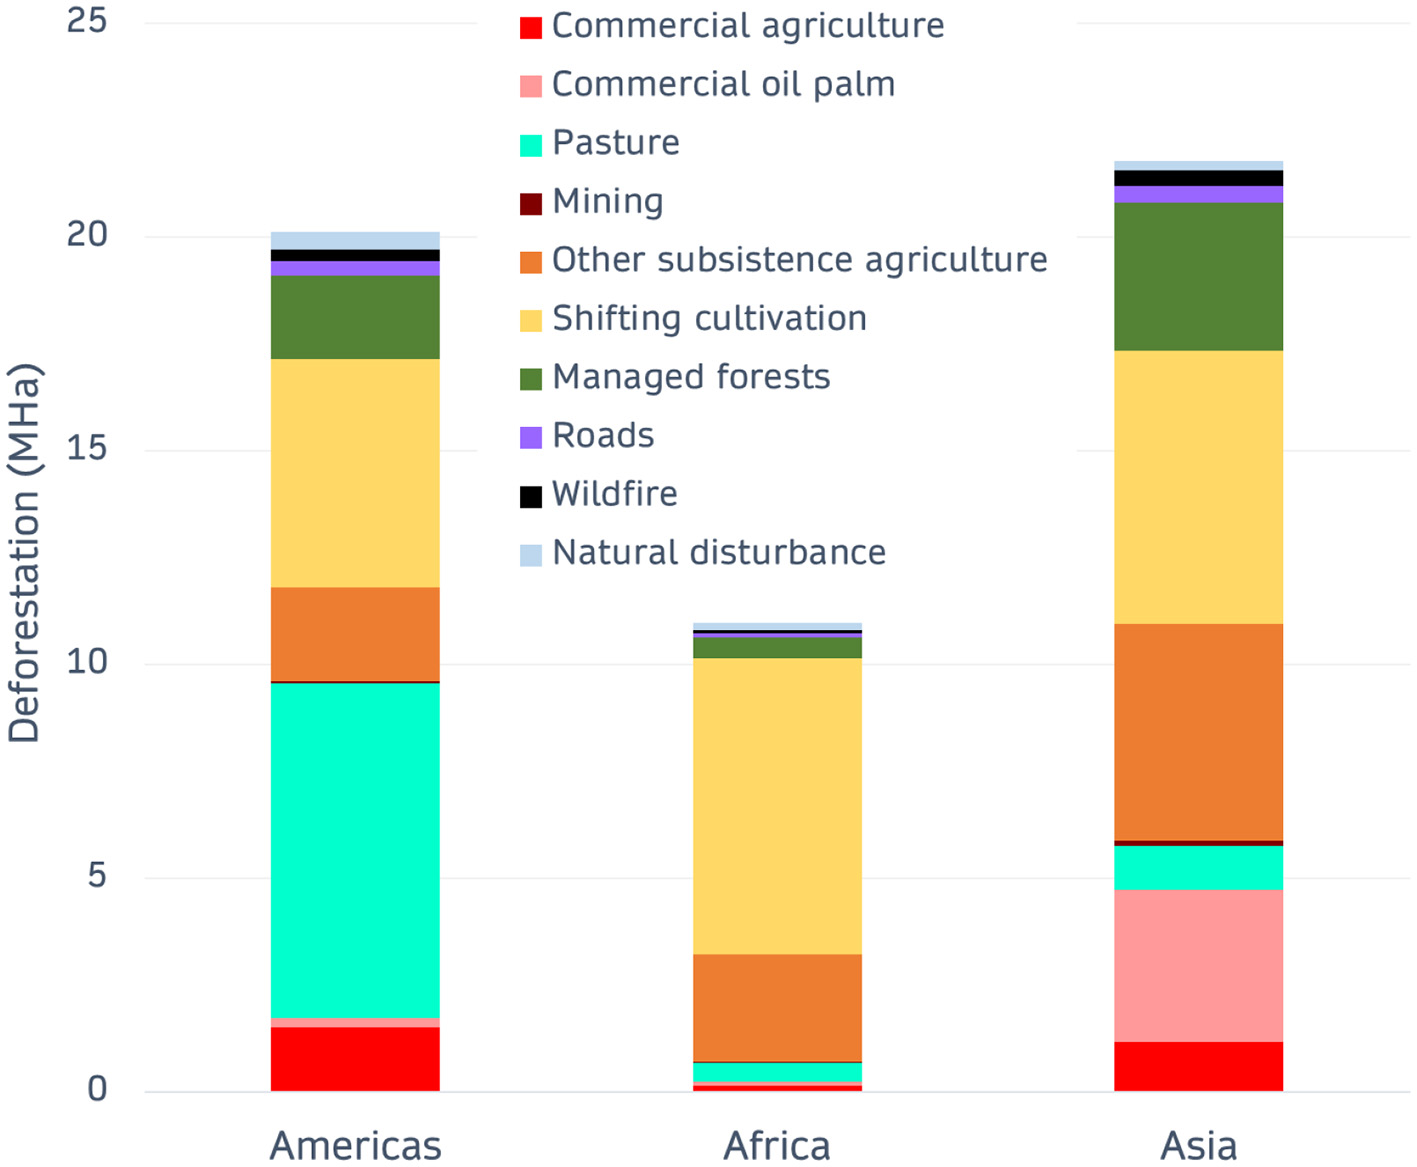
Figure 3 shows the overall deforested area in the three continents by driver. The overall amount of deforestation is 148 million ha, where the largest amount occurred in the Latin Americas (59 million ha), followed by Asia (48 million ha) and Africa (42 million ha). The largest share of deforestation in the Americas can be attributed to pasture followed by shifting cultivation and other subsistence agriculture. However, there is also evidence of other drivers including managed forests, commercial agriculture, natural disturbances, roads, wildfires, mining, and a very small amount of commercial oil palm. In Asia, forest management together with oil palm have the largest share followed by shifting cultivation and other subsistence agriculture; there is also evidence of natural disturbances, pastures, roads, wildfire, and mining as drivers. The patterns are very different in Africa where shifting cultivation and other subsistence agriculture are the dominant drivers while all other drivers play a minor role in deforestation.
Figure 3
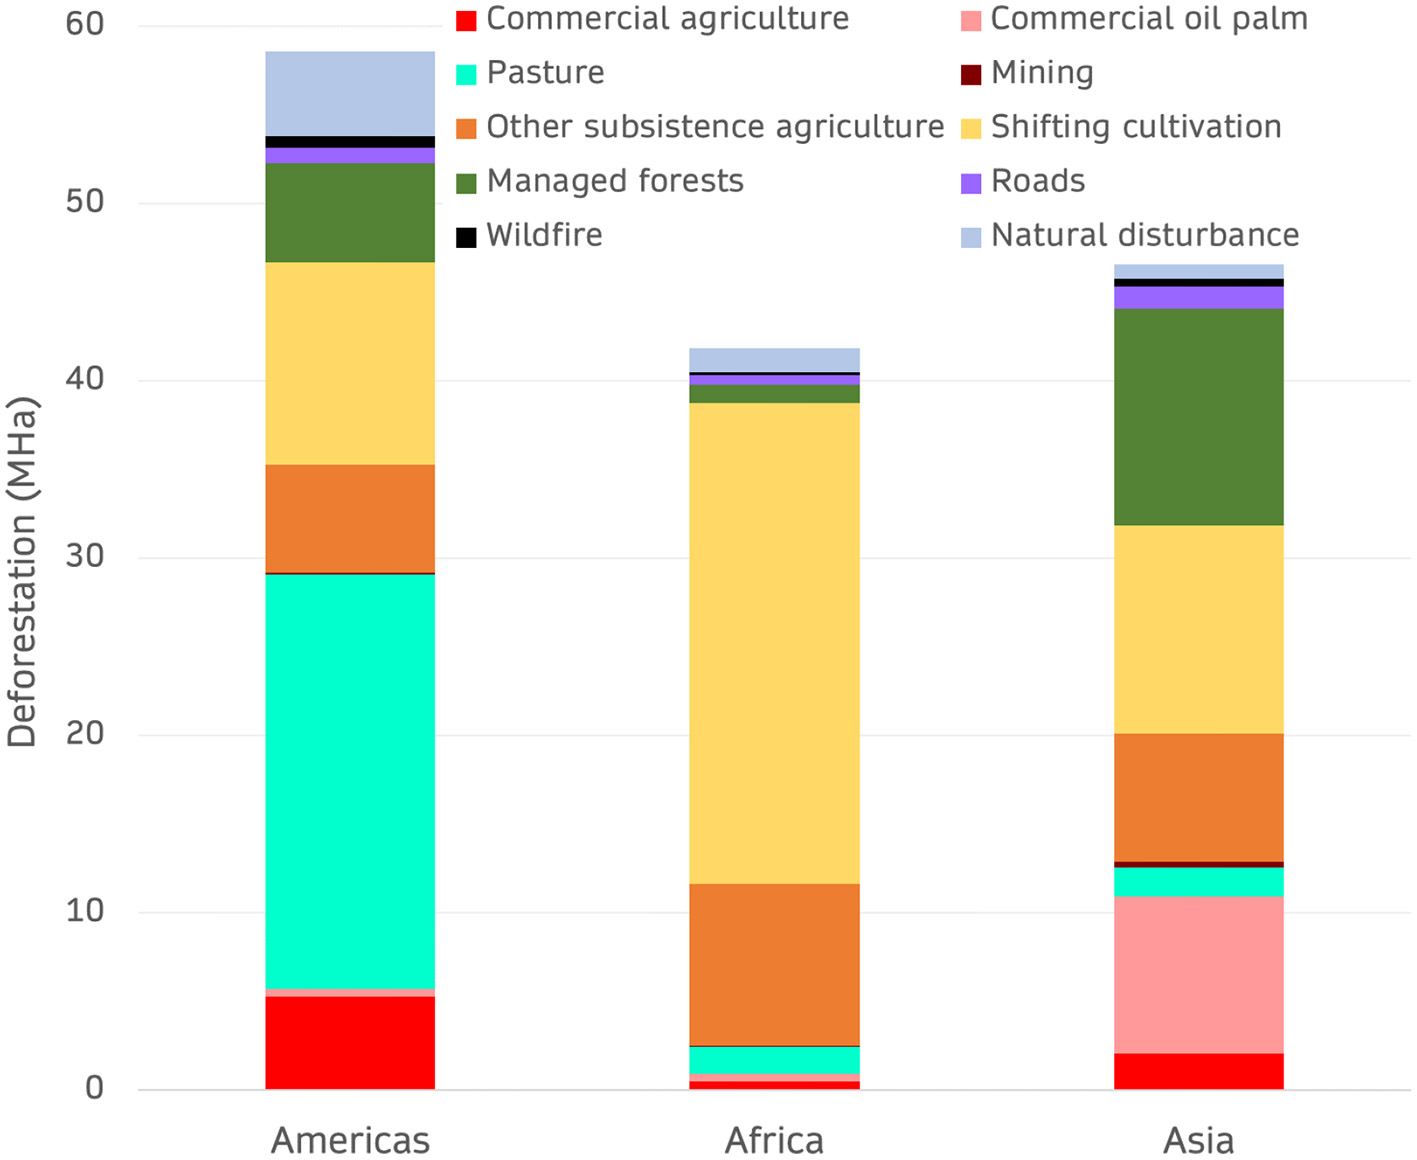
The amount of deforestation (in MHa) by driver in the Americas, Africa, and Asia in the area 30° latitude north and south of the equator.
Figure 4 shows the percentage of deforestation by driver and continent. When compared to the entire forest area located within 30° north and south of the equator, we can see that the percentage of deforestation was highest in Asia (8.1%), where a large share can be attributed to managed forest, particularly in China (see Figure 2C), followed by the Latin Americas (5.4%) and Africa (3.9%).
Figure 4
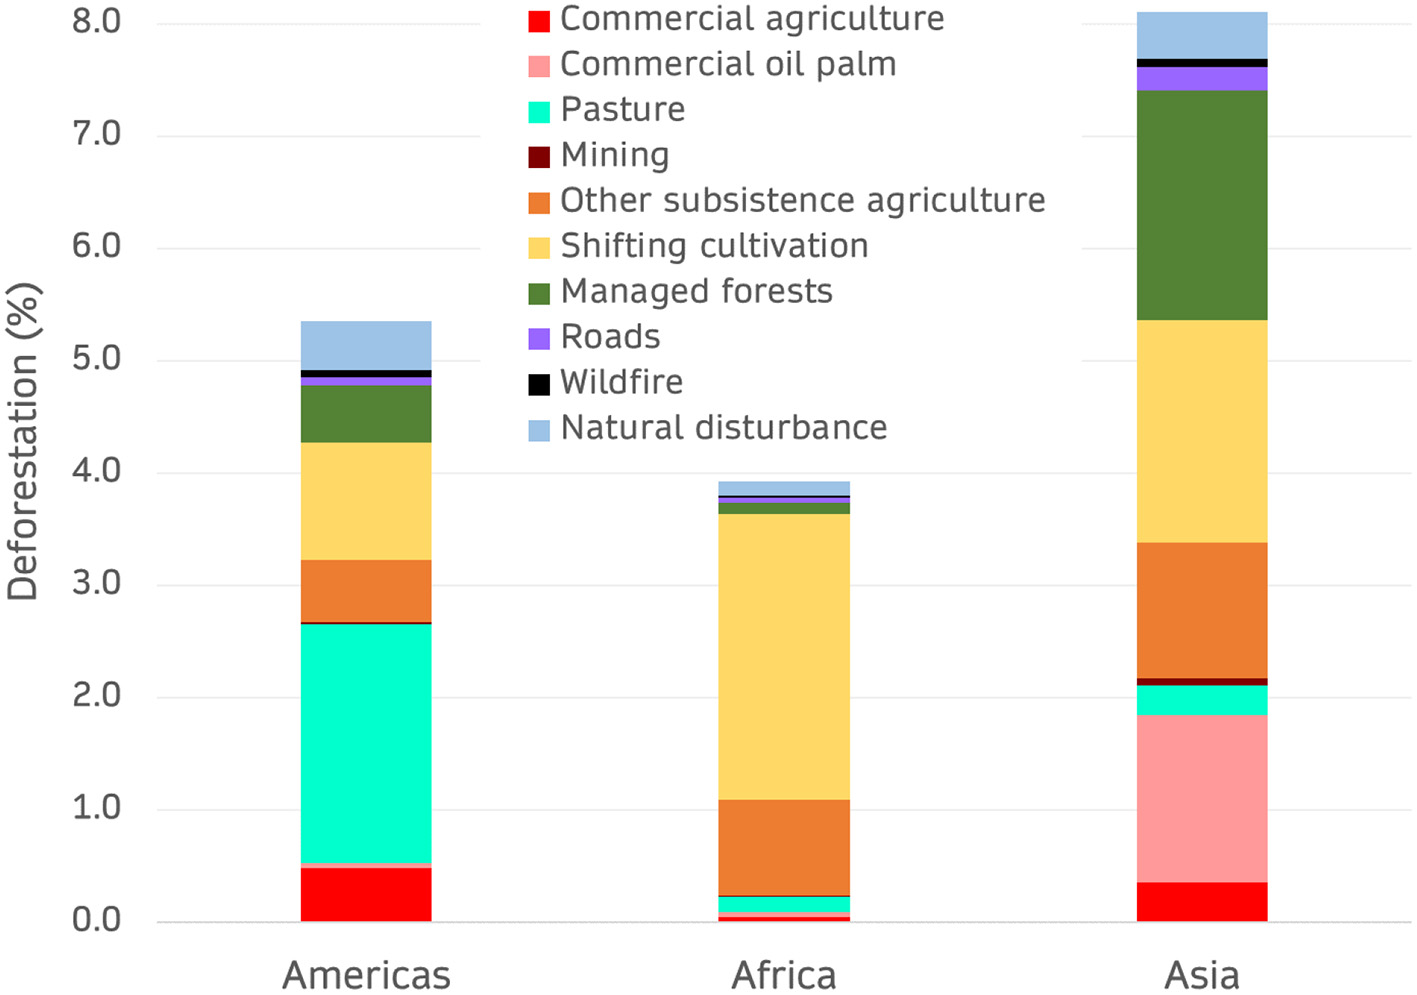
Percentage deforestation by driver for the Americas, Africa, and Asia in the area 30° latitude north and south of the equator.
Drivers of Deforestation in Protected Areas
As shown in Figure 2D, the dominant and hence most frequent drivers in protected areas vary widely between continents. In the Latin Americas, they are dominated geographically by pasture, shifting cultivation, and natural disturbances, by shifting cultivation and other subsistence agriculture in Africa, and in Asia, by shifting cultivation and other subsistence agriculture, natural disturbances, and forest management, as well as oil palm in some smaller protected areas in this region. Figure 5 shows the total deforestation in million ha inside protected areas in each continent by the type of driver. Compared to the overall deforestation in the different continents, the distribution of the different drivers in protected areas is very similar, again showing that pastures play the most important role in the Latin Americas compared to a much smaller share in Asia and Africa. It can also be noted that deforestation is the highest in protected areas in Asia. Computing the percentage of deforestation as a share of the total tree cover area, the deforestation rates in protected areas are still lower than the continental average for the Latin Americas (3.4% compared to 5.4%) and Africa (3.3% compared to 3.9%), but they are slightly higher in Asia (8.5% compared to 8.1%).
Figure 5
The amount of deforestation (in MHa) in protected areas by driver in the Americas, Africa, and Asia in the area 30° latitude north and south of the equator.
Figure 6 shows the percentage deforestation by protection level (strictly protected, not strictly protected and unknown status), by driver and by continent to understand if the degree of protection has any effect on the rate of deforestation. Strikingly, the strictly protected areas do not have lower deforestation rates in the 2008–2019 period than non-strictly protected areas for the Latin Americas and Africa. For the Latin Americas and Asia, protected areas with unknown status have lower deforestation rates than the other two categories while deforestation is higher in protected areas of unknown status in Africa. It can also be observed that shifting cultivation and other subsistence agriculture occurs in all continents for all levels of protection. In Asia, oil palm and commercial agriculture show slightly lower deforestation rates in strictly protected areas compared to non-strictly protected areas although they represent the most important drivers in protected areas overall. What is even more striking is that commercial agriculture as well as pasture have higher deforestation rates in strictly protected areas in the Latin Americas relative to the background deforestation reduction by continent. Another anomaly that can be identified in the Latin Americas is that lower deforestation rates can be observed in protected areas with unknown protection status, and that shifting cultivation plays a less significant role in these protected areas. In the case of wildfires, the largest rate of deforestation associated with this driver occurs in strictly protected areas in Asia compared to other protection levels and continents. As already outlined, managed forest plays a significant role in Asia in protected areas as well as outside although it is highest in the protected areas with unknown status.
Figure 6
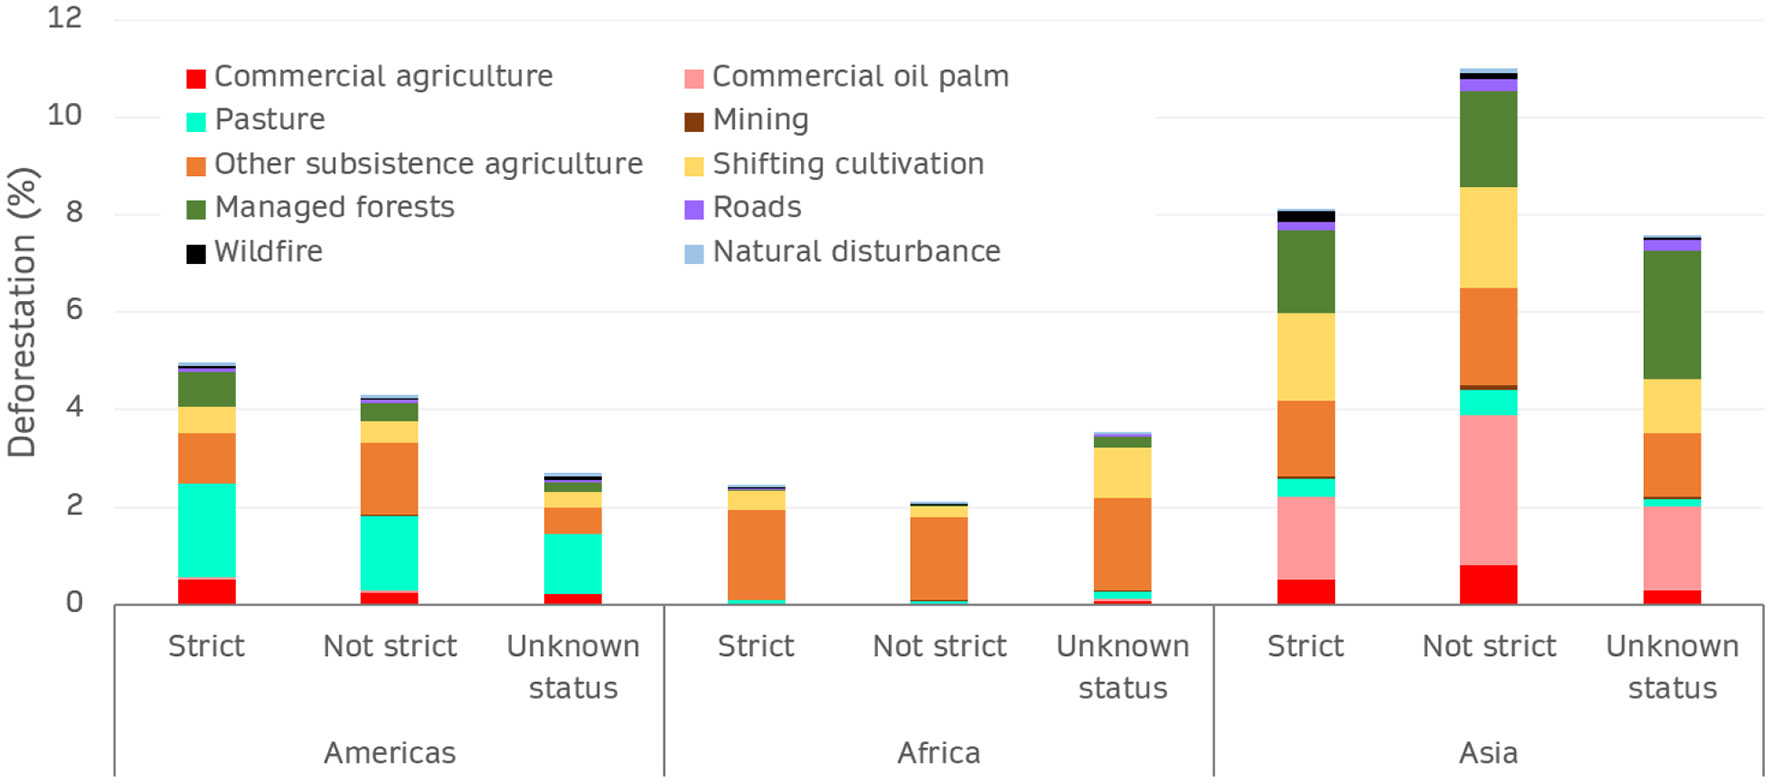
Percentage deforestation in protected areas by driver and degree of protection for the Americas, Africa, and Asia in the area 30° latitude north and south of the equator.
To highlight the influence of protected areas, Figure 7 shows the percentage reduction in deforestation by driver when compared to the “background” deforestation level over the entire continent for Latin America, Africa, and Asia and for selected drivers that cover a large area. Negative numbers indicate that there is a higher percentage deforestation in protected areas vs. the average percentage rate over the entire continent. When the number drops below minus 100%, this means that the deforestation rate inside the protected area is more than two times higher inside the protected area for a specific driver. What is most striking is that for almost all drivers except shifting cultivation, we can observe negative percentages in Asia (Figure 7), which indicates that large scale human activities leading to tree cover loss have been carried out inside protected areas. In Asia, other subsistence agriculture is the largest driver in both strictly protected and non-strictly protected areas followed by commercial agriculture (including oil palm). Apart from oil palm and other subsistence agriculture, the protected areas with unknown protection status in Asia seem to have less deforestation than the strictly protected and non-strictly protected category. Other subsistence agriculture is also observed to have a higher deforestation within strictly protected and non-strictly protected areas than the “background” continental deforestation in the Americas as well as commercial oil palm in non-strictly protected areas. In particular in Africa all protected areas with a known protection status seem to protect relatively well against commercial agriculture including commercial oil palm whereas the protected area with unknown protection status shows a lower overall protection.
Figure 7
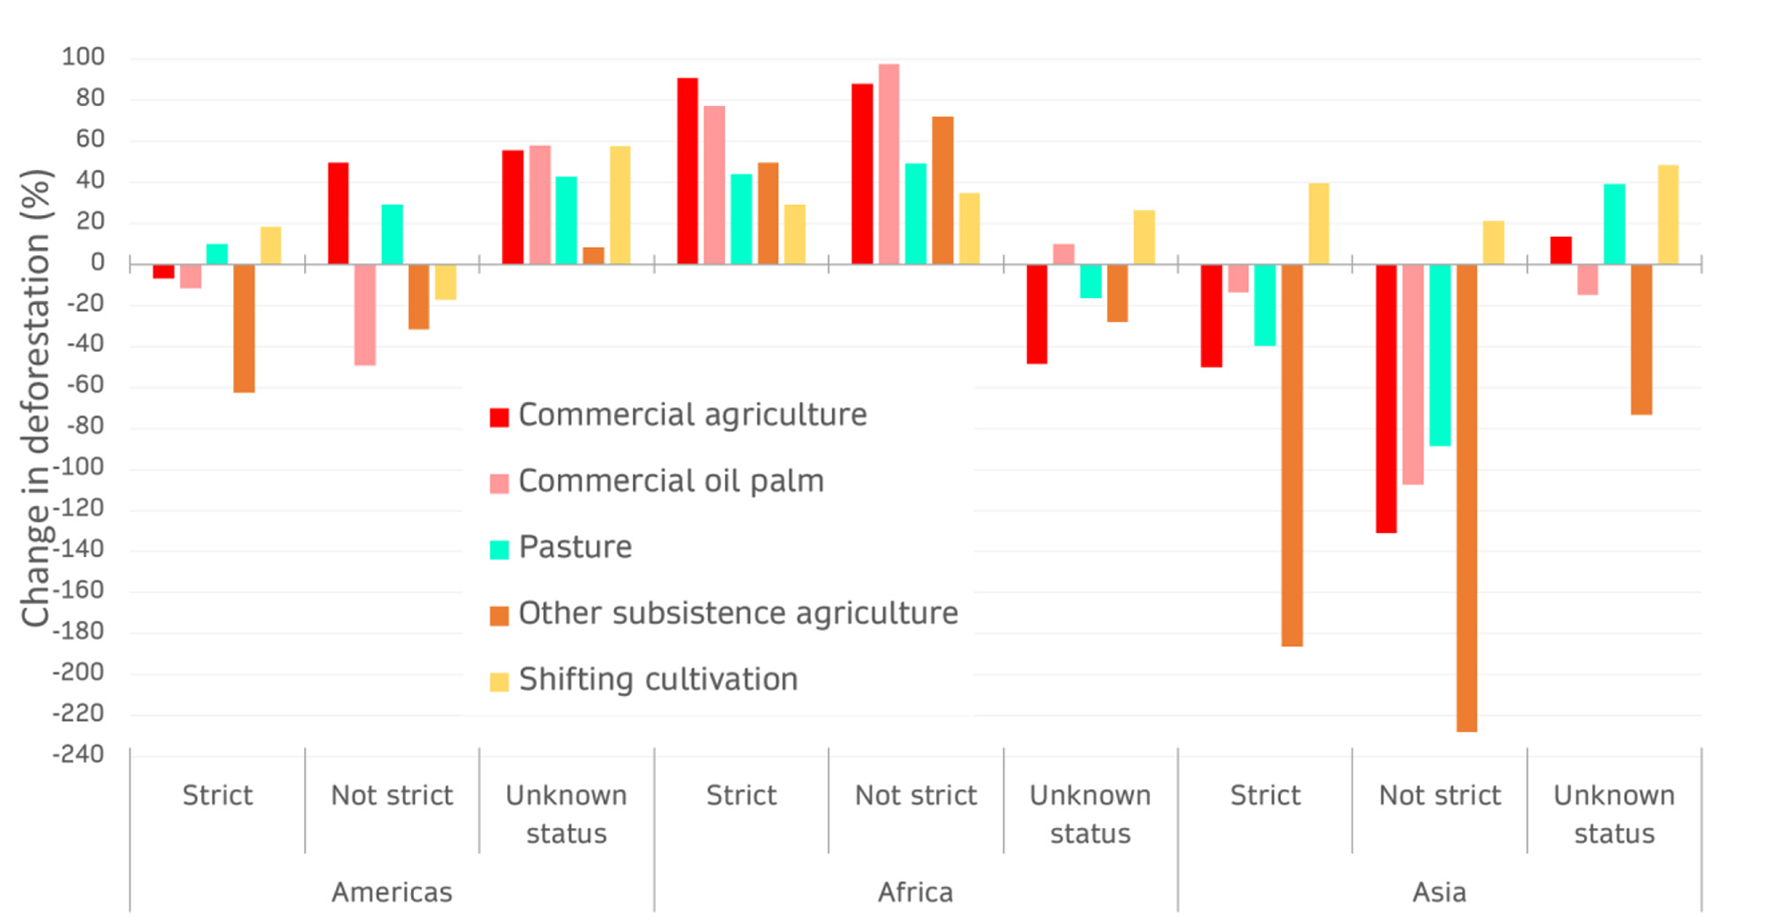
Percentage reduction in deforestation in protected areas by driver and by degree of protection (grouped into strict, non-strict, and unknown) for the Americas, Africa, and Asia in the area 30° latitude north and south of the equator.
Discussion
This study represents the first attempt at quantifying the drivers of deforestation inside protected areas and by continent using a new spatially explicit crowdsourced driver data set (Laso Bayas et al., 2021). It represents a more up-to-date and higher resolution version of that produced by Curtis et al. (2018). Through this study, we found some results that confirm previous findings in the literature. For example, we found that overall deforestation rates in protected areas in the Latin Americas and Africa are lower than total deforestation, confirming that protected areas are helping to curb deforestation as found by others (Heino et al., 2015; Shah et al., 2021). We also found that protected areas are less effective in curbing deforestation in Asia, which was also observed in the study by Spracklen et al. (2015). Moreover, this is in line with the more general findings of Wolf et al. (2021), who showed that of the 15.7% of protected areas, only 6.5% are providing strict protection.
In terms of the main drivers of deforestation by continent, we found that they are in line with those identified in the analysis by Seymour and Harris (2019), even though their summary only covers a few countries/regions and is based on a sample rather than a spatially explicit mapping approach. For example, the main drivers in the Latin Americas are pasture and shifting cultivation, which matches the traditional cattle ranching found in Brazil and in other parts of Latin America but also the more recent shift to small-scale agriculture (Tyukavina et al., 2017; Lovejoy and Nobre, 2018). Africa is still mostly dominated by subsistence agriculture and shifting cultivation as found in the Congo Basin, but there is also some evidence of managed forests, wildfires, roads, and commercial agriculture confirming this trend toward more selective logging and industrial agriculture (Tyukavina et al., 2018). Similarly, Asia is dominated by shifting cultivation and other subsistence agriculture, commercial oil palm, and managed forests, all of which have been identified as drivers in an Indonesian context (Gaveau et al., 2016; Austin et al., 2019).
We also found results that are contrary to what appears in the literature, in particular regarding patterns of deforestation within strictly protected areas, defined here as IUCN category I–IV. For example, studies have generally found that stricter categories of protected areas reduce deforestation more than protected areas with no strict protection (Wade et al., 2020; Shah et al., 2021; Wolf et al., 2021), while we found the opposite effect across all three continents. However, Wolf et al. (2021) noted the effect in only a few, small regions. This finding needs further examination but category IV, which we include in the definition of strict protection, covers a large area globally and may be subject to human activities. For example, Jones et al. (2018) found that the mean human footprint of category IV protected areas is larger than in categories I to III, with around 37% of these category IV areas under intense human pressure. Nonetheless, we recognize that these patterns may not hold if a true counterfactual approach had been used; therefore, we urge caution in using these preliminary findings for guiding any decisions.
We, furthermore, note that although roads were shown to play a negligible role for deforestation in terms of the spatial area that they cover, they usually represent the initial driver of land clearing (Barber et al., 2014), which is then further driven by subsistence agriculture or commercial exploitation of the area. From a spatial extent, mining was also shown to have a small impact on the amount and rate of deforestation because the areal coverage is small, yet mining will result in the building of new roads, which will trigger further exploitation and possibly lead to other forms of anthropogenic drivers such as subsistence or even commercial agriculture. A recent exercise in visual interpretation of satellite imagery for mining areas by Maus et al. (2020) revealed that more than 50% of mines were concentrated in only five countries, three of which are partly covered here: Australia, China, and Chile. This sample data set could be integrated into the map of drivers of forest loss in the future.
Even though foregoing studies have shown that the quality of crowdsourcing campaigns can be high (Hill and Ready-Campbell, 2011; See et al., 2013; Hsing et al., 2018), and the crowdsourced sample data set has been validated in this study, we acknowledge that the data collection may not be as accurate as expert classification. Moreover, the drivers identified in the imagery may only be potential drivers of deforestation. We asked the volunteers in the crowdsourcing campaign to select the most recent imagery that was available in Geo-Wiki, so the driver classified by the volunteers refers to the year when the latest very high-resolution image was available. However, if the available image was relatively old, then a new primary driver might have replaced the previous one. The interpolated map uses the timestamp and driver of the closest sample, so we acknowledge this potential limitation in the data set. Nonetheless, compared to other spatially; explicit mapping approaches, our analysis represents a major improvement over previous studies, e.g., by Wade et al. (2020), who used transitions in land cover over time as proxies for drivers, which could only be further investigated in a small number of case studies using very high-resolution satellite imagery. We further extend upon the data set by Curtis et al. (2018) by differentiating between shifting cultivation and “other subsistence agriculture” by using an additional data layer produced by Heinimann et al. (2017). In shifting cultivation, regrowth happens, which makes shifting cultivation, if practiced with long deforestation cycles, more sustainable. However, the results from shifting cultivation should be used with caution. It is very likely that the shifting cultivation category might be smaller since we took a conservative approach and categorized all possible shifting cultivation classes in Heinimann et al. (2017) as shifting cultivation (including very low, low, medium, and high). In the future, we plan to categorize shifting cultivation more accurately using a longer time series of NDVI built into Geo-Wiki as part of a further crowdsourcing campaign.
We acknowledge that a sampling approach as applied in the study presented by Seymour and Harris (2019) is also valid, but the advantage of spatially-explicit maps is that the drivers can be spatially located and overlaid with other layers such as protected areas, thus providing a more comprehensive and spatially explicit picture of the dominant drivers. Furthermore, we are aware that the overall deforestation per continent used to compare data inside protected areas with the average background deforestation does not follow a stratified approach to find similar environmental conditions based on counterfactuals (Geldmann et al., 2019; Shah et al., 2021). Nevertheless, we feel that the study adds value to the current literature on drivers and complements other studies that use counterfactuals by providing additional insights, e.g., that strictly protected areas appear to protect less than non-strict protected areas when counterfactuals are not used. Both improvements to the current drivers layer, e.g., using a model to distribute drivers spatially, and the additional use of counterfactuals could be potential improvements in the future. Furthermore, our study provides only overall averages and does not show spatial differences in the effectiveness of protected areas in different countries. Hence, we were unable to examine smaller protected areas in more detail, which may be more effective at reducing deforestation than larger ones (Wolf et al., 2021), but we propose to examine the spatial variation and effectiveness according to size in a follow up study.
Conclusions
Drivers of deforestation have been studied from local to global scales and in relation to the effectiveness of protected areas in reducing or avoiding deforestation. This study adds to the current knowledge on the dominant drivers of deforestation in protected areas, confirming previous results but also producing outcomes that contrast with foregoing studies, particularly with regard to the degree of protection, which requires further investigation. The main advantage of the data set used in this analysis is that it was based on a much larger sample size of crowdsourced, visually interpreted forest loss drivers investigated over the period 2008–2019. A further innovation is the differentiation between small-scale land-use change, such as observed from shifting cultivation and other subsistence agriculture, made possible through integration of the dataset published by Heinimann et al. (2017) and thereby improving upon the previous study by Curtis et al. (2018). We also highlighted limitations in this preliminary study ranging from potential improvements to the next version of the driver layer, a further investigation into the impact of protected area size, and the use of a counterfactual approach to calculate avoided deforestation.
This work has, furthermore, shown that much of the deforestation is occurring in national parks, even in those with a relatively strict protection level. The drivers in protected areas are, to a large extent, mirroring the continental patterns. In Asia protected areas are on average the least effective. In order to meet Aichi Target 11.1, particularly in terms of quality of the protected areas, and the commitments on zero deforestation made in Glasgow in 2021, it will, therefore, be necessary to monitor large, protected areas more rigorously in the future. This can be achieved by using remote sensing technologies and early warning systems [e.g., the Global Analysis and Discovery (GLAD) and the RAdar for Detecting Deforestation (RADD) alert systems], which will allow early detection of deforestation fronts. However, such early warning systems will only operate if the necessary institutions are in place, and if national park authorities have sufficient staff to patrol and monitor the ongoing alerts. Citizen science and community monitoring could also play a critical role in providing more contextual information once an early alert on new deforestation in parks has been received.
Publisher's Note
All claims expressed in this article are solely those of the authors and do not necessarily represent those of their affiliated organizations, or those of the publisher, the editors and the reviewers. Any product that may be evaluated in this article, or claim that may be made by its manufacturer, is not guaranteed or endorsed by the publisher.
Statements
Data availability statement
The original contributions presented in the study are included in the article; further inquiries can be directed to the corresponding author.
Author contributions
All authors listed have made a substantial, direct, and intellectual contribution to the work and approved it for publication.
Acknowledgments
The authors would like to thank the 58 volunteers who contributed to the citizen science campaign, in which the data collected were used to create the underlying drivers of tropical loss data set in the frame of the High ILUC-risk fuels project (HILUC Lot 1, https://iluc.guidehouse.com/lot-1), providing technical assistance to the European Commission. All authors gratefully acknowledge funding from IIASA and the National Member Organizations that support the institute.
Conflict of interest
The authors declare that the research was conducted in the absence of any commercial or financial relationships that could be construed as a potential conflict of interest.
References
1
AdamsV. M.ViscontiP.GrahamV.PossinghamH. P. (2021). Indicators keep progress honest: A call to track both the quantity and quality of protected areas. One Earth.4, 901–906. 10.1016/j.oneear.2021.06.014
2
AustinK. G.SchwantesA.GuY.KasibhatlaP. S. (2019). What causes deforestation in Indonesia?Environ. Res. Lett.14, 024007. 10.1088/1748-9326/aaf6db
3
BarberC. P.CochraneM. A.SouzaC. M.LauranceW. F. (2014). Roads, deforestation, and the mitigating effect of protected areas in the Amazon. Biol. Conserv.177, 203–209. 10.1016/j.biocon.2014.07.004
4
BettsM. G.WolfC.RippleW. J.PhalanB.MillersK. A.DuarteA.et al. (2017). Global forest loss disproportionately erodes biodiversity in intact landscapes. Nature547, 441–444. 10.1038/nature23285
5
BuchananG. M.ButchartS. H. M.ChandlerG.GregoryR. D. (2020). Assessment of national-level progress towards elements of the Aichi Biodiversity Targets. Ecol. Indic.116, 106497. 10.1016/j.ecolind.2020.106497
6
BuschJ.Ferretti-GallonK. (2017). What drives deforestation and what stops it? A meta-analysis. Rev. Environ. Econ. Policy11, 3–23. 10.1093/reep/rew013
7
CurtisP. G.SlayC. M.HarrisN. L.TyukavinaA.HansenM. C. (2018). Classifying drivers of global forest loss. Science361, 1108–1111. 10.1126/science.aau3445
8
FAO (1998). Appendix 1: Definitions as in FRA Working Paper 1 and Comments. Available online at: https://www.fao.org/3/ad665e/ad665e06.htm (accessed December 06, 2021).
9
FAO (2021). Global Forest Resources Assessments. FRA 2020 Remote Sensing Survey. Available online at: https://www.fao.org/forest-resources-assessment/remote-sensing/fra-2020-remote-sensing-survey/en/ (accessed December 06, 2021).
10
FritzS.McCallumI.SchillC.PergerC.SeeL.SchepaschenkoD.et al. (2012). Geo-Wiki: An online platform for improving global land cover. Environ. Model. Softw.31, 110–123. 10.1016/j.envsoft.2011.11.015
11
FritzS.SeeL.McCallumI.YouL.BunA.MoltchanovaE.et al. (2015). Mapping global cropland and field size. Glob. Change Biol21, 1980–1992. 10.1111/gcb.12838
12
FritzS.SeeL.van der VeldeM.NalepaR. A.PergerC.SchillC.et al. (2013). Downgrading recent estimates of land available for biofuel production. Environ. Sci. Technol.47, 1688–1694. 10.1021/es303141h
13
GaveauD. L. A.SheilD.HusnayaenSalimM. A.ArjasakusumaS.AncrenazM.et al. (2016). Rapid conversions and avoided deforestation: examining four decades of industrial plantation expansion in Borneo. Sci. Rep.6, 32017. 10.1038/srep32017
14
GeistH. J.LambinE. F. (2002). Proximate causes and underlying driving forces of tropical deforestation. BioScience52, 143–150. 10.1641/0006-3568(2002)052[0143:PCAUDF]2.0.CO;2
15
GeldmannJ.ManicaA.BurgessN. D.CoadL.BalmfordA. (2019). A global-level assessment of the effectiveness of protected areas at resisting anthropogenic pressures. Proc. Natl. Acad. Sci. U.S.A.116, 23209–23215. 10.1073/pnas.1908221116
16
Glasgow Leaders CoP26 (2021). Glasgow Leaders' Declaration on Forests and Land Use. Avaialble online at: https://ukcop26.org/glasgow-leaders-declaration-on-forests-and-land-use/ (accessed December 06, 2021).
17
HansenM. C.PotapovP. V.MooreR.HancherM.TurubanovaS. A.TyukavinaA.et al. (2013). High-resolution global maps of 21st-century forest cover change. Science342, 850–853. 10.1126/science.1244693
18
HeinimannA.MertzO.FrolkingS.Egelund ChristensenA.HurniK.SedanoF.et al. (2017). A global view of shifting cultivation: Recent, current, and future extent. PLoS ONE12, e0184479. 10.1371/journal.pone.0184479
19
HeinoM.KummuM.MakkonenM.MulliganM.VerburgP. H.JalavaM.et al. (2015). Forest loss in protected areas and intact forest landscapes: a global analysis. PLoS ONE10, e0138918. 10.1371/journal.pone.0138918
20
HillS.Ready-CampbellN. (2011). Expert stock picker: the wisdom of (experts in) crowds. Int. J. Electr. Commer.15, 73–102. 10.2753/JEC1086-4415150304
21
HoweJ. (2006). The rise of crowdsourcing. Wired Magazine14, 1–4.
22
HsingP.BradleyS.KentV. T.HillR. A.SmithG. C.WhittinghamM. J.et al. (2018). Economical crowdsourcing for camera trap image classification. Remote Sens. Ecol. Conserv.4, 361–374. 10.1002/rse2.84
23
IUCN and UNEP-WCMC (2021). The World Database on Protected Areas (WDPA). Cambridge: UNEP-WCMC. Available online at: www.protectedplanet.net (accessed December 06, 2021).
24
JonesK. R.VenterO.FullerR. A.AllanJ. R.MaxwellS. L.NegretP. J.et al. (2018). One-third of global protected land is under intense human pressure. Science360, 788–791. 10.1126/science.aap9565
25
JoppaL. N.PfaffA. (2009). High and Far: Biases in the Location of Protected Areas. PLOS ONE. 4:e8273. 10.1371/journal.pone.0008273
26
Laso BayasJ. C.LesivM.WaldnerF.SchucknechtA.DuerauerM.SeeL.et al. (2017). A global reference database of crowdsourced cropland data collected using the Geo-Wiki platform. Sci. Data4, 170136. 10.1038/sdata.2017.136
27
Laso BayasJ. C.SeeL.GeorgievaI.SchepaschenkoD.DanyloO.BartlH.et al. (2021). Crowdsourcing Deforestation in the Tropics During the Last Decade: Data Sets From the “Driver of Tropical Forest Loss” Geo-Wiki Campaign. Laxenburg: International Institute for Applied Systems Analysis. Available online at: http://pure.iiasa.ac.at/id/eprint/17539/
28
Laso BayasJ. C.SeeL.GeorgievaI.SchepaschenkoD.DanyloO.BartlH.et al. (In review). Drivers of tropical forest loss between 2008 and 2019. Scientific Data.
29
LesivM.BayasJ. C. L.SeeL.DuerauerM.DahliaD.DurandoN.et al. (2019). Estimating the global distribution of field size using crowdsourcing. Glob. Change Biol.25, 174–186. 10.1111/gcb.14492
30
LovejoyT. E.NobreC. (2018). Amazon tipping point. Sci. Adv.4, eaat2340. 10.1126/sciadv.aat2340
31
MausV.GiljumS.GutschlhoferJ.da SilvaD. M.ProbstM.GassS. L. B.et al. (2020). A global-scale data set of mining areas. Sci. Data7, 289. 10.1038/s41597-020-00624-w
32
PopkinG. (2019). How much can forests fight climate change?Nature565, 280–282. 10.1038/d41586-019-00122-z
33
ScullionJ. J.VogtK. A.DrahotaB.Winkler-SchorS.LyonsM. (2019). Conserving the last great forests: a meta-analysis review of the drivers of intact forest loss and the strategies and policies to save them. Front. Forests Glob. Change2, 62. 10.3389/ffgc.2019.00062
34
Secretariat of the CBD (2020). Global Biodiversity Outlook 5. Montreal, QC: Convention on Biological Diversity.
35
SeeL.ComberA.SalkC.FritzS.van der VeldeM.PergerC.et al. (2013). Comparing the quality of crowdsourced data contributed by expert and non-experts. PLoS ONE8, e69958. 10.1371/journal.pone.0069958
36
SeeL.FritzS.PergerC.SchillC.McCallumI.SchepaschenkoD.et al. (2015). Harnessing the power of volunteers, the internet and Google Earth to collect and validate global spatial information using Geo-Wiki. Technol. Forecast. Social Change98, 324–335. 10.1016/j.techfore.2015.03.002
37
SeymourF.HarrisN. L. (2019). Reducing tropical deforestation. Science365, 756–757. 10.1126/science.aax8546
38
ShahP.BaylisK.BuschJ.EngelmannJ. (2021). What determines the effectiveness of national protected area networks?Environ. Res. Lett.16, 074017. 10.1088/1748-9326/ac05ed
39
SpracklenB. D.KalamandeenM.GalbraithD.GloorE.SpracklenD. V. (2015). A global analysis of deforestation in moist tropical forest protected areas. PLoS ONE10, e0143886. 10.1371/journal.pone.0143886
40
StarnesT.BeresfordA. E.BuchananG. M.LewisM.HughesA.GregoryR. D. (2021). The extent and effectiveness of protected areas in the UK. Glob. Ecol. Conserv.30, e01745. 10.1016/j.gecco.2021.e01745
41
TyukavinaA.HansenM. C.PotapovP.ParkerD.OkpaC.StehmanS. V.et al. (2018). Congo Basin forest loss dominated by increasing smallholder clearing. Sci. Adv.4, eaat2993. 10.1126/sciadv.aat2993
42
TyukavinaA.HansenM. C.PotapovP. V.StehmanS. V.Smith-RodriguezK.OkpaC.et al. (2017). Types and rates of forest disturbance in Brazilian Legal Amazon, 2000–2013. Sci. Adv.3, e1601047. 10.1126/sciadv.1601047
43
WadeC. M.AustinK. G.CajkaJ.LapidusD.EverettK. H.GalperinD.et al. (2020). What Is threatening forests in protected areas? A global assessment of deforestation in protected areas, 2001–2018. Forests11, 539. 10.3390/f11050539
44
WatsonJ. E. M.DudleyN.SeganD. B.HockingsM. (2014). The performance and potential of protected areas. Nature515, 67–73. 10.1038/nature13947
45
WolfC.LeviT.RippleW. J.Zárrate-CharryD. A.BettsM. G. (2021). A forest loss report card for the world's protected areas. Nat. Ecol. Evol.5, 520–529. 10.1038/s41559-021-01389-0
Summary
Keywords
deforestation, crowdsourcing, drivers of deforestation, remote sensing, deforestation in protected areas, Geo-Wiki
Citation
Fritz S, Laso Bayas JC, See L, Schepaschenko D, Hofhansl F, Jung M, Dürauer M, Georgieva I, Danylo O, Lesiv M and McCallum I (2022) A Continental Assessment of the Drivers of Tropical Deforestation With a Focus on Protected Areas. Front. Conserv. Sci. 3:830248. doi: 10.3389/fcosc.2022.830248
Received
06 December 2021
Accepted
17 January 2022
Published
22 February 2022
Volume
3 - 2022
Edited by
Andreas Langner, European Commission, Italy
Reviewed by
Yosio Edemir Shimabukuro, National Institute of Space Research (INPE), Brazil; Matthew Grainger, Norwegian Institute for Nature Research (NINA), Norway
Updates
Copyright
© 2022 Fritz, Laso Bayas, See, Schepaschenko, Hofhansl, Jung, Dürauer, Georgieva, Danylo, Lesiv and McCallum.
This is an open-access article distributed under the terms of the Creative Commons Attribution License (CC BY). The use, distribution or reproduction in other forums is permitted, provided the original author(s) and the copyright owner(s) are credited and that the original publication in this journal is cited, in accordance with accepted academic practice. No use, distribution or reproduction is permitted which does not comply with these terms.
*Correspondence: Steffen Fritz fritz@iiasa.ac.at
This article was submitted to Global Biodiversity Threats, a section of the journal Frontiers in Conservation Science
Disclaimer
All claims expressed in this article are solely those of the authors and do not necessarily represent those of their affiliated organizations, or those of the publisher, the editors and the reviewers. Any product that may be evaluated in this article or claim that may be made by its manufacturer is not guaranteed or endorsed by the publisher.