 Jessamine Finch
 Micah Jasny
 Katherine F. Kucera
 Gretel Kiefer
- 1Conservation Department, Native Plant Trust, Framingham, MA, United States
- 2Plants of Concern, Negaunee Institute for Plant Conservation Science and Action, Chicago Botanic Garden, Glencoe, IL, United States
First emerging at the end of the 20th century, community science (a.k.a. citizen science), utilizing volunteers and volunteer-contributed data, has become a major component of biological conservation worldwide. Interacting factors including limited funding, technology availability, and public interest present a unique opportunity for conservation scientists and practitioners to benefit from larger datasets with broader spatial and temporal reach than possible from professional researchers alone. In tandem with benefits to science, volunteers gain hands-on research experience, scientific knowledge, outdoor opportunities, and community. However, this approach is far from universally adopted, as some researchers question the accuracy and value of community science data and entrusting volunteers with sensitive data, such as rare plant locations. We assessed community science projects that conduct rare plant monitoring to examine the value of community science in plant conservation. We identified projects through research and targeted outreach. Through digital surveys of project managers and volunteers, we collected qualitative and quantitative data addressing the efficacy of projects in regard to a number of predictor variables (e.g., staffing, funding, program size, data management, volunteer training, and demographics) and metrics of success (e.g., number of volunteers engaged, monitoring assignments, and publications). We reported the qualities of successful plant conservation community science projects to encourage the establishment of new projects, the improvement of existing ones, and the maximum application of volunteer-contributed rare plant monitoring datasets. We propose the establishment of a community science rare plant monitoring network to facilitate sharing ideas, strategies, and tools for project success.
1 Introduction
The last quarter of the 20th century marked a huge turning point for biodiversity conservation, defined in the United States by the passage of the Endangered Species Act in 1973 (Czech and Krausman, 2001) and the establishment of state natural heritage programs beginning soon thereafter (Groves et al., 1995). Internationally, organizations such as the International Union for Conservation of Nature (IUCN) and the Global Strategy for Plant Conservation (GSPC) have also been created to protect biodiversity and slow the rate of extinction at a global scale (IUCN, 2001; Jackson and Kennedy, 2009). Within biodiversity conservation a field constrained by limited resources, funding for plant conservation is even further restricted. Specifically, funding awarded to plant conservation is lower than that awarded to animal conservation, particularly for mammals and birds. A study conducted in the United States in 2011 determined that plant conservation received less than 3.86% of federal endangered species funding despite plants comprising 57% of federally listed species (Havens et al., 2014). This disproportionate funding trend is not isolated to the United States and can be found in the conservation spending of other countries as well (Martín-López et al., 2009; Laycock Helen et al., 2011). In addition, between 1988 and 2009, over 50% of the university botany programs in the United States were dissolved or absorbed by other biology departments, contributing to a marked decline in trained botanists (Havens et al., 2014). By the 1990s, the gap between the monitoring effort needed to effectively track rare plants and the availability of professional botanists to complete the monitoring prompted experimentation with a new, largely untested approach—engaging volunteers to monitor plants through community science projects.
Community science, also known as citizen science, crowd-sourced science, participatory science, community-based monitoring, network science, and volunteer monitoring, engages members of the public to participate in the scientific process (Carr, 2004; Heigl et al., 2019). Up until the last 5 years, these projects were most commonly referred to as “citizen science,” but more recently the political stigmatization of the term “citizen” in the United States has resulted in a movement toward alternative names—most frequently “community science”—to emphasize that anyone can participate, regardless of legal citizenship status (Audubon Society, 2018; Cooper et al., 2021).
As the field evolved, four distinct models of community science have emerged with varying levels of volunteer participation in project design, project management, data collection, analysis, and dissemination of results (Schäfer and Kieslinger, 2016; Vohland et al., 2021). Initially, most community science projects were contributory in nature, utilizing a “top-down” power dynamic where volunteers collect and report data to project managers or scientists (Bonney et al., 2009; Couvet and Prevot, 2015; Vohland et al., 2021). Using volunteers in contributory projects greatly increases the scope and scale of projects while minimizing costs (Freitage and Pfeffer, 2013). Community science projects slowly became more “collaborative,” involving more community facets in project creation and governance to grant more power to the impacted community (Conrad and Daoust, 2008; Bonney et al., 2009). This eventually led to “co-created” community science projects where both scientists and community members are involved in all project aspects (Bonney et al., 2009; Gunnell et al., 2021). Lastly, some communities have developed their own “transformative” or “grass roots” community science projects, often in an attempt to gain awareness for a specific crisis and without private sector or government support (Mullen and Allison, 1999; Whitelaw et al., 2003; Conrad and Daoust, 2008).
Over the past few decades, the number of programs engaging volunteers in scientific research has grown exponentially, mirroring significant technological advancements such as smart devices and expanded internet access (Catlin-Groves, 2012; Freitag and Pfeffer, 2013). When successful, community science can increase scientific literacy, advance environmental democracy, and benefit human and natural communities alike (Conrad and Hilchey, 2011; Freitag and Pfeffer, 2013). However, some programs have faced barriers related to data quality, data collection, lack of volunteer interest, and organizational issues (Whitelaw et al., 2003; Milne et al., 2006; Conrad and Daoust, 2008; Conrad and Hilchey, 2011). With the proliferation of projects and models, questions have been raised as to how to define “success” in community science.
Certain factors have been identified as being associated with successful projects such as methods for ensuring data accuracy and bias, iterative project development, and volunteer training (Reisch and Potter, 2014; Kosmala et al., 2016). In a recent study of online community science projects, Cox et al. (2015) broadly defined two main dimensions for success in community science: contributions made to science and public engagement. A community science project’s contribution to science can be measured based on the data value generated by the project (via publication rate, completeness of analysis, and academic impact) and project design and resource allocation (based on resource savings, distribution of effort, and effective training) (Bonney et al., 2009; Raddick et al., 2009; Wiggins and Crowston, 2011; Cox et al., 2015). The other dimension of community science success, public engagement, can be measured through dissemination and feedback on the project (collaboration, communication, and interaction) and participation and opportunities for learning achieved by the project (quantified through project appeal, sustained engagement, and public contribution) (Raddick et al., 2009; Wiggins and Crowston, 2010; Franzoni and Sauermann, 2014; Cox et al., 2015).
While community science was first seen in bird monitoring (Butcher et al., 2005), it soon spread to other environmental monitoring applications, including rare plant species. The oldest project we have identified, the Minnesota Biological Survey Rare Plant Monitoring project, began monitoring plants in 1990 (Minnesota Biological Survey, 2016). In 1993, the New England Wild Flower Society (now Native Plant Trust) established the Plant Conservation Volunteer program to train and coordinate community scientists in monitoring rare plant populations in Massachusetts (Standley, 1995). Soon thereafter, the Plant Conservation Volunteer (PCV) program expanded to operate across the entire six-state New England region of the United States. The advancement of the PCV program inspired the creation of a parallel initiative, the Plants of Concern program in 2001 which is based at the Chicago Botanic Garden and covers the northeastern Illinois region (Havens et al., 2012) and, since 2021 the southern Illinois region. The success of these undertakings has encouraged the development of additional place-based projects to engage community scientists in monitoring rare plants to further biological knowledge and conservation (M. Jasny, pers. comm., 2020).
The data generated by rare plant community science monitoring projects are vitally important for conservation applications. Community science data are used in the creation of lists of rare plant taxa in need of regional conservation, which serve as a guideline for site management and listing decisions (Brumback and Gerke, 2013). Rare plant seed samples collected by community scientists are stored in seed banks to preserve the genetic diversity of rare species and for use in research, population augmentation, and reintroduction (Alton and Linington, 2001; Farnsworth et al., 2006). Furthermore, while monitoring rare plants, community scientists can also serve a valuable role in the early detection of invasive species, which is critical for targeted management to prevent establishment (Havens et al., 2006; Maistrello et al., 2016).
Community science project data collection methodology can range from opportunistic (unstructured) to preplanned (structured) (Kelling et al., 2019). Opportunistic community science projects allow any person to make and submit an observation from any location, at any time (Soroye et al., 2018). Community science rare plant monitoring involves training volunteers to carry out a standardized protocol for collecting data on specific rare plant occurrences when plants are most readily identifiable (Havens et al., 2012; Tierney et al., 2015). This methodology, an example of structured community science, by nature constrains the participant, the location, and the timing of the activity to meet a specific objective (Kelling et al., 2019). Structured community science projects require staff to train and coordinate volunteers and therefore rely on a smaller number of dedicated volunteers compared to unstructured community science projects (Kelling et al., 2019). In response to questions about the accuracy and value of community science data and entrusting volunteers with sensitive data, such as rare plant locations, many community science projects have instituted training sessions and data security agreements to address data quality and security concerns (Aceves-Bueno, 2017; Anhalt-Depies et al., 2019; M. Jasny, pers. comm. 2020).
Despite the proliferation of community science projects focused on monitoring rare plants, little if any research has been done to determine the impact and success of these projects and what attributes are correlated with project success. To better understand the relationship between project structure and success, we conducted two online surveys to collect qualitative and quantitative data addressing the efficacy and impact of community science rare plant monitoring projects in regard to a number of hypothesized predictor variables and response metrics related to success. These surveys were distributed to community science rare plant monitoring projects to be completed by project managers and self-selecting project participants.
2 Materials and methods
2.1 Survey development and participants
We collected the data presented in this paper through online surveys of managers (n = 19) and participants (n = 296) of rare plant monitoring projects. Prior to completing the survey, participants were informed that their responses would be used in a research study. We sought to gather information on metrics of project success and productivity from project managers and to gather information on motivations for participating, struggles encountered while participating, and demographic information from current and former project participants. We identified potential projects to include in this study through a series of search engine queries (Google) conducted between October 2021 and January 2022 using the following search terms and all combinations thereof: “rare plant,” “volunteer,” “monitoring,” and “citizen science”. To locate projects outside of the United States, we used continent- and country-specific search terms in addition to the previously identified search terms (e.g., “Europe” or “Australia”). The authors reviewed information for projects that was available online (i.e., on a project’s website) and considered a project suitable for participation in this study if the project met the following criteria: 1) the project had a focus on rare plant monitoring and 2) the project utilized volunteers to conduct monitoring. After generating a list of candidate projects, we contacted project managers via email. In addition to the two projects represented by the authors, 50 individuals were contacted representing 36 projects or organizations (38 projects total) in the United States (30), Australia (2), Canada (1), India (1), Netherlands (1), Nigeria (1), South Africa (1), Spain (1), and the United Kingdom (1). We also solicited participation from projects by posting requests on community science, ecology, and plant conservation listservs and community forums. While we aimed for this study to be a global assessment, we identified and received responses from only a few projects outside of the United States. Project managers who completed the survey were asked if they would disseminate the project participant survey to their volunteer base.
Surveys were designed using Google Forms, and the survey links were disseminated via email. We collected survey response data from February to March 2022. The project manager survey spanned several topics (number of questions per topic are reported in parentheses): general information about the project (4), project structure (9), rare plant monitoring (12), data collection and management (4), data value (11), project volunteers (17), and forming a rare plant community science network (3; Figure S1). The project participant survey consisted of 17 questions on the following topics: general information (4), motivations for participating in the project (5), challenges with the project (2), prior experience (1), and participant demographics (5, Figure S2).
2.2 Data analysis
For non-numeric responses, we binned project manager and participant responses categorically. Some questions provided a set of predefined responses (i.e., multiple responses); however, many also allowed respondents to select “other” and write in an unlisted response. “Write-in” responses were categorized within the predefined bins or within novel bin categories developed in response to unanticipated survey responses. We also standardized numeric responses. In instances where a survey respondent indicated a numeric range in their response, we calculated the average of the provided range (e.g., “5 to 10” → “7.5”). In analyzing responses from the project manager survey, we considered Plants of Concern—Southern Illinois to be a separate program from Plants of Concern for the purposes of the results. Two projects were excluded from the results, one monitoring program that did not work with volunteers and one that engaged volunteers in growing rare plants, but not monitoring them in situ. Survey responses were categorized and cleaned in spreadsheet format. All data summaries, visualizations, and analyses were performed using the R Environment for Statistical Computing (v4.0.4; R Core Team, 2021) including the following packages: ggplot2 (Wickham, 2016), ggthemes (Arnold, 2021), tidyr (Wickham and Girlich, 2022), and treemapify (Wilkins, 2021). Single-factor linear models were used to assess the relationship between hypothesized numeric predictors of project success (e.g., project age) and numeric indicators of project success (number of monitoring events offered, signed up for, and completed by volunteers; number of products created using project data; number of volunteers who participate; and number of plant taxa tracked). Several variables were included in separate models as both predictors of and indicators of project success (e.g., number of volunteers engaged).
3 Results
3.1 Project manager survey
Twenty project managers completed the survey, representing 17 unique projects, and 15 met our criteria for inclusion (Table 1). In these results, the term “project” is used to refer to both “projects” and “programs” that engaged volunteers in the monitoring of rare plants (our criteria for inclusion). The most common organization types represented by the respondents were botanic gardens (including arboreta; 6, 40%), state agencies (4, 27%), and conservation organizations (2, 13%). Other respondents identified their organizations as a university, local non-profit, and nature preserve/natural area (1 each). The oldest project represented was established in 1990 (Minnesota Biological Survey Rare Plant Monitoring, USA), and the youngest experienced a launch delay because of the COVID pandemic and plans to launch in 2022. Project age was relatively evenly distributed, with an average of one new project starting every 2 years.
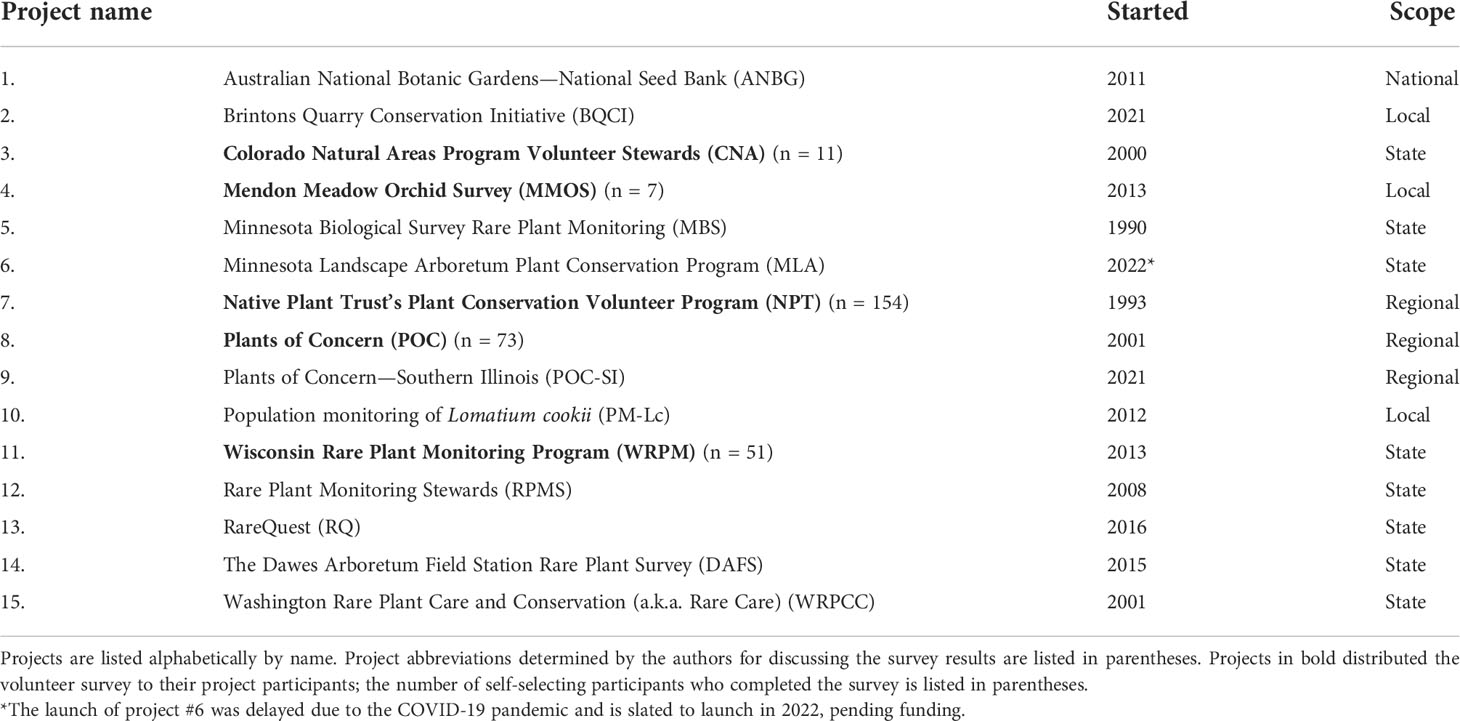
Table 1 Projects included in the summary of project manager survey results.
There is weak evidence of a positive relationship between project age and the number of volunteers who participate annually (R = 0.53, p = 0.054) but moderate evidence for a positive relationship between age and the number of volunteers engaged over the entire life of the project (R = 0.54, p = 0.044). There is little evidence of a positive relationship between project age and the number of taxa tracked (R = 0.4, p = 0.14) or the number of monitoring events completed annually (R = 0.44, p = 0.12).
3.1.1 Project management
The number of both full-time (FT) and part-time (PT) staff working on the project ranged from 0 to 4, with an average of 1.21 FT and 1.28 PT staff per project (median = 1). The majority of projects are supported in part by grants (10, 67%), with two projects funded by grants alone (2, 14%). Over half are supported, at least in part, by operating budgets (9, 60%), with three projects supported by operating budget alone (3, 20%). A quarter of projects are funded by contracts and/or donations (4, 27%). A single project was supported by an endowment.
The number of monitoring events completed annually by projects ranges from 1 to 600 (mean = 117.42, sd = 195.13, median = 28.5). Projects employ different models of working with volunteers. Some invite volunteers to participate in monitoring overseen by staff, while others invite volunteers to sign-up for and complete monitoring in small volunteer groups or independently. Projects that operate following the second, autonomous model (Table 1: NPT, RQ, and WRPCC) offer 1.8 to 3.3 times more monitoring events (134–1,708) than are completed annually (80–523). The number of unique plant taxa monitored by projects ranges from 1 to 1,326 (mean = 198, sd = 342.16, median = 25). Three of the projects surveyed track a single taxon (Table 1: BQCI, MMOS, and PM-Lc). There was moderate evidence of a positive relationship between the number of volunteers annually and the number of taxa tracked (R = 0.88, p < 0.0001).
3.1.2 Data application
Overall, the monitoring data are collected with the intent to track populations (11, 74%), to inform rankings (9, 60%), to share with landowners and/or land managers (7, 47%), be used in research (4, 27%), and to guide conservation action (3, 20%). To expand upon tracking, data are collected to confirm population persistence, assess population vigor, and track population trends over time. The majority of projects collect data to inform assessments of rarity and listing of conservation status ranks, carried out by state, federal, and/or non-governmental organization (NGO) environmental agencies (e.g., NatureServe). About half of projects share data with landowners and/or land managers for their edification and to inform site management decision making. One-fifth of projects use data to direct conservation action, including site management, restoration, reintroductions, population augmentation, and ex situ seed banking. Lastly, about a quarter of projects use data in biology and ecology research themselves or share with research to learn more about focal taxa (e.g., trends, life history, and germination) and how to better protect them.
3.1.3 Project success
Project success was attributed to project staff, management, volunteers, partnerships, and outcomes (i.e., monitoring rare plants). Seven projects spoke to the enthusiasm, dedication, and caliber of their volunteers (7, 47%). A third or more of the projects connected project success to staffing (6, 40%) and partnerships (5, 33%). Specifically, they described the attributes of project staff that contribute to project success, including their passion, skills in project and personnel management (e.g., accessibility and supportive nature), and botanical expertise. Partnerships support project success by tailoring projects to meet the needs of government programs, providing funding for project staff through contracts, and engaging with land managers and other relevant parties. A quarter of projects discussed various aspects of project management, including training (1), integrated staff and volunteer field crews (1), intentional development of a sense of community (2), and streamlined data submission (1). Two projects reiterated that these projects enable monitoring to be carried out at a larger geographic scale while keeping costs low (14%). One project “decided the project wasn’t very successful” and so discontinued after the first two field seasons.
3.1.4 Volunteers
The majority of projects require participants in the community science programs to complete a volunteer application (10, 67%), but only 40% (6) require a rare plant location confidentiality agreement and/or a criminal background check. Slightly more than a quarter require a liability waiver (4, 27%), and one-fifth require plant identification experience or coursework (3, 20%). Two-fifths of programs required project participants to complete training in the field and/or online (6 each, 40%). About a quarter required completion of an in-person classroom training (4, 27%). One project required new volunteers to pair up with an experienced participant. One project required no training of participants but specified that they were already very experienced in the field, stating that “most volunteers collecting rare plant data are current or retired professionals”. The number of active training hours for volunteers ranged from 0 to 10 with an average of 4.8 h (sd = 31.87 and a median of 3.5 h).
The number of volunteers engaged across the entire lifespan of the surveyed projects ranges from 2 to 2,000 with an average of 272 (sd = 551.1) and a median of 57.5. On an annual basis, the number of volunteers ranges from 3 to 250 with an average of 58.3 (sd = 73.2) and a median of 32.5. The majority of projects had no requirements that volunteers needed to meet to remain active in the project (9, 64%). One-fifth required a minimum number of hours or monitoring events to be completed annually (3, 20%). One project requires refresher training sessions and one a commitment of at least 3 years to a site; however, this requirement is waived for students.
Based on survey responses, we identified and categorized responses to the question “What do you hope your volunteers gain by participating in the project?” using 11 thematic bins. Most often, project managers cited a hope for volunteers to gain increased plant knowledge (10, 67%), closely followed by conservation impact (9, 60%). The next most often-cited desired gains were appreciation for nature (7, 47%), improved field skills, and greater knowledge of rare species and conservation (6, 40%). Less-often cited were enjoyment (5, 33%), conservation stewardship, and new interpersonal connections (3, 20%). One project each listed: health benefits, increased citizen science knowledge, and motivation to donate to the organization.
3.1.5 Challenges
On average, the highest-ranked challenges to project success are lack of funding and too few staff (Figure 1). The second highest-ranked challenge was data sharing restrictions, followed by data management and volunteer retention. The lowest-ranked challenge was prioritizing populations to monitor. The main themes of other challenges identified by project managers related to project organization (e.g., bureaucratic challenges and training volunteers), data (e.g., app needed for data collection and technological literacy of volunteers), and field challenges (e.g., physical demands of work and phenology of rare plants).
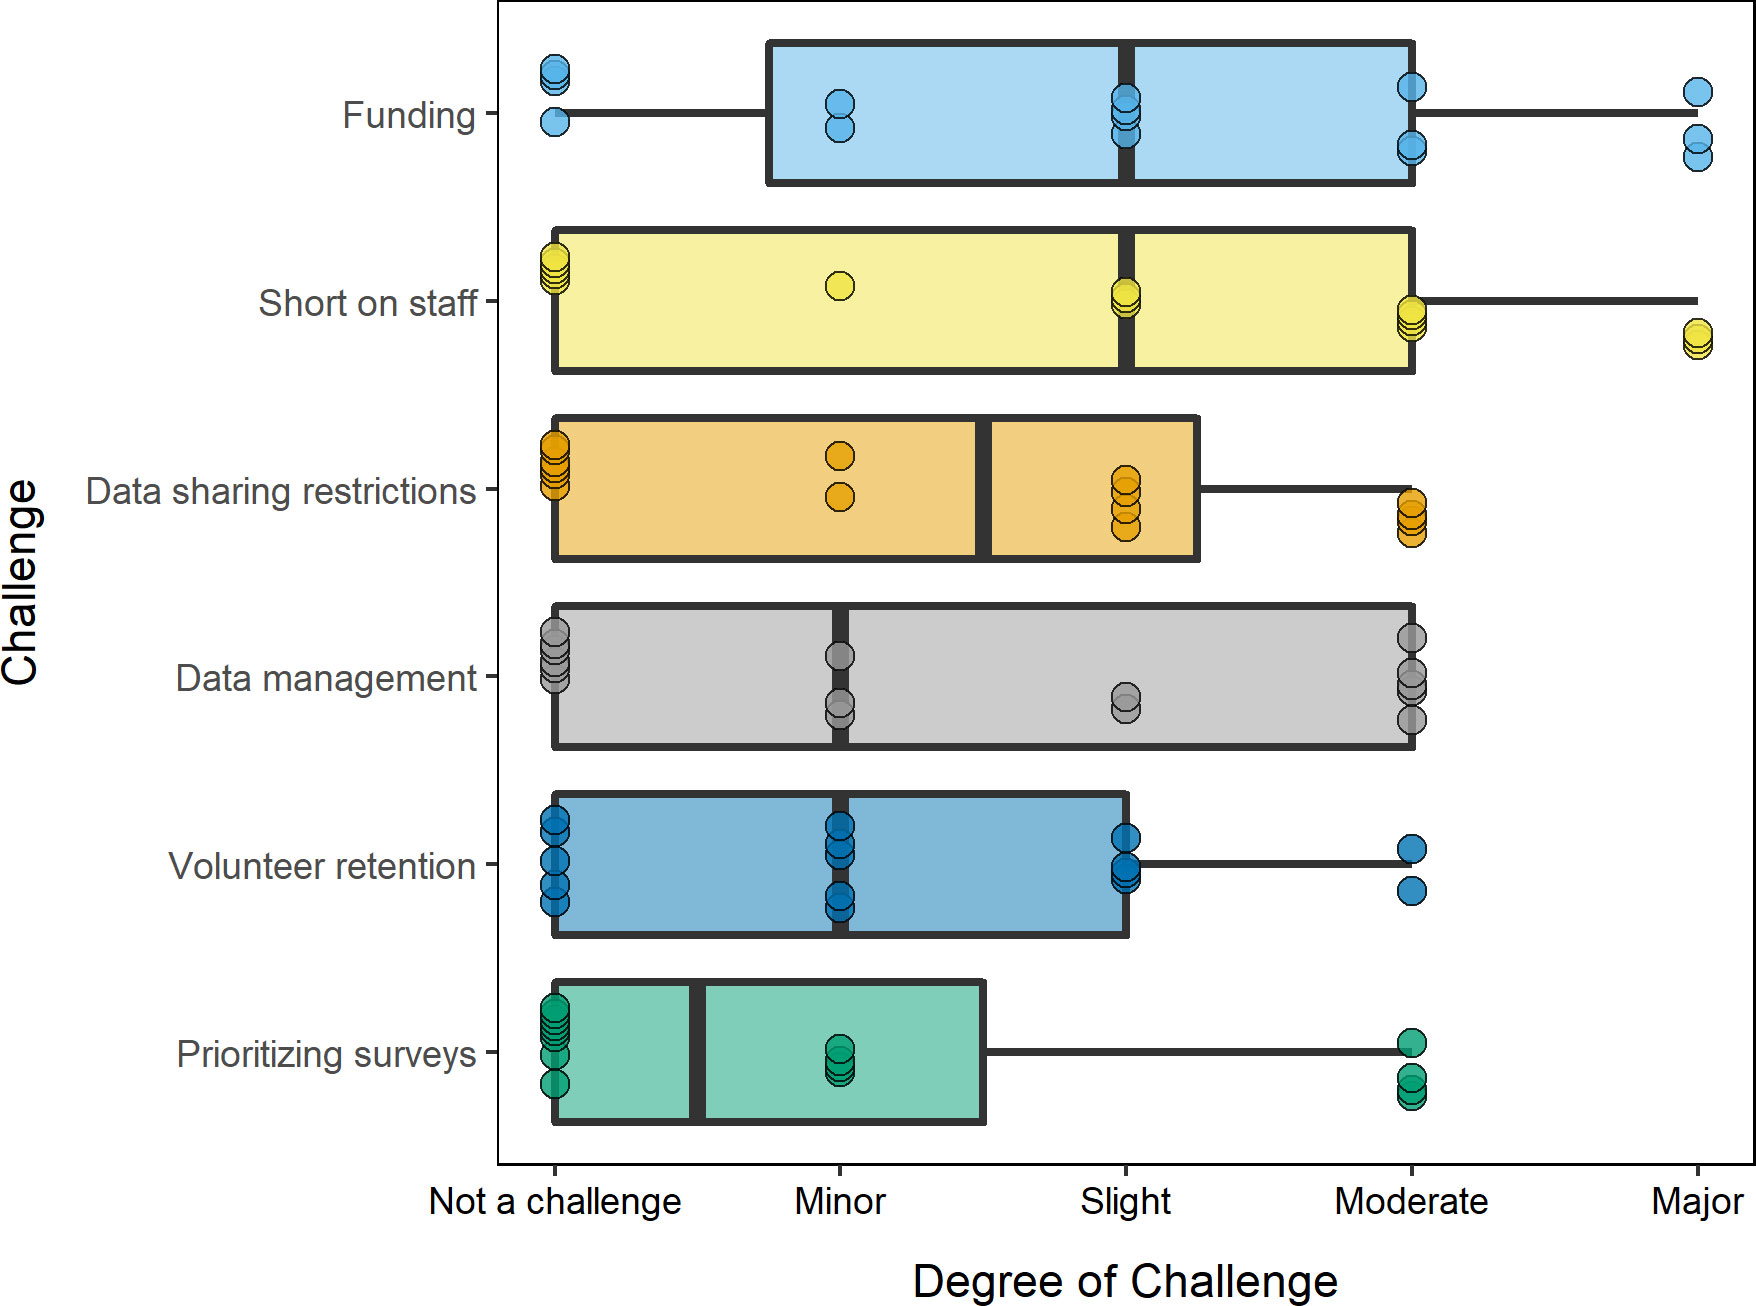
Figure 1 Boxplot of challenges that projects face ranked by degree of challenge as indicated by project managers from a major challenge to no challenge. The two major challenges community science projects face are limited funding and too few staff. Data sharing restrictions and data management are the primary moderate challenges that projects face. Volunteer retention is a slight challenge, and prioritizing taxa or locations to monitor is a minor challenge.
3.1.6 COVID-19 impacts
The greatest impact of the COVID-19 pandemic on project operations during the 2020 and 2021 field seasons was the inability to offer larger in-person training and the inability to share vehicles (11, 73%) These impacts were followed by the inability to offer other in-person events like field trips and classes (8, 53%). Some projects were unable to offer monitoring opportunities, while others were able to continue offering monitoring opportunities but decreased the maximum monitoring group size (5, 33%). Beyond the authority of the project management, some projects experienced site closures (6, 40%) and an inability to secure necessary permits or permissions due to the pandemic (3, 20%). For one project, COVID-19 resulted in more people being interested in the project than could be engaged (1, 6%).
3.1.7 Data value
All projects reported that data collected by volunteers have been used internally or externally to create products such as reports (total = 225), theses (9), peer-reviewed journal articles (17), conservation plans (129), conference proceedings (23), or status assessments (233). Other product types noted included U.S. Fish and Wildlife Service Recovery Plans (5) and plant field guides (4).
There was very strong evidence that community science projects that complete more monitoring annually have generated more products (e.g., articles, presentations, reports, and theses) (R = 0.94, p < 0.0001). However, this trend was mainly driven by the relatively high number of monitoring events completed by just two programs: Plants of Concern (n = 600) and Native Plant Trust’s Plant Conservation Volunteers (n = 523). There was weak evidence that older projects have generated a greater number of products from project data (R = 0.46, p = 0.084). Two of the top five oldest programs have produced the most products from their data (Table 1, NPT and POC). However, the oldest program conducts less than five monitoring events annually and has only generated six products. There was strong evidence that projects that engage more volunteers on an annual basis (R = 0.79, p = 0.0008) and over the lifetime of the project (R = 0.74, p = 0.0025) generate more products using their data, again majorly influenced by just two projects (NPT and POC).
3.1.8 Professional societies and interest in global network
The majority of project managers were actively involved in a U.S. state native plant society (10, 67%), including those of Colorado, New Mexico, Utah, and Virginia. Less than half are members of the Center for Plant Conservation (7, 47%), Ecological Society of America (6, 40%), Natural Areas Association, Society for Ecological Restoration (5 each, 33%), and the Citizen Science Association (3, 20%). A third of project managers indicated they were active with a regional plant conservation alliance (5, 33%). The vast majority of projects would be interested in joining a national or global network of community science rare plant monitoring projects (12, 80%). An additional two projects were potentially interested in joining (+13.3%).
3.2 Project participant survey
A total of 296 volunteers representing five different U.S.-based community science projects (shown in bold in Table 1) completed the participant survey. About half of the responses are from volunteers participating in Native Plant Trust’s Plant Conservation Volunteers Program (52%), a quarter from Plants of Concern (25%), and one-sixth from the Wisconsin Rare Plant Monitoring Program (17%). The number one motivation for joining the project was contributing to plant conservation (46%), followed by a personal passion for botany and gaining knowledge, which tied for second (36%, Figure 2).

Figure 2 Participant motivations for joining community science projects. The number one motivation was contributing to conservation (46%), followed by personal passion and gaining knowledge, which tied for second (36%).
Based on the survey results, we preserved in their entirety or slightly modified seven of the bins that were provided in the survey question to summarize participants’ favorite aspects of the project. The a priori bin “spending more time outside” was modified to “spending time in and exploring unusual or new sites” to better represent survey responses. The most common favorite aspects of the program were “helping to protect rare plants” (29%), followed by “increasing my plant knowledge” (27%) and “contributing to community/citizen science” (24%; Figure 3). A tenth of participants identified “meeting other people interested in plants” (10%) as a favorite aspect. Slightly less listed “spending time in and exploring unusual or new sites” (8%). One percent of respondents identified “getting exercise” or “membership perks (free classes, ticket/admission, etc.)” as their favorite aspect of project participation.
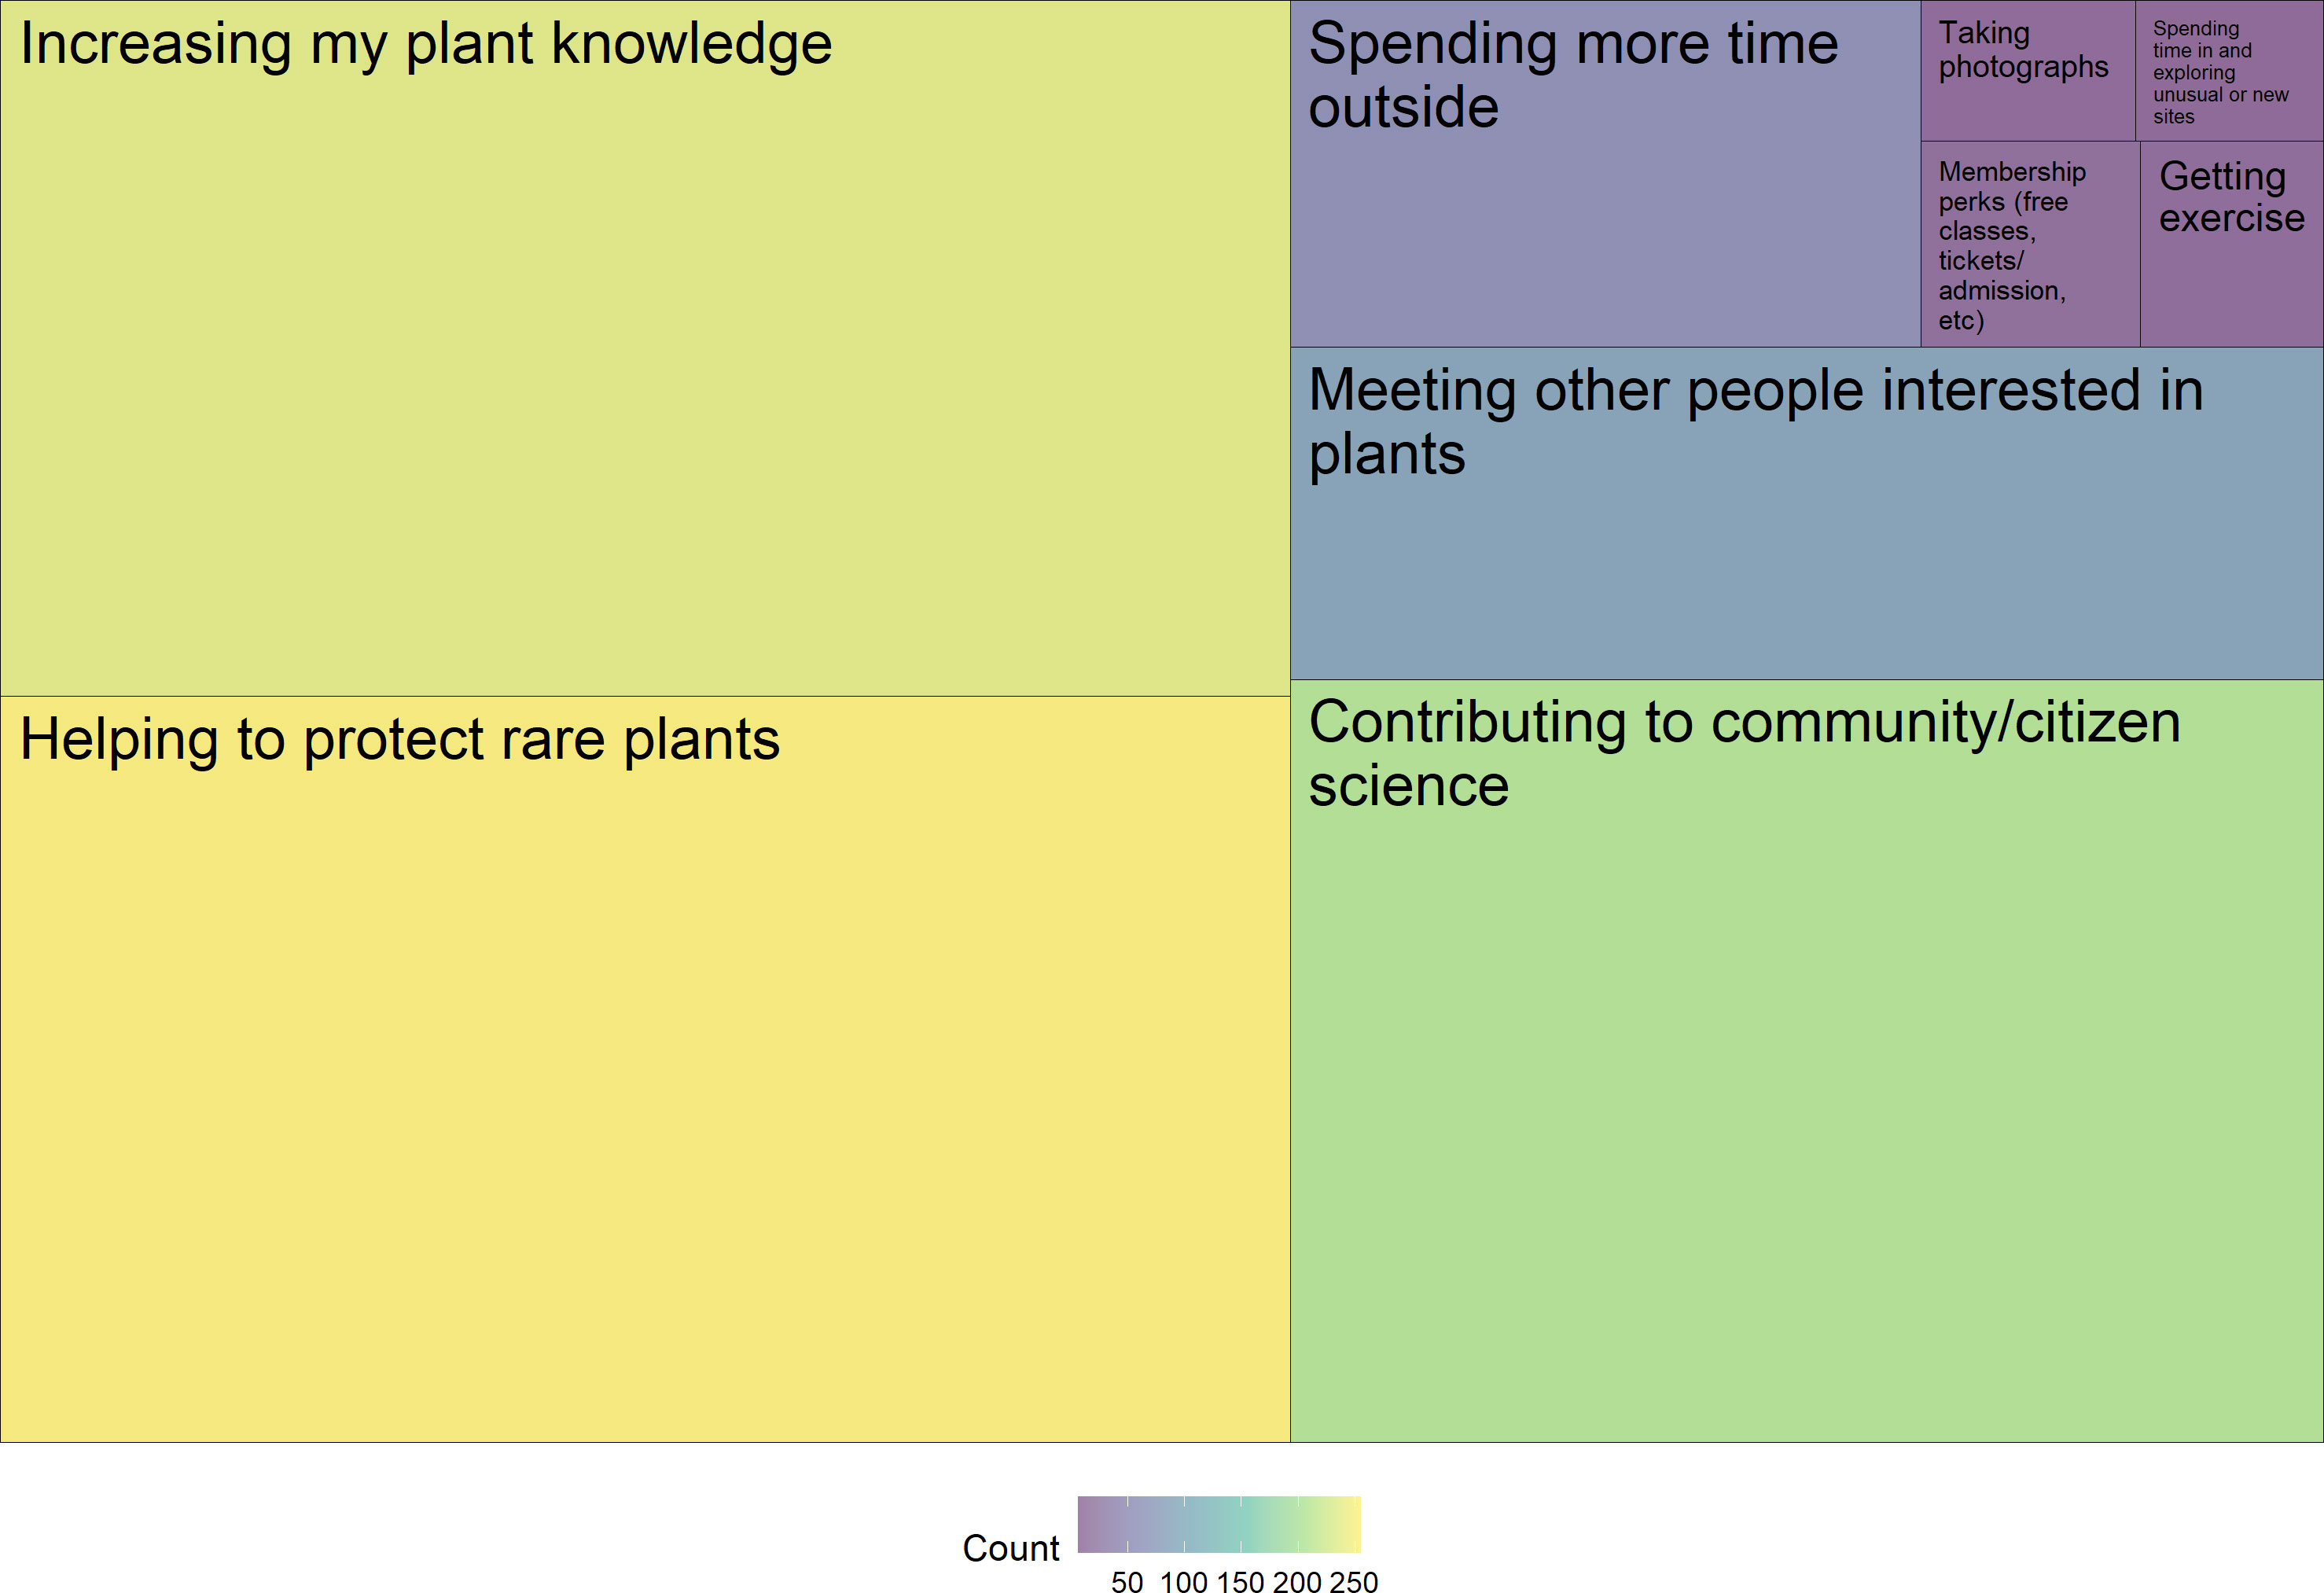
Figure 3 Participants’ favorite aspect of participating in the project scaled by count. Color ramp by count from purple (least) to yellow (most). The most common favorite aspects were helping rare plants (75%), learning about plants (70%), and contributing to community science (62%).
In addition to the four bins for prior experience with botany and/or conservation included in the survey question, we added “education experience (not degree)” and “volunteer experience” for a total of six prior experience categories (Figure 4). The most common prior experience was personal interest (36%). The three categories of informal education, formal education, and work experience each accounted for roughly a fifth of prior experience (18%–21%). Education experience that was not part of a degree program and volunteer experience accounted for 2% of prior experience each.

Figure 4 Prior experience held by project volunteers (n = 412). Color denotes community science project.
Based on survey results, 19 bins were used to code participants’ greatest struggles with participating in the project. The most commonly identified struggles by count (n = 689) were coordinating site visits (n = 124, 18%), time requirements (102, 15%), dealing with technology/submitting data (98, 14%), and plant identification (97, 14%; Figure 5).
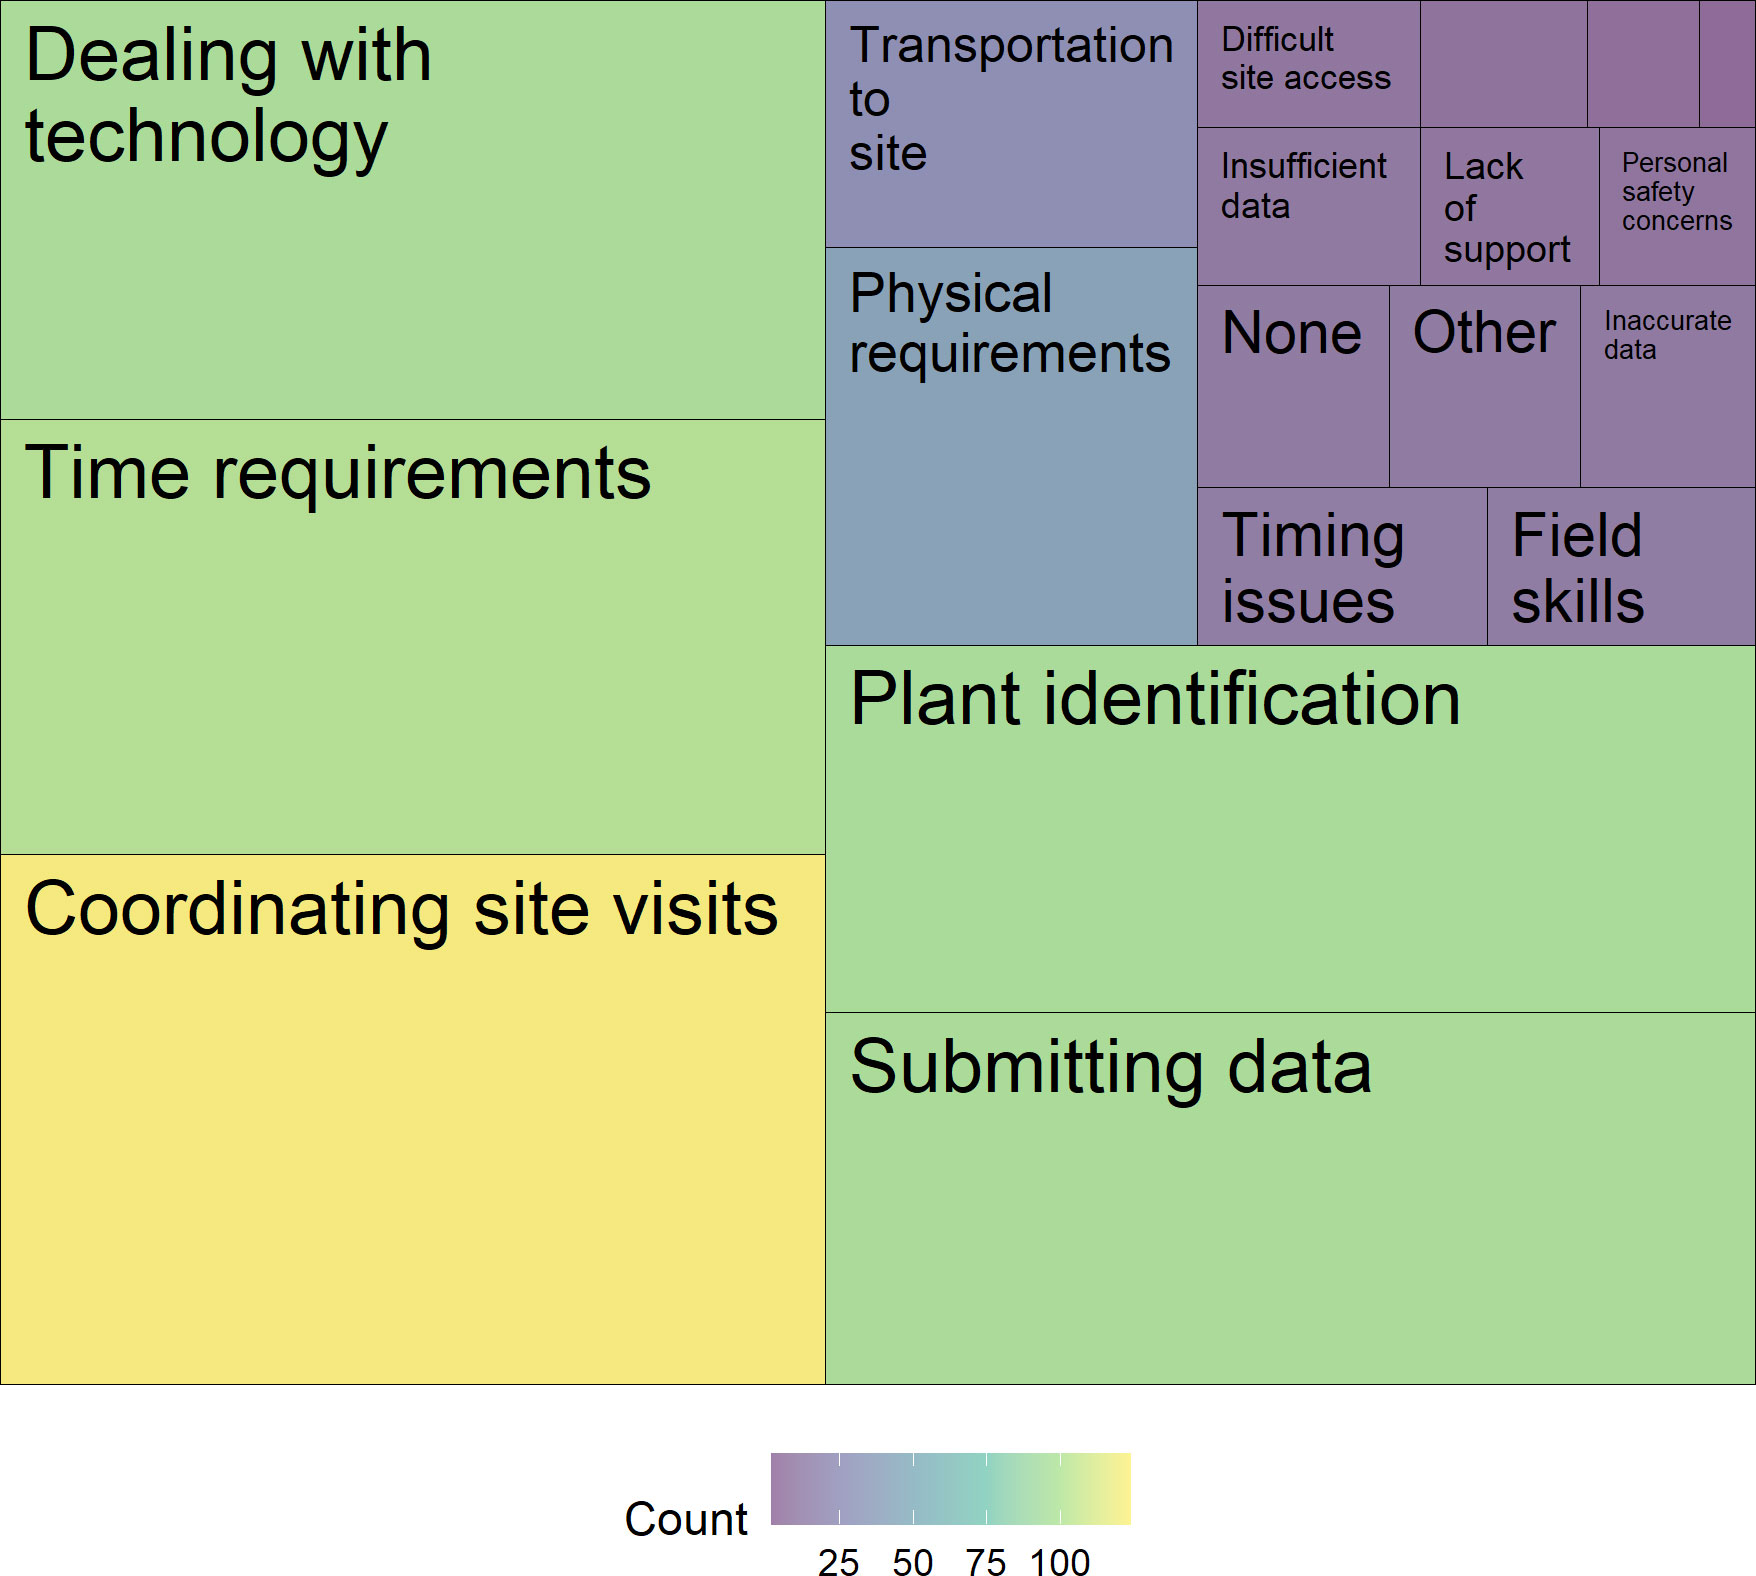
Figure 5 Participants’ struggles with participating in the project scaled by count. Color ramp by count from purple (least) to yellow (most). Labels are omitted for the three struggles with the lowest counts (all <1%): site management (6), lack of monitoring opportunities (4), and COVID (2).
The number of years active with the project ranged from 1 to 31, with an average of 6.89 and a median of 4 (Figure 6A). The average number of hours participated annually by volunteers was 34.64 with a range from 1 to 900 and a median of 16 (Figure 6B). Across all projects, survey respondents contribute close to 10,000 volunteer hours annually (9,600) and over 100,000 hours total to rare plant monitoring over the last 31 years (101,646.8).
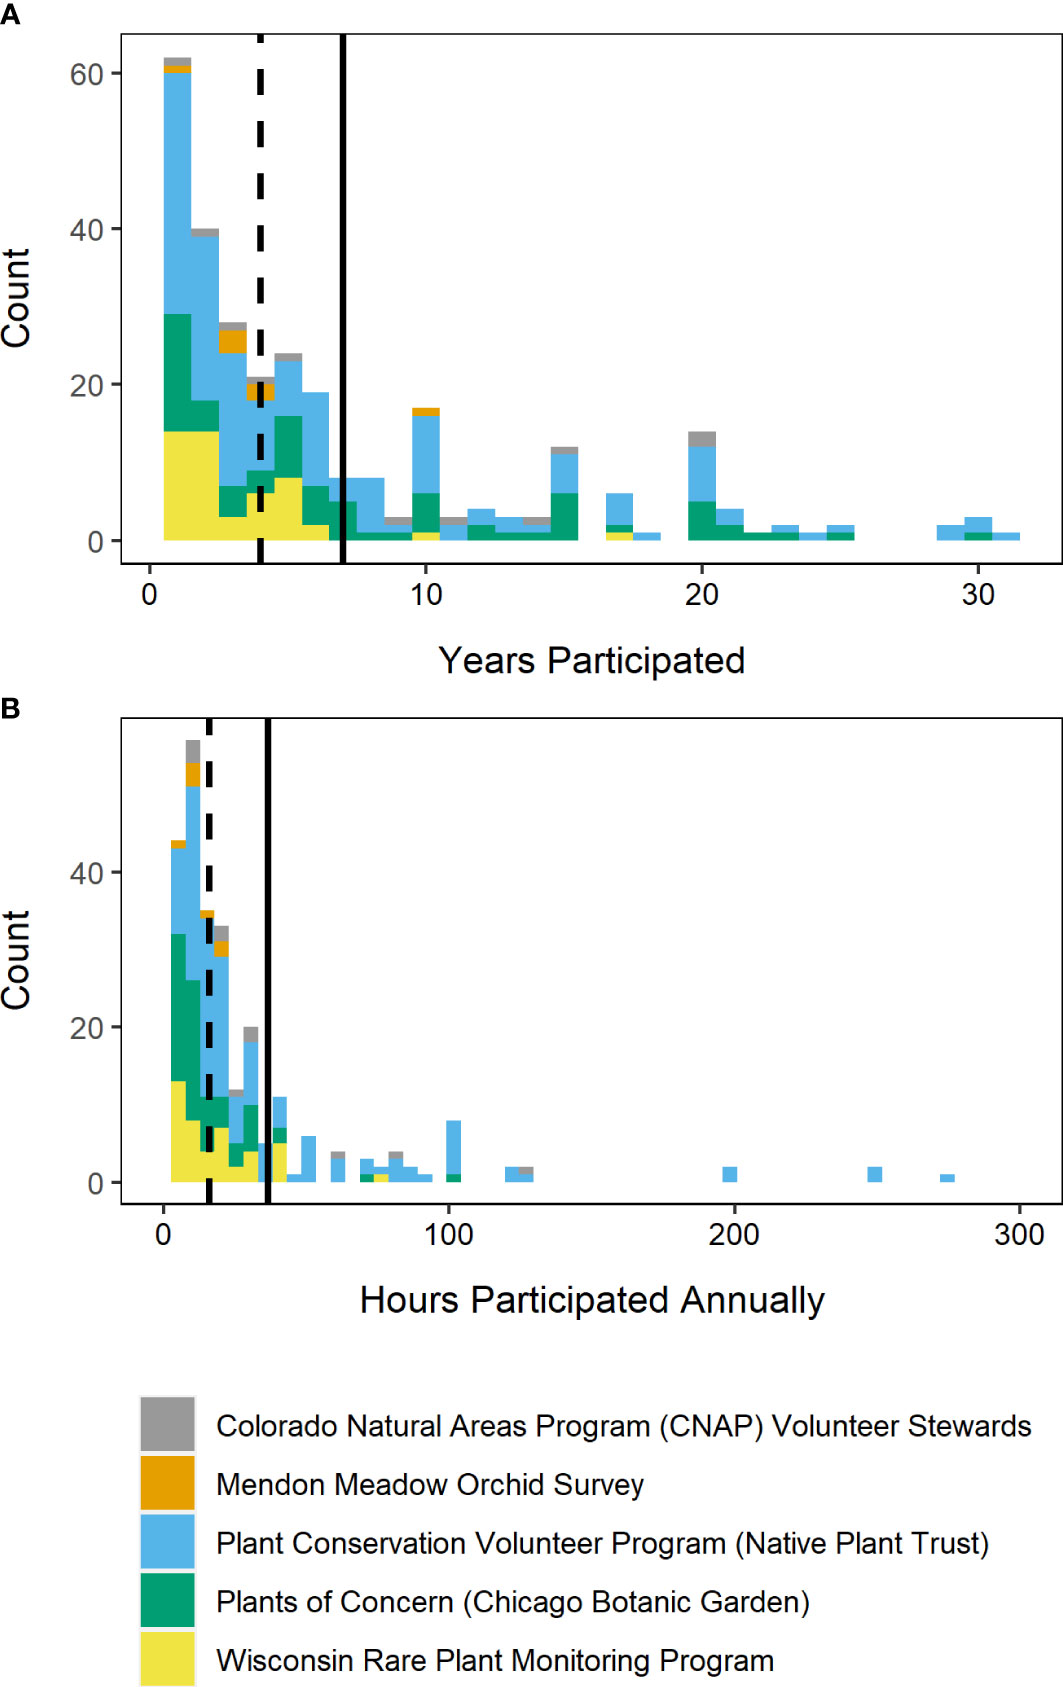
Figure 6 (A) Histogram of years participated by project. The mean (6.89, sd = 6.93) is shown with the solid line, and the median (4) is shown in the dashed line. (B) Histogram of number of hours that volunteers participate in the project annually. The mean (34.64, sd = 86.75) is shown with the solid line, and the median (16) is shown in the dashed line. Two outlier responses from volunteers with Plant of Concern (900 hours/year) were omitted from this visualization.
3.2.1 Inactive volunteers
Of the respondents, 72% were active volunteers (n = 212) and 28% were inactive (n = 84). Across all projects, the primary reason a volunteer was no longer active was time constraints (26%), followed by physical demands (17%) and moving to a different location (14%, Figure 7). Other reasons participants were no longer active in the project included lack of field skills, lack of support, and difficulties with the technology.
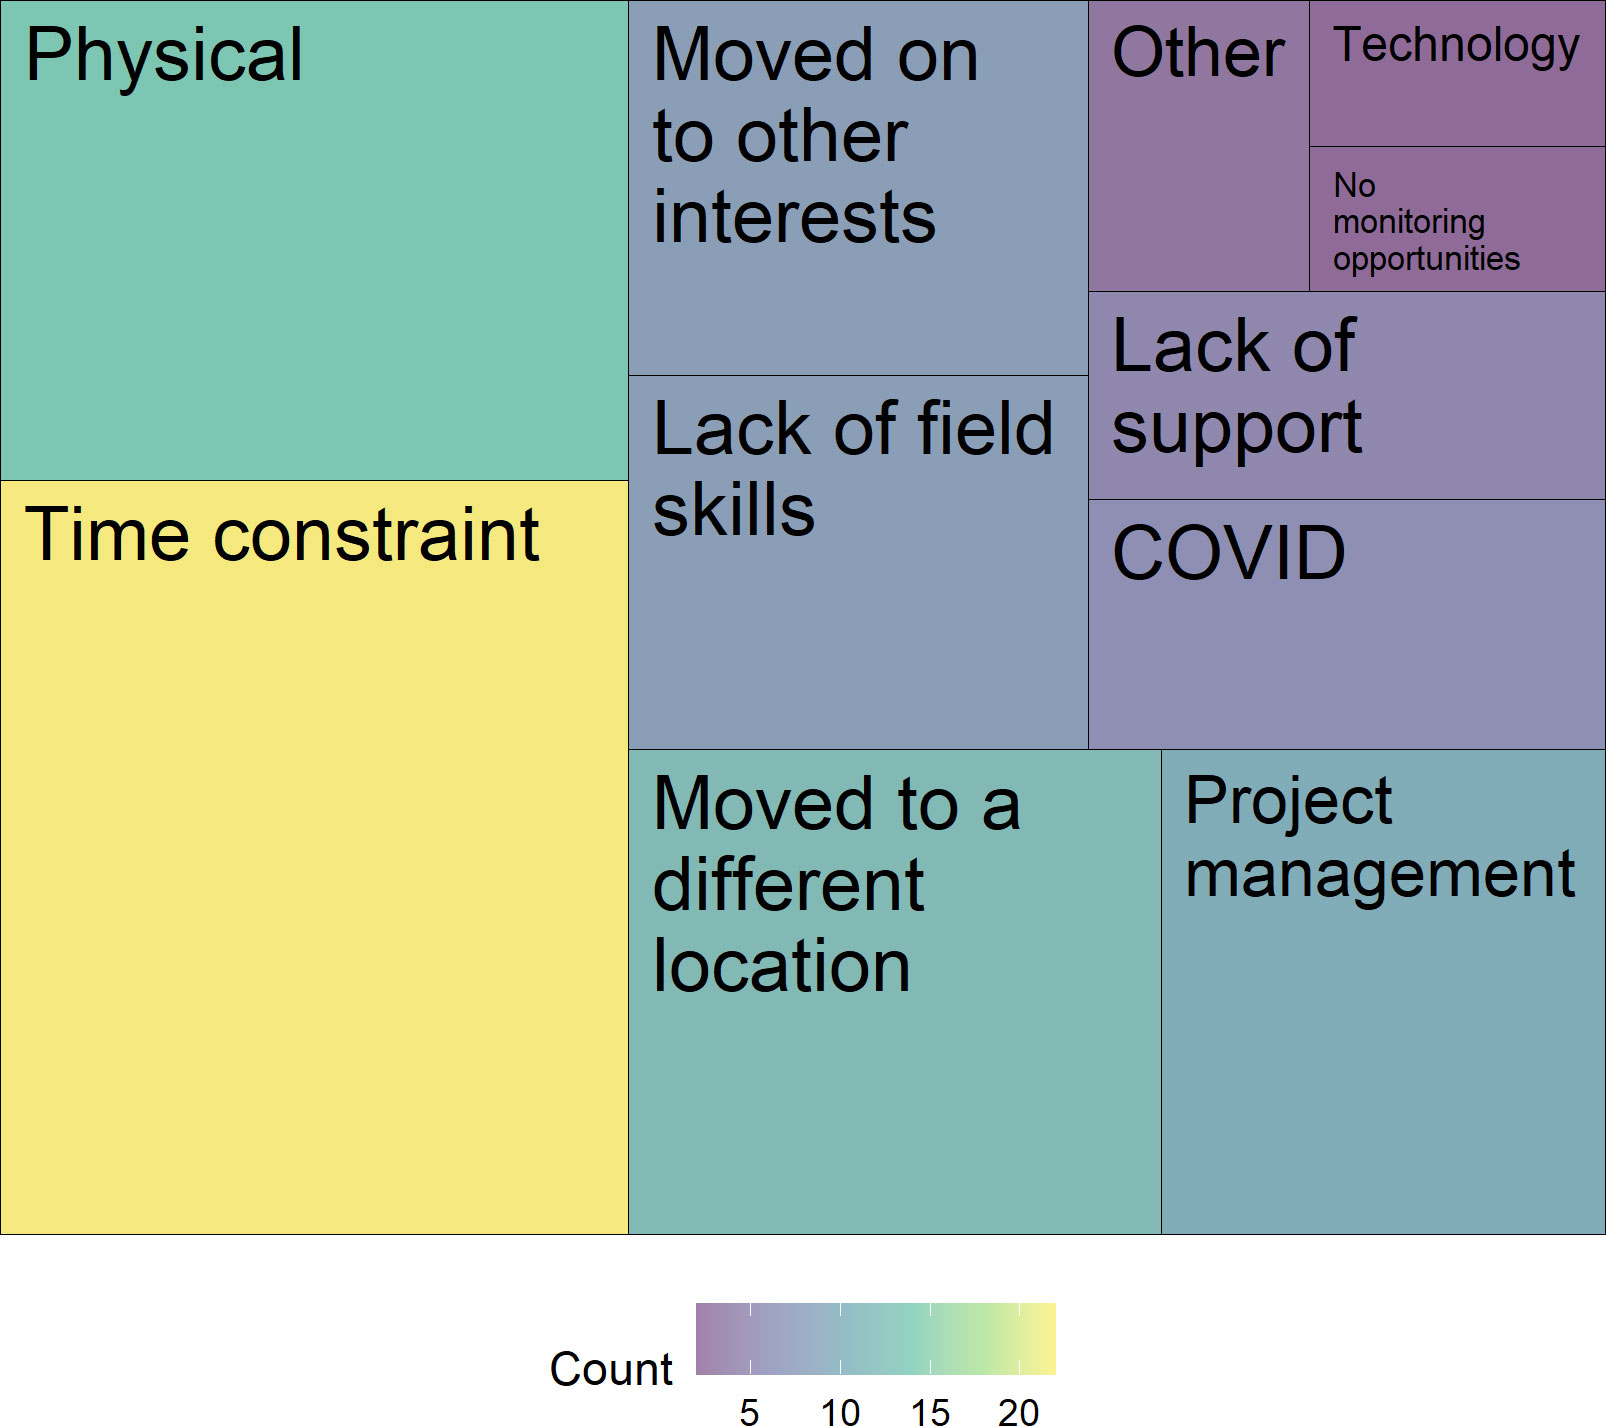
Figure 7 Reason why inactive participants (n = 84) are no longer active in the project. Across all projects, the #1 reason was time constraint (n = 22), followed by physical demands (14) and moving to a different location (12).
3.2.2 Participant demographics
The majority of project participants were white/Caucasian (94%), with 1% mixed race, and <1% Latino/Hispanic or Indigenous. Only 5% of project participants declined to provide an answer for race/ethnicity. About half of the participants are retired (51%), an additional 14% are partially retired, and 36% are not retired. Participant ages ranged broadly from 21 to 89. The mean age of participants was 61.70 (sd = 14.68), and the median age was 66 (Figure S3). The mean age of male participants (59.7, sd = 16) was slightly younger than that of female participants (62.8, sd = 13.7). Participant income covered a wide range, from $0 to $400,000 annually. The mean annual income of participants was $72,772.37 (sd = $49,800.16), and the median was $65,000 (Figure S4).
3.2.3 Project success and improvement
Based on survey results, 15 bins were used to code participant-identified drivers of project success. The top three attributes contributing to project success by count (n = 735) were project management (n = 147, 20%), the volunteers (111, 15%), and the project mission (97, 13%; Figure 8A).
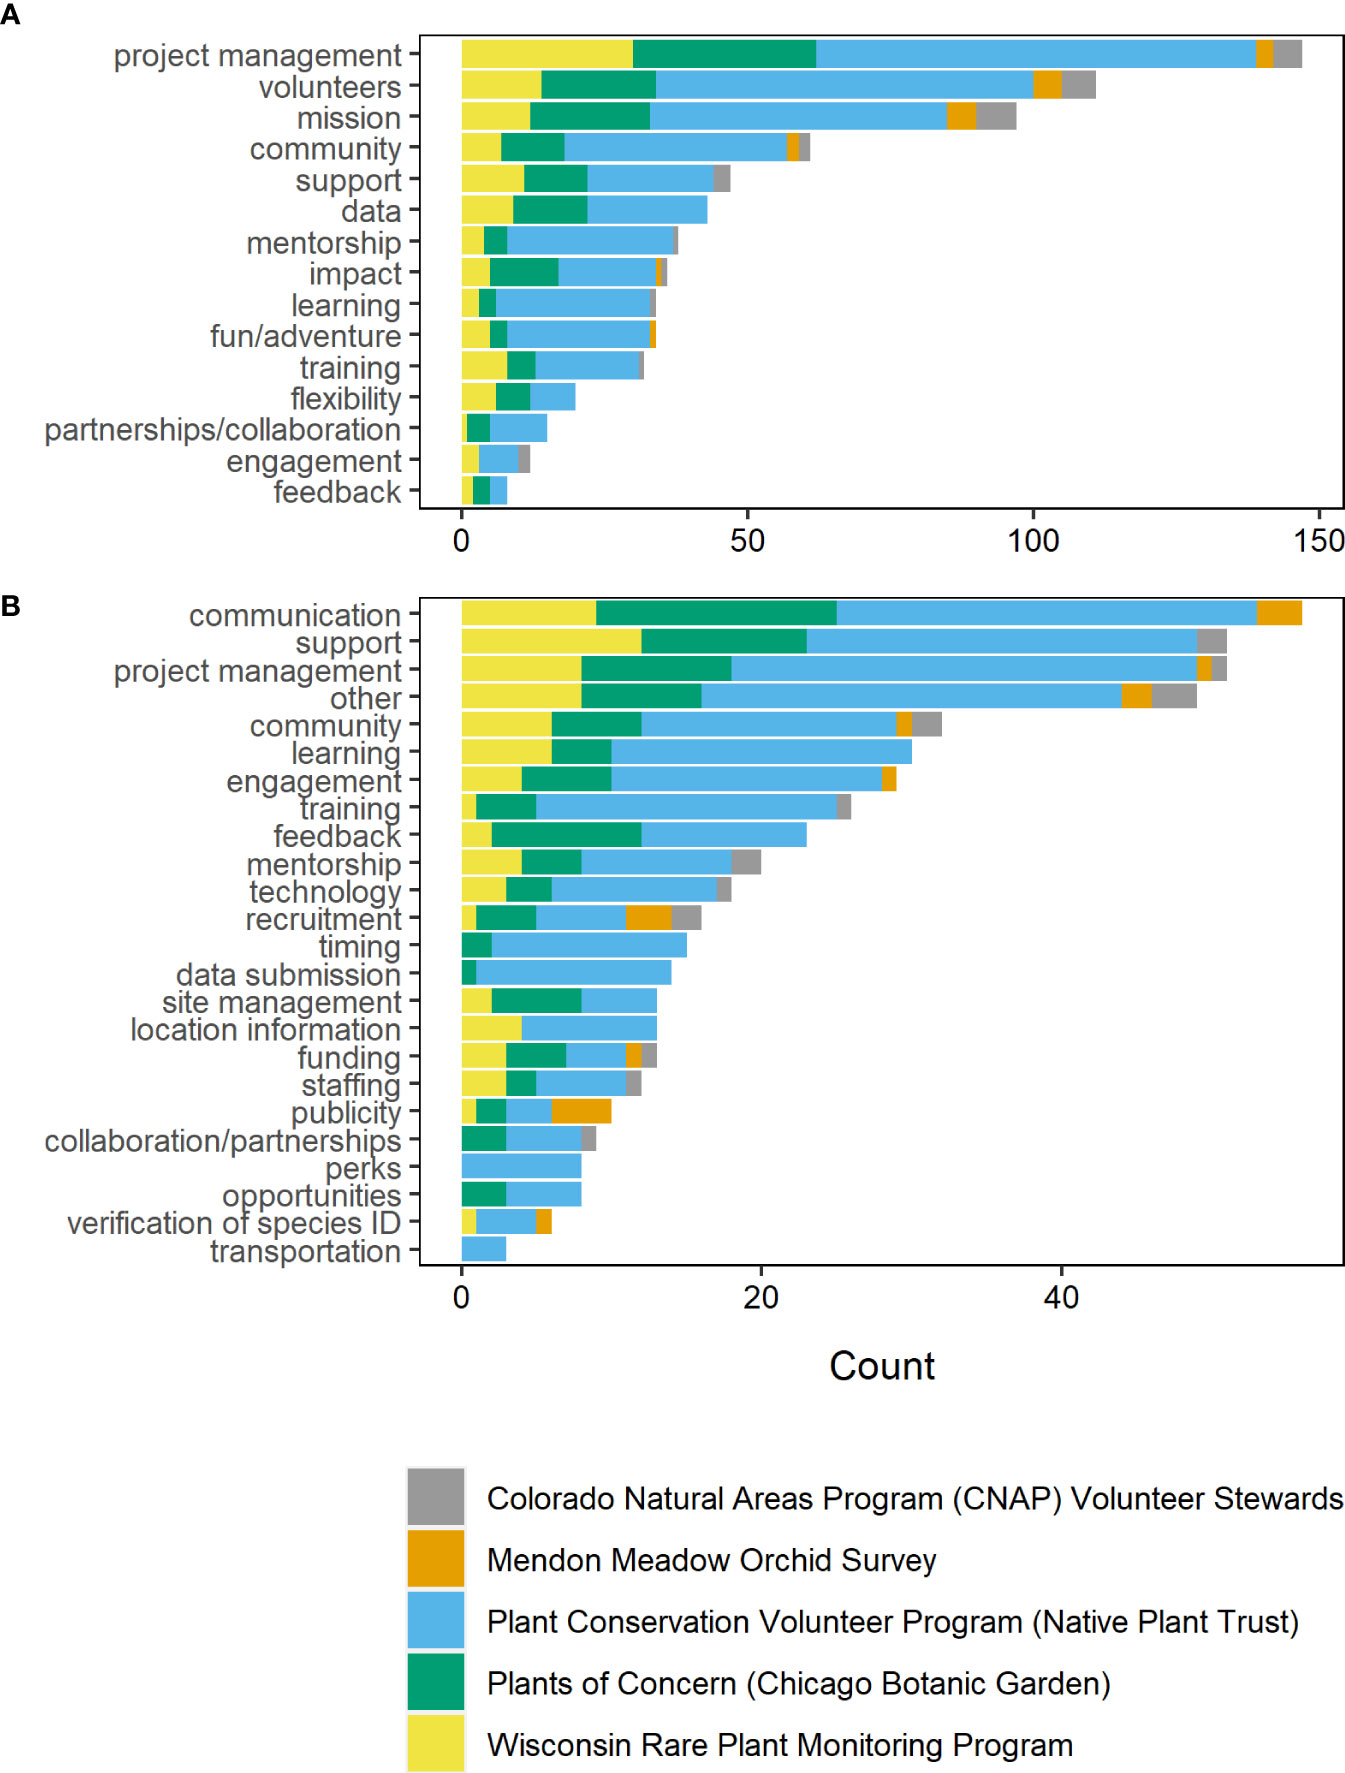
Figure 8 (A) Attributes of project success identified by participants (n = 735). (B) Areas in which projects could be improved as identified by participants. Examples of "other" suggestions for improvement include connecting people to reduce solo field work, aiding scheduling among survey team members, and widespread photo sharing.
Twenty-four posteriori bins were used to code participant suggestions for project improvement, resulting in 525 suggestions (Figure 8B). The top suggested project improvement was communication (n = 56, 11%). Tied for second were project management and support (51, 10%). Suggestions for improvement that consisted of or included themes that were identified less than three times in survey responses were coded using the bin “other” (49, 9%). Examples of the suggestions labeled “other” include increase engagement with K-12 education, increase photograph sharing, promote respectful behavior in the field, and take steps to prevent solo fieldwork, especially for at-risk individuals.
3.2.4 COVID-19 impacts
Survey responses were categorized into nine bins to describe the impact of COVID-19 on project participation (Figure 9). The majority of respondents indicated that their participation was not altered in any way (n = 120, 35%). About one-quarter of respondents (84, 25%) were able to continue participating with COVID safety precautions in place (e.g., masking and social distancing). In one case, COVID was reported to positively impact project participation.
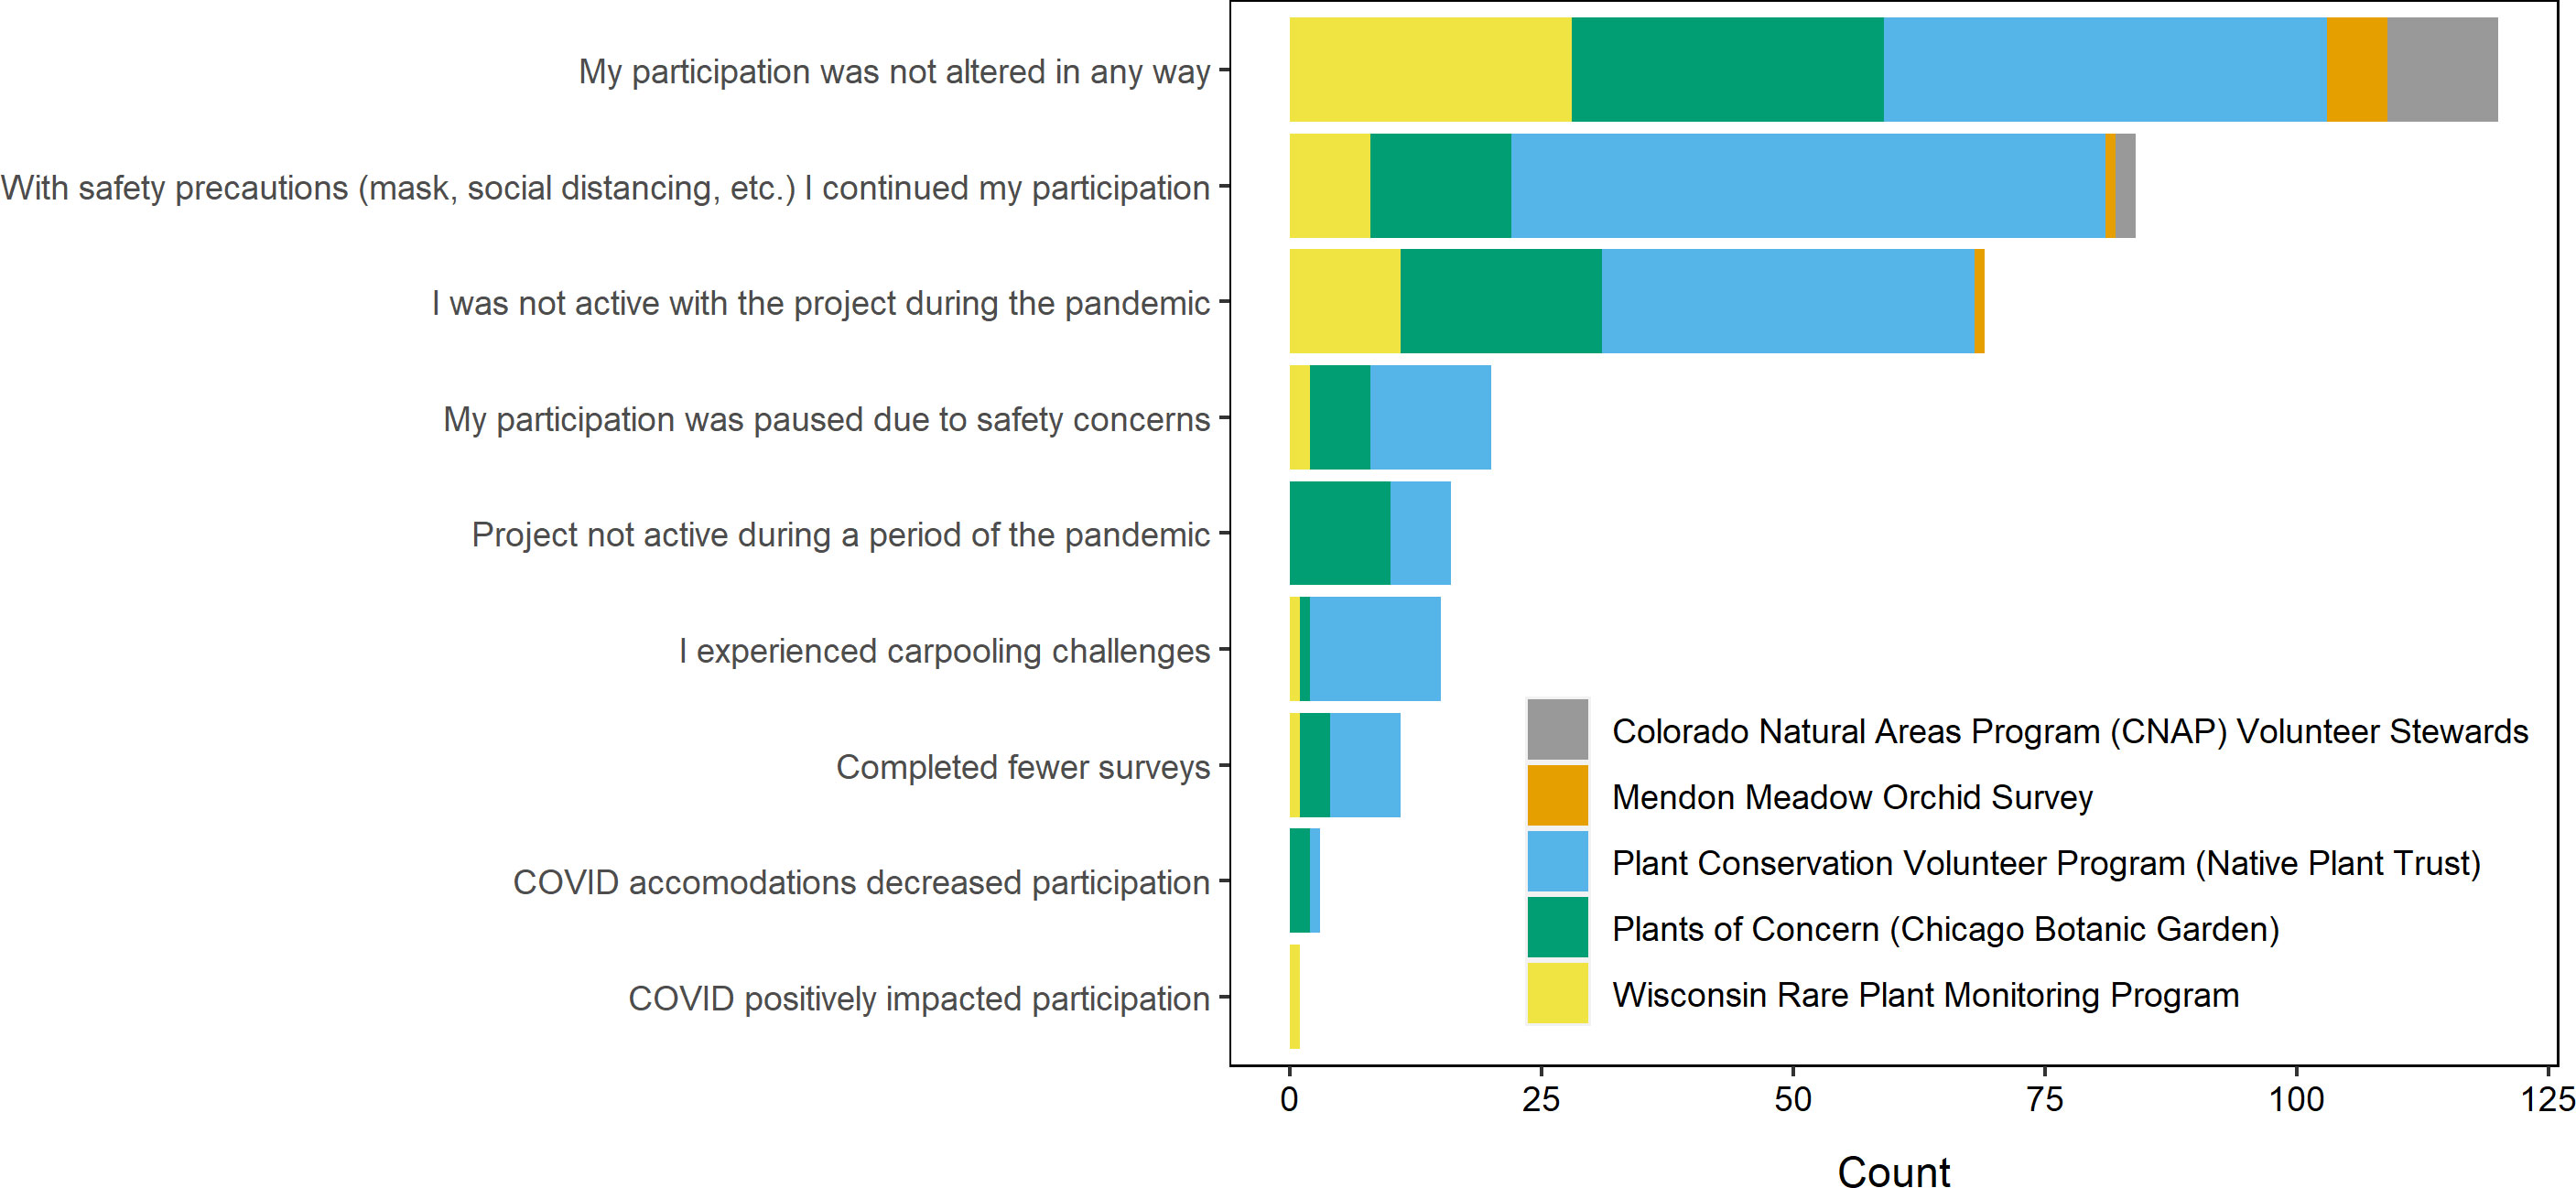
Figure 9 Impact of the COVID-19 pandemic on project participation.
Additional survey results are detailed in the Supplemental Material.
4 Discussion
How do we measure the success of community science monitoring projects? Is it enough to say that since these projects continue to exist, they are successful? Success can be evaluated using a variety of project criteria, including benefits to participants, the species monitored, the habitat supporting the species, and conservation broadly (Freitag and Pfeffer, 2013). The projects represented in our results vary in duration, scope, and size. These disparities make comparing projects and evaluating success challenging, as the goals of individual projects should be considered relative to their success (Freitag and Pfeffer, 2013; Cox et al., 2015). The projects represented share the reliance on structured data collection methodology that constrains the participant, the location, and the timing of the activity and requires staff to coordinate trained volunteers. The obstacles that these projects face due to their structured methodology may explain why the numbers of projects of this type have only seen a linear growth over time compared to the exponential growth seen in community science projects in general (Follett and Strezov, 2015; McKinley et al., 2017). Alternatively, it is possible that there is equivalent proliferation among projects of this type but that our study fails to capture project attrition. A better understanding of why projects fail would help elucidate what attributes are key to success. Our study design did not focus on capturing discontinued or failed projects; however, we did receive one response from a manager of a project that is no longer active. The challenges that volunteers faced with plant identification and using data collection technology were identified as reasons for discontinuing the project. Survey results from managers and participants of existing projects identified both qualitative and quantitative attributes promoting success. More specifically, we evaluated project success based on the number and quality of volunteers, data value as indicated by the number of products generated (reports to land managers, status assessment reports, peer-reviewed journal articles, and articles in public media), project management, and mission. Here we elucidate project manager and participant survey responses in relation to these themes.
4.1 Volunteers
Both project managers and participants identified dedicated, technically skilled, and passionate volunteers as key drivers of project success. Volunteers enable projects to collect rare plant monitoring data over a greater geographic extent than would otherwise be possible while minimizing costs. The length of time active with the project revealed relatively high project appeal (year 1), indicating clear success in project participation. Participant attrition is high over the next 3 years, but a small, dedicated percentage indicates success in sustained engagement, with participants volunteering for decades, and in some cases, for the entire lifetime of the project. High attrition early in participation is observed in many community science initiatives (Eveleigh et al., 2014). Success measured by project appeal is further supported by project manager accounts that they have experienced more volunteers than they are able to engage, particularly during the COVID-19 pandemic, which speaks to the interplay of project mission, management, and societal trends.
In addition to collecting data, volunteers often witness and report immediate and ensuing threats to plant populations that might otherwise remain undetected (Appalachian Trail Conservancy, 2022). Volunteer feedback on threats to rare plant populations often motivates land management and stewardship activities, including prescribed fire and invasive species removal, promoting benefits to rare species that extend to habitat health. Project managers balance data sharing restrictions, confidentiality agreements, and sharing sensitive rare plant location data with volunteers. Ultimately, projects that entrust volunteers with location data and allow trained volunteers to work more autonomously, independently, or in small groups collected data on a greater number of taxa and in more locations as compared to projects that relied on volunteer monitoring opportunities led by staff.
4.2 Data value
What impact do rare plant monitoring data have? All projects were reported using collected data for both internal and external purposes. Projects that engage more volunteers and therefore accomplish more monitoring generate more data-derived products, indicating greater data value (Freitag and Pfeffer, 2013). Data are used locally and regionally to assess rare plant distribution and status, guide species conservation and recovery, and inform land management. Projects often share data showing population trends or invasive species encroachment with land managers in order to guide land management activities. In addition, partnerships between non-profits, universities, and government entities allow projects to meet government priorities and contribute data to existing databases. As a result, data are not only available for site-level management decisions but also can inform regional status and distribution information used in assessing the listing status of rare plants. Additional investment in communicating project results to the broader community science and conservation communities would further the potential impact of these data (Chandler et al., 2017).
This study did not allow us to assess the direct effects of community science projects on population trends and habitat health. Further research that invites land manager participation and compares site quality metrics (e.g., floristic quality indices or species richness), rare species population trends, and management intensity (e.g., number of people hours spent on management), between sites with and without rare plant monitoring activity would be necessary to infer a direct impact of monitoring on species and habitat health.
4.3 Project management and mission
Identifying the project areas that volunteers and project managers struggled with helps us deconstruct project management into smaller core concepts that are key to project success. These include funding for organized staff, open communication between volunteers and staff, reliable population location data, ability to assign volunteers to suitable monitoring opportunities, and support for easy, efficient data collection and submission. A key takeaway from this study is the need for project managers to increase and improve communication with volunteers (for specific considerations, see Anderson et al., 2020; Robinson et al., 2021).
Volunteers cited contributing to plant conservation as their top reason for participating in rare plant monitoring projects. Volunteers see their contribution to conservation aligning with their respective project’s mission and with the motivations of fellow volunteers. Improving communication between project managers and volunteers enables better coordination of monitoring activities and increases the opportunity for projects to demonstrate the importance of the data. Communicating to volunteers the value of their contributed data for plant conservation empowers volunteers with the knowledge that what they are doing makes a difference (Larson et al., 2020). This knowledge can keep volunteers motivated to continue to learn and participate in community science projects (Robinson et al., 2021).
Similar to previous studies that found a lack of ethnic diversity in people who participate in community science (Pateman et al., 2021), our results identify a lack of racial diversity among rare plant monitoring volunteers. Rare plant community science projects fail to represent the racial diversity of the public, similar to the underrepresentation of Black, Indigenous, and people of color (BIPOC) in science broadly (NSF, NCSES 2017). The disproportionate, overrepresentation of white/Caucasian people may result from the failure of the white-dominated system to welcome and include all people in field sciences like ecology and evolution (O’Brien et al., 2020). Overrepresentation of white people specifically may result from the unequal distribution of educational resources on biology disciplines, a systemic racial disparity in the ability to access nature, and the fact that a history of slavery and racial terror in the United States has contributed to BIPOC feeling uncomfortable and/or unsafe in outdoor environments (Rowland-Shea et al., 2020).
To support the participation of diverse groups of people in community science monitoring projects, project leaders should include goals to increase equity, diversity, inclusion, and accessibility in mission statements and clearly articulated means by which to achieve these goals in operations documents (Cooper et al., 2021). Project leaders can pursue equitable partnerships with local organizations and communities that emphasize BIPOC participation in environmental science and outdoor spaces (e.g., Outdoor Afro and Latino Outdoors). However, it is essential that any work to increase diversity in community science be carried out with awareness and caution regarding the ethics of free labor and the risk of exploitation of already vulnerable and underserved communities (Liboiron, 2019). In addition to more inclusive partnerships, monitoring projects can also become more inclusive by not restricting focal taxa to rare species that are strictly threatened or endangered, for example. Projects can instead train individuals to monitor indicator taxa that may be present in natural areas that occur in more accessible environments (e.g., urban and proximal to public transit; Zhang and Zhou, 2018). Indicator taxa can be plants that help measure ecological restoration success or that serve as hosts for threatened insect species, for example (Siddig et al., 2016).
The COVID-19 pandemic has raised awareness of the importance of spending time outside, particularly in natural areas, for mental health (Jackson et al., 2021; Pouso et al., 2021). COVID-19 temporarily disrupted activities for some projects during the start of the pandemic. However, since rare plant monitoring is an outdoor activity, with safety measures in place, most projects resumed activity, and COVID-19 had minimal impact. These results suggest that outdoor community science projects may provide an opportunity for public recreation and community building in a COVID-resilient framework, which is particularly important for older adults who are highly represented as project participants (Son et al., 2021). Unfortunately, as previously discussed, outdoor space is not accessible to everyone, and many members of minority groups do not consider natural areas to be safe, welcoming spaces (O’Brien et al., 2020). Demographic results of the participant survey suggest that barriers to BIPOC, such as accessibility and comfort in natural areas, are prevalent in projects surveyed and must be identified and addressed to further equity in engagement. Persistent inequities related to race, class, and geography limit the ability of field-based community science to serve public health needs (Jennings et al., 2015).
Limited funding for plant conservation, in combination with decreased botany training opportunities, contributed to a gap in monitoring capacity and catalyzed the emergence of rare plant monitoring community science in the 1990s. Inherent reliance on place-based, structured methodologies constrains participant and project activities. These constraints can act as barriers to volunteer participation and hurdles for project management. In spite of these constraints, projects persist, and new projects continue to emerge. Over time, projects create awareness and teach people about rare plants and native habitats. Empowered volunteers advocate for and bring attention to native plants and natural areas, and the need to act to conserve plants through measures ranging from land management decisions to policy changes. Through volunteer efforts, projects can help shift the biodiversity spotlight onto plants and work to make more funding available to support botanists and plant conservation.
How do we learn from each other? The ultimate goal of this assessment is to inform the creation of a community science rare plant monitoring network that brings together the niche practitioners managing these projects. Collaboration is ever more crucial in a field faced with limited funding and mounting extinction risk, as exacerbated by climate change. This investigation has identified key areas for project improvement, specifically data management, communication with volunteers, and volunteer support. In addition, projects would benefit from identifying the minimum viable data; what information can we most efficiently collect that has the largest impact on plant conservation? Currently, we are surveying the global plant conservation landscape to identify the greatest potential for maximizing synergy and network uptake through a strategic partnership with existing programs. Developing a global network, a forum for sharing ideas and examples of success and failure, will facilitate the establishment of new, efficient projects and support the evolution of existing ones. Sharing knowledge and tools allows us to expand not only the amount of data we collect but also the impact the data have on people, plants, and habitats at local, regional, and global scales.
Data availability statement
De-identified data supporting the conclusions of this article will be made available by the authors upon request, without undue reservation.
Author contributions
JF, MJ, and GK conceived the research. MJ and KK identified the projects. JF, MJ, and GK conducted the project outreach. JF, MJ, KK, and GK designed the surveys. JF distributed the surveys. JF, MJ, KK, and GK reviewed the data and categorized the responses. JF analyzed and visualized the results. JF, MJ, KK, and GK wrote and edited the manuscript. All authors contributed to the article and approved the submitted version.
Funding
JF was supported in part by the Oak Spring Garden Foundation’s Fellowship in Plant Conservation Biology. GK and KK were supported in part by a gift from an anonymous foundation.
Acknowledgments
First and foremost, this study would not be possible without the hard work and dedication of volunteers across the globe who are committed to plant conservation. Second, we would like to thank the project managers and volunteers who completed our surveys. Lastly, we would like to thank the Conservation Department of Native Plant Trust for reviewing and providing feedback that greatly improved this manuscript, and specifically Michael Piantedosi, for close consultation on the development and launch of this project.
Conflict of interest
The authors declare that the research was conducted in the absence of any commercial or financial relationships that could be construed as a potential conflict of interest.
Publisher’s note
All claims expressed in this article are solely those of the authors and do not necessarily represent those of their affiliated organizations, or those of the publisher, the editors and the reviewers. Any product that may be evaluated in this article, or claim that may be made by its manufacturer, is not guaranteed or endorsed by the publisher.
Supplementary material
The Supplementary Material for this article can be found online at: https://www.frontiersin.org/articles/10.3389/fcosc.2022.933292/full#supplementary-material
References
Aceves-Bueno E., Adeleye A. S., Feraud M., Huang Y., Tao M., Yang Y., et al. (2017). The accuracy of citizen science data: A quantitative review. Bull. Ecol. Soc. America 98 (4), 278–290. doi: 10.1002/bes2.1336
Alton S., Linington S. (2001). The UK flora programme of the millennium seed bank project: The outcome of a collaboration between volunteers and professionals. Plant Genet. Resour. Newslett. 128, 1–10. Available at: https://www.bioversityinternational.org/fileadmin/PGR/article-issue_128-art_27-lang_en.html.
Anderson A., Williams E. A., Long M., Carter E., Volckens J. (2020). Organizationally based citizen science: considerations for implementation. J. Sci. Communication. 19 (3), A01. doi: 10.22323/2.19030201
Anhalt-Depies C., Stenglein J. L., Zuckerberg B., Townsend P. A., Rissman A. R. (2019). Tradeoffs and tools for data quality, privacy, transparency, and trust in citizen science. Biol. Conserv. 238, 108195. doi: 10.1016/j.biocon.2019.108195
Appalachian Trail Conservancy. (2022) Species monitoring. Available at: https://appalachiantrail.org/our-work/conservation/landscape/species-monitoring/.
Arnold J. B.. (2021) ggthemes: Extra Themes, Scales and Geoms for 'ggplot2'. R package version 4.2.4. Available at: https://CRAN.R-project.org/package=ggthemes.
Audubon Society. (2018). Why we’re changing from “Citizen science” to “Community science.” (Los Angeles, CA, USA: Audubon Center at Debs Park). Available at: https://debspark.audubon.org/news/why-were-changing-citizen-science-community-science.
Bonney R., Ballard H., Jordan R., McCallie E., Phillips T., Shirk J., et al. (2009). Public participation in scientific research: Defining the field and assessing its potential for informal science education (Washington, DC, USA: A CAISE Inquiry Group Report).
Brumback W. E., Gerke J. (2013). Flora conservanda: New England 2012. the new England plant conservation program (NEPCoP) list of plants in need of conservation. Rhodora 115 (964), 313–408. doi: 10.3119/13-20
Butcher G. S., Niven D. K., Sauer J. R. (2005). Using Christmas bird count data to assess population dynamics and trends of waterbirds. Am. Birds. 59, 23–25. Availabe at: https://pubs.er.usgs.gov/publication/5224843.
Catlin-Groves C. L. (2012). The citizen science landscape: From volunteers to citizen sensors and beyond. Int. J. Zoology. 2012, 1–14. doi: 10.1155/2012/349630
Chandler M., See L., Copas K., Bonde A. M. Z., López B. C., Danielsen F., et al. (2017). Contribution of citizen science towards international biodiversity monitoring. Biol. Conserv. 213, 280–294. doi: 10.1016/J.BIOCON.2016.09.004
Conrad C. T., Daoust T. (2008). Community-based monitoring frameworks: Increasing the effectiveness of environmental stewardship. Environ. Manage. 41 (3), 358–366. doi: 10.1007/s00267-007-9042-x
Conrad C. C., Hilchey K. G. (2011). A review of citizen science and community-based environmental monitoring: issues and opportunities. Environ. Monit. Assess. 176, 273–291. doi: 10.1007/s10661-010-1582-5
Cooper C. B., Hawn C. L., Larson L. R., Parrish J. K., Bowser G., Cavalier D., et al. (2021). Inclusion in citizen science: The conundrum of rebranding. Science 372 (6549), 1386–1388.
Couvet D., Prevot A. C. (2015). Citizen-science programs: Towards transformative biodiversity governance. Environ. Dev. 13, 39–45. doi: 10.1016/j.envdev.2014.11.003
Cox J., Oh E. Y., Simmons B., Lintott C., Masters K., Greenhill A., et al. (2015). Defining and measuring success in online citizen science: A case study of zooniverse projects. Computing. Sci. Eng. 17 (4), 28–41. doi: 10.1109/MCSE.2015.65
Czech B., Krausman P. R. (2001). The endangered species act: history, conservation biology, and public policy (Baltimore, MD, USA: JHU Press).
Eveleigh A., Jennett C., Blandford A., Brohan P., Cox A. L. (2014). “Designing for dabblers and deterring drop-outs in citizen science,” in Conference on Human Factors in Computing Systems - Proceedings (New York, NY, USA: Association for Computing Machinery). 2985–2994. doi: 10.1145/2556288.2557262
Farnsworth E. J., Klionsky S., Brumback W. E., Havens K. (2006). A set of simple decision matrices for prioritizing collection of rare plant species for ex situ conservation. Biol. Conserv. 128 (1), 1–12. doi: 10.1016/j.biocon.2005.09.010
Follett R., Strezov V. (2015). An analysis of citizen science based research: Usage and publication patterns. PloS One 10 (11), e0143687. doi: 10.1371/journal.pone.0143687
Franzoni C., Sauermann H. (2014). Crowd science: The organization of scientific research in open collaborative projects. Res. Policy 43 (1), 1–20. doi: 10.1016/j.respol.2013.07.005
Freitag A., Pfeffer M. J. (2013). Process, not product: Investigating recommendations for improving citizen science “success”. PloS One 8 (5), e64079. doi: 10.1371/journal.pone.0064079
Groves C. R., Klein M. L., Breden T. F. (1995). Natural heritage programs: public-private partnerships for biodiversity conservation. Wildlife. Soc. Bull. 23, 784–790.
Gunnell J. L., Golumbic Y. N., Hayes T., Cooper M. (2021). Co-Created citizen science: challenging cultures and practice in scientific research. J. Sci. Communication. 20 (5), 1–17. doi: 10.22323/2.20050401
Havens K., Kramer A. T., Guerrant E. O. Jr. (2014). Getting plant conservation right (or not): The case of the United States. Int. J. Plant Sci. 175 (1), 3–10. doi: 10.1086/674103
Havens K., Vitt P., Masi S. (2012). Citizen science on a local scale: the plants of concern program. Front. Ecol. Environ. 10 (6), 321–323. doi: 10.1890/110258
Havens K., Vitt P., Maunder M., Guerrant E. O., Dixon K. (2006). Ex situ plant conservation and beyond. BioScience 56 (6), 525–531. doi: 10.1641/0006-3568(2006)56[525:ESPCAB]2.0.CO;2
Heigl F., Kieslinger B., Paul K. T., Uhlik J., Dörler D. (2019). “Toward an international definition of citizen science,” in Proceedings of the National Academy of Sciences of the United States of America, 116. 8089–8092. Available at: https://www.pnas.org/doi/10.1073/pnas.190339.
International Union for Conservation of Nature, International Union for Conservation of Nature, Natural Resources, Species Survival Commission, & IUCN Species Survival Commission (2001). IUCN red list categories and criteria (Gland, Switzerland and Cambridge, UK: IUCN).
Jackson P. W., Kennedy K. (2009). The global strategy for plant conservation: A challenge and opportunity for the international community. Trends Plant Sci. 14 (11), 578–580. doi: 10.1016/j.tplants.2009.08.011
Jackson S. B., Stevenson K. T., Larson L. R., Peterson M. N., Seekamp E. (2021). Outdoor activity participation improves adolescents’ mental health and well-being during the COVID-19 pandemic. Int. J. Environ. Res. Public Health 18 (5), 2506.
Jennings V., Gaither C. J., Thomas S., Payne-Sturges D., Bunge C., Olden K. (2015). Approaching environmental health disparities and green spaces: An ecosystem services perspective. Int. J. Environ. Res. Public Health 12 (2), 1952–1968. doi: 10.3390/ijerph120201952
Kelling S., Johnston A., Bonn A., Fink D., Ruiz-Gutierrez V., Bonney R., et al. (2019). Using semistructured surveys to improve citizen science data for monitoring biodiversity. BioScience 69 (3), 170–179. doi: 10.1093/biosci/biz010
Kosmala M., Wiggins A., Swanson A., Simmons B. (2016). Assessing data quality in citizen science. Front. Ecol. Environ. 14 (10), 551–560. doi: 10.1002/fee.1436
Larson L. R., Cooper C. B., Futch S., Singh D., Shipley N. J., Dale K., et al (2020). The diverse motivations of citizen scientists: Does conservation emphasis grow as volunteer participation progresses? 242, 108428 doi: 10.1016/j.biocon.2020.108428
Laycock Helen F., Moran D., Smart James C. R., Raffaelli David G., White Piran C. L. (2011). Evaluating the effectiveness and efficiency of biodiversity conservation spending. Ecol. Economics. 70.10, 1789–1796.
Liboiron M. (2019). “The power (Relations) of citizen science,” in Citizen Science Association bi-annual meeting, Raleigh, NC. Available at: https://civiclaboratory.nl/2019/03/19/the-power-relations-of-citizen-science/.
Maistrello L., Dioli P., Bariselli M., Mazzoli G. L., Giacalone-Forini I. (2016). Citizen science and early detection of invasive species: Phenology of first occurrences of Halyomorpha halys in southern Europe. Biol. invasions. (Hauppauge, NY, USA: Nova Science Publishers, Inc.) 18 (11), 3109–3116. doi: 10.1007/s10530-016-1217-z
Martín-López B., Gómez-Baggethun E., González J. A., Lomas P. L., Montes C. (2009). “The assessment of ecosystem services provided by biodiversity: re-thinking concepts and research needs,” in Handbook of nature conservation: global, environmental and economic issues, (Hauppauge, NY, USA: Nova Science Publishers, Inc.) 261–282.
McKinley D. C., Miller-Rushing A. J., Ballard H. L., Bonney R., Brown H., Cook-Patton S. C., et al. (2017). Citizen science can improve conservation science, natural resource management, and environmental protection. Biol. Conserv. 208, 15–28. doi: 10.1016/j.biocon.2016.05.015
Minnesota Biological Survey (2016). MBS 30th anniversary (St. Paul, MN, USA: Minnesota Department of Natural Resources). Available at: https://www.dnr.state.mn.us/eco/mbs/anniversary.html.
Milne R., Rosolen S., Whitelaw G., Bennett L. (2006). Multi-party monitoring in Ontario: Challenges and emerging solutions. Environments 34 (1), 11.
Mullen M. W., Allison B. E. (1999). Stakeholder involvement and social capital: keys to watershed management success in Alabama 1. JAWRA. J. Am. Water Resour. Assoc. 35 (3), 655–662. doi: 10.1111/j.1752-1688.1999.tb03621.x
National Science Foundation, National Center for Science and Engineering Statistics. (20172017). “Women, minorities, and persons with disabilities in science and engineering,” in Special report NSF 17–310(National Science Foundation: Alexandria, VA, USA). Available at: www.nsf.gov/statistics/wmpd/.
O’Brien L. T., Bart H. L., Garcia D. M. (2020). Why are there so few ethnic minorities in ecology and evolutionary biology? challenges to inclusion and the role of sense of belonging. Soc. Psychol. Educ. 23 (2), 449–477. doi: 10.1007/s11218-019-09538-x
Pateman R. M., Dyke A., West S. E. (2021). The diversity of participants in environmental citizen science. Citizen. Science.: Theory Practice 6 (1), 9.
Pouso S., Borja Á., Fleming L. E., Gómez-Baggethun E., White M. P., Uyarra M. C. (2021). Contact with blue-green spaces during the COVID-19 pandemic lockdown beneficial for mental health. Sci. Total. Environ. 756, 143984. doi: 10.1016/j.scitotenv.2020.143984
Raddick M. J., Bracey G., Carney K., Gyuk G., Borne K., Wallin J., et al. (20092010). Citizen science: Status and research directions for the coming decade. AGB stars and related phenomenastro 2010: The astronomy and astrophysics decadal survey (Washington, DC, USA: National Academies Press). 46P.
R Core Team (2021). R: A language and environment for statistical computing (Vienna, Austria: R Foundation for Statistical Computing). Available at: https://www.R-project.org/.
Riesch H., Potter C. (2014). Citizen science as seen by scientists: Methodological, epistemological and ethical dimensions. Public Understanding. Sci. 23 (1), 107–120. doi: 10.1177/0963662513497324
Robinson J. A., Kocman D., Speyer O., Gerasopoulos E. (2021). Meeting volunteer expectations — a review of volunteer motivations in citizen science and best practices for their retention through implementation of functional features in CS tools. J. Environ. Plann. Manage. 64 (12), 2089–2113. doi: 10.1080/09640568.2020.1853507
Rowland-Shea J., Doshi S., Edberg S., Fanger R. (2020). The nature gap confronting racial and economic disparities in the destruction and protection of nature in America (Washington, DC, USA: Center for American Progress). Available at: https://www.americanprogress.org/issues/green/reports/2020/07/21/487787/the-nature-gap.
Schäfer T., Kieslinger B. (2016). Supporting emerging forms of citizen science: A plea for diversity, creativity and social innovation. J. Sci. Communication. 15 (2), Y02.
Siddig A. A. H., Ellison A. M., Ochs A., Villar-Leeman C., Lau M. K. (2016). How do ecologists select and use indicator species to monitor ecological change? Insights from 14 years of publication in ecological indicators. Ecol. Indic. 60, 223–230. doi: 10.1016/j.ecolind.2015.06.036
Son J. S., Nimrod G., West S. T., Janke M. C., Liechty T., Naar J. J. (2021). Promoting older adults’ physical activity and social well-being during COVID-19. Leisure. Sci. 43 (1–2), 287–294. doi: 10.1080/01490400.2020.1774015
Soroye P., Ahmed N., Kerr J. T. (2018). Opportunistic citizen science data transform understanding of species distributions, phenology, and diversity gradients for global change research. Glob. Change Biol. 24, 5281–5291. doi: 10.1111/gcb.14358
Standley L. A. (1995). “RHODORA” NEWS & NOTES: Highlights of Club Meetings Rhodora (Orange, MA: New England Botanical Club, Inc.) 97(891 825–288. https://www.jstor.org/stable/23313220.
Tierney G., Dieffenbach F., Reese C., Sharron E. (2015). “Appalachian National scenic trail rare plant monitoring protocol: 2015 revision,” in Natural resource report. NPS/NETN/NRR–2015/943 (Fort Collins, Colorado: National Park Service).
Vohland , Land-zandstra A., Perelló J., Lemmens R., Ponti M., Wagenknecht K., Samson R., Ceccaroni L. (Eds.) (2021). The science of citizen science (Orange, MA Cham, Switzerland: Springer International Publishing), 529.
Whitelaw G., Vaughan H., Craig B., Atkinson D. (2003). Establishing the Canadian community monitoring network. Environ. Monit. Assess. 88 (1), 409–418. doi: 10.1023/A:1025545813057
Wickham H. (2016). ggplot2: Elegant graphics for data analysis (New York: Springer-Verlag). Available at: https://ggplot2.tidyverse.orghttps://cran.r-project.org/package=tidyr.
Wickham H., Girlich M. (2022). tidyr: Tidy Messy Data. Available at: https://tidyr.tidyverse.org, https://github.com/tidyverse/tidyr.
Wiggins A., Crowston K. (2010). Developing a conceptual model of virtual organizations for citizen science. Int. J. Organisational. Design. Eng. 1 (1/2), 148.
Wiggins A., Crowston K. (2011). “From conservation to crowdsourcing: A typology of citizen science,” in 2011 44th Hawaii international conference on system sciences. 1–10. Available at: https://doi.org/10.1109/HICSS.2011.207.
Wilkins D.. (2021) treemapify: Draw Treemaps in 'ggplot2'. R package version 2.5.5. Available at: https://CRAN.R-project.org/package=treemapify.
Keywords: citizen science, community science, volunteer-contributed data, plant conservation, rare plants, monitoring
Citation: Finch J, Jasny M, Kucera KF and Kiefer G (2022) Surveying the scope, success, and challenges of plant conservation community science. Front. Conserv. Sci. 3:933292. doi: 10.3389/fcosc.2022.933292
Received: 30 April 2022; Accepted: 12 September 2022;
Published: 09 November 2022.
Edited by:
David W. Inouye, University of Maryland, College Park, United StatesReviewed by:
Yoseph Araya, The Open University, United KingdomPe Rajasekharan, Indian Institute of Horticultural Research (ICAR), India
Rachel Mary Pateman, University of York, United Kingdom
Copyright © 2022 Finch, Jasny, Kucera and Kiefer. This is an open-access article distributed under the terms of the Creative Commons Attribution License (CC BY). The use, distribution or reproduction in other forums is permitted, provided the original author(s) and the copyright owner(s) are credited and that the original publication in this journal is cited, in accordance with accepted academic practice. No use, distribution or reproduction is permitted which does not comply with these terms.
*Correspondence: Jessamine Finch, amZpbmNoQE5hdGl2ZVBsYW50VHJ1c3Qub3Jn