 Amanda M. MacDonald
 Paul F. Jones
 Jason A. Hanlon
 Brian H. Martin
 Andrew F. Jakes
- 1Alberta Conservation Association, Lethbridge, AB, Canada
- 2The Nature Conservancy, Dodson, MT, United States
- 3The Nature Conservancy, Helena, MT, United States
- 4Smithsonian’s National Zoo and Conservation Biology Institute, Front Royal, VA, United States
Fences are a common feature throughout the landscape of North America’s Great Plains region. Knowledge surrounding the harmful implication that fences have on the movement of wildlife, specifically ungulates, is expanding. Across the region, it is accepted that there is a need to mitigate the impacts of barbed wire fencing and that “wildlife-friendlier” fence designs are emerging as a practical tool to meet these goals. Here we evaluate the response of sympatric deer species to the implementation of two fence modifications, fastening the top two wires together using clips and the installation of polyvinyl chloride (PVC) pipe to encompass the top two wires. We also aim to determine the optimal top wire height to allow for successful crossing by deer, with the goal to provide a more robust understanding of effective wildlife-friendlier fence standards. We used remote trail cameras to capture crossing events and recorded responses for mule deer (Odocoileus hemionus) and white-tailed deer (Odocoileus virginianus). Using generalized linear mixed modelling, we tested the influence modifications had on crossing success and decisions prior to and after the modifications were installed compared to control sites. We found that these modifications had little impact on deer crossing behavior. We determined that wire height had the greatest impact on the permeability of fences, but that deer permeability was strongly influenced by species and sex. We found that the current maximum recommended top wire height of 102 cm (40 inches) is adequate to allow individuals of both deer species to cross over the fence, with the exception of female mule deer. Our results also indicate as the top wire height reaches 110 cm (43 inches) or higher, that the probability of successfully jumping over the fence dramatically drops off, with the exception for male mule deer. We recommend the installation of clips as a cost-effective method to lower top wire height and PVC pipe to improve fence visibility and potentially reduce entanglement events, all while effectively keeping livestock in intended pastures.
Introduction
Anthropogenic features, such as roads, railways, and fences continue to proliferate across landscapes worldwide and are having extensive consequences on wildlife, and in particular ungulates that move great distances. Previous research has discussed how anthropogenic effects, such as habitat fragmentation and barriers to movement, have resulted in an overall global decline of iconic terrestrial mammal migrations (Berger, 2004; Harris et al., 2009; Tucker et al., 2018). Iconic migrations such as those made by caribou (Rangifer tarandus) and pronghorn (Antilocapra americana) are well documented and technological advances have improved wildlife tracking techniques resulting in greater understanding of non-conspicuous wildlife aggregation and migrations, such as those exhibited by mule deer (Odocoileus hemionus), elk (Cervus canadensis), and moose (Alces alces) (Fancy et al., 1989; Jakes et al., 2018a; Kauffman et al., 2021). An increased understanding of wildlife migrations coupled with knowledge of everyday movements speaks to the importance of maintaining and improving connectivity in grassland and sagebrush systems.
Barbed wire fences are one of the most recognized anthropogenic features in western North America’s grassland and sagebrush landscapes (Jakes et al., 2018b; McInturff et al., 2020). Fences may act as barriers that contribute to habitat loss and disruption of ungulate movement (Boone and Hobbs, 2004; Bolger et al., 2008; Jones et al., 2019). Fences pose connectivity challenges as they may act as both complete or semi-permeable barriers with the capability of changing movement behavior of ungulates (Sawyer et al., 2013; van Aarde et al., 2021; Robb et al., 2022). When Xu et al. (2021) evaluated movement patterns of mule deer and pronghorn, they found that fences were altering behaviors of both species. Animals would only cross approximately half of the instances when fences were encountered and both species typically would adjust their behavior by changing movement patterns to assess fences to find potential crossing sites (Xu et al., 2021). These disruptions to wildlife movement from fences, and the resulting habitat fragmentation and consequential loss of habitat, is concerning for the conservation of prairie ungulates. Furthermore, linear barriers have negatively impacted migratory species populations as they increase mortality risk and energy expenditure (van Moorter et al., 2020; van Aarde et al., 2021). The removal of linear barriers may not entirely restore connectivity once populations have dwindled and generational knowledge of traditional migration routes are lost; however, evidence of the lasting impacts linear barriers have on populations may not be as severe as once thought. For example, four years after the removal of a fence, zebra (Equus burchelli antiquorum) in north-west Botswana resumed long-distance movements indicating that migration can be restored (Bartlam-Brooks et al., 2011; Sawyer et al., 2013; Jesmer et al., 2018).
Maintaining landscape permeability, through measures such as the removal of fences, has been cited as a potential restoration strategy for fragmented ecosystems (Cumming et al., 2015); however, the removal of fences is costly, time-consuming, and often impractical for areas where livestock rearing is a predominant activity. While the complete removal of fences from the landscape is doubtful, recommended fence designs are shifting to be “wildlife-friendlier” in multiple jurisdictions (Paige, 2020). Wildlife-friendlier fence designs aim to provide a practical strategy to improve landscape connectivity and reduce wildlife mortality associated with fences (Harrington and Conover, 2006), while also maintaining a fence’s integrity as functional infrastructure. Recent studies have aimed to test anecdotal wildlife-friendlier fence recommendations through a series of fence trials to better inform land managers of effective fence standards (2020; Burkholder et al., 2018; Jones et al., 2018; Segar and Keane, 2020). Wildlife-friendlier recommendations for barbed wire fences typically fall within one of two categories; those that create conditions that allow animals to pass over a fence easier, and those that allow animals to effectively pass underneath more easily. In both cases, the recommendations are based on a species’ behavior, age class (i.e., young or adult), and sex (female or male). For example, Burkholder et al. (2018) demonstrated that adult male deer had a lower probability of successfully crossing under fences compared to adult females. Larger body size, the presence of antlers, and overall behavioral differences between sexes are potential causes for the difference in fence crossing success and decisions by male and female deer. However overall, deer have been shown to be impartial in their crossing decision by choosing to cross under the bottom wire nearly as often as they jumped over (Burkholder et al., 2018). Burkholder et al. (2018) could not definitively state that deer preferred to cross underneath fences because they could not rule out that the top wire may have been too high to allow deer to jump over. To date, most studies have evaluated fence modifications to allow easier passage under a fence and have not manipulated the top wire height to see if there is an optimal height that allows easier passage over (Burkholder et al., 2018; Jones et al., 2018; 2020). Current recommendations for top wire height are based on antidotal accounts and is in urgent need of scientifically testing to provide a truly multi-species wildlife-friendlier fence design.
Our study builds on the results of Burkholder et al. (2018) and Jones et al. (2018; 2020) and had two main objectives. First, we evaluated the effectiveness of two fence modifications aimed at lowering the top wire to facilitate passage over a fence by deer. Second, we evaluated the recommended wildlife-friendlier top wire height to see if it allowed successful passage by deer over a fence, while also assessing the height of the fence where the probability of crossing successfully decreases dramatically. Paige (2020) has proposed using carabiner clips to secure together the top two wires or installing PVC pipe to enclose the top two wires to effectively lower the height of the tope wire. She also recommended the height of the top wire be 102–107 cm. These two proposed modifications are believed to allow easier passage by deer over fences but have not been scientifically tested. We used a Before-After-Control-Impact (BACI; Underwood, 1994) study design to evaluate the responses of two deer species (mule deer and white-tailed deer (Odocoileus virginianus)) to these proposed recommendations. Specifically, we assessed 1) the fence crossing success of deer at fences before and after these two modifications were installed, 2) the preferred crossing decision (i.e., to cross under versus over), 3) whether the decision to cross over or under was influenced by the sex of the two deer species, and 4) what the bottom and top wire heights were that resulted in an % probability of a deer successfully crossing under or over a fence and whether this varied based on sex. We defined crossing success as the ability of an individual to move from one side of the fence to the other by any means (under, over, or through; sensu Jones et al., 2018). We defined crossing decision as to whether the individual that successfully crossed a fence did so by crawling underneath or jumping over (Burkholder et al., 2018). We predicted that the modifications would improve the likelihood of successfully crossing for both species based on results of a similar project to increase fence permeability (Laskin et al., 2020). We also predicted that crossing success by both deer species would decrease once the top wire height was above the recommended 102 cm (40 inches) and that crossing decisions would not be influenced the modifications tested, but by sex, with adult females showing a propensity to cross under the bottom wire and adult males jumping over the top wire (Burkholder et al., 2018). Lastly, based on our results we provide recommendations for top wire height to enable both deer species to cross fences more effectively.
Study area
Our research was conducted in two study areas within the Northern Great Plains: The National Wildlife Area of Canadian Forces Base (CFB) Suffield (50°15’N, –111°10’W) in Alberta, Canada, and the Nature Conservancy’s Matador Ranch (47°55’N, –108°19’W) in Montana, USA. Both study areas were located in the Northern Sagebrush Steppe, a region characterized by semiarid, native grassland habitats. The National Wildlife Area is a nature preserve outside of the active military training area of CFB Suffield and received periodic livestock grazing. Livestock grazing was the predominate land use on the Nature Conservancy’s Matador Ranch. Fences were used throughout both study areas to aid in the distribution of livestock (cattle; Bos tarus) as they were rotated between pastures. Fences in Alberta were 4-strand fences, while those in Montana were 3- or 5-strand fencing. The 4- and 5-strand fences followed a standard fence design, while the 3-strand fence in Montana followed a “wildlife-friendlier” design consisting of a double-stranded smooth bottom wire raised to approximately 46 cm (18 inches) above the ground and 2 strands of barbed wire above. Details on fence panels used in our study (e.g., bottom wire and top wire heights) are provided in Supporting Information, Table S1. Additional information on the study area can be found in Jones et al. (2020).
Methods
Experimental design
To assess deer-fence interactions, we used a BACI design at fence panels with known crossing locations to determine the effect that proposed wildlife-friendlier fence modifications had on deer behavioral response and crossing success (Underwood, 1994). Remote trail cameras were deployed at fence panels with known crossing locations (hereafter, camera site) to capture images used to assess deer-fence interactions. Known crossing locations were previously identified through ground truthing surveys described in Jones et al. (2018; 2020). Camera sites were monitored prior to the installation of modifications (hereafter, before period) for approximately 282 days (x̅ = 282 days, SE = 10.5). Modifications were installed (hereafter, after period) and monitored for approximately 297 days (x̅ = 297.67 days, SE = 12.7). Two types of modifications were installed during the after period. Oval carabiner clips with screw locking mechanisms (hereafter, clips) were affixed to the top two wires of the fence at one-third of camera sites and white PVC pipe encircling the top two wires at another one-third of the camera sites. One to two clips were situated along each assessed fence panel at locales that lowered a portion of the top wire directly over crossing locations while the 3 m long PVC pipe was placed directly over the path used to cross the fence. The remaining one-third of the camera sites were used as controls and not altered during the duration of the study. Heights of both the top and bottom wire were measured above the path used to cross the fence at each camera site prior to and after the installation of modifications. At the modified camera sites, we attempted to standardize the top wire height to 102–107 cm but at certain sites the fence design (e.g., presence of fence stays) did not always allow this, resulting in variability in top wire height across sites. When lowering the top wire and raising the wire below to link them together, on certain fence sections with stays it also resulted in the raising of the bottom wire.
Camera set‐up and photo classification
Remote trail cameras were used to capture the images of deer interacting with fences to then quantify animal responses (Reconyx© PC650, PC800 or PC900; Reconyx, Holmen, WI, USA). In Alberta, we deployed 29 cameras between July 18 and 19, 2018 and 1 additional camera on September 25, 2018, while in Montana we deployed 20 cameras on October 1 and 4, 2018. Information regarding dates for camera deployment, take down, and number of days for the before and after period, as well as any instances cameras were nonoperational are provided in Supporting Information, Table S2. Cameras were set to the rapid-fire function to take 3-5 photos in bursts when triggered with no delay between triggers. Sensitivity of the trail cameras was set to high but adjusted to suit each camera site to reduce false triggers. The motion activated sensor which triggered the trail cameras ranged between 15 and 18 m, depending on model type, with no significant difference between the image capture capability between camera sites related to width of fence panels. One camera was deployed at each fence panel with a camera site. At each camera site a measuring stick was secured to the fence post across from the camera to measure the depth of snow during winter. We delineated sections of the measuring stick at 15 cm (6 inches) intervals from 0–91 cm (0–36 inches) for snow depth estimates.
Images of deer that were within 2-3 m on either side of the fence panel were processed following methods in Jones et al. (2020). Photo processing was a two-step procedure; first, we classified species (i.e., mule deer or white-tailed deer) and placed observations into events. Events were defined as all images of ≥ 1 animal until there was a ≥ 15-minute gap between the last image of the animal(s) captured and the next set of photos with an animal in it. Once an event was identified the observed behavior was categorized into one of two distinct categories: 1) failed attempt, or 2) successful attempt sensu Burkholder et al. (2018) and Jones et al. (2018). We followed protocol outlined in Jones et al. (2020) for how an attempt was defined with an event beginning when an individual animal approached the camera site with its body orientated perpendicular to the fence within 2 body lengths. An attempt ended when the individual animal either successfully crossed or failed to cross. Failed attempts were classified when an individual had its head positioned down and approaching the fence as if to crawl under or when it positioned its body weight primarily on its hindlegs as if to jump over, but then turned from the fence. Once an individual was positioned parallel to the fence, we determined the attempt to be complete. We then further classified successful attempts into the number of instances an individual “crossed under”, “crossed over”, or “crossed through” (i.e., between the wires) the fence. We were able to separate groups of deer into an event and associated behavior for each individual, as groups of deer were typically small, exhibited pronounced decisions to cross, and spent a relatively short amount of time at any camera site (Moeller et al., 2018). For each event, an individual’s response was recorded, the species of deer (mule deer or white-tailed deer), the age-sex of the individual (adult male, adult female, or unknown fawn), and the size of the group each individual deer was found in. We also recorded the depth of snow, if present, into increments mentioned above, and whether the event occurred in the Alberta or Montana study area. Data from both study areas was pooled and we completed separate analyses for each deer species.
Statistical analysis
Factors Affecting Crossing Success — We used the glmmTMB package (Brooks et al., 2017) in RStudio 2021.09.0 (RStudio Team, 2021) for generalized linear mixed modelling to analyze the fence crossing response of deer across study sites. We considered the following factors: Area (AB (reference category) or MT); sex-age (adult female (reference category), adult male, or unknown fawn); presence of snow (absent (reference category) or present); and treatment-period (control-before (reference category), control-after, clips-before, clips-after, PVC pipe-before, or PVC pipe-after). We also considered the covariates bottom wire height, top wire height, and maximum count to determine the probability of successful crossing by each species. We coded events where the individual successfully crossed the fences as 1 and where the individual failed to cross as 0. We used the covariate treatment-period to simplify the interpretation of the response to the modifications tested. Although estimated snow depth was recorded in 15 cm (6 inches) increments for each event, there were inadequate sample sizes for snow depths greater than 30 cm (12 inches), therefore we assessed the covariate as the presence or absence of snow. Continuous variables were standardized using the Gelman (2008) method where the mean of the variable is subtracted and divided by two standard deviations. We tested for collinearity (|r| > 0.7) and removed one covariate from our models when two were correlated. The decision on which covariate to remove when correlation occurred was done on a case-by-case basis. For example, if top wire height and bottom wire height were correlated for mule deer crossing over, we selected top wire height for analysis under the assumption that top wire height would provide a more predictive account for a mule deer crossing decision than bottom wire height would. To reduce the global model complexity, we compared single factors to the null model and removed insignificant covariates from further analysis (Zuur et al., 2010). We chose to remove covariates if P ≥ 0.1 rather than P ≥ 0.05 to avoid prematurely removing potentially significant factors from our global model. We used Akaike’s Information Criteria (AICc; Burnham and Anderson, 2002) to determine covariates to include in top models. We tested all combinations of covariates being compared using the best subset regression approach (Grueber et al., 2011) through the dredge function found in the MuMIn package (Burnham and Anderson, 2002). We considered competing top models when ΔAICc < 2.0 and evaluated covariates in each model to determine their importance for overall model performance (Arnold, 2010). Instances where we found >1 competitive model, we report the full model‐averaged β coefficients (Grueber et al., 2011). For all regression coefficients we report the associated 95% confidence interval (CI). Model performance was evaluated using Receiver Operator Curves (ROC) and associated scores were used to determine if the model performance was excellent (>0.9), good (0.8–0.9), adequate (0.7–0.79), satisfactory (0.6–0.69), or poor (<0.6; Hosmer and Lemeshow, 2000). In instances where there were competing top models, the reported ROC value was for the model where ΔAICc = 0.
Factors Affecting Crossing Decision — We evaluated factors that affect the crossing decision (i.e., crawling under or jumping over) made by both deer species. There were no recorded instances of deer crossing through fences during our study. We chose to assess decisions made by mule deer and white-tailed deer separately due to previous research which indicated a divergence in each species response to fences (Burkholder et al., 2018). We used generalized linear mixed models to evaluate crossing decision for deer; however, as bottom and top wire heights were often correlated, we split our decision analysis into two components. First, we tested whether the successful cross was completed by crossing under the fence (coded 1) versus crossing over (coded 0) using bottom wire height, top wire height, area, snow, and group composition as candidate covariates. Secondly, we tested whether the successful cross was completed by crossing over the fence (coded 1) versus crossing under (coded 0) using bottom wire height, top wire height, area, snow, and group composition as candidate covariates. We used the same approach discussed above in the Factors Affecting Crossing Success to evaluate model competitiveness, completed model averaging where there was more than one top model and to evaluate the performance of the top model for each analysis completed. Similar to Factors Affecting Crossing Success, we completed the analysis for mule deer and white-tailed deer separately.
Wire Height — For the top model(s) that contained either bottom or top wire height as a covariate for each deer species and each sex under the crossing decision analysis we examined the results to assess preferred wire height to allow easier passage either under or over the fence. Specifically, we used the predict function in R to predict the probability of successfully crossing under or over the fence based on the range of values of the bottom and top wire heights, respectively. We used the results of our multivariate decision analysis that included one of the wire height covariates (i.e., bottom wire height for decision to cross under and top wire height for decision to cross over), holding the other covariates constant at their mean or reference category to generate the predictions. For both top and bottom wire, we determined optimal height as the height that resulted in a 75% probability of successfully crossing over or under, respectively. Predictions were calculated at the population level with the random effect set at “NA”.
Results
With pooled data between both study areas, we documented 2,783 individual mule deer events resulting in 3,007 attempts and 465 individual white-tailed deer events resulting in 556 attempts, respectively. Mule deer successfully crossed 91% of the time while white-tailed deer had a fence crossing success rate of 75%. For individuals who successfully crossed, mule deer crossed under the fence (82%), whereas white-tailed deer more often crossed over the fence (53%). Female mule deer crossed under the fence 90% of the time while males crossed equally over (50%) and under (50%). Female mule deer had a 94% fence crossing success rate while males had an 84% success rate. Male and female white-tailed deer successfully crossed 75% and 74% of the time, respectively.
Additionally, both sexes of white-tailed deer more often crossed over the fence with females choosing to cross over 53% of the time and males 54% of the time. For both deer species, all successful crossing attempts recorded for fawns were under the fence. Mule deer fawns successfully crossed 90% of the time and white-tailed deer fawns successfully crossed 100% of the time. Because of low sample sizes and propensity to only cross under, we removed fawns from all analysis to eliminate convergence issues with the mixed effects logistic regression analysis. In addition, we recorded 14,504 successful crossings by pronghorn and no crossings by cattle at our camera sites. Pronghorn had a fence crossing success rate of 75% and predominantly crossed under the fence (99.9%).
Factors affecting crossing success
For mule deer top and bottom wire heights were correlated, therefore we chose to include top wire height in our analysis, since modifications installed were focused on top wires, and we deemed it an important covariate to explore. Our mixed effects logistic regression analysis of factors affecting crossing success of mule deer resulted in one top models with ΔAICc < 2.0 and a combined weight of 65% (Table 1). The covariates top wire height, sex-age, and maximum count were retained in our top model (Figure 1). As top wire height and maximum count increased, the probability of mule deer successfully crossing increased (Figure 1). Adult male mule deer were less likely to successfully cross than adult females (Figure 1). The performance of the top model was good with a ROC of 0.85.
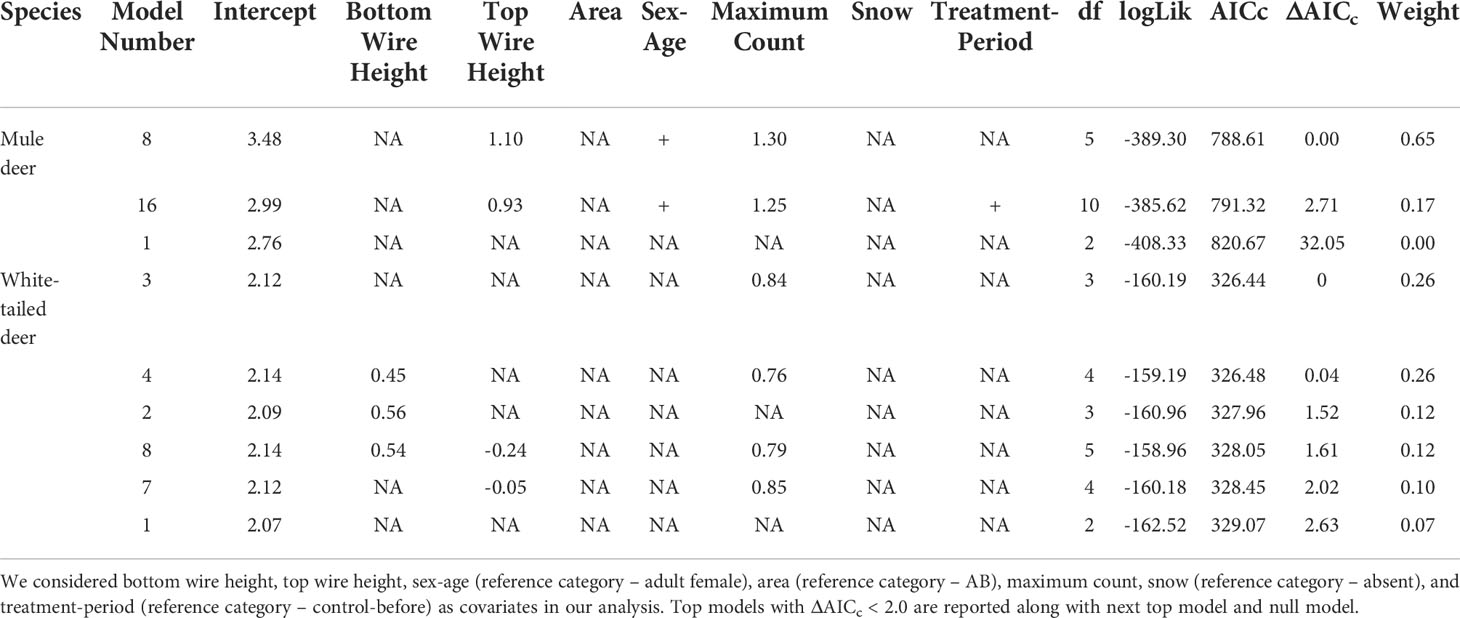
Table 1 Mixed effects logistic regression analysis results for factors affecting crossing success of mule deer and white-tailed deer. .
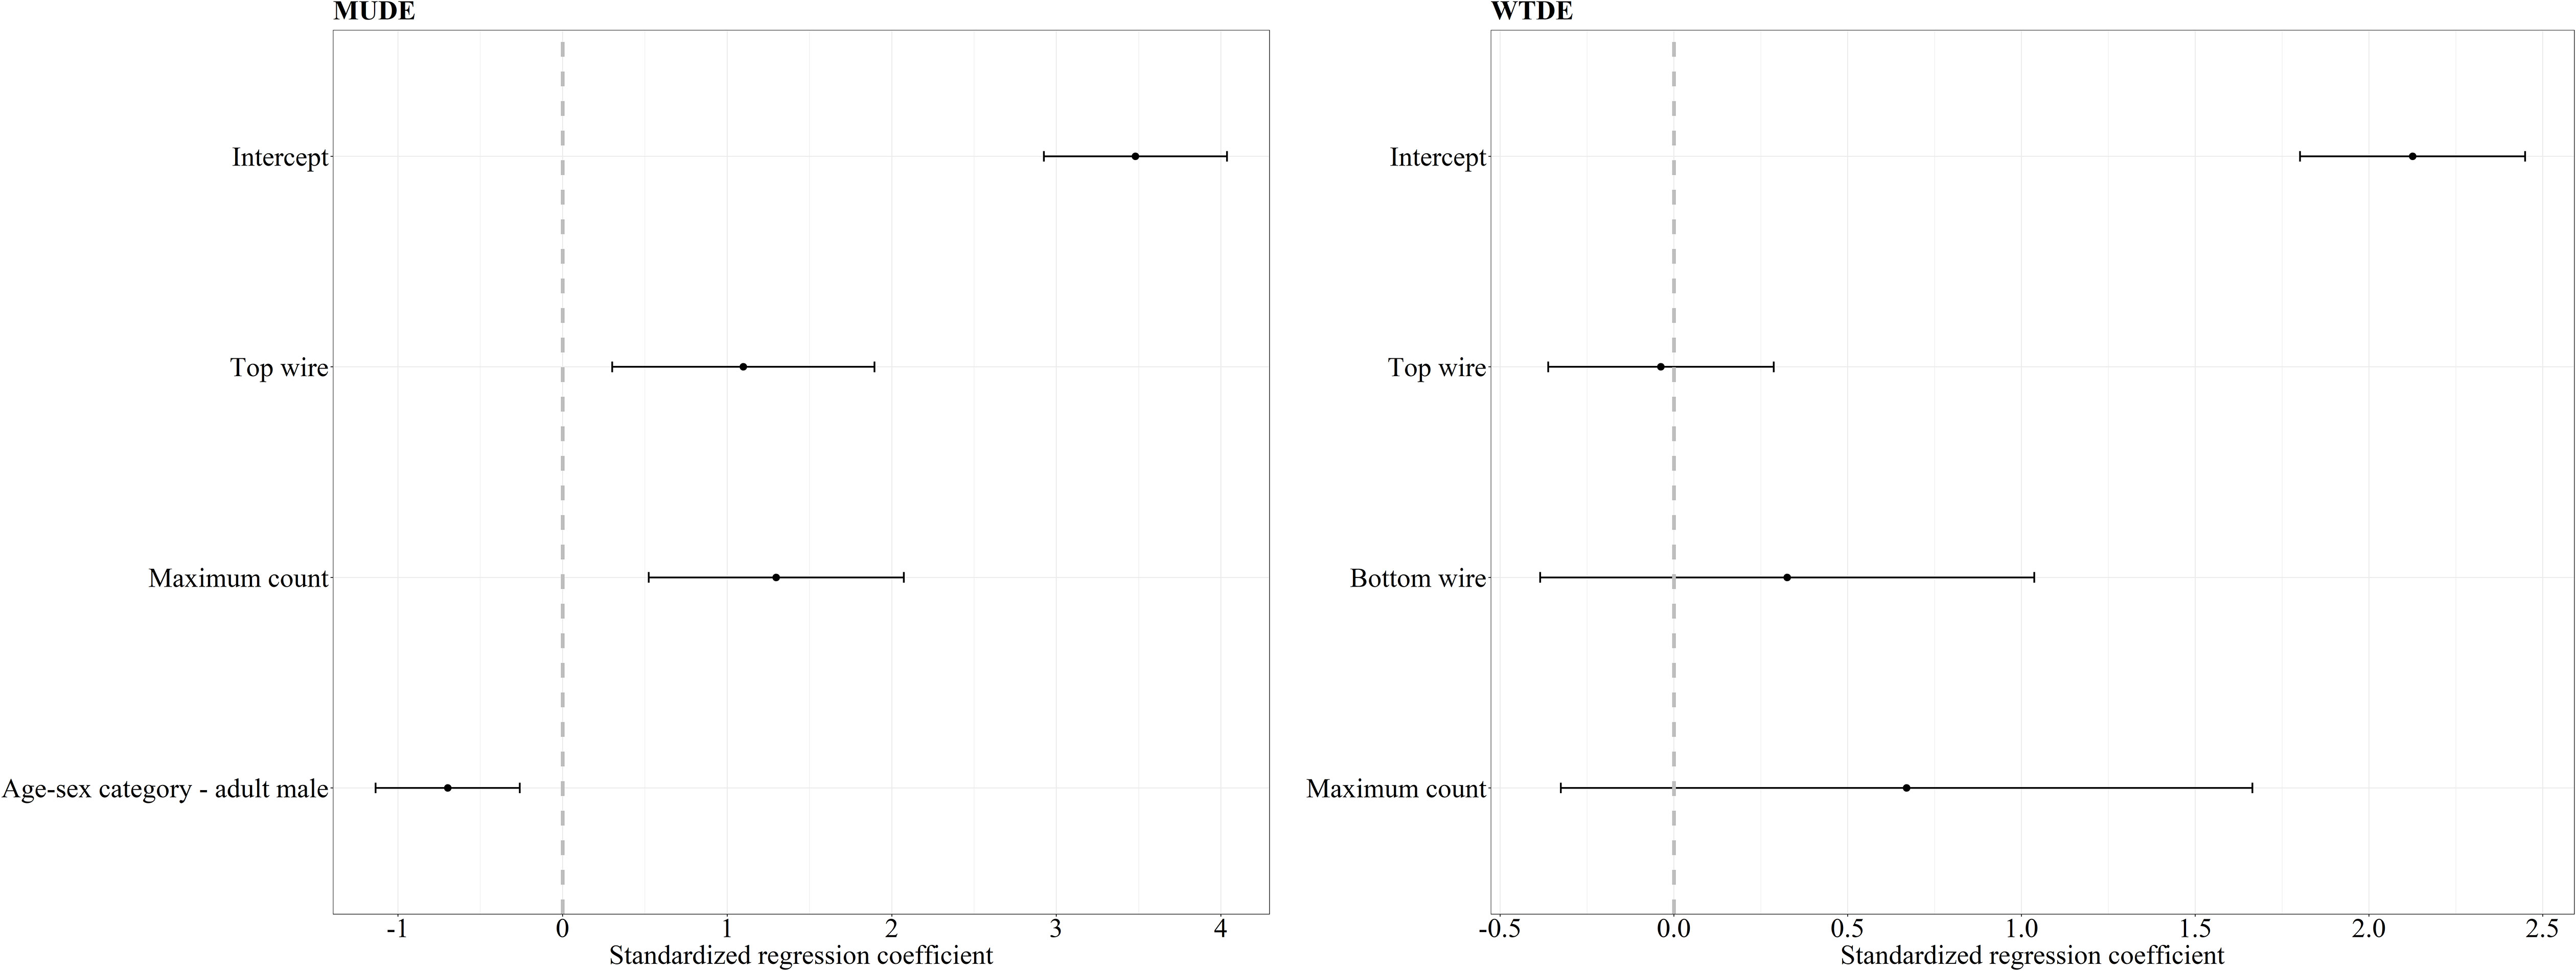
Figure 1 Standardized regression coefficients and 95% CI for the top models of crossing success of mule deer (MUDE) and white-tailed deer (WTDE). The regression coefficient for the white-tailed deer success was averaged between four competing models with ΔAICc < 2.0 whereas our mule deer mixed effects logistic regression resulted in one top model. We considered bottom wire height, area (reference category – AB), sex-age (reference category – adult female), maximum count, snow (reference category – absent), and treatment-period (reference category – control-before) as covariates in our mixed effects logistic regression analysis. Covariates whose 95% CI overlap 0 are considered noninformative.
For white-tailed deer, our mixed effects logistic regression resulted in four top models with ΔAICc < 2.0 and a combined weight of 76% (Table 1). The covariates bottom wire height, top wire height, and maximum count were retained in our top models. However, the regression coefficients for each variable CI overlapped 0 and therefore all covariates were considered noninformative for their influence on the crossing success of white-tailed deer (Figure 1). The performance of the top model was good with an ROC of 0.87.
Factors affecting deer crossing decisions
For mule deer, we documented 1,623 successful attempts of individual females and 293 successful attempts of individual males crossing under the fence. For the decision to cross under the fence, our mixed effects logistic regression resulted in two top models (ΔAICc < 2.0) with a weight of 100% (Table 2). The covariates bottom wire height, sex-age, and maximum count were retained in our top models (Figure 2). Our results show that as bottom wire height increased, the probability mule deer choosing to cross under the fence also increased (Figure 2). Our results also indicate that female mule deer were more likely to cross under the fence than males (Figure 2). Although retained in our top models, maximum count was determined to be a noninformative variable as the CI for the regression coefficient overlapped 0. The top model had excellent performance with a ROC of 0.93.
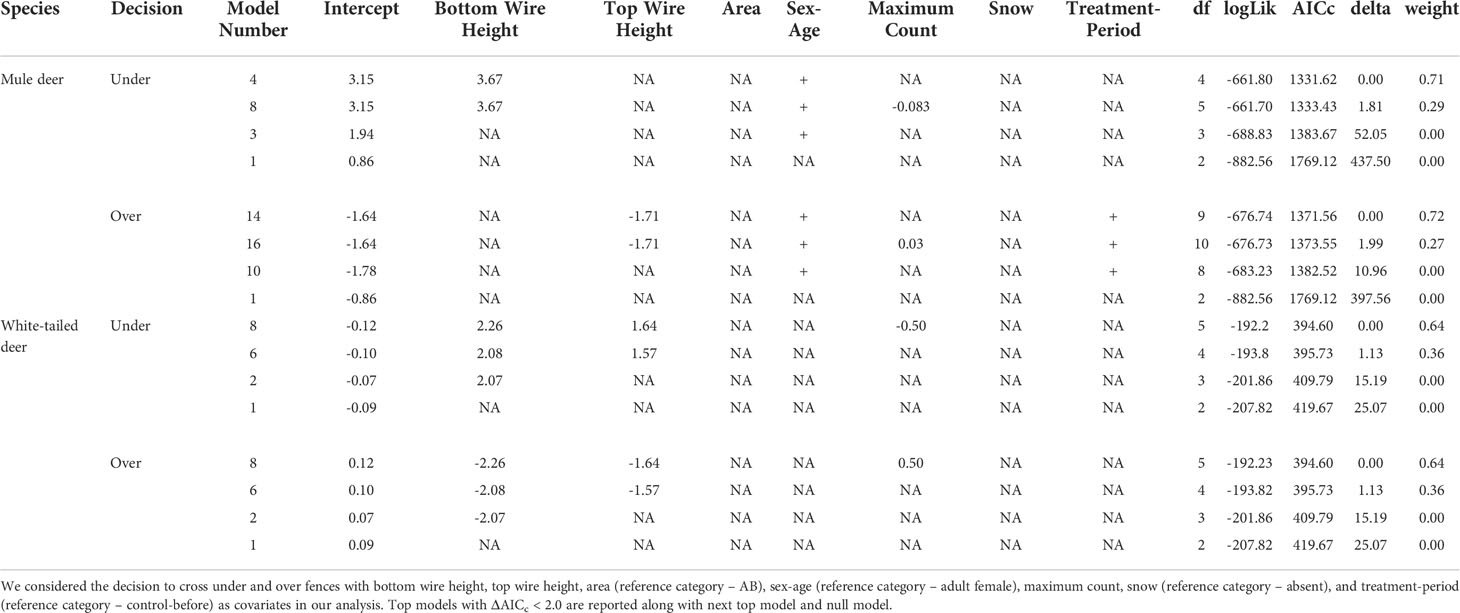
Table 2 Mixed effects logistic regression analysis results for factors affecting the crossing decision of mule deer and white-tailed deer.
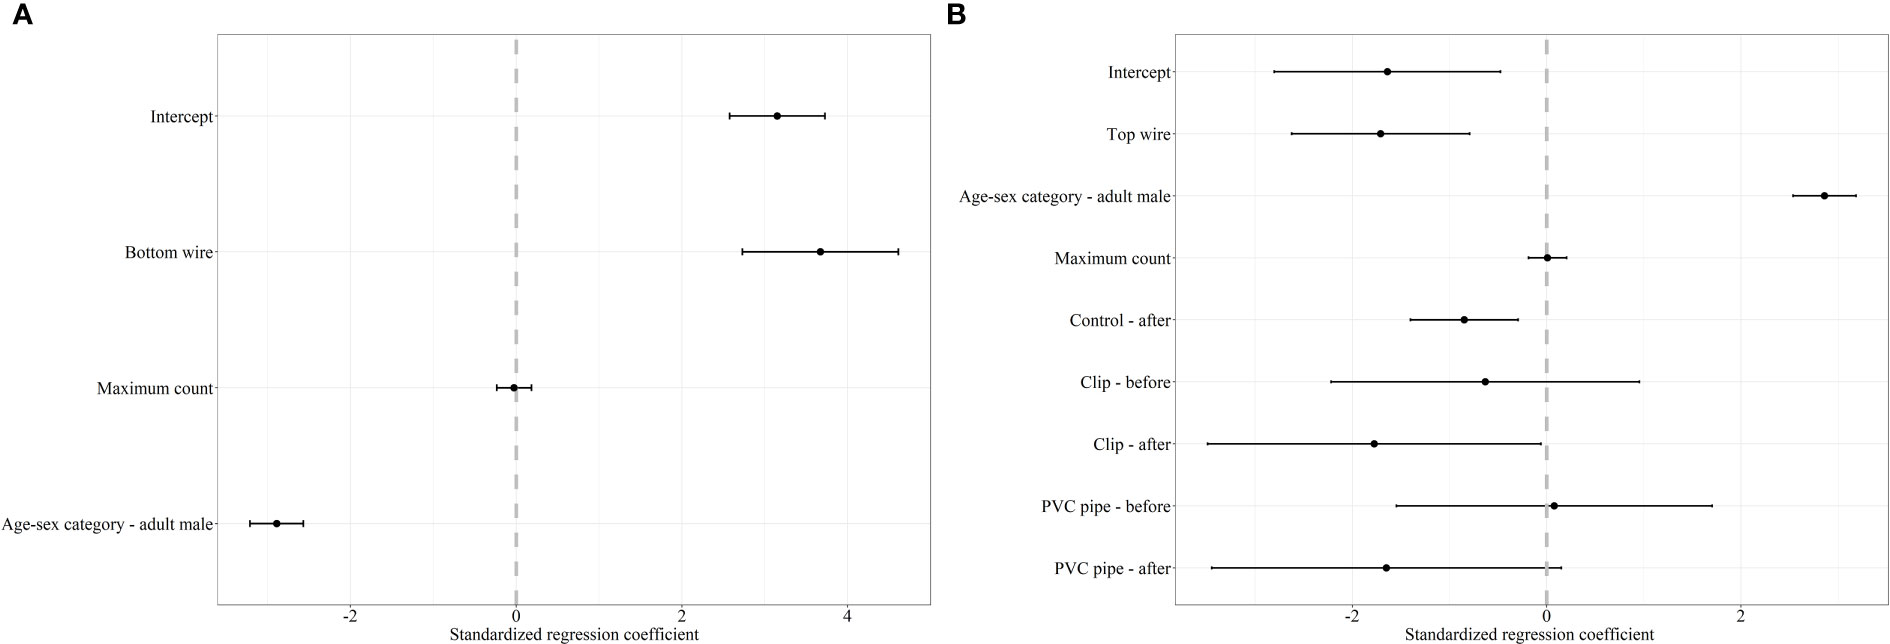
Figure 2 Standardized regression coefficients and 95% CI for the top model of the decision to cross under (A) and over (B) a fence by mule deer. The regression coefficient for the decision of mule deer to cross under and over was averaged between two competing models with ΔAICc < 2.0. We considered bottom wire height, top wire height, area (reference category – AB), sex-age (reference category – adult female), maximum count, snow (reference category – absent), and treatment-period (reference category – control-before) as covariates in our mixed effects logistic regression analysis. Covariates whose 95% CI overlap 0 are considered noninformative.
We recorded 182 and 297 instances of successfully crossing over the fence by female and male mule deer, respectively. Our mixed effects logistic regression for the decision to cross over the fence resulted in two top models with a weight of 99% (Table 2). The covariates top wire height, sex-age, maximum count, and treatment-period were retained the top models (Figure 2). As top wire height increased, the probability mule deer deciding to cross over the fence decreased (Figure 2). Male mule deer were also more likely to cross over the fence than females (Figure 2). The regression coefficients and their respective 95% CI for the treatment-period covariate categories control-after and clips-after were less than 0 indicating the probability of crossing over the fence decreased in comparison to the reference category control-before, while the categories clip-before, PVC pipe-before, and PVC pipe-after had their CI overlapped 0 indicating they were non-informative (Figure 2). The 95% CI for maximum count also overlapped 0, indicating the covariate was noninformative (Figure 2). The top model preformed excellent with a ROC of 0.93.
For white-tailed deer, we recorded 108 and 83 successful attempts of individuals crossing under the fence by females and males, respectively. Our mixed effects logistic regression for the factors influencing white-tailed deer to cross under the fence resulted in two top models with a weight of 100% (Table 2). The covariates bottom wire height, top wire height, and maximum count were retained in the top model (Figure 3). As bottom and top wire height increased the probability of white-tailed deer crossing under the fence increased (Figure 3). The 95% CI for maximum count overlapped 0 and was considered noninformative (Figure 3). The final models performed good with a ROC of 0.88.
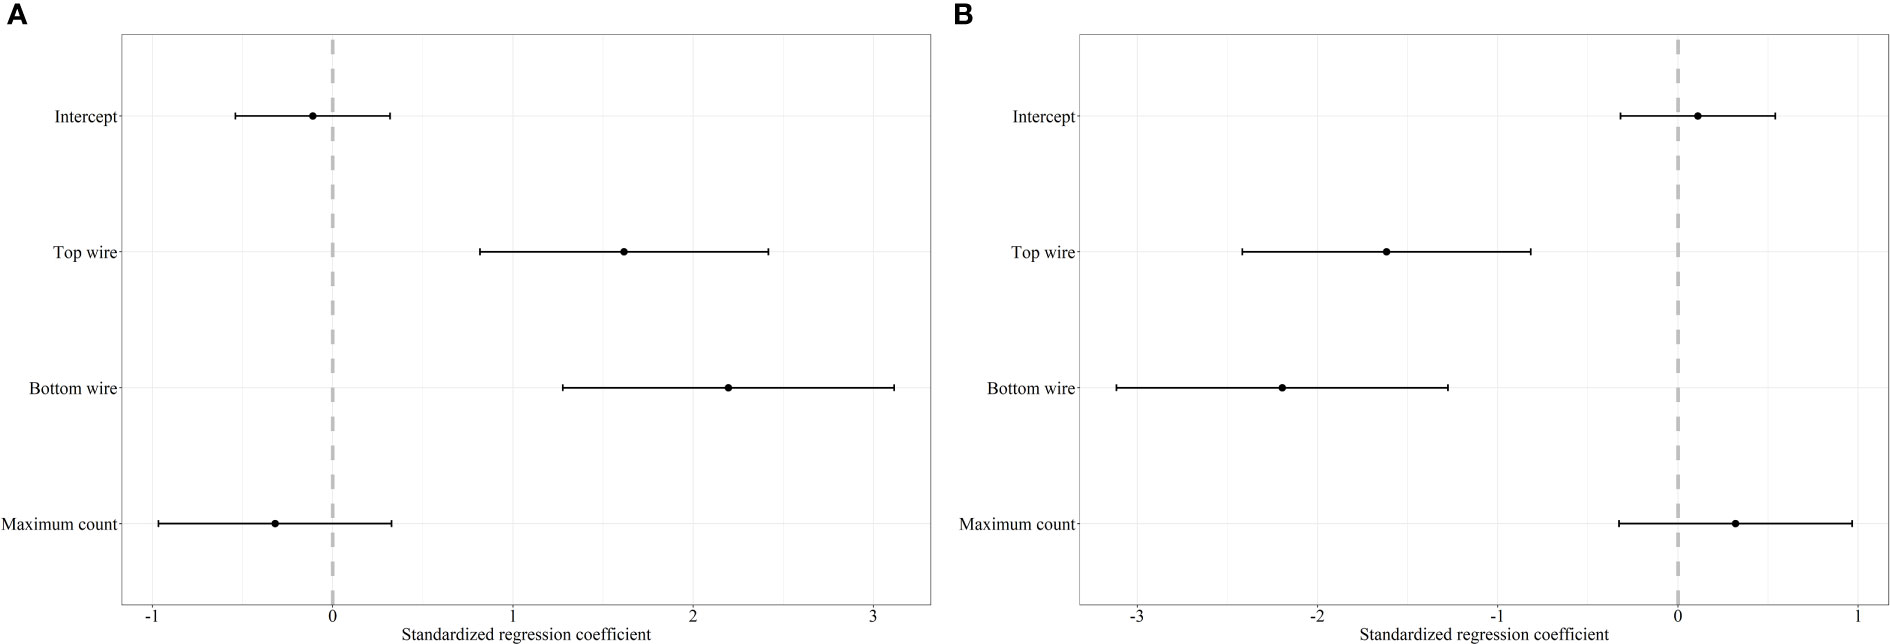
Figure 3 Standardized regression coefficients and 95% CI for the top models of the decision to cross under (A) and over (B) a fence white-tailed deer. The regression coefficient for the decision of mule deer to cross under and over was averaged between two competing models with ΔAICc < 2.0. We considered bottom wire height, top wire height, area (reference category – AB), sex-age (reference category – adult female), maximum count, snow (reference category – absent), and treatment-period (reference category – control-before) as covariates in our mixed effects logistic regression analysis. Covariates whose 95% CI overlap 0 are considered noninformative.
We documented 125 and 94 successful crossing attempts made by female and male white-tailed deer over the fence, respectively. Our mixed effects logistic regression resulted in two top models with a weight of 100% (Table 2). The covariates bottom wire height, top wire height and maximum count were retained in the top models (Figure 3). As both bottom and top wire height decreased, the probability white-tailed deer crossing over the fence decreased (Figure 3). The 95% CI for maximum count overlapped 0, indicating noninformative parameters (Figure 3). The top models performed good with a ROC of 0.83.
Wire height
Bottom wire height was influential in determining probability of crossing under and top wire height was influential in determining probability of crossing over for both deer species. A bottom wire height of 43 cm (17 inches) allowed for a 75% probability of female mule deer to cross under the fence, with the probability rising to 83% once bottom wire height reached 46 cm (18 inches; Figure 4). Male mule deer and white-tailed deer (both female and male) showed lower probability of crossing under the fence with a bottom wire height of 46 cm (18 inches), 22% and 41% respectively (Figures 4 and 5). Male mule deer and white-tailed deer did not show a 75% probability of crossing under the fence until bottom wire height reached 59 cm (23 inches) and 57 cm (22 inches), respectively (Figures 4 and 5). For female mule deer probability of crossing over the fence reached 75% when top wire height was 80 cm (31 inches; Figure 4). Probability of crossing over for female mule deer was low at the current top wire height recommendations of 102 cm (40 inches) to 107 cm (42 inches) at 39% to 30%, respectively (Figure 4). Male mule deer showed 75% probability of crossing over the fence when top wire height was 120 cm (47 inches; Figure 4). The current top wire height recommendations allowed for an 88% probability of crossing over at 107 cm (42 inches) and a 92% chance of crossing over the fence at 102 cm (40 inches; Figure 4). For white-tailed deer a top wire height of 102 cm (40 inches) allows for a 75% chance of crossing over the fence; however, the probability drops to 63% when the top wire is raised to 107 cm (42 inches; Figure 5).
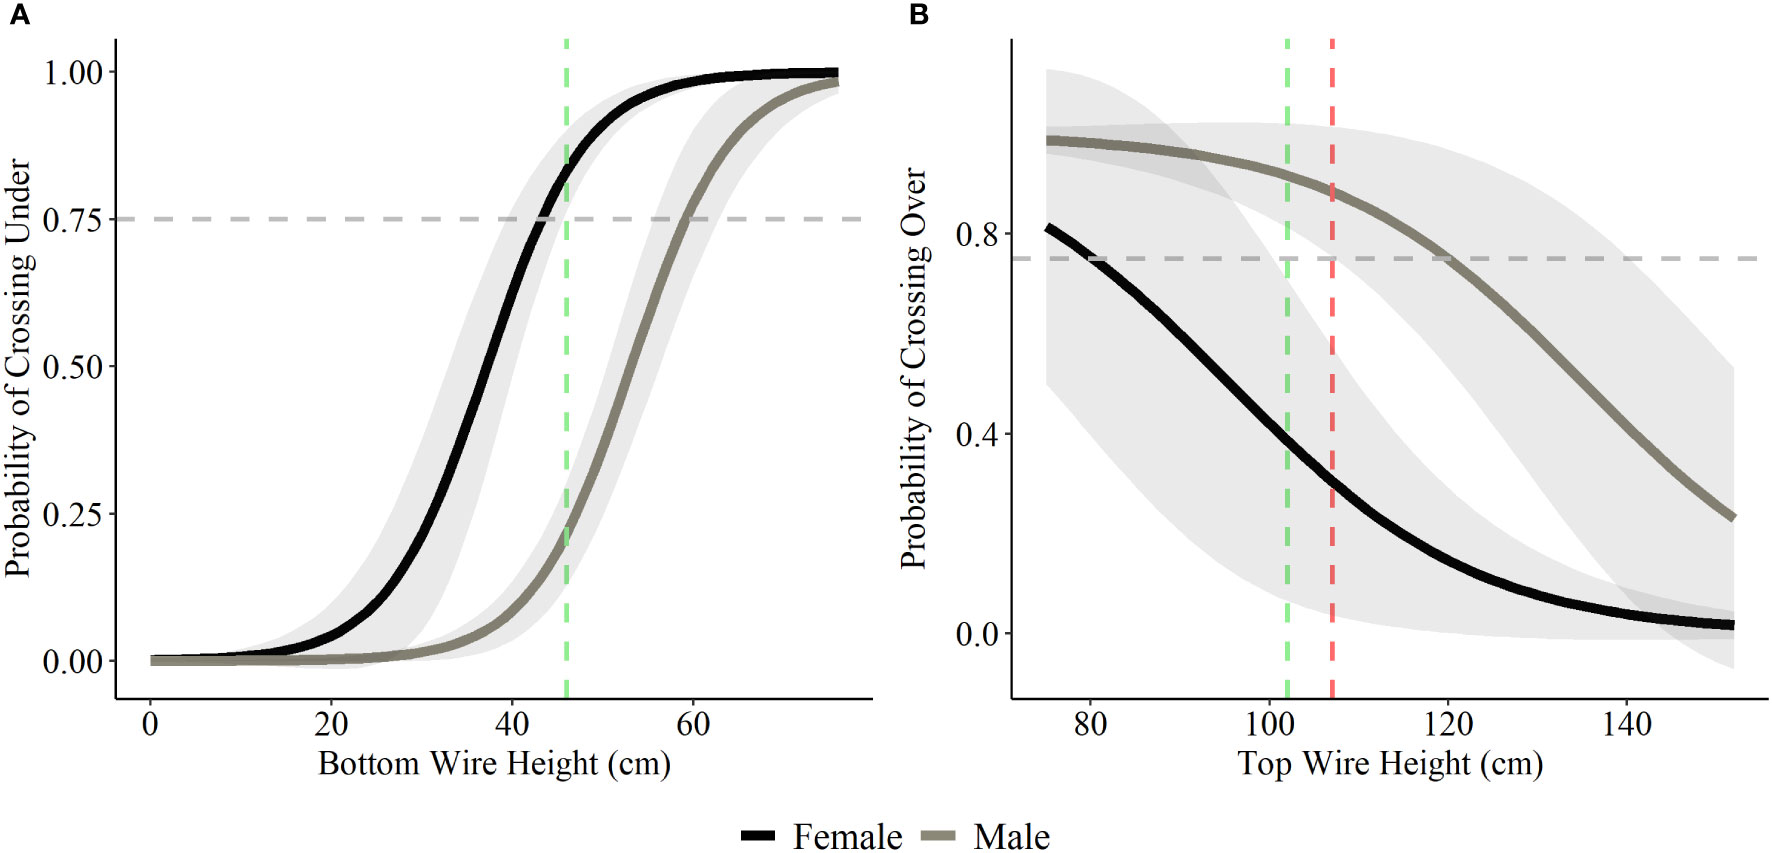
Figure 4 Probability of mule deer choosing to cross under (A) and over (B) fences based on a range of bottom and top wire heights. We display the current recommended bottom wire height of 46 cm (18 inches; green) and top wire heights of 102 cm (40 inches; green) and 107 (42 inches; red) as the coloured vertical dashed lines in each graph based on the recommendations for wildlife-friendlier fences (Paige, 2020). The horizontal grey dashed line represents the 75% probability of choosing to cross over or under the fence.
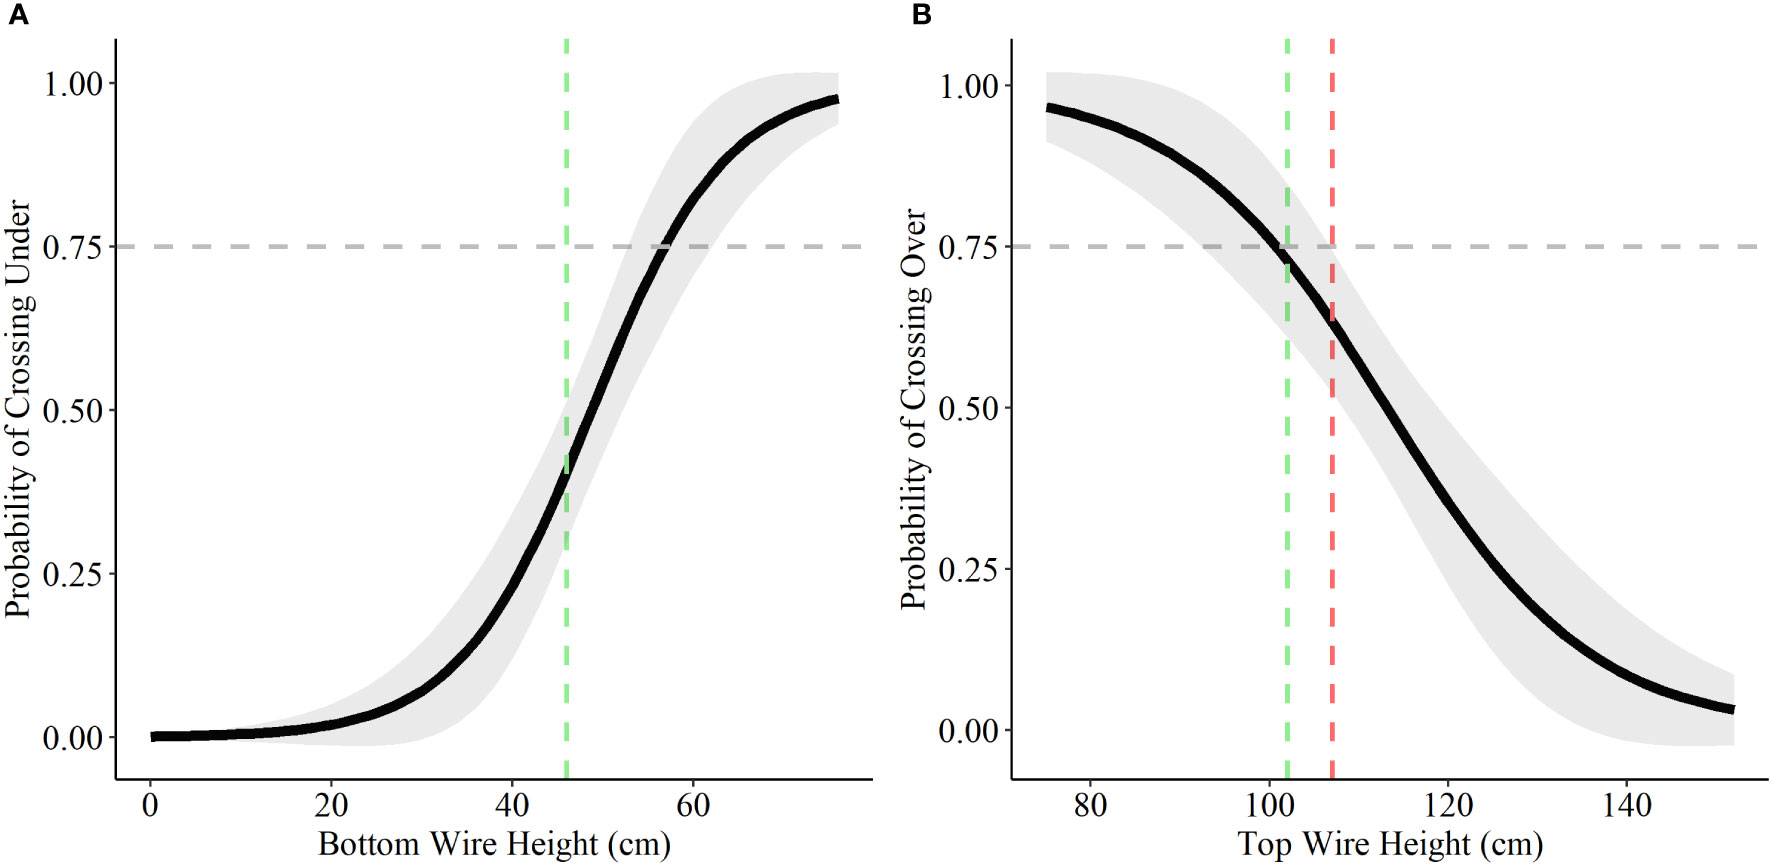
Figure 5 Probability of white-tailed deer choosing to cross under (A) and over (B) fences based on a range of bottom and top wire heights. We display the current recommended bottom wire height of 46 cm (18 inches; green) and top wire heights of 102 cm (40 inches; green) and 107 (42 inches; red) as the coloured vertical dashed lines in each graph based on the recommendations for wildlife-friendlier fences (Paige, 2020). The horizontal grey dashed line represents the 75% probability of choosing to cross over or under the fence.
Discussion
We attempted to assess the impact that two “wildlife-friendlier” fence designs had on the crossing behaviour of two sympatric ungulate species. We found that the use of clips and PVC pipe to lower the top wire tested during this study did not meaningfully impact the crossing success for mule deer or white-tailed deer. Similarly, the crossing decision of both deer species did not change after modifications were installed. These results are supported by previous research where fence modifications installed on just the top wire of tested fence panels did not impede crossing success and behavior for deer at know crossing location (Jones et al., 2020). Our prediction that the modifications would not impact the decision of how individual deer chose to cross fences was supported. Lastly bottom and top wire heights continued to be an influential factor impacting fence permeability for both deer species with results varying based on sex. Our results provide quantified preferred bottom and top wire heights for deer and demonstrate that these heights varied based on the species and sex of the individual. Our results support the recommend bottom wire height of 46 cm (18 inches) and top wire height of 102 cm (40 inches) to allow for a 75% probability of crossing over the fence, however; we caution the use of a 107 cm (42 inch) top wire height as this may not result in the desired fence permeability (Paige 2020).
Our results supported previous findings that mule deer predominantly choose to cross under fences (Jones et al., 2020; Laskin et al., 2020; Segar and Keane, 2020). This result was strongly influenced by adult females who consistently crossed under fences at the monitored known crossing sites. Adult male individuals were divided on their crossing decision having an equal probability of crossing under as compared to over. For those males that crossed under the fence, they did so at sites where the average bottom wire height was at least 58 cm (23 inches). The wildlife-friendlier fence bottom wire height recommendation of 46 cm (18 inches) (Jones et al., 2018), while sufficient for females (and likely fawns) to cross under, resulted in a probability of less than 22% of adult male mule deer choosing to cross under the fence, meaning they are jumping over fences to successfully cross. The recommended bottom wire height of 46 cm (18 inches) is too low for males to cross under likely because physical features such as antlers (when present) and larger body size (compared to females) limit their ability to crawl under fences. Antlers and large body size increase the likelihood of impinging on the bottom wire, deterring males from crossing underneath (Burkholder et al., 2018). Laskin et al. (2020) recommended fence designs with bottom wire raised to 80 cm (31 inches) would allow for a more robust solution to allow mule deer to cross under; however, this design has yet to be tested in its effectiveness to hold livestock. Our results suggest a bottom wire height of 59 cm (23 inches) would be sufficient to allow most (75% crossing probability) males to crawl under. While a 59–80 cm (23–31 inches) bottom wire height may not be suitable for some agricultural operations year-round, utilizing fence modifications such as fence clips or staples to temporarily raise the bottom wire, similar to how top wires were lowered in this study, can help ease crossings during sensitive times of the year and promote wildlife movement (Paige, 2020).
To our knowledge, previous recommended top wire heights for wildlife-friendlier fence designs are largely anecdotal with limited studies attempting to quantify this specification (Laskin et al., 2020). We found that the current maximum recommended top wire height of 102 cm (40 inches) is adequate to allow individuals of both deer species to cross over the fence, with the exception of female mule deer who we found would benefit with a 80 cm (31 inches) maximum top wire height. Our results also indicate as the top wire height reaches 115 cm (45 inches) or higher, that the probability of successfully jumping over the fence by either deer species dramatically drops off. Males, who are forced to jump over because of the presence of antlers, have a higher top wire height with the probability of jumping over dramatically decreasing at approximately 120 cm (47 inches). Given adult male mule deer’s apparent indecision in preferred crossing method (i.e., crossing over and under equally) fence designs which allow for successful passage over, but not under, may not be a comprehensive solution to reduce habitat fragmentation caused by fences. For this reason, we highlight the importance of incorporating wildlife-friendlier recommendations for both the bottom and top wire metrics of fences. Additionally, mortalities of mule deer and other ungulates due to fence entanglement is closely associated with animals who become entrapped while trying to jump fences, with the majority of mortalities being shown to occur at sites where the top wire height exceeds 100 cm (39 inches; Harrington and Conover, 2006). Consideration of placing PVC pipe on the top wires would eliminate the risk of barbs catching the legs of deer jumping over fences and therefore reduce the risk of entanglement resulting in injury or death.
We found that there was no difference between the response of female and male white-tailed deer in how successful they are at crossing fences and how they chose to complete those crossings. These results align with Laskin et al. (2020) findings that age-sex characteristics were not important in influencing how wildlife crossed; however, this contradicted previous findings within our study areas where white-tailed deer followed similar trends as mule deer in a divergence of success and crossing decision between sexes (Burkholder et al., 2018; Jones et al., 2020). Regardless of how age-sex characteristics play into the crossing behaviors of white-tailed deer, our study reinforces that fence specifications, largely surrounding wire heights, contribute greatly to the permeability of fences and habitat availability (Jones et al., 2019). White-tailed deer show adequate probability of choosing to cross over the fence at the current wildlife-friendlier fencing standards of 102–107 cm (40–42 inches), but would benefit more with the use of the former. Previously, fences designed to stop white-tailed deer from crossing (fence height 150 cm (59 inches)) have been shown to be ineffective because animals were capable of jumping upwards of 300 cm (118 inches; Vercauteren et al., 2010). While these numbers are impressive, our results show that a top wire height of 139 cm (55 inches) reduces the probability of white-tailed deer jumping over the fence to less than 10%. Our results suggest that even though white-tailed deer are capable of crossing fences at greater heights it is an infrequent occurrence (Burkholder et al., 2018; Jones et al., 2020; Laskin et al., 2020).
Mule deer and white-tailed deer demonstrate many similarities both physically and behaviorally as sympatric ungulate species; however, Burkholder et al. (2018) highlighted a contrast in fence crossing behavior between the species, as well as sex of individuals for both species collectively. We determined it was important to assess mule deer and white-tailed deer species independently of each other to gain a broader understanding of species-specific fence interactions. This allowed us to be species prescriptive in our recommendations for bottom and top wire heights. Additionally, it has been shown that mule deer and white-tailed deer exhibit different habitat preferences when utilizing similar geographic areas, likely based on the ability of the species to maneuver through different terrain (Staudenmaier et al., 2021). For example, mule deer selected areas with low overhead canopy which differed from white-tailed deer (Staudenmaier et al., 2021). Therefore, because white-tailed deer select areas with higher canopy cover, they may be more accustomed to jumping over obstacles (i.e., downed trees). These differing habitat preferences may translate into different behavioral responses to disturbances (i.e., fences) within similar habitat. Furthermore, differences in physical characteristics (i.e., body size, gaits) may explain differences in crossing behavior. For example, mule deer and white-tailed deer demonstrate different escape gaits in response to predation with mule deer utilizing a slower, stotting gait and white-tailed deer making use of a swift, running gait (Lingle and Pellis, 2002). While not formally addressed in our study it is likely the difference in crossing behavior is an effect of physical ability between the species. Logically, crossing under the fence from a slow, stiff gait would be less taxing than crossing over the fence, if bottom wire height allowed, explaining the propensity of female mule deer to cross under the fence. White-tailed deer would be more versatile in their crossing decision due to their agility and generally a smaller body size (Burkholder et al., 2018).
The modifications we tested showed no meaningful impact on the success of mule deer or white-tailed deer crossings. While this is not the result we predicted, we do not necessarily see it as a downfall in the use of modifications. Since our cameras were deployed at fence panels with proven crossing site fidelity, there is an inherently high success rate that can be expected (Burkholder et al., 2018). It is arguably more important that modifications did not deter success nor impede passage at these known crossing locations than increasing the overall probability of crossing success. The PVC pipe and clips still perform the basic goal of lowering top wire height and can be quickly installed to modify potentially hazardous sections of a fence (Paige, 2020). This can be important in instances of direct entanglement and mortality associated with fences largely occurs when limbs become entangled in the top two wires (Harrington and Conover, 2006). We did not capture any entanglement events on our cameras, but there were numerous instances observed where limbs of the animal crossing over the fence grazed the top wire creating the potential for entanglement. This shows that even though an animal successfully crossed, it may not have been an easy or low effort endeavor and lowering top wire height, through the means of modifications or overall fence design, can be advantageous. Therefore, we recommend the use of clips or PVC pipe to lower the top wire height for fences which currently exceed our maximum recommendation of 107 cm (42 inches).
We attempted to assess the effects of varying snow depths on the crossing success and decision by the two deer species under investigation. We used a measuring stick color coded into 15 cm (6 inch) segments attached to the fence post opposite of the camera. Unfortunately, we did not have enough varying snow depths to allow us to use the increment categories in our analysis. Instead, we had to truncate the snow data to presence/absence; however, this factor was not retained in any top model of our linear regression for either crossing success or crossing decision. Limitations to our study design likely contributed to the lack of events where snow would significantly influence crossing success or decision of deer species. Since camera triggers were limited to areas immediately surrounding the fence panel we would not capture instances where animals avoided these areas entirely if snow depths reached thresholds where movement would be inhibited. Therefore, our recommendations for bottom and top wire heights should be considered minimums and can change depending on the depth and type of snow present. Landowners and conservationist should consider using clips as a cost-effective method to further raise the bottom or lower the top wire when snow is present. Further research is required to assess variable snow conditions to determine when the depth of snow affects crossing success and decisions by deer.
Our study builds on our previous work to examine what factors allow for successful fence crossings by ungulates. Key to this work is understanding if we can modify existing fences to make them safer and more permeable for wildlife to cross, while maintaining their intended functionality. This research is intended to build on previous studies to ultimately contribute towards a multi-species fence design for use in open grasslands and sagebrush landscapes. However, further studies to evaluate the crossing needs of additional species found throughout the open grasslands and sagebrush habitats, such as elk, would be beneficial in developing a more robust standard for wildlife-friendlier fence designs. Moreover, expanding research on wildlife-friendlier fence designs in this way may allow for an evaluation on how body size impacts the effectiveness of fence designs. Body size was a parameter we did not include in our study but was an important factor impacting the crossing capabilities of ungulates in Kenya (Wilkison et al., 2021). While a universal wildlife-friendlier fence standard would be ideal, due to the diversity of fencing needs combined with differences in behavior between species coupled with individual responses to fences, continued evaluation of potential wildlife-friendlier fences designs is recommended.
Data availability statement
The raw data supporting the conclusions of this article will be made available by the authors, without undue reservation.
Ethics statement
We did not capture or handle any vertebrates. This was a passive camera trap study. Written informed consent for participation was not obtained from the owners because privately owned domestic livestock sporadically appear on cameras while grazing on private property for which we had permission to conduct our study. We had no interaction or control of livestock present.
Author contributions
AM, PJ, and AJ conceptualized and designed the study. AM, PJ, and JH conducted the field work. AM and PJ completed the photo processing and statistical analysis. All authors contributed to the article and approved the submitted version.
Funding
All field expenses and manpower were funded internally through Alberta Conservation Association and The Nature Conservancy. Cameras were provided as an extension of previous work and the following provided funds to purchase the cameras; Alberta Conservation Association, National Fish and Wildlife Foundation, Safari Club International—Northern Alberta and Billings Chapters.
Acknowledgments
We thank the following for their assistance in Alberta: T. Johns, M. Jokinen, and M. Neufeld; and in Montana: C. Messerly and J. Messerly. A thank you to B. Taylor at Canadian Forces Base Suffield for coordinating our access to the sites and putting up with our comings and goings. We thank J. Hasbani for the development of our custom database and continued technical support. Lastly, we thank Associate Editor Christoph F. J. Meyer and three reviewers for their comments and insights on an earlier draft, which greatly improved our paper.
Conflict of interest
The authors declare that the research was conducted in the absence of any commercial or financial relationships that could be construed as a potential conflict of interest.
Publisher’s note
All claims expressed in this article are solely those of the authors and do not necessarily represent those of their affiliated organizations, or those of the publisher, the editors and the reviewers. Any product that may be evaluated in this article, or claim that may be made by its manufacturer, is not guaranteed or endorsed by the publisher.
Supplementary material
The Supplementary Material for this article can be found online at: https://www.frontiersin.org/articles/10.3389/fcosc.2022.991765/full#supplementary-material
References
Arnold T. W. (2010). Uninformative parameters and model selection using akaike’s information criterion. J. Wildl. Manage 74, 1175–1178. doi: 10.1111/j.1937-2817.2010.tb01236.x
Bartlam-Brooks H. L. A., Bonyongo M. C., Harris S. (2011). Will reconnecting ecosystems allow long-distance mammal migrations to resume? a case study of a zebra Equus burchelli migration in Botswana. Oryx 45, 210–216. doi: 10.1017/S0030605310000414
Berger J. (2004). The last mile: how to sustain long-distance migration in mammals. Con. Bio. 18, 320–331. doi: 10.1111/j.1523-1739.2004.00548.x
Bolger D. T., Newmark W. D., Morrison T. A., Doak D. F. (2008). The need for integrative approaches to understand and conserve migratory ungulates. Ecol. Lett. 11, 63–77. doi: 10.1111/j.1461-0248.2007.01109.x
Boone R. B., Hobbs N. T. (2004). Lines around fragments: effects of fencing on large herbivores. Afr. J. Range For. Sci. 21, 147–158. doi: 10.2989/10220110409485847
Brooks M. E., Kristensen K., van Benthem K. J., Magnusson A., Berg C. W., Nielsen A., et al. (2017). glmmTMB balances speed and flexibility among packages for zero-inflated generalized linear mixed modeling. R J. 9 (2), 378–400. doi: 10.32614/RJ-2017-066
Burkholder E. N., Jakes A. F., Jones P. F., Hebblewhite M., Bishop C. J. (2018). To jump or not to jump: Mule deer and white-tailed deer fence crossing decisions. Wildl. Soc Bull.42 (3), 420–429. doi: 10.1002/wsb.898
Burnham K. P., Anderson D. R. (2002). Model selection and multi-model inference: A practical information-theoretic approach (New York, New York, USA: Springer-Verlag).
Cumming D. H. M., Osofsky S. A., Atkinson S. J., Atkinson M. W. (2015). “Beyond fences: wildlife, livestock and land use in southern Africa,” in One health: The theory and practice of integrated health approaches. Ed. Zinsstag J. (Wallingford, UK: CABI), 243–257. doi: 10.1079/9781780643410.0243
Fancy S. G., Pank L. F., Whitten K. R., Regelin W. L. (1989). Seasonal movements of caribou in arctic Alaska as determined by satellite. Can. J. Zool. 67, 644–650. doi: 10.1139/z89-093
Gelman A. (2008). Scaling regression inputs by dividing by two standard deviations. Stat. Med. 27, 2865–2873. doi: 10.1002/sim.3107
Grueber C. E., Nakagawa S., Laws R. J., Jamieson I. G. (2011). Multimodel inference in ecology and evolution: challenges and solutions. J. Evol. Biol. 24, 699–711. doi: 10.1111/j.1420-9101.2010.02210.x
Harrington J. L., Conover M. R. (2006). Characteristic of ungulate behavior and mortality associated with wire fences. Wildl. Soc Bull. 34, 1295–1305. doi: 10.2193/0091-7648(2006)34[1295:COUBAM]2.0.CO;2
Harris G., Thirgood S., Hopcraft J. G. C., Cromsigt J. P. G. M., Berger J. (2009). Global decline in aggregated migrations of large terrestrial mammals. Endanger. Species Res. 7, 55–76. doi: 10.3354/esr00173
Hosmer D. W., Lemeshow S. (2000). Applied logistic regression (New York, New York, USA: John Wiley and Sons).
Jakes A. F., Gates C. C., DeCesare N. J., Jones P. F., Goldberg J. F., Kunkel K., et al. (2018a). Classifying the migration behaviors of pronghorn on their northern range. J. Wildl. Manage. 82, 1229–1242. doi: 10.1002/jwmg.21485
Jakes A. F., Jones P. F., Paige L. C., Seidler R. G., Huijser M. P. (2018b). A fence runs through it: A call for greater attention to the influence of fences on wildlife and ecosystems. Biol. Conserv. 227, 310–318. doi: 10.1016/j.biocon.2018.09.026
Jesmer B. R., Merkle J. A., Goheen J. R., Aikens E. O., Beck J. L., Courtemanch A. B., et al. (2018). Is ungulate migration culturally transmitted? evidence of social learning from translocated animals. Science 361 (6406), 1023–1025. doi: 10.1126/science.aat0985
Jones P. F., Jakes A. F., Eacker D. R., Seward B. C., Hebblewhite M., Martin B. H. (2018). Evaluating responses by pronghorn to fence modifications across the northern great plains. Wildl. Soc. Bull. 42 (2), 225–236. doi: 10.1002/wsb.869
Jones P. F., Jakes A. F., MacDonald A. M., Hanlon J. A., Eacker D. R., Martin B. H., et al. (2020). Evaluating responses by sympatric ungulates to fence modifications across the northern great plains. Wildl. Soc. Bull. 44 (1), 130–141. doi: 10.1002/wsb.1067
Jones P. F., Jakes A. F., Telander A. C., Sawyer H., Martin B. H., Hebblewhite M. (2019). Fences reduce habitat for a partially migratory ungulate in the northern sagebrush steppe. Ecosphere 10 (7), e02782. doi: 10.1002/ecs2.2782
Kauffman M. J., Aikens E. O., Esmaeili S., Kaczensky P., Middleton A., Monteith K. L., et al. (2021). Causes, consequences, and conservation of ungulate migration. Ann.l Rev. Ecol. Evol. Syst. 52, 453–478. doi: 10.1146/annurev-ecolsys-012021-011516
Laskin D. N., Watt D., Whittington J., Heuer K. (2020). Designing a fence that enables free passage of wildlife while containing reintroduced bison: A multispecies evaluation. Wildlife Biol. 2020 (4), wlb.00751. doi: 10.2981/wlb.00751
Lingle S., Pellis S. (2002). Fight or flight? antipredator behavior and the escalation of coyote encounters with deer. Oecologia 131 (1), 154–164. doi: 10.1007/s00442-001-0858-4
McInturff A., Xu W., Wilkinson C. E., Dejid N., Brashares J. S. (2020). Fence ecology: Frameworks for understanding the ecological effects of fences. BioScience 70, 971–985. doi: 10.1093/biosci/biaa103
Moeller A. K., Lukacs P. M., Horne J. S. (2018). Three novel methods to estimate abundance of unmarked animals using remote cameras. Ecosphere 9 (8), e02331. doi: 10.1002/ecs2.2331
Paige C. (2020). Albert Landholder’s guide to wildlife friendly fencing (Sherwood Park, Alberta: Alberta Conservation Association), 68.
Robb B. S., Merkle J. A., Sawyer H., Beck J. L., Kauffman M. J. (2022). Nowhere to run: Semi-permeable barriers affect pronghorn space use. J. Wildl. Manage. 86, e22212 doi: 10.1002/jwmg.22212
RStudio Team (2021). RStudio: Integrated development environment for r. RStudio (Boston, MA: PBC). Available at: http://www.rstudio.com/.
Sawyer H., Kauffman M. J., Middleton A. D., Morrison T. A., Nielson R. M., Wyckoff T. B. (2013). A framework for understanding semi-permeable barrier effects on migratory ungulates. J. Appl. Ecol. 50, 68–78. doi: 10.1111/1365-2664.12013
Segar J., Keane A. (2020). Species and demographic responses to wildlife-friendly fencing on ungulate crossing success and behavior. Conser. Sci. Prac. 2, e285. doi: 10.1111/csp2.285
Staudenmaier A. R., Shipley L. A., Bibelnieks A. J., Camp M. J., Thornton D. H. (2021). Habitat use and spatio-temporal interactions of mule and white-tailed deer in an area of sympatry in NE Washington. Ecosphere 12 (11), e03813. doi: 10.1002/ecs2.3813
Tucker M. A., Böhning-Gaese K., Fagan W. F., Fryxell J. M., van Moorter B., Alberts S. C., et al. (2018). Moving in the anthropocene: Global reductions in terrestrial mammalian movements. Science 359, 466–469. doi: 10.1126/science.aam9712
Underwood A. J. (1994). On beyond BACI: sampling designs that might reliably detect environmental disturbances. Ecol. Appl. 4, 3–15. doi: 10.2307/1942110
van Aarde R. J., Pimm S. L., Guldemond R., Huang R., Maré C. (2021). The 2020 elephant die-off in Botswana. PeerJ 9, e10686. doi: 10.7717/peerj.10686
van Moorter B., Engen S., Fryxell J. M., Panzacchi M., Nilsen E. B., Mysterud A. (2020). Consequences of barriers and changing seasonality on population dynamics and harvest of migratory ungulates. Theor. Ecol. 13, 595–605. doi: 10.1007/s12080-020-00471-w
Vercauteren K. C., Vandeelen T. R., Lavelle M. J., Hall W. H. (2010). Assessment of abilities of white-tailed deer to jump fences. J. Wildl. Manage 74, 1378–1381. doi: 10.2193/2008-463
Wilkinson C. E., McInturff A., Kelly M., Brashares J. S. (2021). Quantifying wildlife responses to conservation fencing in East Africa. Biol. Conserv. 256, 109071. doi: 10.1016/j.biocon.2021.109071
Xu W., Dejid N., Herrmann V., Sawyer H., Middleton A. D. (2021). Barrier behaviour analysis (BaBA) reveals extensive effects of fencing on wide-ranging ungulates. J. Appl. Ecol. 58, 690–698. doi: 10.1111/1365-2664.13806
Keywords: fence modification, mule deer, Northern Great Plains, PVC pipe, white-tailed deer, clips
Citation: MacDonald AM, Jones PF, Hanlon JA, Martin BH and Jakes AF (2022) How did the deer cross the fence: An evaluation of wildlife-friendlier fence modifications to facilitate deer movement. Front. Conserv. Sci. 3:991765. doi: 10.3389/fcosc.2022.991765
Received: 11 July 2022; Accepted: 27 September 2022;
Published: 13 October 2022.
Edited by:
Christoph F. J. Meyer, University of Salford, United KingdomReviewed by:
Burt P. Kotler, Ben-Gurion University of the Negev, IsraelNicholas W. Pilfold, San Diego Zoo Institute for Conservation Research, United States
Wenjing Xu, University of California, Berkeley, United States
Copyright © 2022 MacDonald, Jones, Hanlon, Martin and Jakes. This is an open-access article distributed under the terms of the Creative Commons Attribution License (CC BY). The use, distribution or reproduction in other forums is permitted, provided the original author(s) and the copyright owner(s) are credited and that the original publication in this journal is cited, in accordance with accepted academic practice. No use, distribution or reproduction is permitted which does not comply with these terms.
*Correspondence: Amanda M. MacDonald, QW1hbmRhLk1hY0RvbmFsZEBhYi1jb25zZXJ2YXRpb24uY29t